chapter 5 learning process in kenyan garment industry: has
TRANSCRIPT

Kawakami ed., Repositioning Local Firms in Global Value Chains: Perspectives from East Asia and Africa, Chosakenkyu-Hokokusho, IDE-JETRO, 2008.
97
Chapter 5
Learning Process in Kenyan Garment Industry:
Has Technology Spilled over from FDI?
Takahiro Fukunishi*
Abstract Garment industry has been developed in many LDCs triggered by inflow of foreign direct investment (FDI), and it has contributed poverty reduction through providing employment. Lagging behind them, garment FDI has flown into sub-Saharan African countries since 2000, but the spillover of technology to local firms has been quite limited. Based on the interviews and original firm data, this paper attempts to demonstrate the learning process of Kenyan garment firms with focus on learning capacity and incentives. While uncertainty of the post-MFA market did not significantly affect local firm’s decision to start export products, relatively high leaning cost discouraged incentive to learn. Although they have capacity to learn, Kenyan garment firms need to perform much more efficiency than South Asian rivals due to the high wage, and then learning cost increased. Although the literature focuses on lack of learning capacity as a problem of technological development, this paper suggests that learning incentives is also important. Keywords Technology spillover, Learning, Manufacturing sector, Africa.

98
1. Introduction As the success of East Asian countries has shown, labour-intensive industry
led economic growth in the early stages of development, utilizing relatively low labour costs. Also, it has contributed poverty reduction through providing employment opportunities for unskilled and female worker (World Bank [1993]). The same growth process had occurred in Southeast Asia, South Asia, and Latin America, and it has even reached to the least developed countries (LDC) in Asia. Bangladesh, which used to be one of the poorest countries, now has an internationally competitive garment industry. More recently, Vietnam and Cambodia have also shown the rapid growth in garment exports since mid-1990s.
However, growth of labour-intensive industry has not been seen in sub-Saharan Africa yet except in Mauritius, and moreover, the manufacturing sector on the whole has been seriously stagnated except a few countries. Although there used to be focus on biased prices and excessive governmental intervention to the market in 1980s, the lack of firm’s capacity and poor business environment has become central research issues after the failure of the Structural Adjustment Program in Africa. The technological capability literature argues that manufacturing firms lack capacity to improve technology because skilled labour is extremely scarce in most of SSA, inflow of foreign direct investment (FDI), which compensates lack of local capacity, has been little, and technology policy to support capacity development was not effective (Pack [1993], Lall [1999], Biggs et al [1995]). The recent emergence of FDI in the African garment industry has provided an opportunity to examine the problems of capacity development. Assembly process of low-priced garment production which is technologically simple and heavily labour-intensive has been successfully developed in the LDCs, where firm’s capacity is poor and government support is not effective. Thus, it is regarded that with involvement of foreign firms, adoption of technology by local firm is relatively easy (Lall and Wignaraja [1994]). Unlike other LDCs, however, growth of local firms has been quite limited in Kenya, where one of the largest garment exporters to US market in Africa. Is it because of extreme lack of capacity of local firms, or are there other causes precluding adoption?
This paper attempts to demonstrate the learning process of local garment firms in Kenya. While there are a number of studies of technological capacity of African manufacturing firms, few studies have described the learning process of foreign technology by local firms although it is an important source of technological change. This paper describes the learning of local firms based on interviews and firm survey undertaken by the author, and then provides preliminary analysis of determinants of learning behavior, focusing on learning capacity and incentives of local firms.
Given the lack of census data of the garment industry, information in this paper is mainly based on our fieldwork, which created three sources of information. The

99
author conducted the garment firm survey as part of the research project of UNIDO COMPID project in collaboration with Institute of Development Studies (IDS), University of Nairobi in 2003. This survey covers 71 garment firms with more than 10 employees in the major cities. The same survey was conducted also in Bangladesh by Institute of Developing Economies (IDE) and University of Dhaka with 220 samples. The same series of survey was conducted again only in Kenya in 2005-6 by the author with cooperation of research staffs in IDS. While these surveys provide overview of the industry, the author also conducted interviews with garment firms, industrial association and government in order to investigate response of local firms to the emerged opportunity for export market. Interview was conducted in 2005 and 2006 for 33 firms, of which 5 firms are EPZ firms and 28 firms are locally owned.
In the next section, overview of the Kenyan garment industry is described including estimation of number of local exporters. Theoretical framework of spillover of foreign technology will be discussed as a basis of analysis of learning process in the third section. The fourth section describes the learning behavior of local firms including what and how they learned, followed by the analysis of the learning incentives in the fifth section. The last section concludes the discussion. 2. Garment Industry in Kenya 2.1 Overview
Until early 1990s when garment products were protected from imports, Kenyan garment industry was composed of many microfirms and most of them supplied to the domestic market. Census of Garment Industry in 1989 indicates that 97 % of garment firms including informal sector had less than 10 employees (cited in Ongile and McCormick [1996]). However, thanks to the protection and relatively rich technological base, there were several medium-size firms, which exported to East African countries and, with smaller volume, to EU.
Two drastic changes have hit Kenyan garment industry in the 1990s. Trade liberalization, which became effective after 1993, has brought the massive increase of imported products and consequently, the garment industry had shrinked (McCormick [1997], Wignaraja and Ikiara [1999]). Compared with 1991, production in 2000 is about half while imported value is about 9 times greater (Figure 1). Among them, second hand clothing is more rapidly increasing and has dominated the domestic market particularly for low and middle income class. Many firms, in particular those producing general garments, has shut down, and mainly producers of uniforms which do not compete with imports are still operating, though they are also shrinking production. In the survey conducted in 2003, we found that among firms with more than 10 employees, 166 firms have closed by 2003, while we confirmed only 105 operating firms in Nairobi, Mombasa, and Nakuru.
The other change has been brought by the enactment of African Growth

100
Opportunity Act (AGOA) in 2000. AGOA is a US domestic act to remove tariffs on broad range of products imported from SSA countries satisfying certain political and economic conditions, and it has designated 37 countries out of the 48 SSA countries. For textile and garment products, AGOA provides duty-free and quota-free access up to 7% of US imports. It has a distinctive feature in the rule of origin for garment products, which allows less developed beneficiary countries (LDBC) to use fabrics and yarn made in a third country1. This rule makes AGOA much more attractive than other preferential trade agreements such as the Cotonou Convention. This new trade scheme has made drastic impact on the African garment industry. Several African countries have been rapidly increasing garment exports to US market and in Kenya the export had grown by 600% between 1999 and 2004 (Figure 1).
Figure1. Garment Production, Exports and Imports
0
50
100
150
200
250
300
350
1990
1991
1992
1993
1994
1995
1996
1997
1998
1999
2000
2001
2002
2003
2004
2005
1976=100
0
50
100
150
200
250
300
350
400
mil US$
Export (Right Axis)
Import (Right Axis)
Production (Quantity Index, Left Axis)
Note: Imports includes secondhand clothing after 1997 when data become available. Production
index is dropped after 2000, because it is unlikely to cover EPZ production. Source: (production) Central Bureau of Statistics, Economic Survey, and Statistical Abstract
(Export and Import) UN Comtrade.
Rapid growth in exports is largely brought by the firms registered as Export Processing Zone (EPZ), which accounted for 85 % of exports to US in 2002. After enactment of AGOA, new investments in the garment industry have flown into EPZ, and in 2004, 30 garment firms produced 2.2 million US dollar, and employed 34600 workers (Table 1). They contributed 16% of the manufacturing exports and 16% of manufacturing employment in Kenya and have become one of the most important industries in the manufacturing sector despite the very short history. EPZ firms produce mainly low-priced basic wears on orders from U.S. buyers. All firms are foreign capital

101
from Middle East (Bahrain, UAE), South Asia (India, Sri Lanka) and East Asia, while some firms are joint venture with domestic capital. They use imported fabrics from East and South Asia, and hence only garment assembly process is located in Kenya.
EPZ firms differ with traditional non-EPZ firms in size, the market to which they supply and origin of capital. Table 2 indicates characteristics of two groups among the firms with more than 10 employees. Given the lack of reliable statistics of the non-EPZ firms, we made estimation based on our survey in 2003. It showed that non-EPZ firms are far smaller in size and production and less export-oriented than EPZ firms. MUB firms (Manufacturing under Bond), the export-oriented firm in non-EPZ sector, are relatively large but their average workers is about 1/3 of EPZ and the average production is less than 20%. EPZ firms have already surpassed the traditional garment firms in terms of employment and production.
The growth trend has disrupted in 2005 accorded with the termination of the Multi-fiber Agreement (MFA). Abolition of the export quota resulted in the massive increase of export from the competitive countries like China and India, and consequently export from Africa has dropped by 16%. Although the adverse effect was relatively small in Kenya (-0.8%) but the growth trend has been disappeared and several EPZ firms has been closed down.
Table1. Performance of Garment EPZ Firms 2000 2001 2002 2003 2004 2005 Number of Enterprises 6 17 30 35 30 25 Exports (US$ m) 30 55 104 146 221 195 Investment (US$ m) 16 48 88 128 108 132 Employment (Number) 5,565 12,002 25,288 36,348 34,614 34,234 Expatriates (Number) 235 314 701 912 837 Source: Export Processing Zones Authority [various issues]
Table2. Indicators of the Garment Industry in Kenya (2003)
Number of Firms
Employ- ment
Production(mil.Kshs)
Employment per firm
Average Value Added (mil. Kshs,
mil. $)
Share of Exporter(%)
Share of foreign
firm (%)
EPZ Firm 35 36348 11083 1038.5 851.5 (11.21) 100.0 100.0
Non EPZ Firm 120-150 8000- 9500
2200-2600 88.2 26.8
(0.35) 27.6 16.9
MuB Firm - - - 368.4 136.0 (1.79) 75.0 25.0
Source: Data on Employment per firm, Average Value Added, Share of Exporter, Share of Foreign Firm are from the firm survey. Data on number of firms, employment, and production of EPZ sector are from Export Processing Zones Authority [2004], and those of non-EPZ sector (shown in italic) are estimated from the firm survey in 2003.
102
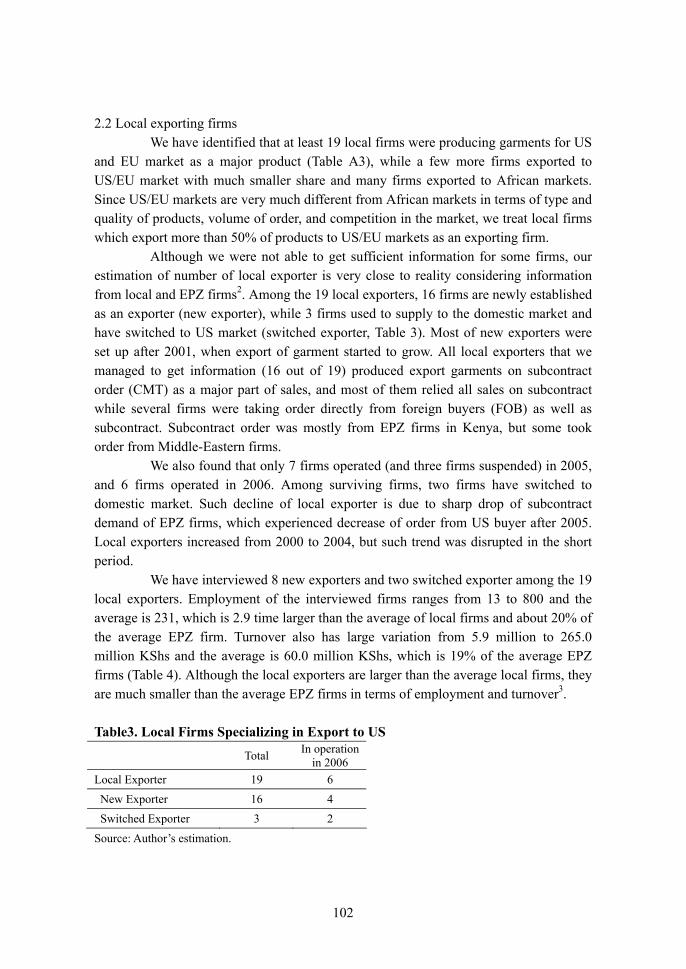
2.2 Local exporting firms We have identified that at least 19 local firms were producing garments for US
and EU market as a major product (Table A3), while a few more firms exported to US/EU market with much smaller share and many firms exported to African markets. Since US/EU markets are very much different from African markets in terms of type and quality of products, volume of order, and competition in the market, we treat local firms which export more than 50% of products to US/EU markets as an exporting firm.
Although we were not able to get sufficient information for some firms, our estimation of number of local exporter is very close to reality considering information from local and EPZ firms2. Among the 19 local exporters, 16 firms are newly established as an exporter (new exporter), while 3 firms used to supply to the domestic market and have switched to US market (switched exporter, Table 3). Most of new exporters were set up after 2001, when export of garment started to grow. All local exporters that we managed to get information (16 out of 19) produced export garments on subcontract order (CMT) as a major part of sales, and most of them relied all sales on subcontract while several firms were taking order directly from foreign buyers (FOB) as well as subcontract. Subcontract order was mostly from EPZ firms in Kenya, but some took order from Middle-Eastern firms.
We also found that only 7 firms operated (and three firms suspended) in 2005, and 6 firms operated in 2006. Among surviving firms, two firms have switched to domestic market. Such decline of local exporter is due to sharp drop of subcontract demand of EPZ firms, which experienced decrease of order from US buyer after 2005. Local exporters increased from 2000 to 2004, but such trend was disrupted in the short period.
We have interviewed 8 new exporters and two switched exporter among the 19 local exporters. Employment of the interviewed firms ranges from 13 to 800 and the average is 231, which is 2.9 time larger than the average of local firms and about 20% of the average EPZ firm. Turnover also has large variation from 5.9 million to 265.0 million KShs and the average is 60.0 million KShs, which is 19% of the average EPZ firms (Table 4). Although the local exporters are larger than the average local firms, they are much smaller than the average EPZ firms in terms of employment and turnover3.
Table3. Local Firms Specializing in Export to US
Total In operation in 2006
Local Exporter 19 6 New Exporter 16 4 Switched Exporter 3 2
Source: Author’s estimation.

103
Table4. Employment and Turnover Average
Employment Average Turnover
(million KSh) Local Exporter 231.1 (16) 60.0 (12)
Local Firm (2003) 78.5 (42) 42.9 (42)
EPZ Firm (2003) 1038.5 (30) 316.7 (30) Note: Figures of the local exporter not in operation are those when they operated. Figures in parenthesis
are number of samples. Source: (Local Exporter) Author’s Interview and the survey in 2005, (Local Firm) The survey in 2003,
(EPZ Firm) Export Processing Zones Authority [2004] Imitation of export business by local firms is surprisingly small in size and
poor in performance compared with the other garment exporting countries. Most impressive spillover was seen in Bangladesh, where 5 years after the first garment export to US market, about 700 local exporters were operating, although technology transfer was not through FDI but intensive training of local workers in Korea (Rhee and Belot [1989]) In Mauritius, FDI from Hong Kong first came in 1975 in scope of non-quota status in US market and the preferential trade agreement with EU, since then garment export has been expanding until recently. Following the emergence of FDI, local entrepreneurs, i.e. local sugar corporations, small business and even individuals, had invested in the garment industry and it is estimated to contribute more than 50% of the total investment (Bowman [1991]). In Sri Lanka, garment export was triggered by FDI mainly from East Asia in late 1970’s, but local firms also ventured into export and have recorded as good performance as foreign firms (Athukorala and Rajapatirana [2000]).
Inactive response by local firms can be accounted by the suspension of export growth after the termination of MFA. However, considering the impressive growth until 2004, participation of local firms to export market seems too small. The volume of FDI and the growth of garment export in Kenya was no less than that of other LDCs. Employment by EPZ firms in 2004 is as large as Mauritius in 1984 and larger than Sri Lanka in 1985, which is about 10 years after the start of export in both countries. The annual growth rate of export between 2000 and 2004 in Kenya is 58.5%, which is much faster than the growth rate in Mauritius from 1985 to 1990, 30.0%, when the fastest growth was recorded. Unless local firms and entrepreneur had felt sufficient uncertainty after 2005, more local exporters could have emerged to exploit the profit of the new growing business.
It is also notable that the newly established firms have been more positive for starting export business than the firms that has been operating before the FDI flow. Although there were about 120-150 garment firms with more then 10 employees in Kenya based on our estimation (Fukunishi [2005]), only 3 firms switched to export market. Those relatively old firms have experience in garment production and possess

104
capitals and workers, and some even have export experience. Despite such advantages, they are reluctant to start export. 3. Analytical Framework: FDI and Spillover to Local Firms 3.1 Theoretical Background
There used to be a simplistic view on technology transfer that firms in developing countries could imitate technology used in industrial countries without difficulties once technology was transferred to them. But it is now widely recognized that imitation requires substantial knowledge and costs. The technological capability approach argues that technology involves tacit elements which cannot be coded or embedded to equipment, and so, capacity to understand tacit elements is necessary to use technology4 (Nelson and Winter [1982]). It also argues that given substantial difference of environment between industrial and developing countries, i.e. infrastructure, factor prices, and government regulations, a firm in a developing country needs to adapt technology so that it exhibits full productivity under the environment of their location (Evenson and Westphal [1995]). Thus, a firm trying adoption needs to possess capacity to understand and adapt technology developed in industrial countries. Capacity is not limited to production knowledge, but includes ability to prepare, design, set up the investment project (investment capability), and ability to establish linkage with supplier and buyers (linkage capability). The endogenous growth theory also assumes that knowledge and human capital are necessary for local firms to imitate, and some models explicitly assume that accumulation of knowledge and human capital requires cost and effort (i.e. Barro and Sala-i-Martin [1997], Keller [1996]) while learning-by-doing model considers that they are by-product of production.
With complementarities of knowledge to technology use, firms in a country with poor knowledge may not be able to learn new technology without external support. Government intervention is one measure to increase initial knowledge enough to enable industry to adopt new technology. Inflow of FDI is also regarded as another form of the external support. FDI brings new technology together with experienced managers and skilled workers who possess knowledge of technology and market network. Knowledge can be transferred to local workers through training and experience in a foreign firm and to local firms through business transaction and movement of skilled workers (Keesing and Lall [1992] Navaretti et al. [2004]). Local workers may have a chance to see how business is carried out in foreign firms and how they adapt the technology to its location, and then, some of them move to a local firm or set up a new firm. Local firms will learn new technology, better management and market links by working with foreign firms (Egan and Mody [1992]). History of garment industry in many developing countries has evidenced that such transfer of knowledge is quite effective.

105
3.2 Firm’s Decision to Learn Even though inflow of FDI brings sufficient knowledge and it is accessible by
local firms, spillover of knowledge and technology may not always occur. With extremely poor capacity, local firms may not be able to learn new technology even if FDI brings knowledge as well as new technology. Learning incentive of local firms also determines extent of spillover. In one aspect, learning is investment in new technology (or even new business in case new technology leads to new market), where cost and return are crucial in decision (Easterly [2000], Lall [1999]). If cost excesses private return, local firms have no incentive to learn.
Return to learning is profits earned from garment exports. Firm’s expectation of return is formed by judgment of the competitiveness of Kenyan garments overall as well as profitability of export products. Growth of Kenyan garment export is important because, given the weak market link, a learning firm usually needs to rely on market network of foreign firms through subcontract or introduction of buyers, and so it will not grow without expansion of the industry as a whole. Given the sharp change in growth trend after 2005, perception of local firms before 2005 for future market trend needs to be carefully considered. Uncertainty is likely to lead to postponement of investment, when a firm can obtain better information in later periods (Dixit and Pindyck [1994]).
For estimation of profitability, production cost and output price will be most important basis, because in the low-priced standardized garment market, to which firms in developing countries supply, competition is more cost-driven than in the high-priced market, while quality matters less as long as it satisfies the required level (Lall and Wignaraja [1994]). Although lead time is getting more important recently reflecting the shorter production cycle5, most of local exporters operating as a subcontractor do not have to consider international logistics.
Variable cost is determined by factor costs and productivity, where low factor costs and high productivity lead to low production cost. Therefore, expected profitability is large (small) when factor costs are relatively low (high) to other exporters in Kenya and other countries. On the other hand, improvement of productivity entails learning cost and thus the relationship with profitability is not linear. This is discussed as learning cost later in this section.
As for fixed costs, given that export order requires larger volume, higher quality, and shorter lead time than domestic order, large number of machines and sometimes specialized machines, i.e. bottom hole stitching machine, are necessary. The empirical literature demonstrates that financial system has been poorly developed in most of African countries, and small enterprises face severe credit constraint (Nissanke and Aryeetey [1998]). Since new firms and small local firms need more physical investment and face high credit cost than existing and large firms, their fixed cost are likely to be larger.
Cost of learning stems from mastery and adaptation of technology. A firm that
106
tries to start export needs to employ a skilled engineer or professional consultant, train workers, design production line, identify buyers, check quality and make trial-and-error until it gets experience. Search cost of skilled engineer, training cost and foregone profit during trial-and-error are examples of learning cost. As extensively discussed in the literature, leaning costs is related to initial technical capacity of firm. A firm with skilled engineers, experience in export market or staffs who have experience in an exporting firm is likely to learn faster than a firm without such capacity. Also it is assumed that an existing firm can learn faster than a newly established firm because of richer experience in garment production.
One important part of adaptation is adjustment of capital-labour ratio (Pack [1987]). When a firm adopts certain technology, it needs to select the capital-labour ratio which matches with the wage-rental ratio. Such specific combination of capital and labour among many possibilities that certain technology embraces is sometimes called ‘technique’. When wage-rental ratio is different between home and investing countries, a multinational firm needs to adjust the technique so that it matches with the new relative factor prices. In figure 2, technology is depicted as the iso-quant curve Q and technique used in home country is B. Suppose that the wage-rental ratio at investing country (w/rI) is higher than one at home (w/rH), then the firm need to adjust the technique from B to A, since B is no more cost minimizing. Though this adaptation is primarily for an multinational firm, it is required also for imitating local firms, because relative factor prices may differ between foreign and local firms. Therefore, as gap of the wage-rental ratios between a country where technology is brought from and one where imitation is occurring becomes large, cost of learning increases.
Difficulty of mastery of technology is related to characteristics of technology, and factor prices determine the required degree of mastery. Degree of mastery affects productivity realization; higher mastery leads to higher productivity up to the potential productivity of the technology6. Since high productivity decreases unit cost through efficient use of factors, a firm trying to enter a competitive market must achieve the minimum productivity that realize the unit cost below market output price. Assuming a price-taker, the minimum productivity is determined by output price and factor prices, and under a common output price, such as international market, the minimum productivity level for individual firm differs according to factor prices. Figure 3 shows the relationship between average cost and masterly of technology. Average cost decreases as a firm utilizes technology better. We assume that degree of mastery does not affect quality of a product, or more realistically this relationship holds when controlling quality at the sufficient level. Country Y has lower factor prices than country X and thus average cost in Y is lower when the degree of mastery is same. Suppose that common international product price (p*) is given to both countries, the required mastery level to compete in the market for Y (MY) is lower than the one for X (MX)7. Conversely, if factor prices are relatively higher than other competitors, an imitator has to incur high

107
cost of imitation and it discourages to make investment in learning. From the theoretical perspective, inflow of FDI may facilitate spillover of new
technology to local firms. However, extremely poor capability of local firms may preclude local firms from learning and the following factors may spoil the incentive. 1) Negative expectation of Kenyan garments export, 2) uncertainty of market access, 3) relatively high factor prices, and 4) credit constraint will lower expected return, while 5) large gap of wage-rental ratio to the countries where technique is brought, 6) relatively high factor prices will increase cost of learning.
We have recognized that two important factor are not covered in the above framework; precision of estimation and externality of learning. Each firm estimates future market trend, cost of physical investment and learning costs based on their knowledge and experience. Some firms may have better knowledge of market trend if they have good network with other local firms, EPZ firms, foreign buyer or government officials. Experience in the garment industry is likely to produce precise estimation of profitability given output and input prices, while newly established firm may have too optimistic or pessimistic estimation. As argued by social learning literature, learning by one firm often has externality to other’s learning (learning from others). When crucial parameter of technology (in this case profitability) is unknown, firms have incentive to wait and observe other’s results. The literature suggested that structure of network, i.e. number of firms in network, observablility of other’s results and institutions to internalize externality, affects speed of adoption of technology, and some studies indicated that poor results in the first several cases may discourage firms from learning (Chamley [2004]).
Our analytical framework does not incorporate those factors. As for precision of estimate, our analysis focuses on the aggregative response of local firms rather than individual firm, and thus, unless distribution of estimated profitability by individual firm is biased (upward or downward), heterogeneity of precision does not matter for aggregative response. But we are not sure of distribution of estimation, so this is clearly a caveat of this study. Missed factors will be treated in the next version. Figure 2 Adaptation of Technology
A
B
w/rI
technique inhome country H
Optimal technique ininvesting country IK
L
Qw/rH

108
Figure 3 Mastery of Technology and Cost 4. Learning Process in Kenyan Garment Industry 4.1 What to be learned
Local firms that aim to start export have to learn mainly three aspects of business; production system, logistics control and marketing. The production process of export products is generally more divided than that of domestic products because of larger volume and shorter lead time. With highly divided production process, an operator concentrates on a single task, i.e. sewing only collar part, and uses more specialized machines, i.e. bottom hole stitching machine and CAD system, to speed up production. Production line should be designed for individual order according to a style, complexity of sewing and output per hour. Although quality requirement is relatively loose for low-priced garments, it is generally more stringent than those for domestic products. Cutting, sewing and finishing works have to satisfy the required level. Workers need skill to keep quality as well as to work efficiently in assembly line, while production manager should establish appropriate quality control system.
If a firm receives orders from foreign buyers, control of logistics is important given the strict delivery required for export products and long distance to the market. Particularly the Kenyan garment exporter has to take much care of logistics, because they import fabrics from Asia and custom clearance is regarded as inefficient and corrupted. Delay of delivery results in penalty of discounted price and risks future transaction. However, if a firm receives subcontract from a Kenyan exporter, they do not need to care about logistics.
Marketing is a barrier for local firms that have little experience in the international market. Garment markets in developed countries have been favoring more variety and frequent change of style, and to deal with this change retailers are creating strong networks with suppliers. Suppliers are required to produce with short lead time and deal with frequent change of products spec (Nordas [2004]). Retailers in most cases contract with firms called “full-package provider” which arranges manufacturers at all
P*
ACX
MY
AC, P
Mastery oftechnology
MX
ACY

109
steps of production around the world (UNCTAD [2002: Chapter V]). Garment manufacturing firms normally receives order from this agent, but new firms that have little transaction and small capacity are less likely to get order. Inspection and certificates by a buyer are usually needed. Subcontract is much more accessible, and most of new firms start as a subcontractor. However, subcontract is less profitable and volume of order is volatile because large firms place order only when they have orders over their capacity, and hence, marketing capacity will be necessary in a process of firm growth. 4.2 Transfer of knowledge and technology
Knowledge has been transferred to local firms mainly through movement of foreign skilled workers. In our samples, all new exporters recruited expatriates who used to work in EPZ firms. Expatriates are originally from South Asia, namely Sri Lanka, India and Bangladesh, and have working experience in home country as a floor-level worker. They are specialists of garment production and play an important role in EPZ firms in production administration; designing production line, training workers, and controlling product quality. After several years of work, they quit the EPZ firm and joined the new firms with Kenyan entrepreneurs.
Since the entrepreneurs do not have experience in garment export in most cases, the expatriates have provided almost all knowledge and technology necessary for garment exports. They planned production line, provided training to workers, and administrated entire production section. Furthermore, utilizing the network with EPZ firms that they developed in the previous job, they got orders from EPZ firms and sometimes from Middle East. Although the three entrepreneurs have experience in garment industry and the other four have run trade business, which has partly contributed to the new business, they recognized that they relied mostly on expatriate’s knowledge. Switched exporters are less reliant to expatriates. Firm A employed an UK retired engineer when it started UK exports in 1992, and has employed several Indian expatriates since 2000, but their role is limited to production and the owner developed marketing network by himself. Firm B does not have an expatriate, and the owner learned new technology in the training course held by his supplier8. Despite the predominance of Asian Kenyan in the garment industry, among 19 local exporters, the owners of 13 local exporters are African Kenyan, while those of 5 exporters are Asian Kenyan and one is European (Table A3)9. Information of technology and knowledge has prevailed beyond the business community formed by Asian. The workshops for investment of garment industry held by EPZ Authority provided information of investment opportunity to African Kenyan entrepreneurs. Some of them also got advice and referral of expatriates from the local exporter owned by African Kenyan (firm D in Table A3). Public and personal network worked for dissemination of

110
information. On the other hand, we have identified only one case (firm R) that local
workers in EPZ firm started a new exporting firm, which was quite common in other garment exporting countries as a form of spillover. The owner of firm R was a human resource manager of EPZ firm for three years and has no experience as a production worker. It is evidenced that EPZ firms provide on-the-job training, and some firms made a skill development plan; they started from technically simple products and then shifted gradually more complex products as workers gained skills for more than one year. However, we have seen no Kenyan staff working as a production manager in EPZ firm.
Subcontract with EPZ firms provided local exporters with knowledge and also time to learn. EPZ firms help local firms’ learning by providing instruction and showing their production line. Several local exporters explained that contacts with EPZ firms were main source of knowledge. Subcontract also reduces necessary knowledge and investment that required for local firms to start export. For example, marketing is the most serious problem for young firms with little network. In our samples, several local firms jointly participated in the textile trade show in US to seek contract with US buyers but it was not successful. Even if they successfully find a buyer, it needs to open the letter of credit to import fabrics, which is not easy for young firms. Purchase of material occasionally requires liquidity in case that collection of sales from buyer comes after payment to supplier. Local exporters recognized such problems, actually some of them did after they started subcontract, and were trying to develop their capability while taking subcontract. Although reliance on subcontract is not beneficial for the further growth, it enables young firms to start export business and learn necessary knowledge to compete in the international market.
Inflow of FDI has brought knowledge and technology of garment export to Kenya. They have been transferred to local firms, though relatively small scale, through movement of foreign skilled workers and subcontract from an EPZ firm to a local firm. Training and working experience in EPZ firm improved skill of local workers, which indirectly support the local exporters employing those who are trained in EPZ firms. Local exporters, particularly new exporters are fully benefited from spillover from FDI. 4.3 Learning Capacity
The cases of new exporters provide information of learning capacity of local firms. Owners of new exporters admitted that they have little knowledge of garment export business, but they also told that a serious problem was not brought when starting business. This suggests that knowledge brought by skilled expatriates was at least sufficient to start the business, and this is corresponded with the case of other garment exporting countries, where labour turnover facilitated spillover of technology. This means that most of local firms, even those who have little knowledge of export business, can absorb necessary technology and knowledge by hiring expatriates.

111
Interviews with local non-exporters revealed that 4 firms out of 18 firms were approached by EPZ firms for subcontracting, and 6 firms took action for subcontract (Table 5). The interviews also suggested that only three firms raised insufficient technical capacity as a reason not having started subcontract with EPZ firms. Based on above facts, it is reasonable to think most of local firms were capable to start export business in terms of technology and knowledge.
Note that ‘leaning capacity’ usually means that capacity to prepare and start new technology (and new business in this case), and in addition, to keep running technology efficiently. Fukunishi [2007] has measured technical efficiency of Kenyan and Bangladeshi garment firms and shown that Kenyan local firms are as efficient as Bangladeshi firms exporting to US/EU markets. Considering that most Kenyan local firms supply to the local market and all Bangladeshi firms export, the comparative study does not necessarily means that Kenyan local firms can efficiently produce for export market. However, it is an evidence that Kenyan local firms have good capacity to manage production system in general.
Most local firms did not make effort to find skilled expatriates that bring sufficient knowledge, and this implies that they are not motivated to start export. Several local firms do not see export business as profitable enough to switch. Learning incentive is another important factor of export decision.
5. Incentives of Learning 5.1 Expectation of return
Export of garments to the US market had become 6.3 times from 2000 to 2004 in Kenya, which must have brought positive expectation of the future growth to local firms that have suffered from the shrinking domestic market. However, there were significant uncertainties in the garment export business. One is about the rule of origin of AGOA. AGOA allows garments made from imported fabrics to be applied to non-duty. This is crucial condition for exporters in Africa to compete in US market, since African fabric costs much higher than Asian. The fact that almost all garments exported to US under AGOA use imported fabrics corroborates the importance of the preferential rule of origin. It was initially supposed to terminate in September 2004, while African governments were negotiating with US government for extension. Decision was not made until just before the termination date, and thus local firms as well as foreign firms had been under uncertainty of the future return. Local entrepreneurs noticed the uncertainty, and thus many of them started business after the extension decided in 2004. The other uncertainty was change of the international market after termination of MFA in January 2005. While many reports predicted large gain by China and India and loss by sub-Saharan African countries, possible restrictions on import of Chinese products by US and EU made prediction difficult. In 2003, managers of EPZ

112
firms in Kenya told that they were totally uncertain after 2005 and going to see what would happen10.
Six local non-exporters replied that they did not start subcontract, because it is risky (Table 5). However, the interview revealed that risk of market access was recognized by only one firm and other firms have more general impression that volume and price of export order is volatile. Furthermore, among non-exporters, all firms except one did not know the rule of origin of AGOA. These facts indicate that uncertainty of market access was not recognized as a major obstacle to start export business by local firms.
Table5. Reasons Not To Take CMT (multiple answers)
Attempted CMT*
Not attempted** Total
No offer from EPZ firms 2 4 6Current business is profitable 0 3 3Export market is not profitable 4 2 6Export market is risky 4 2 6Substantial physical investment is necessary 5 5 10Substantial training of workers is necessary 1 1 2Other
Products are different 0 3 3 6 12 18*: Those firms which attempted subcontract of EPZ (but not realized), **: Those firms which did not attempted. Source: Author’s interview
Table 5 also indicates that 6 firms regard export market is not profitable and 3
firms think that the current business is more profitable, and altogether, half of the interviewed firms thought export market was not attractive. Their poor evaluation comes from mainly output price; 8 firms replied that price is too low to make sufficient profitability (the rest one did not give a clear answer). The average wage of local firms is higher than the average of EPZ firms and the average of the South Asian countries (Table 6). Given the active union in Kenyan garment sector, however, cutting wage is not a feasible option. In fact, workers in EPZ firms fiercely struck for several months in 2003, demanding increase of wage in EPZ and participation in the union11.Then, given the current wage level, managers of local firms are aware that output price is too low to make profits.
In fact, the wages of all four local exporters are lower than those of non-exporting firms by 30% on average (Table 7). Those local exporters can offer lower wage, because they do not need wage cut. In contrast to the old local firms with

113
relatively high and rigid wage, the newly established firms have more favorable expectation of return and can be more positive to start garment export business. Table6. Average Wage of Operator
Average monthly wage (US$)
Kenya 69 (EPZ, 2003) 90 (local, 2003)
Bangladesh 56 (2003)
India 23-76 (2001)
Sri Lanka 51 (2000) Source: Kenya; Author’s survey in 2003, Bangladesh; Bangladesh Bureau of Statistics [2004], India
and Sri Lanka; ILO [2004]. Table7. Average Wage of Operator in Kenyan Local Firms (2005)
Monthly wage (KSh) N
Local Exporter 6536.8 11
Non-exporting Local Firm 8671.9 28
EPZ Firms 7826.9 11
Note: The above wages include the mandatory Housing Allowance but do not include bonus and overtime.
Source: (Local Exporter) Author’s interview, (Non-exporting and EPZ Firms) Firm survey in 2005. 5.2 Cost of learning
Adaptation efforts needed for technology absorption depends on a gap of the wage-rental ratios between Kenya and home countries of foreign firms. According to estimates based on 2003 survey (Fukunishi [2007: Table B]), Kenyan EPZ firms have higher wage and lower rental price than Bangladeshi firms, where many EPZ firms and expatriates come from South Asia, and thus, the gap of wage-rental ratio is substantial. Local firms have further higher wage but slightly higher rental price than EPZ firms, their wage-rental ratio is very similar to EPZ firms. Given the higher wage in Kenya than in Asia, more adaptation efforts are required for Kenyan exporters.
EPZ firms adapted technology to fit with factor prices in Kenya. Table 8 showed that the average capital-labour ratio of EPZ firms is higher than Bangladeshi firms. More precise calculation is done by measuring gap of actual and the cost-minimum allocation of factors (allocative efficiency) using 2003 survey data (Fukunishi [2007]). Although sample size of EPZ firms is small, the average impact of misallocation on cost is 6.9% larger for EPZ firms than Bangladeshi firms12. Given the large difference of wage-rental ratio, EPZ firms appear to have difficulty in adaptation.
Factor prices also affect the extent of mastery of technology. Given the wage level, Kenyan local exporting firms have to achieve higher productivity than South

114
Asian firms. Mastery of technology has been measured as technical efficiency which indicates ratio of actual production to the technically maximum production given factor inputs. Estimates using the 2003 survey data demonstrated that mastery of technology of EPZ firms is slightly lower but similar to the Bangladeshi firms on average, and thus, unit cost of EPZ firms is higher by 130% than that of Bangladeshi firms (Table 8). Conversely, we can obtain a rough estimation how much mastery of technology is required to have the same unit cost, where we assume that Bangladeshi unit cost is a benchmark of the export market. Based on the factor prices of EPZ and Bangladeshi firms, EPZ firms need to achieve 86.8% of the maximum production, while the average Bangladeshi firms achieved 51.6%13. Given that the actual production of EPZ was 48.6% of the maximum, this indicates that EPZ firms have to increase production by 78.6% on average without changing factor inputs. If we do the same calculation for local firms, they have to achieve 108.0% of the maximum, mainly because higher wage than EPZ firms. Clearly this is an overestimation, as African products are given duty free access to US/EU markets while Asian products including Bangladesh are imposed duty, and Bangladeshi firms have made large profit (Fukunishi et al. [2006]). However, it suggested how large the impact of factor prices on mastery of technology.
With less mastery of technology, EPZ firms have less profit or make loss. The 2003 survey showed that EPZ firms recorded relatively good profitability, but it is less than Bangladeshi firms (Table 8). Interviews with Kenyan EPZ firms indicate that firms are making various efforts to raise productivity. Some EPZ firms spent a year to shift from simple products to more complex products in order to increase skill of worker, some firms have regular meetings between workers and expatriates about sewing skills, and some provide bonus equivalent up to 25% of monthly wage for productive workers. Despite such efforts, EPZ firms are not satisfied with the performance of workers. These evidences indicated high leaning cost in Kenya.
Leaning cost is estimated to be much higher for local firms than for EPZ firms, since they are absolutely less experienced and pay higher wage than EPZ firms. Many non-exporting firms recognize that starting export is a drastic change of business style that requires managerial efforts to increase efficiency, maintain quality and control logistics. Although they can start new production line by hiring skilled expatriates, it does not necessary secure the required productivity14. Local non-exporting firms may have understood the difficulty of learning when they know the output price of export products. It is corresponded with the interview results that half of the firms raised poor profitability as a reason not to start export business.
In contrast, in many garment exporting countries, export started when wage of semi-skilled worker was very low. Even though workers were not skilled and management of firm was less experienced, they were able to compete in the international market because of the low factor costs. They were on ACY in figure 3. After the initial growth of export, wage started to increase accompanied by improvement in worker and

115
management skills15. This change corresponds to a shift from ACY to ACX. In contrast to them, Kenyan firms are on ACX from the beginning and thus higher mastery of technology is required to produce at the competitive cost. Table8. Cost of Production, Productivity, and Profit
Wage (US$)a
Rental price b
Capital- labour ratioc
Technical Efficiencyd
Unit Coste
Profit/Value Added
N
469.0 0.184 372.4 0.516 0.266 0.715 165 Bangladeshi Firms (225.6) (289.4) (0.189) (0.220) (0.228)
1064.7 0.144 618.6 0.486 0.620 0.481 5 Kenyan EPZ Firms (432.6) (575.5) (0.278) (0.606) (0.486)
1330.5 0.171 428.2 0.514 0.655 0.252 42 Kenyan Local Firms (688.3) (475.6) (0.170) (0.437) (0.502) Note: Standard deviations are in parentheses. a: Labour cost per worker. b: Rental price is estimated with normalizing asset price as 1, and thus, it does not have unit. c: Utilized capital value (US$) per worker. d: Figure ranges from 0 to 1, where perfectly efficient firm records 1. e: Cost per value added. Source: Fukunishi [2007]
5.4 Cost of physical investment
It is said that at least 150 sewing machines are necessary to start subcontract production with EPZ firms, and correspondingly, average number of sewing machines of local exporter is about 200 (Table 9). However, there is large variation, where the smallest firm has only 36 machines and the largest one has 550 machines. New exporters purchased all necessary equipment which includes washing machine, pressing machine and cutting machine as well as sewing machine when they started, while switched exporters added some equipment to existing ones. Physical investment including factory building (if purchased) is 14.9 million Ksh (about US$190,000) on average for new exporters (Table 9).
Investment is financed by mainly bank credit and profits of the business in the case of switched exporter, while owner’s assets, profit of other business (run by an owner), and debt from relatives are more common for the new exporters. Only three cases used bank credit among the new exporters. All the respondents of new exporter were able to borrow from private banks, but high interest rate (15-20% annual) discourages them to borrow for the business that they do not have substantial experience.

116
Table9. Physical Investment of Local Exporters Sewing
Machine Investment (mil Ksh) Source of Finance
Switched Exporter A 350 Bank credit, Profits of the firm B 42 5 Bank credit, Profits of the firm
New Exporter D 302 3-40 Bank Credit (Collateral) E 36 F 233 G 125
J 60 6 Credit from cooperatives, Profits of other business, Owner’s asset, Debt from relatives
K 139 12 Bank credit, Owner’s asset, Profits of other business
M 216 23.4 Owner’s asset, Profits of other business N 84 P 133 14 Investment by the foreign company Q 117 10.5 Bank credit, Owners’ and Family’s asset R 550 22.5 Owner’s asset, Debt from relatives S 250 5.5 Owner’s asset
Average 199.6 14.9 Note: The average of number of sewing machines does not include firm B in which sewing is minor
process. Source: Author’s interviews and the firm survey 2003.
Among the local non-exporting firms, 10 firms raised physical investment as
one of reasons not to start exports (Table 5). Though 11 firms have used bank credit or can use at least 5 million Ksh, they are unwilling to borrow for investment due to high interest rate. The other 3 firms always avoid borrowing because of high interest rate. Only 3 firms, all very small firms, clearly faced credit constraint. Except very small firms, local firms refrained from investment in export business not because of credit unavailability but high interest rates.
However, real interest rate in Kenya is not more expensive than those in South Asia, and accordingly, as shown earlier, estimates of rental price of capital do not differ among Kenya, Bangladeshi and India very much (Table 8). From this comparison, credit constraint does not clearly account for limited participation of local firms to the export market in Kenya. 5.3 Incentive of local firms
The rapidly growing export to US market was an alternative market for local firms suffering from the sharp decline of domestic sales, and many local firms have considered exporting through subcontract from EPZ firms. Although there was

117
uncertainty in market access around 2005, it was not a reason for local firms to refrain from starting export, though they had more general uncertainties to the unknown export market. More important factors are profitability. Given the high wage, export market will bring very small or negative profit without drastic improvement of productivity, which requires large learning costs for Kenyan local firms. Local firms may not recognize precise amount of learning cost, but they were able to understand necessity of significant change in production is necessary for export business when they heard output price and volume of subcontract order.
There is no clear evidence that credit constraint adversely affect investment decision of local firms. Except very small firms, local firms are able to borrow from bank in no worse conditions in comparison with South Asia. The firm owners’ claims against the high interest rate can be understood that it is too high considering profitability of export business.
Our analysis investigated background of the limited response to export opportunity in Kenyan local firms, but it does not account for heterogeneity of response among the firms. The switched exporters seem to have stronger incentive for export business. They have experience of export to US/EU markets before starting subcontract, and so, know export business and have necessary equipment. Leaning cost and physical investment can be smaller than other firms. There are mixed evidences for incentive of the new exporters. They may have better estimation of profitability, since they can offer lower wage than existing local firms and many of them can avoid borrowing from financial institution charging high interest rate. However, their learning cost is likely to be higher given the lack of experience in garment industry. Their lack of experience may also affect evaluation of profitability, which may lead to optimistic evaluation in export business. To understand the heterogeneous response of local firms, we need to know individual firm’s evaluation of profitability, and how the estimation was formed. These are left for further study. 6. Conclusion
The poor capacity of firms has attracted attention of researchers as a structural cause of the long stagnation of the manufacturing sector in sub-Saharan Africa. It is argued that firms can not improve technology due to poor capacity, and in contrast to the other developing countries, development of capacity has been discouraged by the poor education, lack of effective technology policy and little inflow of manufacturing FDI. However, investigation of the learning process of Kenyan garment firms suggested that relatively high factor prices significantly increased learning cost and then accordingly reduced learning incentives of local firms, while given simple technology of garment assembly process, many local firms have capacity to learn.
Although many literatures indicate that wage in Africa is lower than other developing countries, Kenyan wage is not lower than South Asian countries that are

118
rivals in the market as well as source of technology16. Then, to compete in the international market, high mastery of technology is required despite little experience, and Kenyan local firms have to incur large learning cost during the prolonged period of try-and-errors. High learning costs have discouraged the investment in new technology, and the significant reduction of exports after 2005 has completely deprived export opportunity of the local firms.
Analysis of incentives in this paper, however, is still preliminary. It does not investigate the heterogeneous response to the export opportunity of local firms. Individual firms have different evaluation of profitability and uncertainty of the export market according to their experience, technical capacity and linkage with other firms. Given the ethnicity-based firm network in Kenya, the fact that majority of the local exporters were owned by African implies importance of the firm network. We found that information of export business circulated among the owner of new exporters, and thus, the social learning approach needs to be incorporated in the analysis.
Historical experience shows that development of labour-intensive industry has led technology development in broad industries and it has provided a basis of industrialization. Failure of learning in the entry industry may have precluded the industrialization in Africa.

119
Appendix 1 Summary of the Firm Interview
Firm interview was conducted in September-October 2005 and November-December 2006 for 33 garment firms and Kenyan Manufacturing Associations, Ministry of Industry and Trade, Custom office and Export Processing Zones Authority. Interviewed firms comprised of 5 EPZ firms, 10 local exporting firms and 18 local non-exporting firms, where exporting firm is defined as a firm with more than 50% of production is exported to US/EU markets (Table A1). In 2006 interview, sample was randomly selected from the firm list we have created in 2005 firm survey, and then, three firms interviewed in 2005 were visited again. Characteristics of the interviewed firms are described in Table A2. Table A1. Interviewed Firms 2005 2006 Total EPZ firm 5 0 5 Local Firm 7 24 28* Exporting Firm 4 8 10* Non-Exporting Firm 3 16 18* 12 24 33* *: Three local firms are interviewed both in 2005 and 2006.

120
Table A2. Interviewed Firms
Year started Operation Process Employment Sales
(mil Ksh) Sewing machine
1 1999 Sewing 10 1.2 7 2 1985 Sewing 237 82 113 3 1977 Sewing 275 40 180 4 1996 Sewing 8 2.1 6 5 1994 Sewing 50 23 30 6 1996 Sewing 13 1.1-2.4 13 7 1968 Sewing 225 100 8 1975 Sewing 25 5 20
9 1982 Spinning, Weaving, Knitting, Sewing 700 678 21
10 1963 Weaving, Knitting, Sewing 350 265 121
11 1990 Sewing 13 22 12 1981 Sewing 35 27.5 100 13 2003 Sewing 80 40 90 14 1998 Sewing 63 85.6 50 15 1978 Sewing 50 50 88 16 1978 Weaving, Sewing 77 50 30 17 1996 Sewing 124 71.2 91 18 1987 Sewing 145 180 104
19 1989 Printing, Sandblasting 175 36.1 42
20 1972 Sewing 800 265.2 350
21 2004 Sewing 270 34.0 133 22 2005 Sewing 170 110 23 2005 Sewing 340 34.1 550
24 2004 Sewing 45(230*) 18.5 139
25 2004 Sewing 70 6.5 60 26 2006 Sewing 180 na 225 27 1997 Sewing 347 56.2 302 28 2004 Sewing 233 17.8 216
Average of non-Exporter (1-18) 137.8 100.1 65.9
Average of Exporter (19-28) 281.5 58.55 212.7
Note: Information of the firms stopped operation indicates record when firms were operated. *: Information in the parenthesis is when it was taking CMT (This firm has shifted to the local market
after 2005).

121
Market Investment since 2000 (mil Ksh)
Bank Credit use**
Ethnicity of Owner Interviewed
Kenya 100% 0.16 0 African 2006 Kenya 100% 9 0 Asian 2006 Kenya 60%, Africa 35%, UK 5% 10 1 Asian 2006 Kenya 100% 0.23 0 African 2006 Kenya 80%, Africa 20% 1.7 0 Asian 2006 Kenya 100% 0.04 0 African 2006 Kenya 100% >3.5 1 Asian 2006 Kenya 100% 0 Asian 2006 Kenya 60%, Africa 40% 0 Asian 2006
Kenya 99%, UK 1% >0 1 Asian 2005, 06
Kenya 100% 0 African 2006 Kenya 100% 0 Asian 2006 Kenya 80%, Africa 20% 0 1 Asian 2006 Kenya 100% >0 0 Asian 2006 Kenya 100% 0 Asian 2006 Kenya 80%, Africa 20%, EU<1% 16 1 Asian 2006 Kenya 90%, EU10% 0.436 0 European 2005 Kenya 90%, EAC10% 0 Asian 2005 USA 61%, UK Swiss 11%, Kenya 28% 5 0 European 2006
USA 17%, EU 26%, EAC 43%, Local 15% >0 1 Asian 2006
USA 100% 14 0 African 2005, 06 USA 50%, EU 50% 10.5 1 African 2005, 06 USA 100% 22.5 0 African 2006 Local, Mauritania, Burkina Faso (USA 100%*) 12 1 African 2006
USA 6 0 African 2006 USA 95%, Japan 5% 5.5 0 African 2006 USA 100% 3-40 1 African 2005 USA 100% 23.4 0 African 2005
122
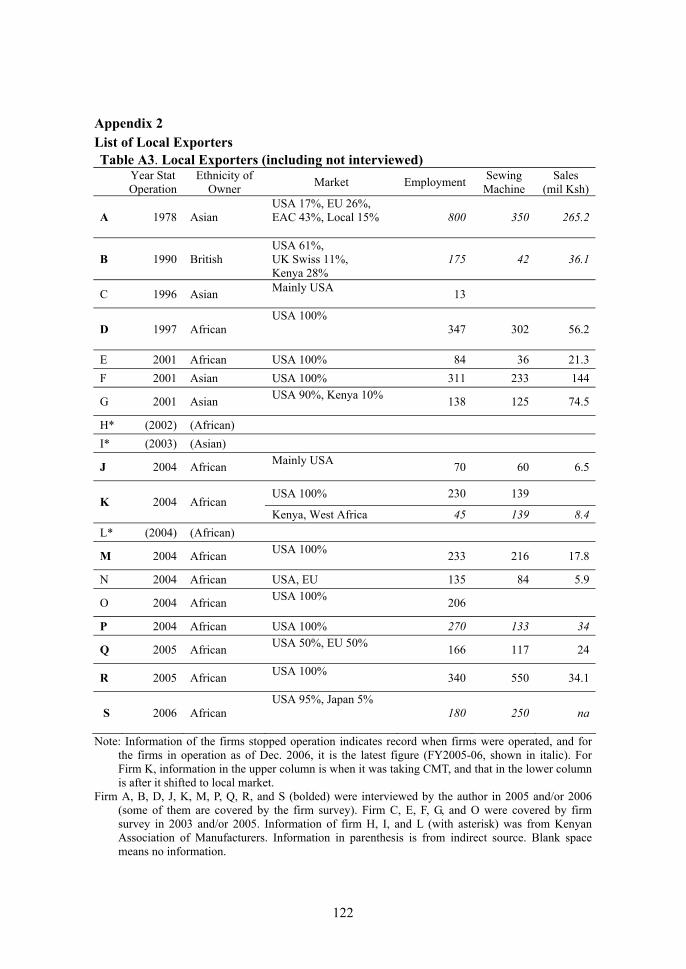
Appendix 2 List of Local Exporters Table A3. Local Exporters (including not interviewed)
Year Stat Operation
Ethnicity of Owner Market Employment Sewing
Machine Sales
(mil Ksh)
A 1978 Asian USA 17%, EU 26%, EAC 43%, Local 15%
800 350 265.2
B 1990 British USA 61%, UK Swiss 11%, Kenya 28%
175 42 36.1
C 1996 Asian Mainly USA 13
D 1997 African USA 100%
347 302 56.2
E 2001 African USA 100% 84 36 21.3 F 2001 Asian USA 100% 311 233 144
G 2001 Asian USA 90%, Kenya 10% 138 125 74.5
H* (2002) (African) I* (2003) (Asian)
J 2004 African Mainly USA 70 60 6.5
USA 100% 230 139 K 2004 African
Kenya, West Africa 45 139 8.4 L* (2004) (African)
M 2004 African USA 100% 233 216 17.8
N 2004 African USA, EU 135 84 5.9
O 2004 African USA 100% 206
P 2004 African USA 100% 270 133 34
Q 2005 African USA 50%, EU 50% 166 117 24
R 2005 African USA 100% 340 550 34.1
S 2006 African USA 95%, Japan 5%
180 250 na
Note: Information of the firms stopped operation indicates record when firms were operated, and for the firms in operation as of Dec. 2006, it is the latest figure (FY2005-06, shown in italic). For Firm K, information in the upper column is when it was taking CMT, and that in the lower column is after it shifted to local market.
Firm A, B, D, J, K, M, P, Q, R, and S (bolded) were interviewed by the author in 2005 and/or 2006 (some of them are covered by the firm survey). Firm C, E, F, G, and O were covered by firm survey in 2003 and/or 2005. Information of firm H, I, and L (with asterisk) was from Kenyan Association of Manufacturers. Information in parenthesis is from indirect source. Blank space means no information.

123
Nationality of Expatriate
Operation Status (as of Dec 2006)
Previous Occupation of Owner
Note
India, UK in operation Working in the same company
Started UK export in 1992, US export in 2002
No expatriate in operation Textile trader in West Africa
Started US export in 2004
(Closed 04/05) Started US export in 2003
Bangladesh, Sri Lanka
in operation [mainly domestic]
Garment firm
Closed 04/05
Closed 04/05
Closed 04/05 Garment firm [relative of a local firm owner]
(Closed 04/05)
(Closed 04/05)
Sri Lanka Closed 06 Textile trading, Min of Defense
India
in operation [mainly domestic]
Owner of supermarket, Banker
Sri Lanka (Closed 04/05)
Sri Lanka Closed 06 Cargo business in East Africa
Closed 06
Closed 06 (wife of former president)
Sri Lanka in operation Shoes trading business
Sri Lanka Closed 06 Horticulture trading, Min of Treasury
India Closed 06 HR manager of EPZ, HR manager of bank
Took over firm O
India in operation Min of Local Government, Engineering consultant
Took over firm M

124
Appendix 3 Firm Survey 2003 Firm surveys were jointly conducted with the Institute of Developing Economies, the Institute of Development Studies, University of Nairobi, and the Institute of Business Administration, University of Dhaka in 2003. The Kenya survey began with construction of a firm list since there is no comprehensive firm list. Integrating several incomplete lists, including lists compiled by the Central Bureau of Statistics, the Investment Promotion Center, the Export Processing Zones Authority, the Kenyan Association of Manufacturers and the Institute of Development Studies, an extensive firm list containing 322 firms with more than 10 employees in Nairobi, Mombasa, Nakuru, Thika and Eldoret was constructed. Because this list includes firms that had closed down, all firms in the list were contacted and interviews were conducted with those still in operation. They survey collected information of 71 firms out of 104 firms in operation. Neither the population nor characteristics of the remaining 33 firms were known, it is difficult to determine whether our samples have bias or not except that responses from EPZ firm were less than other firms. In the Bangladesh survey, samples were selected from a member list of the Bangladesh Garment Manufacturers and Exporters Association (BGMA) using a stratified sampling method. Another industrial association, the Bangladesh Knitwear Manufacturers and Exporters Association (BKMEA), which is mainly constituted by knit wear producers, was not included in order to retain accordance with the Kenyan sample that was mainly composed of woven wear producers. Among 2891 members, data was collected from 222 firms. For detail of the sampling procedure, see Fukunishi et al. [2006]. Table A4. Average Output and Input by Group
Gross output
(1000US$)
Value added
(1000US$)
Number of workers
Capital value
(1000US$)
Profit/VA N
2977.7 1554.1 535.2 121.1 0.715 Bangladeshi Firms (2247.7) (1261.5) (250.7) (85.1) (0.228)
165
549.8 261.5 78.5 45.2 0.252 Kenyan Local Firms (1115.5) (720.3) (161.5) (91.0) (0.502)
42
13800.0 8739.4 892.4 716.8 0.481 Kenyan EPZ Firms (21100.0) (15100.0) (376.9) (809.8) (0.486)
5
Note: Standard deviations are in the parentheses. Source: Fukunishi [2007].
125
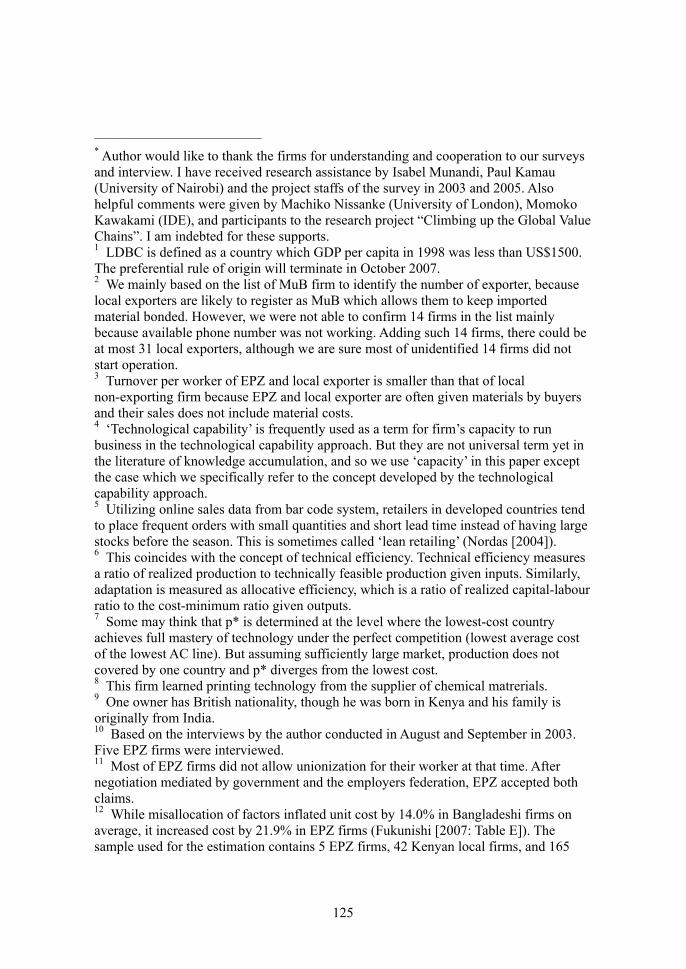
―――――――――――― * Author would like to thank the firms for understanding and cooperation to our surveys and interview. I have received research assistance by Isabel Munandi, Paul Kamau (University of Nairobi) and the project staffs of the survey in 2003 and 2005. Also helpful comments were given by Machiko Nissanke (University of London), Momoko Kawakami (IDE), and participants to the research project “Climbing up the Global Value Chains”. I am indebted for these supports. 1 LDBC is defined as a country which GDP per capita in 1998 was less than US$1500. The preferential rule of origin will terminate in October 2007. 2 We mainly based on the list of MuB firm to identify the number of exporter, because local exporters are likely to register as MuB which allows them to keep imported material bonded. However, we were not able to confirm 14 firms in the list mainly because available phone number was not working. Adding such 14 firms, there could be at most 31 local exporters, although we are sure most of unidentified 14 firms did not start operation. 3 Turnover per worker of EPZ and local exporter is smaller than that of local non-exporting firm because EPZ and local exporter are often given materials by buyers and their sales does not include material costs. 4 ‘Technological capability’ is frequently used as a term for firm’s capacity to run business in the technological capability approach. But they are not universal term yet in the literature of knowledge accumulation, and so we use ‘capacity’ in this paper except the case which we specifically refer to the concept developed by the technological capability approach. 5 Utilizing online sales data from bar code system, retailers in developed countries tend to place frequent orders with small quantities and short lead time instead of having large stocks before the season. This is sometimes called ‘lean retailing’ (Nordas [2004]). 6 This coincides with the concept of technical efficiency. Technical efficiency measures a ratio of realized production to technically feasible production given inputs. Similarly, adaptation is measured as allocative efficiency, which is a ratio of realized capital-labour ratio to the cost-minimum ratio given outputs. 7 Some may think that p* is determined at the level where the lowest-cost country achieves full mastery of technology under the perfect competition (lowest average cost of the lowest AC line). But assuming sufficiently large market, production does not covered by one country and p* diverges from the lowest cost. 8 This firm learned printing technology from the supplier of chemical matrerials. 9 One owner has British nationality, though he was born in Kenya and his family is originally from India. 10 Based on the interviews by the author conducted in August and September in 2003. Five EPZ firms were interviewed. 11 Most of EPZ firms did not allow unionization for their worker at that time. After negotiation mediated by government and the employers federation, EPZ accepted both claims. 12 While misallocation of factors inflated unit cost by 14.0% in Bangladeshi firms on average, it increased cost by 21.9% in EPZ firms (Fukunishi [2007: Table E]). The sample used for the estimation contains 5 EPZ firms, 42 Kenyan local firms, and 165

126
Bangladeshi firms 13 Estimation is based on the production function estimates by Fukunishi [2007]. Equation (4) in the paper shows impact of factor prices and technical and allocative efficiency on unit cost. Using the estimated parameters (betas in (4)) and the factor prices of EPZ and Bangladeshi firms and the technical efficiency of Bangladeshi firms, we can calculate the technical efficiency of EPZ firms to have the same unit. In this calculation, we further assume that EPZ firms have no misallocation of factors. 14 In addition, they seem reluctant to change the business style, presumably because of their familiarity with the current style. One manager of the local firm which changed production line from the domestic to the export market complained that production of export garment was much less creative and more stressful than the previous work. 15 In Mauritius, rapid wage increase occurred after the late 1980s which increased the unit labour costs by 50%. Responding that, Mauritian firms heavily invested in technology, and then, TFP as well as labour productivity significantly improved in 1990s (IMF [1997], Sabramanian and Roy [2003]). 16 Some studies pay attention of high unit labour cost of African countries. For example, Lindaur and Velenchik [1994] argued that unit labour costs of African countries are generally higher than ASEAN countries in 1970s. Soderbom and Teal [2000] discussed that small export share of unskilled labour-intensive goods, i.e. garment, in Africa can be attributed to high unit labour cost based on the comparison between Ghana and Mauritius.
127
References Athukorala, Prema-chandra and Sarath Rajapatirana [2000] Liberalization and Industrial
Transformation: Sri Lanka in International Perspective, Oxford; Oxford University Press.
Bangladesh Bureau of Statistics [2004] Statistical Yearbook of Bangladesh, Dhaka; Bangladesh Bureau of Statistics.
Barro, Robert and Xavier Sala-i-Martin [1997] “Technological Diffusion, Convergence, and Growth,” Journal of Economic Growth, Vol.2, pp.1-26.
Biggs, Tyler, Manju Shah and Pradeep Srivastava [1995] Technological Capabilities and Learning in African Enterprises, World Bank Technical Paper No. 285, Washington D.C; World Bank
Bowman, Larry W. [1991] Mauritius: Democracy and Development in the Indian Ocean, Boulder; Westview Press.
Chamley, Christophe P. [2004] Rational Herds: Economic Models of Social Leaning, Cambridge: Cambridge University Press.
Dixit, Avinash K. and Robert S. Pindyck [1994] Investment under Uncertainty, Princeton; Princeton University Press.
Easterly, William [2000] The Elusive Quest for Growth: Economists’ Adventures and Misadventures in the Tropics, Cambridge: The MIT Press.
Evenson, Robert E. and Larry E. Westphal [1995] “Technological Change and Technology Strategy,” in J. Behrman and T.N. Srinivasan eds., Handbook if Development Economics, Volume III, Elsevier Science, pp2209-2299.
Export Processing Zones Authority [2002, 2003, 2004, 2005, 2006] Annual Report, Nairobi; Export Processing Zones Authority.
Egan, Mary Lou and Ashoka Mody [1992] “Buyer-Seller Links in Export Development,” World Development, Vol. 20, No.3, pp.321-334.
Fukunishi, Takahiro [2005] “International Competitiveness of the Garment Industry in Kenya: Comparative Study with Bangladeshi Industry,” in K. Hirano ed. Econometrics for Sub-Saharan Africa, Chiba; Institute of Developing Economies (in Japanese).
Fukunishi, Takahiro [2007] Has Low Productivity Constrained Competitiveness of African Firms?: Comparison of the firm performances with Asian Firms, IDE Discussion Paper Series No.129, Chiba: Institute of Developing Economies.
Fukunishi, Takahiro, Mayumi Murayama, Akio Nishiura and Tatsufumi Yamagata [2006] Industrialization and Poverty Alleviation: Pro-poor industrialization strategies revisited, UNIDO Research Programme Report, United Nations Industrial Organization.
ILO (International Labour Organisation) [2004] Statistics on Occupational Wages and Hours of Work and on Food Prices, Geneva; ILO.
IMF (International Monetary Fund) [1997] Mauritius: Recent Economic Developments

128
and Selected Issues, International Monetary Fund. Keesing, Donald B. and Sanjaya Lall [1992] “Marketing Manufactured Exports from
Developing Countries: Learning Sequence and Public Support,” in G. K. Helleiner ed., Trade Policy, Industrialization, and Development: New Perspectives, Oxford; Clarendon Press.
Keller, Wolfgang [1996] “Absorptive Capacity: On the Creation and Acquisition of Technology in Development,” Journal of Development Economics, Vol. 49, pp.199-227.
Lall, Sanjaya ed. [1999] The Technological Response to Import Liberalization in SubSaharan Africa, London; Macmillan Press.
Lall, Sanjaya and Ganeshan Wignaraja [1994] “Foreign Involvement and Garment Exports by Developing Countries,” Asia-Pacific Development Journal, Vol.1, No.2.
Lindauer, David L. and Ann D. Velenchik [1994] “Can African Labour Compete?,” in D.L. Lindauer and M. Roemer eds., Asia and Africa: Legacies and Opportunities in Development, San Francisco; ICS Press.
McCormick, Dorothy, Mary Njeri Kinyanjui and Grace Ongile [1997] “Growth and Barriers to Growth among Nairobi’s Small and Medium-Sized Garment Producers,” World Development Vol.25, No.7, pp.1095-1110.
Navaretti, Giorgio Barba, Marzio Galeotti, Andrea Mattozzi [2004] “Moving Skills from Hands to Heads: Does Importing Technology Affect Export Performance in Textile?,” Research Policy, Vol. 33, No.6-7, pp.879-895.
Nelson, Richard R. and Sidney Winter [1982] An Evolutionary Theory of Economic Change, Cambridge; Havard University Press.
Nissanke, Machiko and Ernrst Aryeetey [1998] Financial Integration and Development: Liberalization and reform in sub-Saharan Africa, London: Routledge.
Nordas, Hildegunn Kyvik [2004] The Global Textile and Clothing Industry post the Agreement on Textile and Clothing, Discussion Paper No.5, Geneva, World Trade Organization.
Ongile, Grace and Dorothy McCormick [1996] “Barriers to Small Firm Growth: Evidence from Nairobi’s Garment Industry,” in Dorothy McCormick and Paul Ove Pedersen eds., Small Enterprises: Flexibility and Networking in an African Context, Nairobi: Longhorn Kenya Ltd.
Pack, Howard [1993] “Productivity and Industrial Development in Sub-Saharan Africa,” World Development, Vol.21, No.1, pp.1-16.
Pack, Howard [1987] Productivity, Technology, and Industrial Development: A Case Study in Textiles, World Bank Research Publication, New York; Oxford University Press.
Rhee, Yung Whee and Therese Belot [1989] Export Catalysis in Low-Income Countries, Industry and Energy Department Working Paper, Industry Series Paper No.5, Washington D.C.; The World Bank.

129
Sabramanian and Roy [2003] “Who Can Explain the Mauritian Miracle? Meade, Romer, Sachs, or Rodrik?,” in D. Rodrik ed., In Search of Prosperity: Analytic Narratives on Economic Growth, Princeton; Princeton University Press.
Soderbom, Mans and FrancisTeal [2000] “Skills, Investment and Exports from Manufacturing Firms in Africa,” Journal of Development Studies, Vol.37, No.2, pp.13-43.
UNCTAD (United Nations Conference on Trade and Development) [2002] World Investment Report 2002, New York and Geneva; United Nations.
United Nations Statistical Division [2006] Commodity Trade Data Base-Comtrade, World Bank (WITS), (accessed on 20th April 2006)
Wignaraja, Ganeshan and Gerrishon Ikiara [1999] “Adjustment, Technological Capabilitues and Enterprise Dynamics in Kenya,” in Lall, Sanjaya ed., The Technological Response to Import Liberalization in SubSaharan Africa, London: MacMillan Press LTD.
World Bank [1993] The East Asian Miracle, New York: Oxford University Press.
