choosing appropriate summative tests
DESCRIPTION
Choosing appropriate summative tests. Presented by Philip Holmes-Smith School Research Evaluation and Measurement Services. Overview of this module. Choosing Appropriate Summative Tests The reliability of summative (standardised) tests. Choosing appropriate summative tests. - PowerPoint PPT PresentationTRANSCRIPT

Choosing appropriate Choosing appropriate summative tests. summative tests.
Presented byPresented by
Philip Holmes-SmithPhilip Holmes-SmithSchool Research Evaluation and Measurement ServicesSchool Research Evaluation and Measurement Services

Overview of this moduleOverview of this module
• Choosing Appropriate Summative Tests• The reliability of summative (standardised) tests.
• Choosing appropriate summative tests.
• When should you administer summative tests?

The Reliability of The Reliability of
Summative TestsSummative Tests

Three QuestionsThree Questions
1. Do you believe that your students’ NAPLAN and/or On-Demand and/or PAT results accurately reflect their level of performance?

Three QuestionsThree Questions
1. Do you believe that your students’ NAPLAN and/or On-Demand and/or PAT results accurately reflect their level of performance?
2. If we acknowledge that the odd student will have a lucky guessing day or a horror day, what about the majority?
– Do your weakest students usually receive low scores?
– Do your average students usually received scores at about expected level?
– Do your best students usually receive high scores?
3. However, think about your students who received high and low scores:
– Are your low scores too low? - (i.e. indicatively correct but too low)
– Are your high scores too high? - (i.e. indicatively correct but too high)

Is this reading score reliable? This high is probably too high.
Is this reading score reliable? This low is probably too low.
Examples of High highs and Low lowsExamples of High highs and Low lows

Item difficulties for a typical testItem difficulties for a typical test(A test pitched at average year level standard does not have enough easy or hard (A test pitched at average year level standard does not have enough easy or hard questions to reliably or accurately reflect low or high scores)questions to reliably or accurately reflect low or high scores)

Summary Statements about ScoresSummary Statements about Scores
• Low scores (i.e. more than a year below expected) indicate poor performance but the actual values should be considered as indicative only
(i.e. such scores are associated with high levels of measurement error).
• High scores (i.e. more than a year above expected) indicate good performance but the actual values should be considered as indicative only.
(i.e. such scores are associated with high levels of measurement error).
• Average scores indicate roughly expected levels of performance and the actual values are more reliable
(i.e. such scores are associated with lower levels of measurement error).

Summative (Standardised) TestingSummative (Standardised) Testing• Summative testing is essential to monitor the
effectiveness of your teaching, but: – NAPLAN is not reliable for all students. Furthermore, if used
incorrectly, the other summative tests you administer (e.g. On-Demand, PAT, etc.) may also be unreliable.
– More importantly, if NAPLAN is the only summative data used in your school you are not gathering enough information to monitor the effectiveness of your teaching at all year levels. What about Prep, Yr1, Yr2, Yr4, Yr6, Yr8 and Yr10? For example:
• Year 3 NAPLAN reflects the effectiveness of your Prep-Yr2 teaching but what about the Prep teaching vs. Yr1 teaching vs. the Yr2 teaching?
• Year 9 NAPLAN reflects the effectiveness of your Yr7-Yr8 teaching but what about the Yr 7 teaching vs. Yr 8 teaching?

Summative (Standardised) TestingSummative (Standardised) Testing
• We need to We need to maximise the reliability maximise the reliability of the of the tests we use to monitor the effectiveness of tests we use to monitor the effectiveness of our teaching (by better matching the difficulty our teaching (by better matching the difficulty of the items to the ability of the studnets).of the items to the ability of the studnets).
• We need to choose appropriate summative We need to choose appropriate summative tests to monitor the effectiveness of our tests to monitor the effectiveness of our teaching at teaching at all year levels from Prep – Yr10!all year levels from Prep – Yr10!

Choosing appropriateChoosing appropriate
summative testssummative tests

Item Difficulties forBooklet 6Booklet 6
on thePAT-R (Comprehension) PAT-R (Comprehension)
scale score scale
For whom is this test most appropriate?For whom is this test most appropriate?Prep?, Yr4?, Yr10? Prep?, Yr4?, Yr10?
Average Item DifficultyTest is about right for the average Yr4 student
Test is too easy for the average Yr10 student
Test is too hard for the average Prep student

Converting Raw test Scores toConverting Raw test Scores toPAT-R (Comprehension) scale scorePAT-R (Comprehension) scale score
A Yr10 student of ability 144 who answers every
question correctly (35/35) would be falsely placed at
ability 169.0 (i.e. an unreliable high high)
A Yr4 student of ability 120 who answers
approximately half the questions correctly (18/35) would be
accurately placed at ability 120.2
A Prep student of ability 79 who answers every
question incorrectly (0/35) would be falsely
placed at ability 67.4 (i.e. an unreliable low low)

Test difficulties of the PAR-R (Comprehension) Tests on the PAT-R score scale together with Year Level mean scores

Item difficulties of the PAR-R (Comprehension) Tests on the PAT-R score scale together with Year Level mean scores
Test Booklet 2 would be a good test to give to a typical Yr 1 student because the typical item difficulties are around about the ability level of typical Yr 1 students

Different norm tables for different testsDifferent norm tables for different tests

• Source:Source:• ACER, 2006ACER, 2006
Test difficulties of the
PAT-Maths TestsPAT-Maths Testson the PATM
scale score scale together with
Year Level mean scores
Which is the best Which is the best test for an test for an
average Year 4 average Year 4 student?student?
Year 1
Year 2
Year 3
Year 4
Year 5
Year 6&7
Year 8&9
Year 10

• Source:Source:• ACER, 2006ACER, 2006
Year 1
Year 2
Year 3
Year 4
Year 5
Year 6&7
Year 8&9
Year 10
Test difficulties of the
PAT-Maths TestsPAT-Maths Testson the PATM scale
score scale together with Year Level mean scores
The best test for The best test for an average Year 4 an average Year 4
student is probably student is probably Test 5 (or perhaps Test 5 (or perhaps
Test 4)Test 4)

Things to look for in a summative testThings to look for in a summative test
• Needs to have a single developmental scale that shows increasing levels of achievement over all the year levels at your school.
• Needs to have “norms” or expected levels for each year level (e.g. The National “norm” for Yr 3 students on TORCH is an average of 34.7).
• Needs to be able to demonstrate growth from one year to the next (e.g. during Yr 4, the average student grows from a score of 34.7 in Yr 3 to an expected score of 41.4 in Yr 4 – that is 6.7 score points).
• As a bonus, the test could also provides diagnostic information.
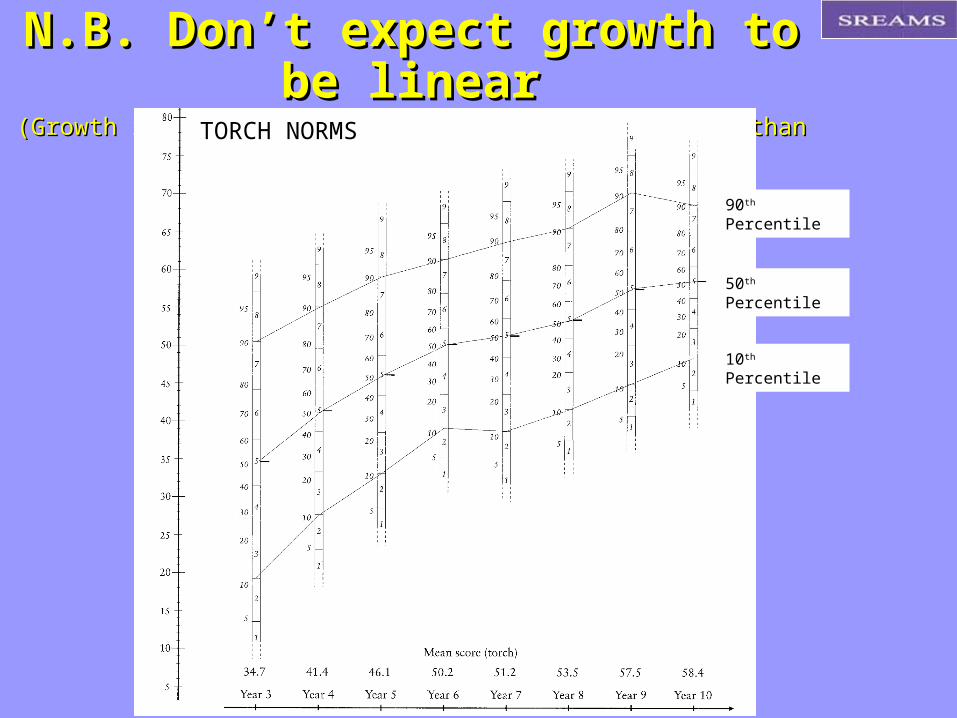
N.B. Don’t expect growth to be linearN.B. Don’t expect growth to be linear(Growth in the early and later years is more rapid than in the middle years)(Growth in the early and later years is more rapid than in the middle years)
TORCH NORMS
50th Percentile
10th Percentile
90th Percentile
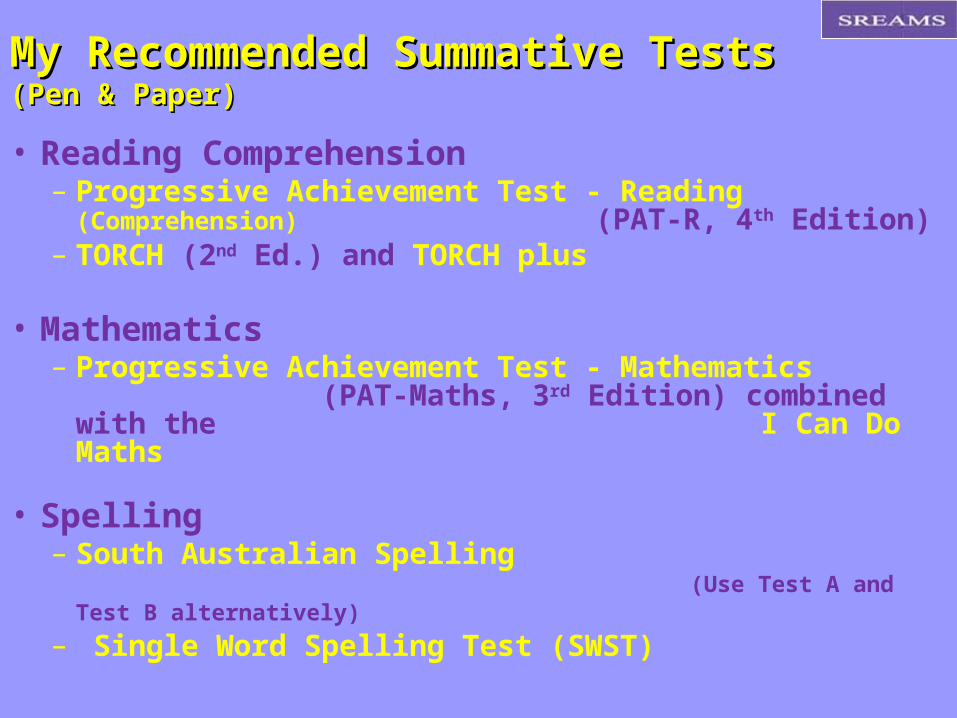
My Recommended Summative TestsMy Recommended Summative Tests(Pen & Paper)(Pen & Paper)
• Reading Comprehension– Progressive Achievement Test - Reading (Comprehension)
(PAT-R, 4th Edition)– TORCH (2nd Ed.) and TORCH plus
• Mathematics– Progressive Achievement Test - Mathematics
(PAT-Maths, 3rd Edition) combined with the I Can Do Maths
• Spelling– South Australian Spelling
(Use Test A and Test B alternatively)– Single Word Spelling Test (SWST)

Selecting the correct PAT-R (Comprehension) TestsSelecting the correct PAT-R (Comprehension) Tests
Score Booklet P Booklet 1 Booklet 2 Booklet 3 Booklet 4 Booklet 5 Booklet 6 Booklet 7 Booklet 8 Booklet 9 Booklet 10
Prep Beginning of the Year 68.1 One or more years below 68.1 Expected Level 68.1 One or more years above 93.1 One or more years below 68.1 Expected Level 93.1 One or more years above 104.1 One or more years below 93.1 Expected Level 104.1 One or more years above 113.4 One or more years below 104.1 Expected Level 113.4 One or more years above 120.6 One or more years below 113.4 Expected Level 120.6 One or more years above 125.8 One or more years below 120.6 Expected Level 125.8 One or more years above 129.3 One or more years below 125.8 Expected Level 129.3 One or more years above 131.8 One or more years below 129.3 Expected Level 131.8 One or more years above 134.3 One or more years below 131.8 Expected Level 134.3 One or more years above 138.0 One or more years below 134.3 Expected Level 138.0 One or more years above 144.4 One or more years below 138.0 Expected Level 144.4 One or more years above 155.6
First Choice Alternative Choice
Year8
Year9
Year10
Year2
Year3
Year4
Year5
Year6
Year7
PAT-R (Comprehension)
CHOOSING THE CORRECT TEST (For test given late Oct./Early Nov.)Example of choosing the right test for students of a given ability:Based on your own teacher judgement you have determined that your Year 3 student is working about a year or more below Grade level.The best test to administer to that student would be Booklet 3 (although Booklet 4 may also be appropriate).
Prep
Year1
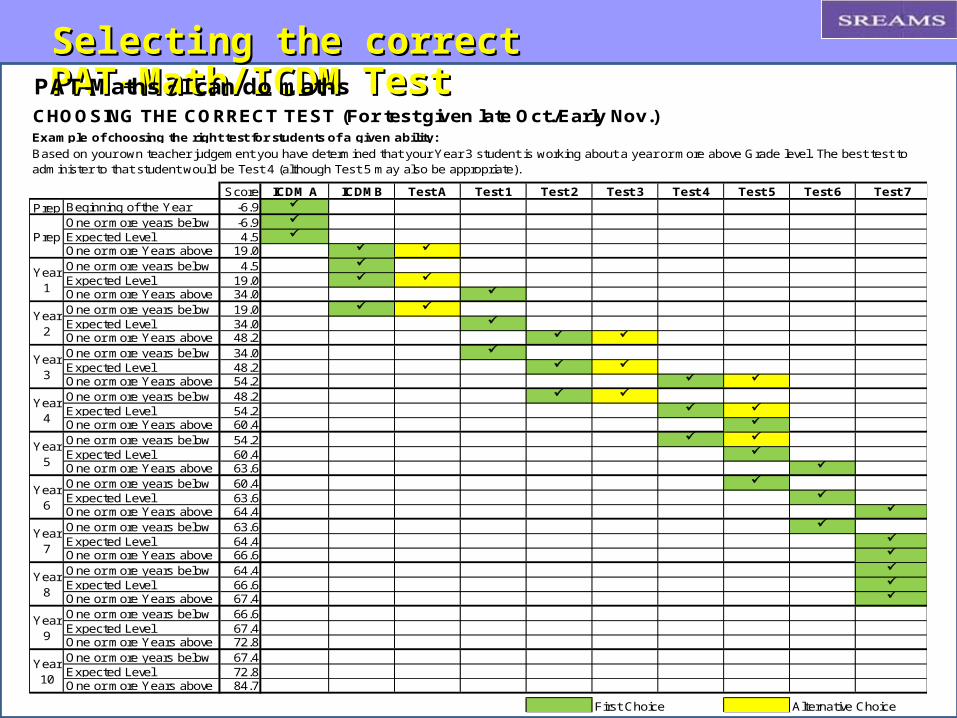
Selecting the correct PAT-Math/ICDM TestSelecting the correct PAT-Math/ICDM TestPAT-Maths / I can do mathsCHOOSING THE CORRECT TEST (For test given late Oct./Early Nov.)
Score ICDM A ICDMB Test A Test 1 Test 2 Test 3 Test 4 Test 5 Test 6 Test 7Prep Beginning of the Year -6.9
One or more years below -6.9 Expected Level 4.5 One or more Years above 19.0 One or more years below 4.5 Expected Level 19.0 One or more Years above 34.0 One or more years below 19.0 Expected Level 34.0 One or more Years above 48.2 One or more years below 34.0 Expected Level 48.2 One or more Years above 54.2 One or more years below 48.2 Expected Level 54.2 One or more Years above 60.4 One or more years below 54.2 Expected Level 60.4 One or more Years above 63.6 One or more years below 60.4 Expected Level 63.6 One or more Years above 64.4 One or more years below 63.6 Expected Level 64.4 One or more Years above 66.6 One or more years below 64.4 Expected Level 66.6 One or more Years above 67.4 One or more years below 66.6Expected Level 67.4One or more Years above 72.8One or more years below 67.4Expected Level 72.8One or more Years above 84.7
First Choice Alternative Choice
Year3
Example of choosing the right test for students of a given ability:Based on your own teacher judgement you have determined that your Year 3 student is working about a year or more above Grade level. The best test to administer to that student would be Test 4 (although Test 5 may also be appropriate).
Prep
Year1
Year2
Year10
Year4
Year5
Year6
Year7
Year8
Year9

Selecting the correct TORCH TestSelecting the correct TORCH Test
TORCHCHOOSING THE CORRECT TEST (For test given late Oct./Early Nov.)
ScoreGrass-
hoppersLizards
love eggsAt theZoo
Feeding Puff
Donna Dingo
TheCats
The Swamp
Creature MatchesShe's Crying
TheAccident
The red Ace of
Spades
The Rages of Mrs
TorrensKiss and Make Up
The Purple
Children
Dissectionin the
Classroom
AnUnusual
Professor
One or more years below 17.7 Expected Level 28.7 One or more years above 37.0
One or more years below 28.7 Expected Level 37.0 One or more years above 43.0
One or more years below 37.0 Expected Level 43.0 One or more years above 47.3
One or more years below 43.0 Expected Level 47.3 One or more years above 50.3
One or more years below 47.3 Expected Level 50.3 One or more years above 52.6
One or more years below 50.3 Expected Level 52.6 One or more years above 54.7
One or more years below 52.6 Expected Level 54.7 One or more years above 57.0
One or more years below 54.7 Expected Level 57.0 One or more years above 60.0
One or more years below 57.0 Expected Level 60.0 One or more years above 64.3
First Choice Alternative Choice
Example of choosing the right test for students of a given ability:Based on your own teacher judgement you have determined that your Year 5 student is working about a year or more below Year level. The best test to administer to that student would be "The Cats" (although "Donna Ding" or "The Swamp Creature" may also be appropriate).
Year2
Year3
Year10
Year4
Year5
Year6
Year7
Year8
Year9

My Recommended Summative TestsMy Recommended Summative Tests(On-Line)(On-Line)• On-Demand - Reading Comprehension
– The 30-item “On-Demand” Adaptive Reading test (Yr3 – Yr10)• On-Demand - Spelling
– The 30-item “On-Demand” Adaptive Spelling test (Yr3 – Yr10)• On-Demand - Writing Conventions
– The 30-item “On-Demand” Adaptive Writing Conventions test (Yr3 – Yr10)• On-Demand – General English (Comprehension, Spelling & Writing Conventions) (Yr3 – Yr10)
– The 60-item “On-Demand” Adaptive General English test
• English Online (Victorian Gov. Schools)– Prep-Yr2 Individual interview
• On-Demand - Number– The 30-item “On-Demand” Adaptive Number test (Yr3 – Yr10)
• On-Demand – Measurement, Chance & Data– The 30-item “On-Demand” Adaptive Measurement, Chance & Data test (Yr3 – Yr10)
• On-Demand - Space– The 30-item “On-Demand” Adaptive Space test (Yr3 – Yr10)
• On-Demand - Structure– The 30-item “On-Demand” Adaptive Structure test (Yr3 – Yr10)
• On-Demand - Mathematics (Number, Measurement, Chance & Data and Space) (Yr3 – Yr10)– The 60-item “On-Demand” Adaptive General Mathematics test
• PAT-Maths Plus– 10 tests from Yr1 to Yr10
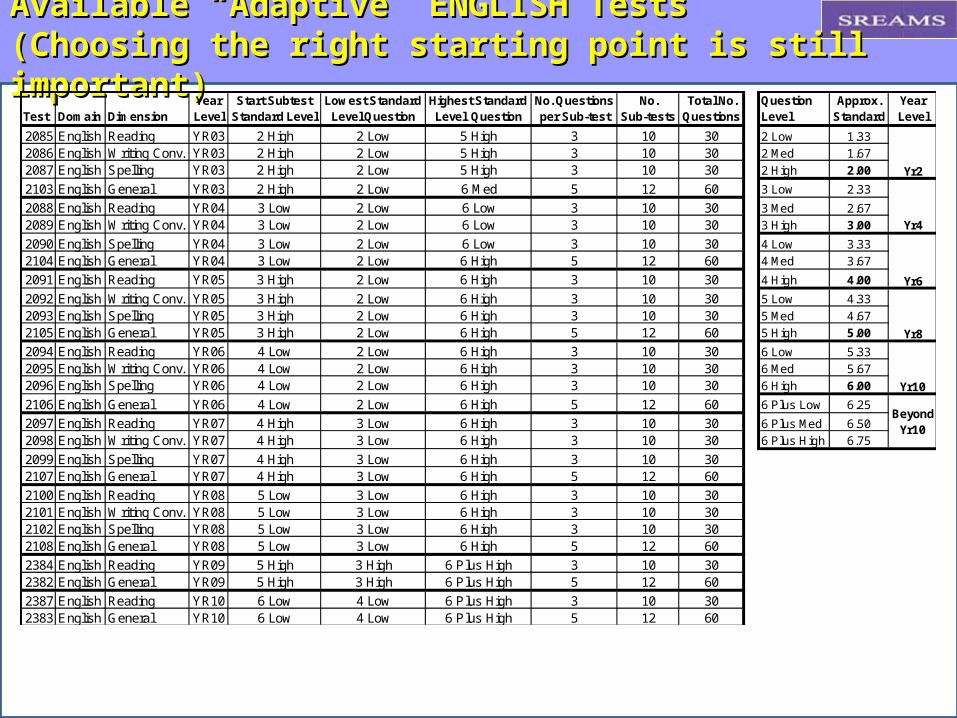
Available “Adaptive” ENGLISH TestsAvailable “Adaptive” ENGLISH Tests(Choosing the right starting point is still important)(Choosing the right starting point is still important)
Test Domain DimensionYear Level
Start Subtest Standard Level
Lowest Standard Level Question
Highest Standard Level Question
No. Questionsper Sub-test
No.Sub-tests
Total No. Questions
Question Level
Approx. Standard
YearLevel
2085 English Reading YR03 2 High 2 Low 5 High 3 10 30 2 Low 1.33
2086 English Writing Conv. YR03 2 High 2 Low 5 High 3 10 30 2 Med 1.67
2087 English Spelling YR03 2 High 2 Low 5 High 3 10 30 2 High 2.00
2103 English General YR03 2 High 2 Low 6 Med 5 12 60 3 Low 2.33
2088 English Reading YR04 3 Low 2 Low 6 Low 3 10 30 3 Med 2.67
2089 English Writing Conv. YR04 3 Low 2 Low 6 Low 3 10 30 3 High 3.00
2090 English Spelling YR04 3 Low 2 Low 6 Low 3 10 30 4 Low 3.33
2104 English General YR04 3 Low 2 Low 6 High 5 12 60 4 Med 3.67
2091 English Reading YR05 3 High 2 Low 6 High 3 10 30 4 High 4.00
2092 English Writing Conv. YR05 3 High 2 Low 6 High 3 10 30 5 Low 4.33
2093 English Spelling YR05 3 High 2 Low 6 High 3 10 30 5 Med 4.67
2105 English General YR05 3 High 2 Low 6 High 5 12 60 5 High 5.00
2094 English Reading YR06 4 Low 2 Low 6 High 3 10 30 6 Low 5.33
2095 English Writing Conv. YR06 4 Low 2 Low 6 High 3 10 30 6 Med 5.67
2096 English Spelling YR06 4 Low 2 Low 6 High 3 10 30 6 High 6.00
2106 English General YR06 4 Low 2 Low 6 High 5 12 60 6 Plus Low 6.25
2097 English Reading YR07 4 High 3 Low 6 High 3 10 30 6 Plus Med 6.50
2098 English Writing Conv. YR07 4 High 3 Low 6 High 3 10 30 6 Plus High 6.75
2099 English Spelling YR07 4 High 3 Low 6 High 3 10 302107 English General YR07 4 High 3 Low 6 High 5 12 60
2100 English Reading YR08 5 Low 3 Low 6 High 3 10 302101 English Writing Conv. YR08 5 Low 3 Low 6 High 3 10 302102 English Spelling YR08 5 Low 3 Low 6 High 3 10 302108 English General YR08 5 Low 3 Low 6 High 5 12 60
2384 English Reading YR09 5 High 3 High 6 Plus High 3 10 302382 English General YR09 5 High 3 High 6 Plus High 5 12 60
2387 English Reading YR10 6 Low 4 Low 6 Plus High 3 10 302383 English General YR10 6 Low 4 Low 6 Plus High 5 12 60
Yr2
Yr4
Yr6
Yr8
Yr10
Beyond Yr10

Test Domain DimensionYear Level
Start Subtest Standard Level
Lowest Standard Level Question
Highest Standard Level Question
No. Questionsper Sub-test
No.Sub-tests
Total No. Questions
Question Level
Approx. Standard
YearLevel
2110 Mathematics Number YR03 2 High 2 Low 5 High 3 10 30 2 Low 1.332111 Mathematics MCD YR03 2 High 2 Low 5 High 3 10 30 2 Med 1.672112 Mathematics Space YR03 2 High 2 Low 5 High 3 10 30 2 High 2.002400 Mathematics Structure YR03 3 Low 3 Low 5 High 3 10 30 3 Low 2.332128 Mathematics General YR03 2 High 2 Low 6 Med 5 12 60 3 Med 2.672113 Mathematics Number YR04 3 Low 2 Low 6 Low 3 10 30 3 High 3.002114 Mathematics MCD YR04 3 Low 2 Low 6 Low 3 10 30 4 Low 3.332115 Mathematics Space YR04 3 Low 2 Low 6 Low 3 10 30 4 Med 3.672401 Mathematics Structure YR04 3 Low 3 Low 6 Low 3 10 30 4 High 4.002129 Mathematics General YR04 3 Low 2 Low 6 High 5 12 60 5 Low 4.332116 Mathematics Number YR05 3 High 2 Low 6 High 3 10 30 5 Med 4.672117 Mathematics MCD YR05 3 High 2 Low 6 High 3 10 30 5 High 5.002118 Mathematics Space YR05 3 High 2 Low 6 High 3 10 30 6 Low 5.332402 Mathematics Structure YR05 3 High 3 Low 6 High 3 10 30 6 Med 5.672130 Mathematics General YR05 3 High 2 Low 6 High 5 12 60 6 High 6.002119 Mathematics Number YR06 4 Low 2 Low 6 High 3 10 30 6 Plus Low 6.252120 Mathematics MCD YR06 4 Low 2 Low 6 High 3 10 30 6 Plus Med 6.502121 Mathematics Space YR06 4 Low 2 Low 6 High 3 10 30 6 Plus High 6.752403 Mathematics Structure YR06 4 Low 3 Low 6 High 3 10 302131 Mathematics General YR06 4 Low 2 Low 6 High 5 12 602122 Mathematics Number YR07 4 High 3 Low 6 High 3 10 302123 Mathematics MCD YR07 4 High 3 Low 6 High 3 10 302124 Mathematics Space YR07 4 High 3 Low 6 High 3 10 302404 Mathematics Structure YR07 4 High 3 Low 6 High 3 10 302132 Mathematics General YR07 4 High 3 Low 6 High 5 12 602125 Mathematics Number YR08 5 Low 3 Low 6 High 3 10 302126 Mathematics MCD YR08 5 Low 3 Low 6 High 3 10 302127 Mathematics Space YR08 5 Low 3 Low 6 High 3 10 302405 Mathematics Structure YR08 5 Low 3 Low 6 High 3 10 302133 Mathematics General YR08 5 Low 3 Low 6 High 5 12 602374 Mathematics Number YR09 5 High 3 High 6 Plus High 3 10 302375 Mathematics MCD YR09 5 High 3 High 6 Plus High 3 10 302376 Mathematics Space YR09 5 High 3 High 6 Plus High 3 10 302377 Mathematics Structure YR09 5 High 3 High 6 Plus High 3 10 302390 Mathematics General YR09 5 High 3 High 6 Plus High 5 12 602378 Mathematics Number YR10 6 Low 4 Low 6 Plus High 3 10 302379 Mathematics MCD YR10 6 Low 4 Low 6 Plus High 3 10 302380 Mathematics Space YR10 6 Low 4 Low 6 Plus High 3 10 302381 Mathematics Structure YR10 6 Low 4 Low 6 Plus High 3 10 302135 Mathematics General YR10 6 Low 4 Low 6 Plus High 5 12 60
Yr2
Yr4
Yr6
Yr8
Yr10
Beyond Yr10
Available “Adaptive” MATHEMATICS TestsAvailable “Adaptive” MATHEMATICS Tests(Choosing the right starting point is still important)(Choosing the right starting point is still important)

Choosing the right starting pointChoosing the right starting pointfor “Adaptive” Testsfor “Adaptive” Tests
VELS Year 3 Year 4 Year 5 Year 6 Year 7 Year 8 Year 9 Year 10One or more years below 1.5Expected Level 2.0 One or more years above 2.5 One or more years below 2.0 Expected Level 2.5 One or more years above 3.0 One or more years below 2.5 Expected Level 3.0 One or more years above 3.5 One or more years below 3.0 Expected Level 3.5 One or more years above 4.0 One or more years below 3.5 Expected Level 4.0 One or more years above 4.5 One or more years below 4.0 Expected Level 4.5 One or more years above 5.0 One or more years below 4.5 Expected Level 5.0 One or more years above 5.5 One or more years below 5.0 Expected Level 5.5 One or more years above 6.0 One or more years below 5.5 Expected Level 6.0 One or more years above 6.5
On-Demand "Adaptive" TestsCHOOSING THE CORRECT TEST (For test given late Oct./Early Nov.)
Year7
Year8
Year9
Year10
Student's Estimated Level of PerformanceAppropriate Test to Choose
Example of choosing the right test for students of a given ability:Based on your own teacher judgement you have determined that your Year 5 student is working about a year or more above Grade level.
The best test to administer to that student would be the Year 7 test.
Year2
Year3
Year4
Year5
Year6

Summative Testing and TriangulationSummative Testing and Triangulation• Even if you give the right test to the right student, sometimes, the
test score does not reflect the true ability of the student – every measurement is associated with some error.
• To overcome this we should aim to get at least three independent measures – what researchers call TRIANGULATION.
• This may include:– Teacher judgment– NAPLAN results– Other pen & paper summative tests (e.g. TORCH, PAT-R, PAT-
Maths, I Can Do Maths)– On-line summative tests (e.g. On-Demand ‘Adaptive’ testing,
PAT-Maths Plus, English Online)

Summative Testing and TriangulationSummative Testing and Triangulation
• BUT remember, more summative testing does not lead to improved learning outcomes so keep the summative testing to a minimum

When should you administerWhen should you administer
summative tests?summative tests?

Timing for Summative TestingTiming for Summative Testing
• Should be done at a time when teachers are trying to triangulate on each student’s level of performance. (i.e. mid-year and end-of-year reporting time.)
• Should be done at a time that enables teachers to monitor growth – say, every six months. (i.e. From the beginning of the year to the middle of the year and from the middle of the year to the end of the year.)

Suggested timingSuggested timing• For Year 1 – Year 6 and Year 8 – Year 10
– Late May/Early June (for mid-year reporting and six-monthly growth*)– Late October/Early November (for end-of-year reporting and six-
monthly growth)
• For Prep and Year 7 and new students at other levels– Beginning of the year (for base-line data) – but record as November the year before
– Late May/Early June (for mid-year reporting and six-monthly growth)– Late October/Early November (for end-of-year reporting and six-
monthly growth)
* November results from the year before form the base-line data for the current year. (i.e. February testing is not required for Year 1 – Year 6 or for Year 8 – Year 10)