commodity market monitor - ncml€¦ · final production estimate of 2017-18 is 11.38 mmt. this...
TRANSCRIPT
Aug 27, 2019
CHANA/WHEAT/RICE&PADDY/SOYBEAN
Commodity Market
Monitor
Weekly Online Quiz
Click on the link above to participate Participate in our weekly quiz and get a chance to win Amazon gift coupons. Winners will
be announced in next report and rewarded.
All India Weather Status
Last week all India Rainfall status: 15th August 2019 to 21st August 2019
Arunachal Pradesh, Assam, Meghalaya, Nagaland, Mizoram, Tripura, Sikkim, Bihar, Odisha, Chhattisgarh,
Telangana and Kerala States received deficit rainfall
Manipur state received the large deficit rainfall
Punjab, Himachal Pradesh, Rajasthan, Goa, Andhra Pradesh and Tamil Nadu state received the large
excess rainfall
Uttar Pradesh, Haryana, Jammu & Kashmir, Gujarat and Karnataka state received the normal rainfall
During the week, rainfall was above Long Period Average (LPA) by 10% over the country as a whole.
Seasonal all India Rainfall status: 1st June 2019 to 26th August 2019.
Nagaland, West Bengal, Jharkhand, Uttarakhand and Haryana states received the deficit rainfall.
Rajasthan, Goa and Maharashtra states received the excess rainfall
Manipur state received the large deficit rainfall
Arunachal Pradesh, Assam, Meghalaya, Mizoram, Tripura, Sikkim, Bihar, Uttar Pradesh, Punjab, Himachal
Pradesh, Jammu & Kashmir, Odisha, Madhya Pradesh, Gujarat, Chhattisgarh, Andhra Pradesh, Telangana,
Tamil Nadu, Karnataka and Kerala states received Normal rainfall.
For the country as a whole, cumulative rainfall during 1st June 2019 to 26th August 2019 was above LPA by 1% over the
country as a whole.
Weather Forecast:
Excess Rainfall likely over Konkan & Goa, east Madhya Pradesh, Bihar and north-eastern states. Normal rainfall likely over Uttar Pradesh, Jharkhand,
Chhattisgarh, Gangetic West Bengal, west Madhya Pradesh, Vidarbha, Coastal Andhra Pradesh, Madhya Maharashtra, Coastal Karnataka and Kerala. Rest
of the region of the country is likely to experience below normal rainfall during the week 29th August to 04th September 2019.
Heavy to very heavy rainfall with extremely heavy falls very likely at isolated places over Gujarat region; Heavy to very heavy rainfall at isolated places
over East Rajasthan; Heavy Rainfall at isolated places over Uttarakhand, West Rajasthan, West Madhya Pradesh, Andaman & Nicobar Islands, Saurashtra
& Kutch, Konkan & Goa, Coastal & South Interior Karnataka and Kerala during next 2-3 days.
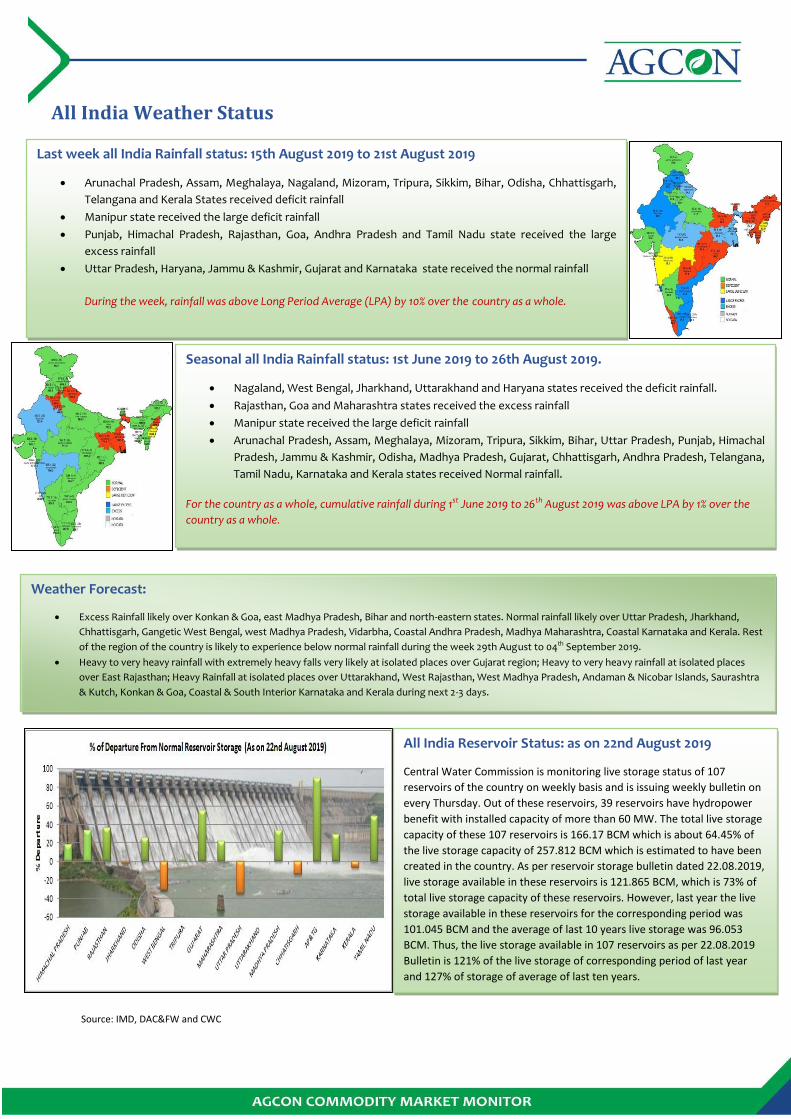
All India Reservoir Status: as on 22nd August 2019
Central Water Commission is monitoring live storage status of 107
reservoirs of the country on weekly basis and is issuing weekly bulletin on
every Thursday. Out of these reservoirs, 39 reservoirs have hydropower
benefit with installed capacity of more than 60 MW. The total live storage
capacity of these 107 reservoirs is 166.17 BCM which is about 64.45% of
the live storage capacity of 257.812 BCM which is estimated to have been
created in the country. As per reservoir storage bulletin dated 22.08.2019,
live storage available in these reservoirs is 121.865 BCM, which is 73% of
total live storage capacity of these reservoirs. However, last year the live
storage available in these reservoirs for the corresponding period was
101.045 BCM and the average of last 10 years live storage was 96.053
BCM. Thus, the live storage available in 107 reservoirs as per 22.08.2019
Bulletin is 121% of the live storage of corresponding period of last year
and 127% of storage of average of last ten years.
Source: IMD, DAC&FW and CWC
Current Crop Scenario
CORN Sowing of crop has been completed in Madhya Pradesh, Rajasthan, Uttar Pradesh, Odisha, Maharashtra and Chhattisgarh, and in these areas crop is 25 to 45 days old and is in vegetative to silking/tasseling stage. Sowing is under progress in Andhra Pradesh, Telangana, Karnataka and Tamil Nadu and crop is in sowing to silking stage. Rainfall received during 4th week of Aug’19 is beneficial to the crop. However, crop has been affected/damaged in low laying areas due to heavy rains during 4th week of July to 2nd week of August-19. Pest and disease have been reported on crop but same is under control. Overall crop condition is normal.
Bajra Sowing of Bajra crop has been completed. Crop is 20 to 40 days old and is in vegetative stage. However, early sown crop is in full vegetative to panicle initiation stage. Rainfall received in 4th week of August in major growing states was beneficial to crop. Major Bajra crop growing States are Rajasthan, Uttar Pradesh, Maharashtra, Gujarat and Haryana. Incidence of disease and pest has not been observed in the field till date. Overall crop condition is normal. Acreage of Bajra in the current week is higher than corresponding week of 2018 due to onset of monsoon and higher market price realization in last year.
COTTON Sowing of Cotton crop has completed. Crop is 95 to 125 days old and is in flowering to
boll development stage in Punjab, Haryana, and Western Rajasthan. In remaining areas
crop is 45 to 85 days old and is in vegetative to flowering/boll formation stage. Rainfall
received during 4th week of August`19 was beneficial to the crop. Incidence of sucking
pest was observed in the field but same is under economic threshold level. Overall crop
health is satisfactory.
Acreage of Cotton in the current week is higher than corresponding week of 2018 as a
result of higher realization by farmers during the last three years.
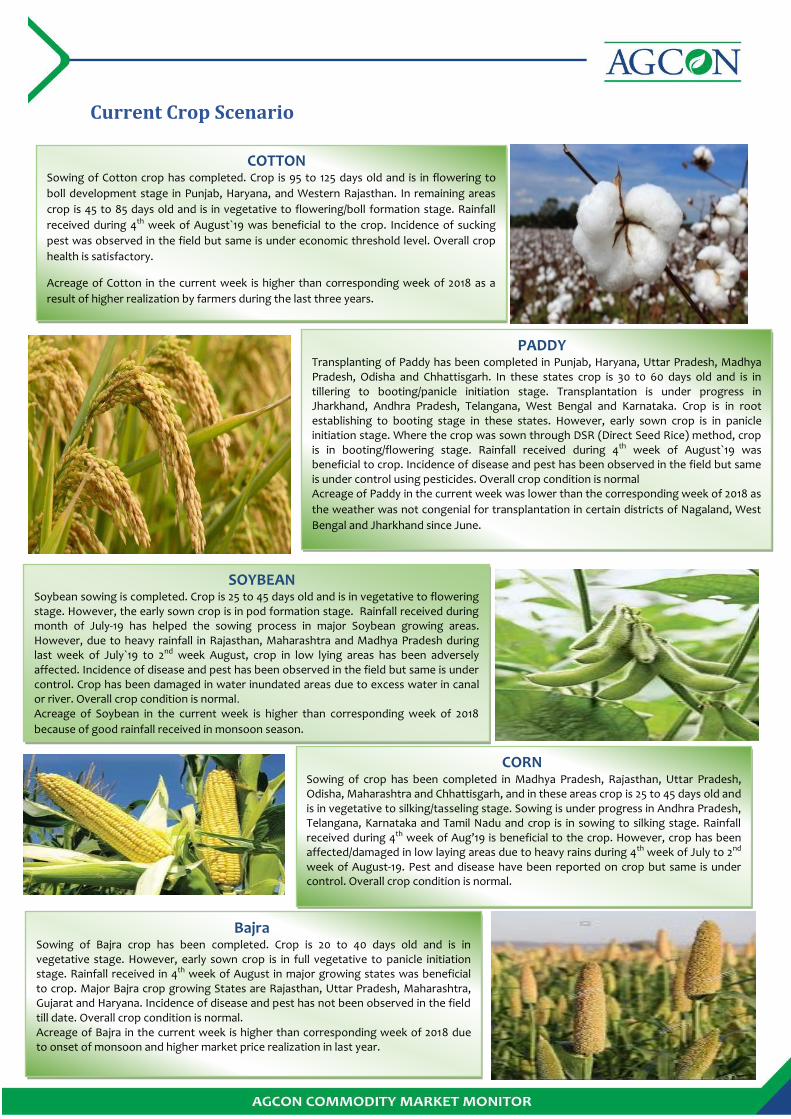
PADDY
Transplanting of Paddy has been completed in Punjab, Haryana, Uttar Pradesh, Madhya Pradesh, Odisha and Chhattisgarh. In these states crop is 30 t0 60 days old and is in tillering to booting/panicle initiation stage. Transplantation is under progress in Jharkhand, Andhra Pradesh, Telangana, West Bengal and Karnataka. Crop is in root establishing to booting stage in these states. However, early sown crop is in panicle initiation stage. Where the crop was sown through DSR (Direct Seed Rice) method, crop is in booting/flowering stage. Rainfall received during 4th week of August`19 was beneficial to crop. Incidence of disease and pest has been observed in the field but same is under control using pesticides. Overall crop condition is normal Acreage of Paddy in the current week was lower than the corresponding week of 2018 as
the weather was not congenial for transplantation in certain districts of Nagaland, West
Bengal and Jharkhand since June.
SOYBEAN Soybean sowing is completed. Crop is 25 to 45 days old and is in vegetative to flowering stage. However, the early sown crop is in pod formation stage. Rainfall received during month of July-19 has helped the sowing process in major Soybean growing areas. However, due to heavy rainfall in Rajasthan, Maharashtra and Madhya Pradesh during last week of July`19 to 2nd week August, crop in low lying areas has been adversely affected. Incidence of disease and pest has been observed in the field but same is under control. Crop has been damaged in water inundated areas due to excess water in canal or river. Overall crop condition is normal. Acreage of Soybean in the current week is higher than corresponding week of 2018
because of good rainfall received in monsoon season.
According to the fourth advance estimate, India Chana
production of 2018-19 is estimated at 10.13 MMT which is 1 per
cent higher than the third advance estimate of 10.09 MMT.
Final production estimate of 2017-18 is 11.38 MMT. This year
production estimate is lower than last year due to lower
acreage.
Chana availability in the market is higher as stockiest are
selling their crop. There are expectations that the coming Rabi
crop sowing would be higher given the current weather
condition.
Moreover, according to the market participants, at present
Chana demand is lower than normal due lower demand of
millers and lower prices of other pulses which is putting
downward pressure on the prices.
Higher stocks of Chana with NAFED and expectation of
liquidation in the coming months is putting downward
pressure on the domestic prices. However, government
decision to sell Chana at or above MSP is holding the prices.
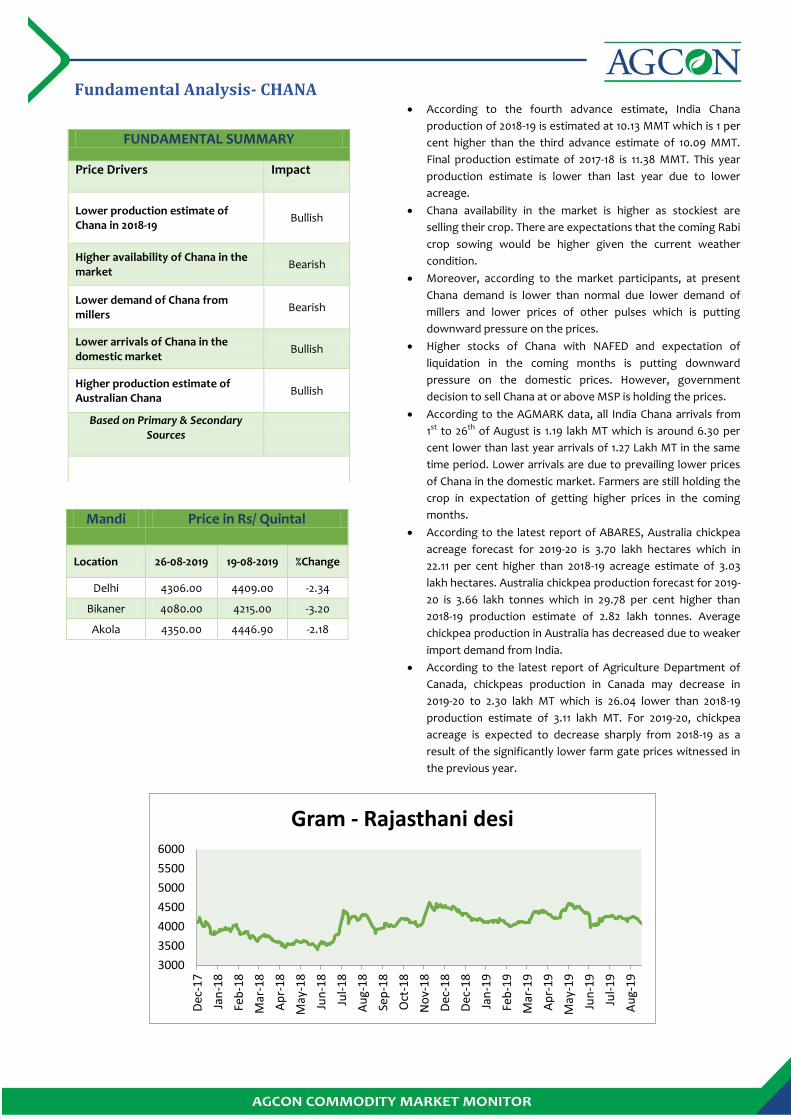
According to the AGMARK data, all India Chana arrivals from
1st to 26th of August is 1.19 lakh MT which is around 6.30 per
cent lower than last year arrivals of 1.27 Lakh MT in the same
time period. Lower arrivals are due to prevailing lower prices
of Chana in the domestic market. Farmers are still holding the
crop in expectation of getting higher prices in the coming
months.
According to the latest report of ABARES, Australia chickpea
acreage forecast for 2019-20 is 3.70 lakh hectares which in
22.11 per cent higher than 2018-19 acreage estimate of 3.03
lakh hectares. Australia chickpea production forecast for 2019-
20 is 3.66 lakh tonnes which in 29.78 per cent higher than
2018-19 production estimate of 2.82 lakh tonnes. Average
chickpea production in Australia has decreased due to weaker
import demand from India.
According to the latest report of Agriculture Department of
Canada, chickpeas production in Canada may decrease in
2019-20 to 2.30 lakh MT which is 26.04 lower than 2018-19
production estimate of 3.11 lakh MT. For 2019-20, chickpea
acreage is expected to decrease sharply from 2018-19 as a
result of the significantly lower farm gate prices witnessed in
the previous year.
Fundamental Analysis- CHANA
Mandi Price in Rs/ Quintal
Location 26-08-2019 19-08-2019 %Change
Delhi 4306.00 4409.00 -2.34
Bikaner 4080.00 4215.00 -3.20
Akola 4350.00 4446.90 -2.18
FUNDAMENTAL SUMMARY
Price Drivers Impact
Lower production estimate of Chana in 2018-19
Bullish
Higher availability of Chana in the market
Bearish
Lower demand of Chana from millers
Bearish
Lower arrivals of Chana in the domestic market
Bullish
Higher production estimate of Australian Chana
Bullish
Based on Primary & Secondary Sources
3000
3500
4000
4500
5000
5500
6000
Dec
-17
Jan
-18
Feb
-18
Mar
-18
Ap
r-1
8
May
-18
Jun
-18
Jul-
18
Au
g-1
8
Sep
-18
Oct
-18
No
v-1
8
Dec
-18
Dec
-18
Jan
-19
Feb
-19
Mar
-19
Ap
r-1
9
May
-19
Jun
-19
Jul-
19
Au
g-1
9
Gram - Rajasthani desi
Fundamental Analysis- WHEAT
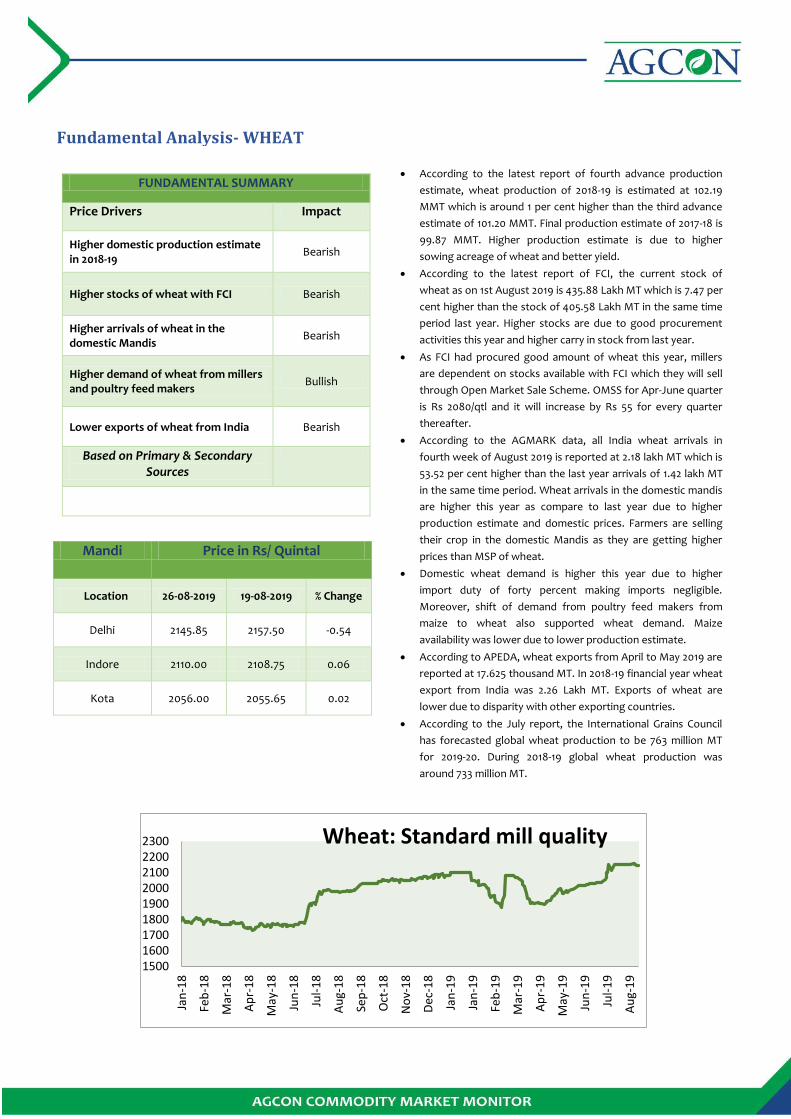
According to the latest report of fourth advance production
estimate, wheat production of 2018-19 is estimated at 102.19
MMT which is around 1 per cent higher than the third advance
estimate of 101.20 MMT. Final production estimate of 2017-18 is
99.87 MMT. Higher production estimate is due to higher
sowing acreage of wheat and better yield.
According to the latest report of FCI, the current stock of
wheat as on 1st August 2019 is 435.88 Lakh MT which is 7.47 per
cent higher than the stock of 405.58 Lakh MT in the same time
period last year. Higher stocks are due to good procurement
activities this year and higher carry in stock from last year.
As FCI had procured good amount of wheat this year, millers
are dependent on stocks available with FCI which they will sell
through Open Market Sale Scheme. OMSS for Apr-June quarter
is Rs 2080/qtl and it will increase by Rs 55 for every quarter
thereafter.
According to the AGMARK data, all India wheat arrivals in
fourth week of August 2019 is reported at 2.18 lakh MT which is
53.52 per cent higher than the last year arrivals of 1.42 lakh MT
in the same time period. Wheat arrivals in the domestic mandis
are higher this year as compare to last year due to higher
production estimate and domestic prices. Farmers are selling
their crop in the domestic Mandis as they are getting higher
prices than MSP of wheat.
Domestic wheat demand is higher this year due to higher
import duty of forty percent making imports negligible.
Moreover, shift of demand from poultry feed makers from
maize to wheat also supported wheat demand. Maize
availability was lower due to lower production estimate.
According to APEDA, wheat exports from April to May 2019 are
reported at 17.625 thousand MT. In 2018-19 financial year wheat
export from India was 2.26 Lakh MT. Exports of wheat are
lower due to disparity with other exporting countries.
According to the July report, the International Grains Council
has forecasted global wheat production to be 763 million MT
for 2019-20. During 2018-19 global wheat production was
around 733 million MT.
Mandi Price in Rs/ Quintal
Location 26-08-2019 19-08-2019 % Change
Delhi 2145.85 2157.50 -0.54
Indore 2110.00 2108.75 0.06
Kota 2056.00 2055.65 0.02
FUNDAMENTAL SUMMARY
Price Drivers Impact
Higher domestic production estimate in 2018-19
Bearish
Higher stocks of wheat with FCI Bearish
Higher arrivals of wheat in the domestic Mandis
Bearish
Higher demand of wheat from millers and poultry feed makers
Bullish
Lower exports of wheat from India Bearish
Based on Primary & Secondary Sources
1500 1600 1700 1800 1900 2000 2100 2200 2300
Jan
-18
Feb
-18
Mar
-18
Ap
r-1
8
May
-18
Jun
-18
Jul-
18
Au
g-1
8
Sep
-18
Oct
-18
No
v-1
8
Dec
-18
Jan
-19
Jan
-19
Feb
-19
Mar
-19
Ap
r-1
9
May
-19
Jun
-19
Jul-
19
Au
g-1
9
Wheat: Standard mill quality
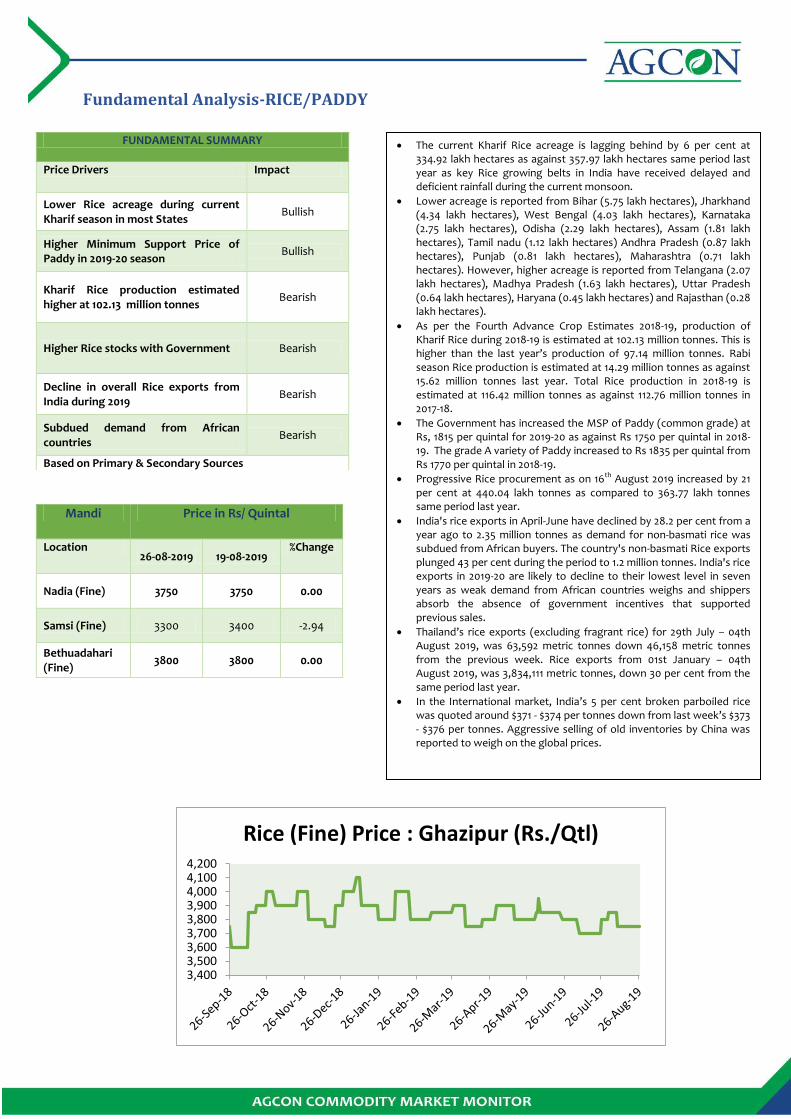
Fundamental Analysis-RICE/PADDY
Mandi Price in Rs/ Quintal
Location 26-08-2019 19-08-2019
%Change
Nadia (Fine) 3750 3750 0.00
Samsi (Fine) 3300 3400 -2.94
Bethuadahari (Fine)
3800 3800 0.00
The current Kharif Rice acreage is lagging behind by 6 per cent at
334.92 lakh hectares as against 357.97 lakh hectares same period last year as key Rice growing belts in India have received delayed and deficient rainfall during the current monsoon.
Lower acreage is reported from Bihar (5.75 lakh hectares), Jharkhand (4.34 lakh hectares), West Bengal (4.03 lakh hectares), Karnataka (2.75 lakh hectares), Odisha (2.29 lakh hectares), Assam (1.81 lakh hectares), Tamil nadu (1.12 lakh hectares) Andhra Pradesh (0.87 lakh hectares), Punjab (0.81 lakh hectares), Maharashtra (0.71 lakh hectares). However, higher acreage is reported from Telangana (2.07 lakh hectares), Madhya Pradesh (1.63 lakh hectares), Uttar Pradesh (0.64 lakh hectares), Haryana (0.45 lakh hectares) and Rajasthan (0.28 lakh hectares).
As per the Fourth Advance Crop Estimates 2018-19, production of Kharif Rice during 2018-19 is estimated at 102.13 million tonnes. This is higher than the last year’s production of 97.14 million tonnes. Rabi season Rice production is estimated at 14.29 million tonnes as against 15.62 million tonnes last year. Total Rice production in 2018-19 is estimated at 116.42 million tonnes as against 112.76 million tonnes in 2017-18.
The Government has increased the MSP of Paddy (common grade) at Rs, 1815 per quintal for 2019-20 as against Rs 1750 per quintal in 2018-19. The grade A variety of Paddy increased to Rs 1835 per quintal from Rs 1770 per quintal in 2018-19.
Progressive Rice procurement as on 16th August 2019 increased by 21 per cent at 440.04 lakh tonnes as compared to 363.77 lakh tonnes same period last year.
India's rice exports in April-June have declined by 28.2 per cent from a year ago to 2.35 million tonnes as demand for non-basmati rice was subdued from African buyers. The country's non-basmati Rice exports plunged 43 per cent during the period to 1.2 million tonnes. India's rice exports in 2019-20 are likely to decline to their lowest level in seven years as weak demand from African countries weighs and shippers absorb the absence of government incentives that supported previous sales.
Thailand’s rice exports (excluding fragrant rice) for 29th July – 04th August 2019, was 63,592 metric tonnes down 46,158 metric tonnes from the previous week. Rice exports from 01st January – 04th August 2019, was 3,834,111 metric tonnes, down 30 per cent from the same period last year.
In the International market, India’s 5 per cent broken parboiled rice was quoted around $371 - $374 per tonnes down from last week’s $373 - $376 per tonnes. Aggressive selling of old inventories by China was reported to weigh on the global prices.
FUNDAMENTAL SUMMARY
Price Drivers Impact
Lower Rice acreage during current Kharif season in most States
Bullish
Higher Minimum Support Price of Paddy in 2019-20 season
Bullish
Kharif Rice production estimated higher at 102.13 million tonnes
Bearish
Higher Rice stocks with Government Bearish
Decline in overall Rice exports from India during 2019
Bearish
Subdued demand from African countries
Bearish
Based on Primary & Secondary Sources
3,400 3,500 3,600 3,700 3,800 3,900 4,000 4,100 4,200
Rice (Fine) Price : Ghazipur (Rs./Qtl)
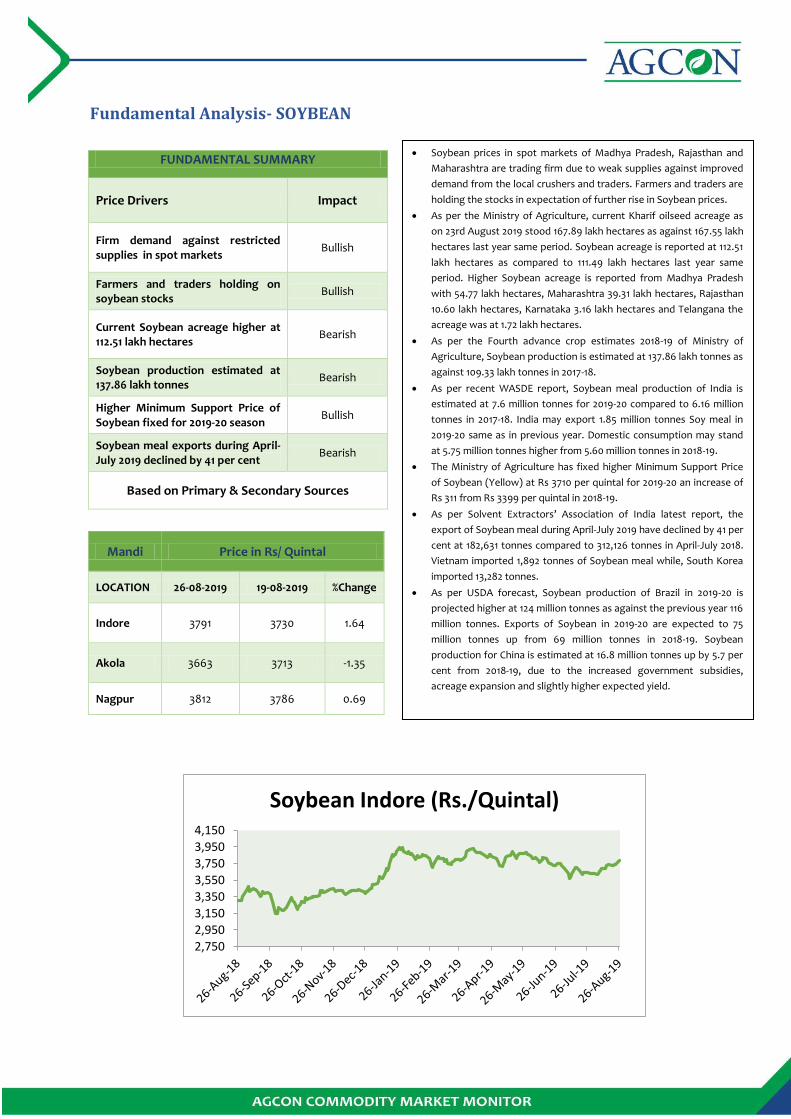
Fundamental Analysis- SOYBEAN
FUNDAMENTAL SUMMARY
Price Drivers Impact
Firm demand against restricted supplies in spot markets
Bullish
Farmers and traders holding on soybean stocks
Bullish
Current Soybean acreage higher at 112.51 lakh hectares
Bearish
Soybean production estimated at 137.86 lakh tonnes
Bearish
Higher Minimum Support Price of Soybean fixed for 2019-20 season
Bullish
Soybean meal exports during April-July 2019 declined by 41 per cent
Bearish
Based on Primary & Secondary Sources
Mandi Price in Rs/ Quintal
LOCATION 26-08-2019 19-08-2019 %Change
Indore 3791 3730 1.64
Akola 3663 3713 -1.35
Nagpur 3812 3786 0.69
Soybean prices in spot markets of Madhya Pradesh, Rajasthan and
Maharashtra are trading firm due to weak supplies against improved
demand from the local crushers and traders. Farmers and traders are
holding the stocks in expectation of further rise in Soybean prices.
As per the Ministry of Agriculture, current Kharif oilseed acreage as
on 23rd August 2019 stood 167.89 lakh hectares as against 167.55 lakh
hectares last year same period. Soybean acreage is reported at 112.51
lakh hectares as compared to 111.49 lakh hectares last year same
period. Higher Soybean acreage is reported from Madhya Pradesh
with 54.77 lakh hectares, Maharashtra 39.31 lakh hectares, Rajasthan
10.60 lakh hectares, Karnataka 3.16 lakh hectares and Telangana the
acreage was at 1.72 lakh hectares.
As per the Fourth advance crop estimates 2018-19 of Ministry of
Agriculture, Soybean production is estimated at 137.86 lakh tonnes as
against 109.33 lakh tonnes in 2017-18.
As per recent WASDE report, Soybean meal production of India is
estimated at 7.6 million tonnes for 2019-20 compared to 6.16 million
tonnes in 2017-18. India may export 1.85 million tonnes Soy meal in
2019-20 same as in previous year. Domestic consumption may stand
at 5.75 million tonnes higher from 5.60 million tonnes in 2018-19.
The Ministry of Agriculture has fixed higher Minimum Support Price
of Soybean (Yellow) at Rs 3710 per quintal for 2019-20 an increase of
Rs 311 from Rs 3399 per quintal in 2018-19.
As per Solvent Extractors’ Association of India latest report, the
export of Soybean meal during April-July 2019 have declined by 41 per
cent at 182,631 tonnes compared to 312,126 tonnes in April-July 2018.
Vietnam imported 1,892 tonnes of Soybean meal while, South Korea
imported 13,282 tonnes.
As per USDA forecast, Soybean production of Brazil in 2019-20 is
projected higher at 124 million tonnes as against the previous year 116
million tonnes. Exports of Soybean in 2019-20 are expected to 75
million tonnes up from 69 million tonnes in 2018-19. Soybean
production for China is estimated at 16.8 million tonnes up by 5.7 per
cent from 2018-19, due to the increased government subsidies,
acreage expansion and slightly higher expected yield.
2,750
2,950
3,150
3,350
3,550
3,750
3,950
4,150
Soybean Indore (Rs./Quintal)
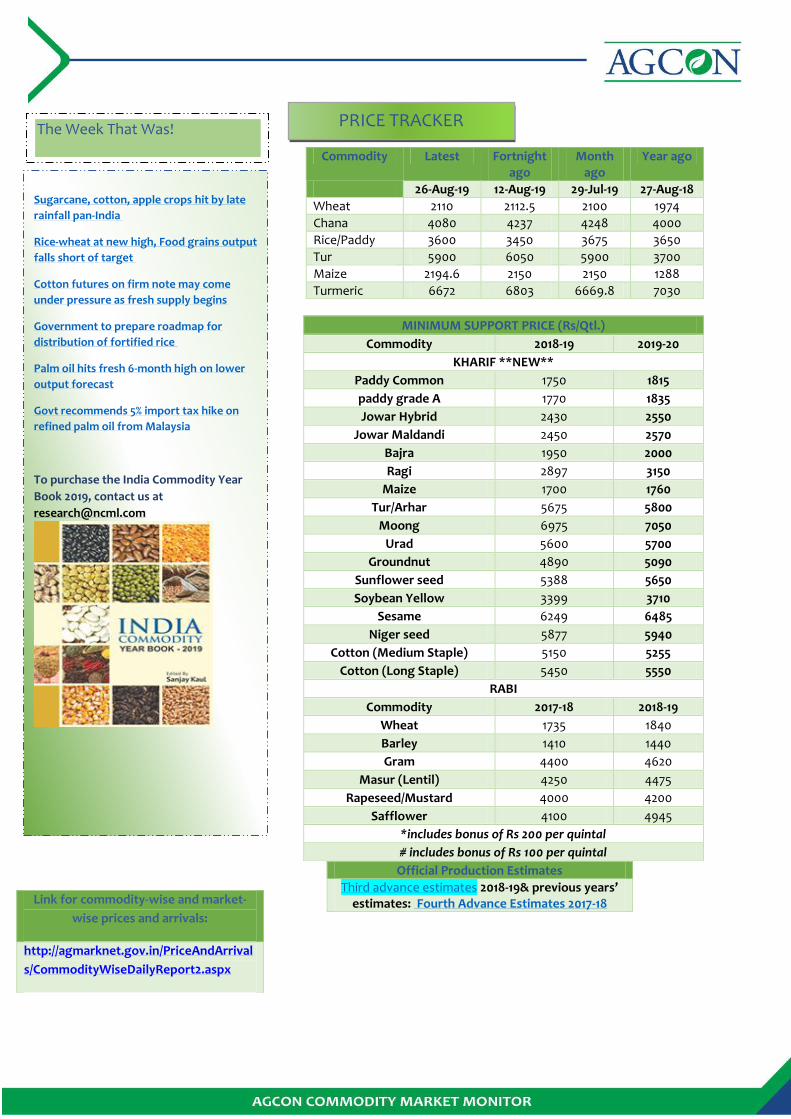
Sugarcane, cotton, apple crops hit by late
rainfall pan-India
Rice-wheat at new high, Food grains output
falls short of target
Cotton futures on firm note may come
under pressure as fresh supply begins
Government to prepare roadmap for
distribution of fortified rice
Palm oil hits fresh 6-month high on lower
output forecast
Govt recommends 5% import tax hike on
refined palm oil from Malaysia
To purchase the India Commodity Year
Book 2019, contact us at
The Week That Was!
MINIMUM SUPPORT PRICE (Rs/Qtl.)
Commodity 2018-19 2019-20
KHARIF **NEW**
Paddy Common 1750 1815
paddy grade A 1770 1835
Jowar Hybrid 2430 2550
Jowar Maldandi 2450 2570
Bajra 1950 2000
Ragi 2897 3150
Maize 1700 1760
Tur/Arhar 5675 5800
Moong 6975 7050
Urad 5600 5700
Groundnut 4890 5090
Sunflower seed 5388 5650
Soybean Yellow 3399 3710
Sesame 6249 6485
Niger seed 5877 5940
Cotton (Medium Staple) 5150 5255
Cotton (Long Staple) 5450 5550
RABI
Commodity 2017-18 2018-19
Wheat 1735 1840
Barley 1410 1440
Gram 4400 4620
Masur (Lentil) 4250 4475
Rapeseed/Mustard 4000 4200
Safflower 4100 4945
*includes bonus of Rs 200 per quintal
# includes bonus of Rs 100 per quintal
Commodity Latest Fortnight ago
Month ago
Year ago
26-Aug-19 12-Aug-19 29-Jul-19 27-Aug-18
Wheat 2110 2112.5 2100 1974
Chana 4080 4237 4248 4000
Rice/Paddy 3600 3450 3675 3650
Tur 5900 6050 5900 3700
Maize 2194.6 2150 2150 1288
Turmeric 6672 6803 6669.8 7030
Official Production Estimates
Third advance estimates 2018-19& previous years’ estimates: Fourth Advance Estimates 2017-18 Link for commodity-wise and market-
wise prices and arrivals:
http://agmarknet.gov.in/PriceAndArrival
s/CommodityWiseDailyReport2.aspx
PRICE TRACKER
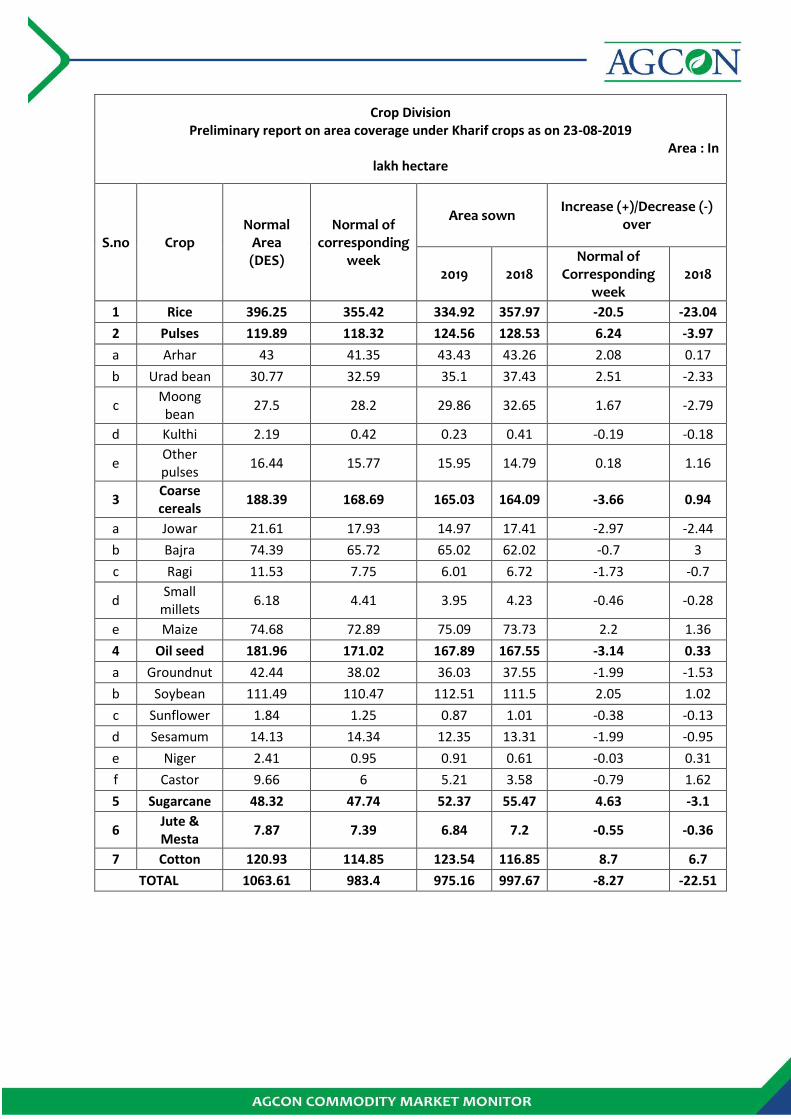
Crop Division Preliminary report on area coverage under Kharif crops as on 23-08-2019
Area : In lakh hectare
S.no Crop Normal
Area (DES)
Normal of corresponding
week
Area sown Increase (+)/Decrease (-)
over
2019 2018 Normal of
Corresponding week
2018
1 Rice 396.25 355.42 334.92 357.97 -20.5 -23.04
2 Pulses 119.89 118.32 124.56 128.53 6.24 -3.97
a Arhar 43 41.35 43.43 43.26 2.08 0.17
b Urad bean 30.77 32.59 35.1 37.43 2.51 -2.33
c Moong bean
27.5 28.2 29.86 32.65 1.67 -2.79
d Kulthi 2.19 0.42 0.23 0.41 -0.19 -0.18
e Other pulses
16.44 15.77 15.95 14.79 0.18 1.16
3 Coarse cereals
188.39 168.69 165.03 164.09 -3.66 0.94
a Jowar 21.61 17.93 14.97 17.41 -2.97 -2.44
b Bajra 74.39 65.72 65.02 62.02 -0.7 3
c Ragi 11.53 7.75 6.01 6.72 -1.73 -0.7
d Small
millets 6.18 4.41 3.95 4.23 -0.46 -0.28
e Maize 74.68 72.89 75.09 73.73 2.2 1.36
4 Oil seed 181.96 171.02 167.89 167.55 -3.14 0.33
a Groundnut 42.44 38.02 36.03 37.55 -1.99 -1.53
b Soybean 111.49 110.47 112.51 111.5 2.05 1.02
c Sunflower 1.84 1.25 0.87 1.01 -0.38 -0.13
d Sesamum 14.13 14.34 12.35 13.31 -1.99 -0.95
e Niger 2.41 0.95 0.91 0.61 -0.03 0.31
f Castor 9.66 6 5.21 3.58 -0.79 1.62
5 Sugarcane 48.32 47.74 52.37 55.47 4.63 -3.1
6 Jute & Mesta
7.87 7.39 6.84 7.2 -0.55 -0.36
7 Cotton 120.93 114.85 123.54 116.85 8.7 6.7
TOTAL 1063.61 983.4 975.16 997.67 -8.27 -22.51
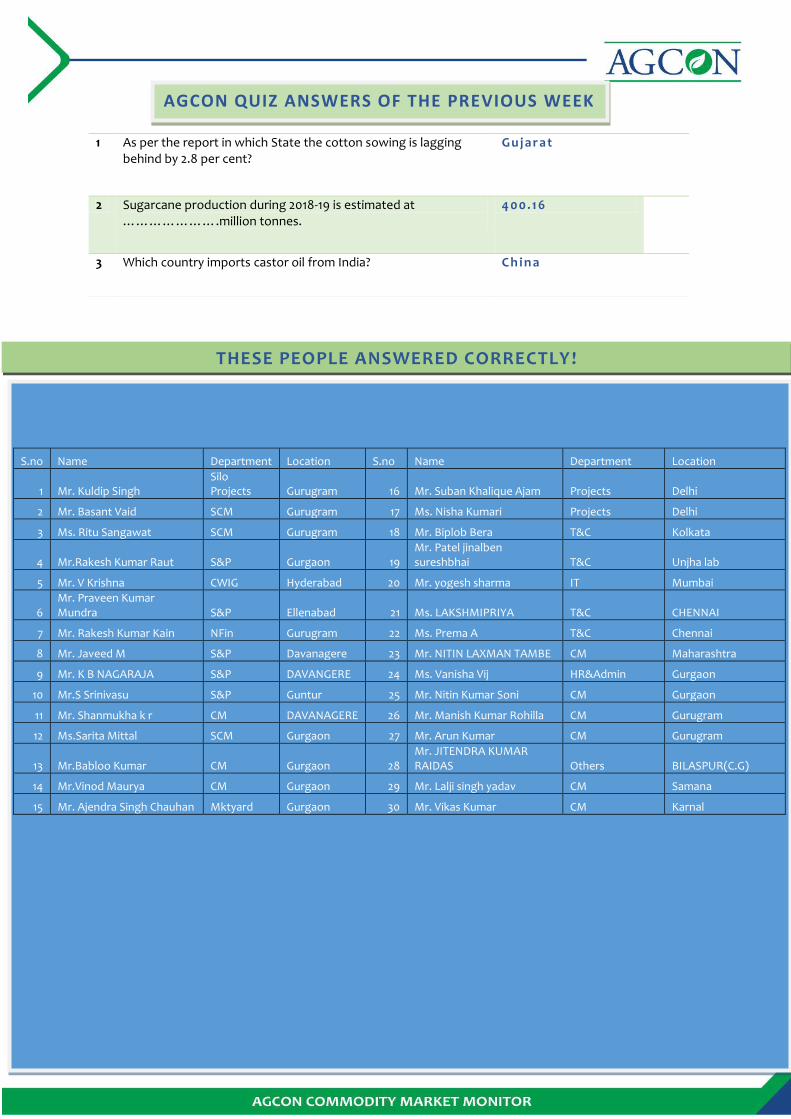
1 As per the report in which State the cotton sowing is lagging behind by 2.8 per cent?
G u j a ra t
2 Sugarcane production during 2018-19 is estimated at ………………….million tonnes.
4 00.1 6
3 Which country imports castor oil from India? C h i n a
AGCON QUIZ ANSWERS OF THE PREVIOUS WEEK
THESE PEOPLE ANSWERED CORRECTLY !
S.no Name Department Location S.no Name Department Location
1 Mr. Kuldip Singh Silo Projects Gurugram 16 Mr. Suban Khalique Ajam Projects Delhi
2 Mr. Basant Vaid SCM Gurugram 17 Ms. Nisha Kumari Projects Delhi
3 Ms. Ritu Sangawat SCM Gurugram 18 Mr. Biplob Bera T&C Kolkata
4 Mr.Rakesh Kumar Raut S&P Gurgaon 19 Mr. Patel jinalben sureshbhai T&C Unjha lab
5 Mr. V Krishna CWIG Hyderabad 20 Mr. yogesh sharma IT Mumbai
6 Mr. Praveen Kumar Mundra S&P Ellenabad 21 Ms. LAKSHMIPRIYA T&C CHENNAI
7 Mr. Rakesh Kumar Kain NFin Gurugram 22 Ms. Prema A T&C Chennai
8 Mr. Javeed M S&P Davanagere 23 Mr. NITIN LAXMAN TAMBE CM Maharashtra
9 Mr. K B NAGARAJA S&P DAVANGERE 24 Ms. Vanisha Vij HR&Admin Gurgaon
10 Mr.S Srinivasu S&P Guntur 25 Mr. Nitin Kumar Soni CM Gurgaon
11 Mr. Shanmukha k r CM DAVANAGERE 26 Mr. Manish Kumar Rohilla CM Gurugram
12 Ms.Sarita Mittal SCM Gurgaon 27 Mr. Arun Kumar CM Gurugram
13 Mr.Babloo Kumar CM Gurgaon 28 Mr. JITENDRA KUMAR RAIDAS Others BILASPUR(C.G)
14 Mr.Vinod Maurya CM Gurgaon 29 Mr. Lalji singh yadav CM Samana
15 Mr. Ajendra Singh Chauhan Mktyard Gurgaon 30 Mr. Vikas Kumar CM Karnal
AdvisoryTeam
Nalin Rawal Head [email protected]
Sreedhar Nandam Vice President [email protected]
S. Anisul Hassan Head - Business Development [email protected]
Research Team
Ankur Gupta Data Scientist [email protected]
Mukesh Upamanyu Agri Analyst [email protected]
Suresh Solanki Assistant Manager [email protected]
Akash Jaiswal Research Analyst [email protected]
Ratanpriya Assistant Manager [email protected]
Bhaskar M Quality Officer [email protected]
Shefali Jain Operation Executive [email protected]
Rajiv Kumar Associate [email protected]
Mr. Vikas Kumar
Karnal
CONGRATULATIONS!
Name of the lucky winner
Disclaimer:
This consultancy report has been prepared by NCML AGRI BUSINESS CONSULTANTS PRIVATE LIMITED for the sole benefit of the
addressee. Neither the report nor any part of the report shall be provided to third parties without the written consent of AGCON. Any
third party in possession of the report may not rely on its conclusions without the written consent of AGCON. AGCON has exercised
reasonable care and skill in preparation of this consultancy report but has not independently verified information provided by others.
No other warranty, express or implied, is made in relation to this report. Therefore, AGCON assumes no liability for any loss resulting
from errors, omissions or misrepresentations made by others. Any recommendations, opinions and findings stated in this report are
based on circumstances and facts as they existed at the time of preparation of this report. Any change in circumstances and facts on
which this report is based may adversely affect any recommendations, opinions or findings contained in this report.
© NCML AGRI BUSINESS CONSULTANTS PRIVATE LIMITED (AGCON) 2019