como as metricas de marketing dirigem as estrategias
TRANSCRIPT
Como as métricas de marketing dirigem as
estratégias Novos paradigmas para o
marketing dirigido por dados de hoje em dia.
Peter J Rosenwald
Consultor de Estratégias de Marketing

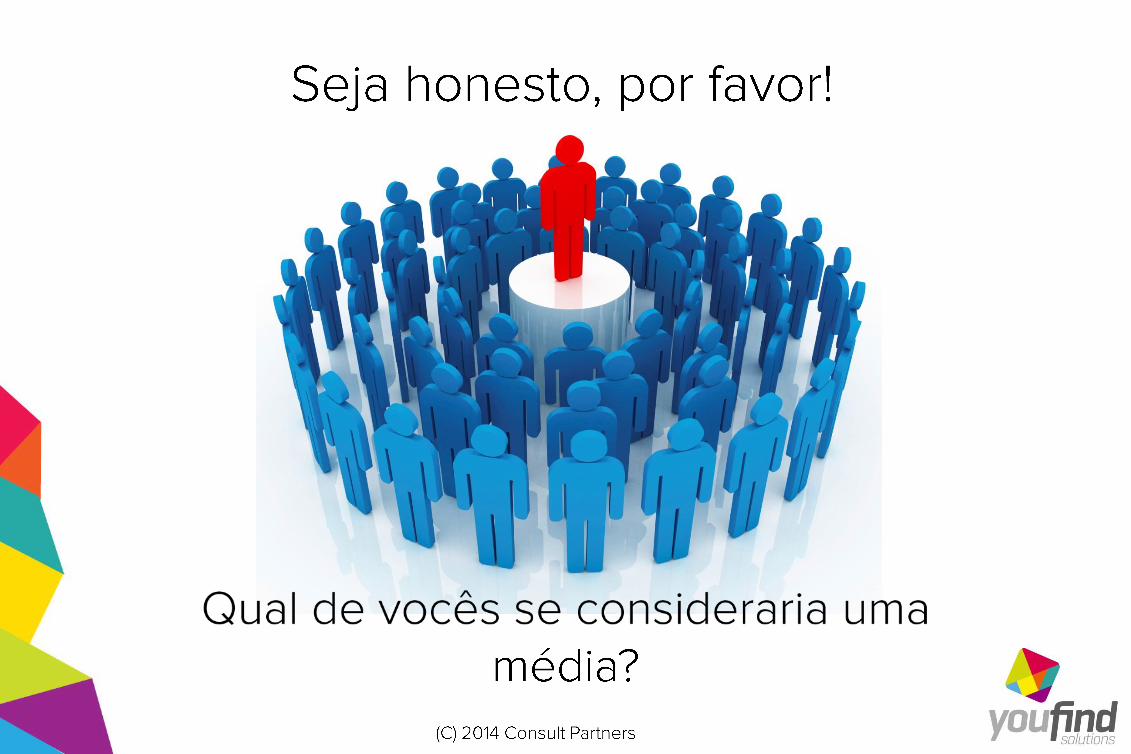
No começo...


•
•
•
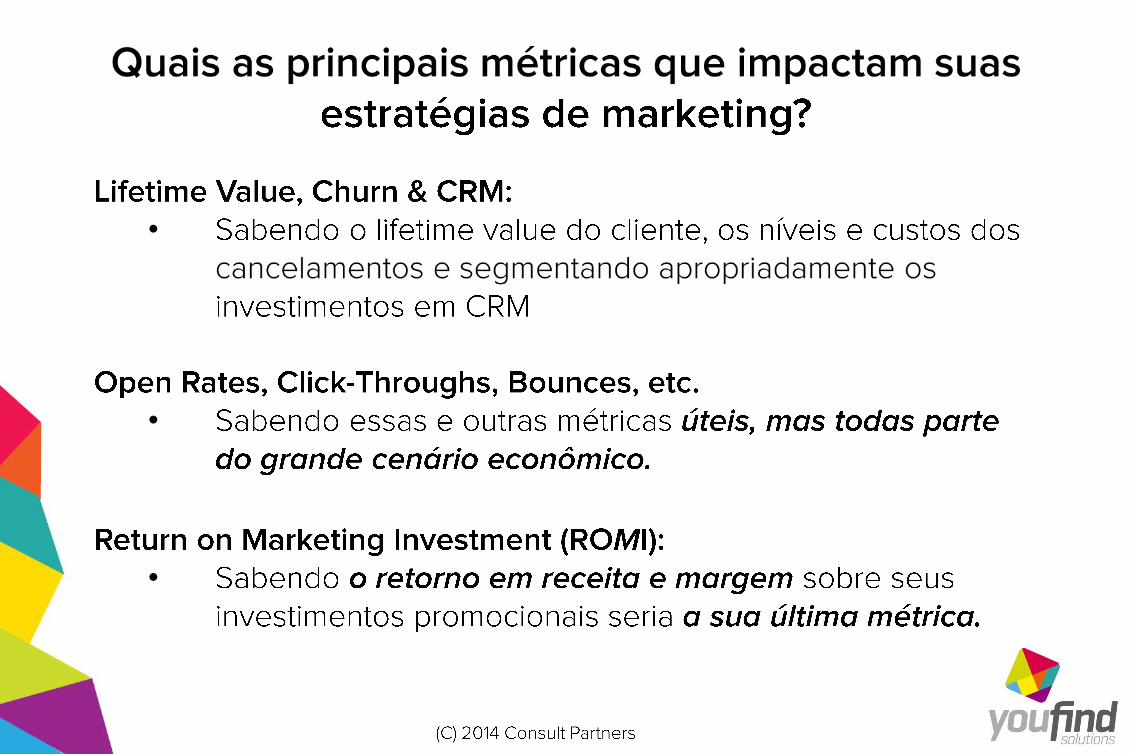
•
•
•
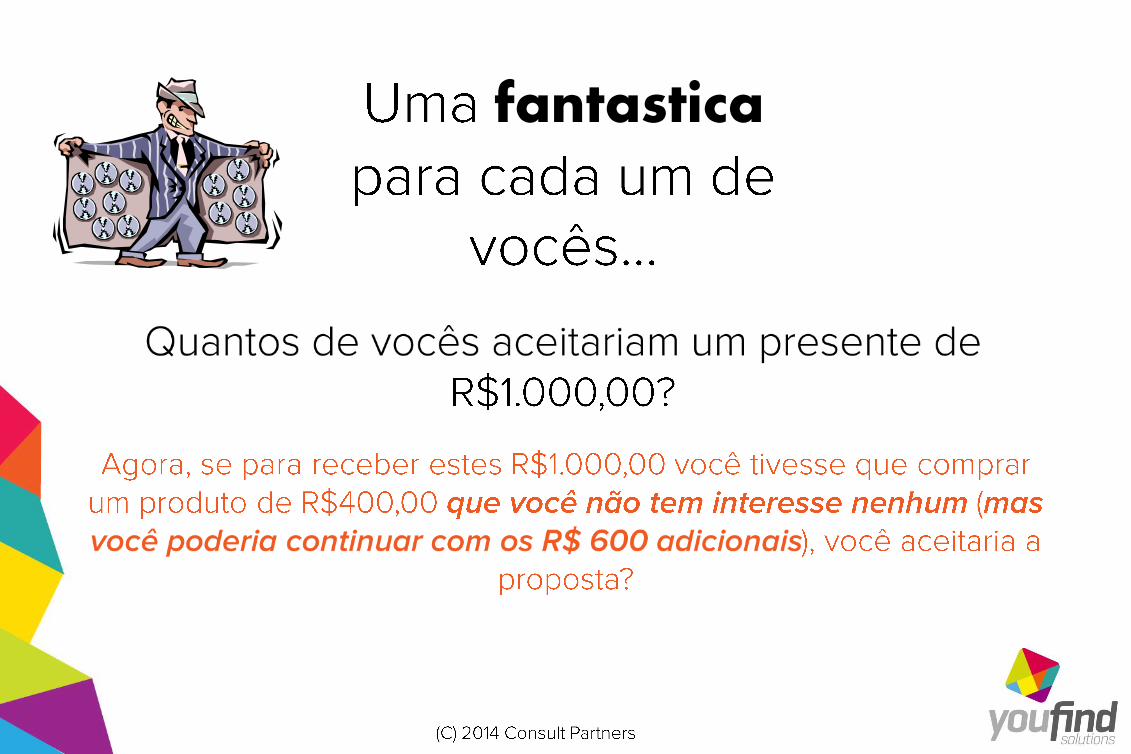
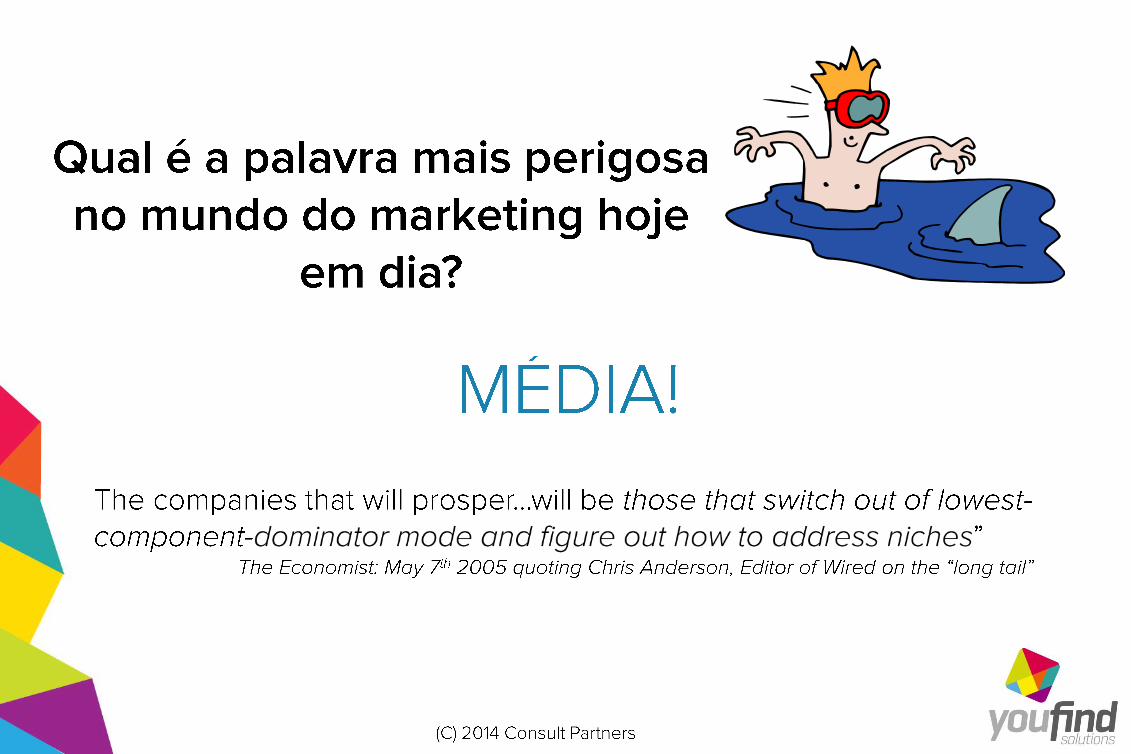
fantastica
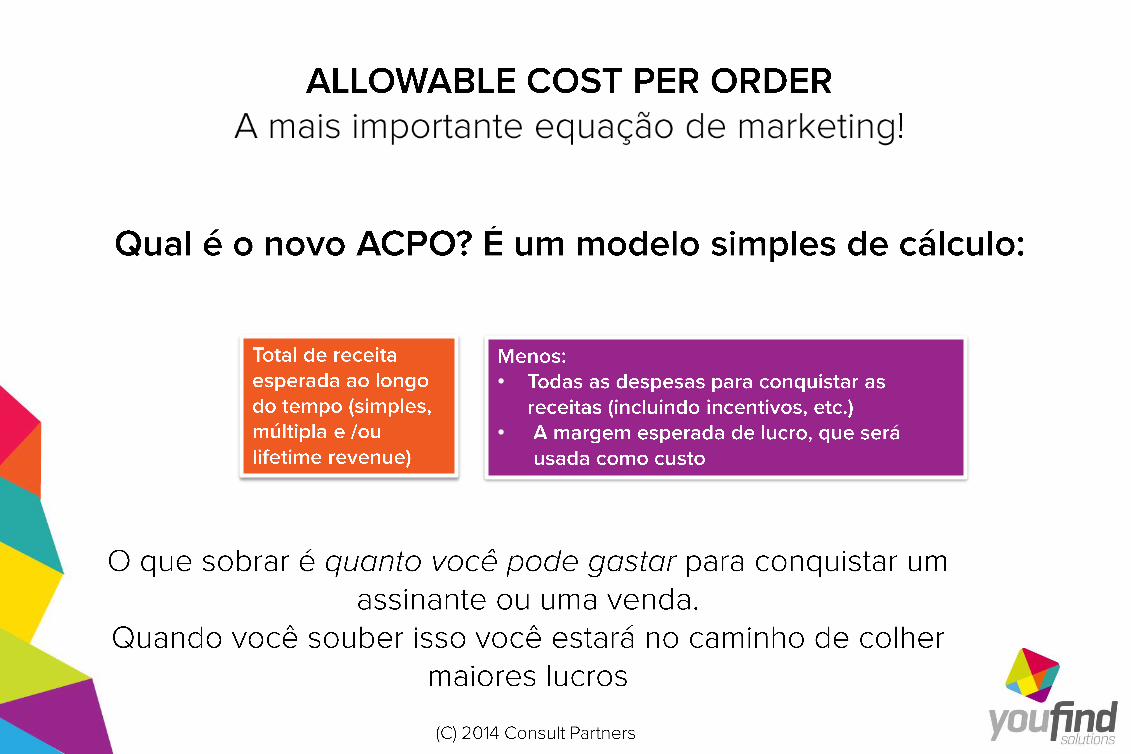
•
•
Item Selling Price 60.00 No. of Items 2
TOTAL Product Revenue 120.00 Less: Degree of Sensitivity 20.00% Target
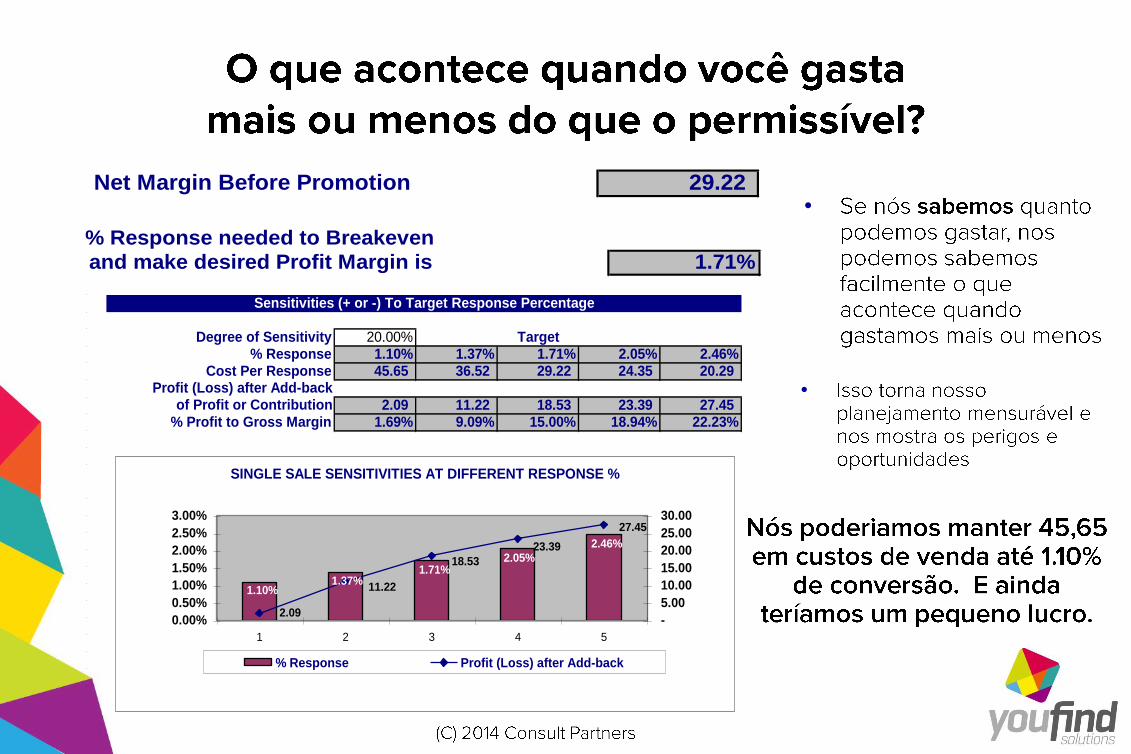
Unit Product Cost 15.00 % Response 1.10% 1.37% 1.71% 2.05% 2.46%No. of Items 2.00 Cost Per Response 45.65 36.52 29.22 24.35 20.29
TOTAL Product Cost 30.00 Profit (Loss) after Add-back
Gross Margin before other Costs 90.00 of Profit or Contribution 2.09 11.22 18.53 23.39 27.45 % Profit to Gross Margin 1.69% 9.09% 15.00% 18.94% 22.23%
Postage Charge Back for Package 3.50 TOTAL Gross Revenue 93.50
Less:Taxes included in price 9.00% 11.12
Fulfillment (inc. Credit Card charges) 15.00 Bad Pay at 3.00% 3.71 Returns at 4.00% 4.94
Premium 6.00 Misc. 5.00
TOTAL Non-Product Costs 45.76
Profit or Contribution 15.00% 18.53
Net Margin Before Promotion 29.22
Promotion Cost Per '000
(including media and lists, etc.) 500.00
% Response needed to Breakeven
and make desired Profit Margin is 1.71%
No.of Orders Per '000 Promotions needed to
Breakeven and make desired Profit Margin is 17
Template VALUING A SINGLE UNIT SALE
Sensitivities (+ or -) To Target Response Percentage
SINGLE SALE SENSITIVITIES AT DIFFERENT RESPONSE %
1.10%1.37%
1.71%2.05%
2.46%
2.09
11.22
18.53
23.39
27.45
0.00%
0.50%
1.00%
1.50%
2.00%
2.50%
3.00%
1 2 3 4 5
-
5.00
10.00
15.00
20.00
25.00
30.00
% Response Profit (Loss) after Add-back
Item Selling Price 60.00 No. of Items 2
TOTAL Product Revenue 120.00 Less: Degree of Sensitivity 20.00% Target
Unit Product Cost 15.00 % Response 1.10% 1.37% 1.71% 2.05% 2.46%No. of Items 2.00 Cost Per Response 45.65 36.52 29.22 24.35 20.29
TOTAL Product Cost 30.00 Profit (Loss) after Add-back
Gross Margin before other Costs 90.00 of Profit or Contribution 2.09 11.22 18.53 23.39 27.45 % Profit to Gross Margin 1.69% 9.09% 15.00% 18.94% 22.23%
Postage Charge Back for Package 3.50 TOTAL Gross Revenue 93.50
Less:Taxes included in price 9.00% 11.12
Fulfillment (inc. Credit Card charges) 15.00 Bad Pay at 3.00% 3.71 Returns at 4.00% 4.94
Premium 6.00 Misc. 5.00
TOTAL Non-Product Costs 45.76
Profit or Contribution 15.00% 18.53
Net Margin Before Promotion 29.22
Promotion Cost Per '000
(including media and lists, etc.) 500.00
% Response needed to Breakeven
and make desired Profit Margin is 1.71%
No.of Orders Per '000 Promotions needed to
Breakeven and make desired Profit Margin is 17
Template VALUING A SINGLE UNIT SALE
Sensitivities (+ or -) To Target Response Percentage
SINGLE SALE SENSITIVITIES AT DIFFERENT RESPONSE %
1.10%1.37%
1.71%2.05%
2.46%
2.09
11.22
18.53
23.39
27.45
0.00%
0.50%
1.00%
1.50%
2.00%
2.50%
3.00%
1 2 3 4 5
-
5.00
10.00
15.00
20.00
25.00
30.00
% Response Profit (Loss) after Add-back
•
•
•
•
•
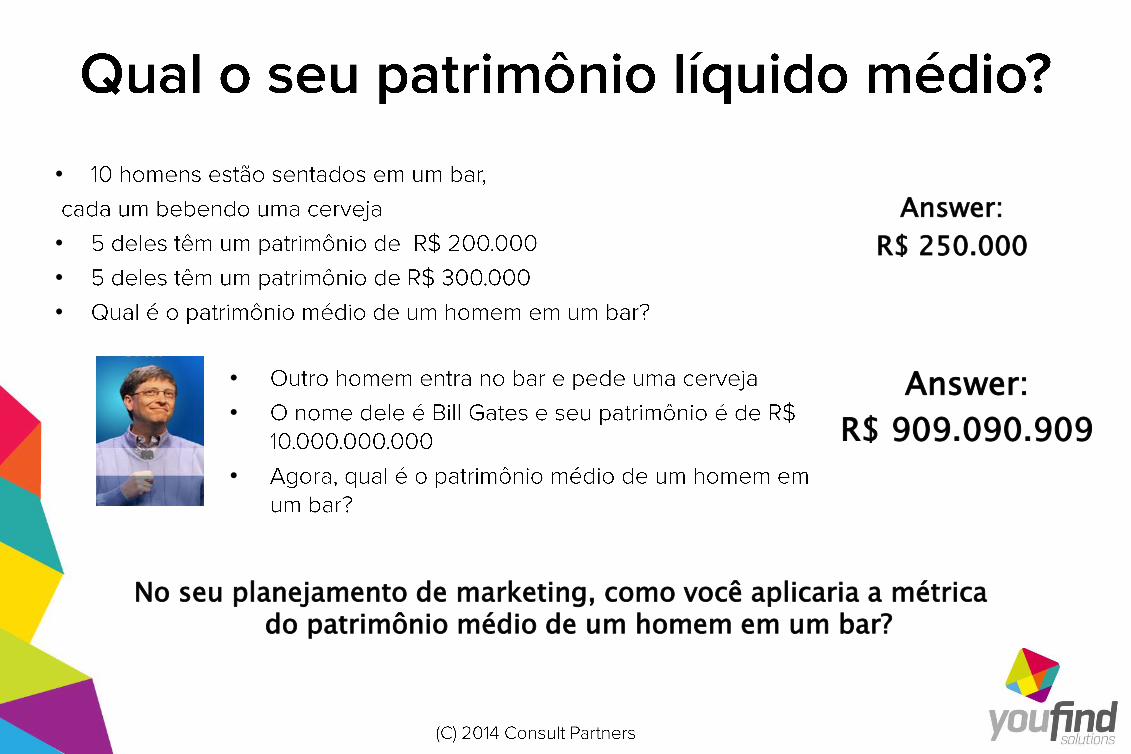
•
•
•
•
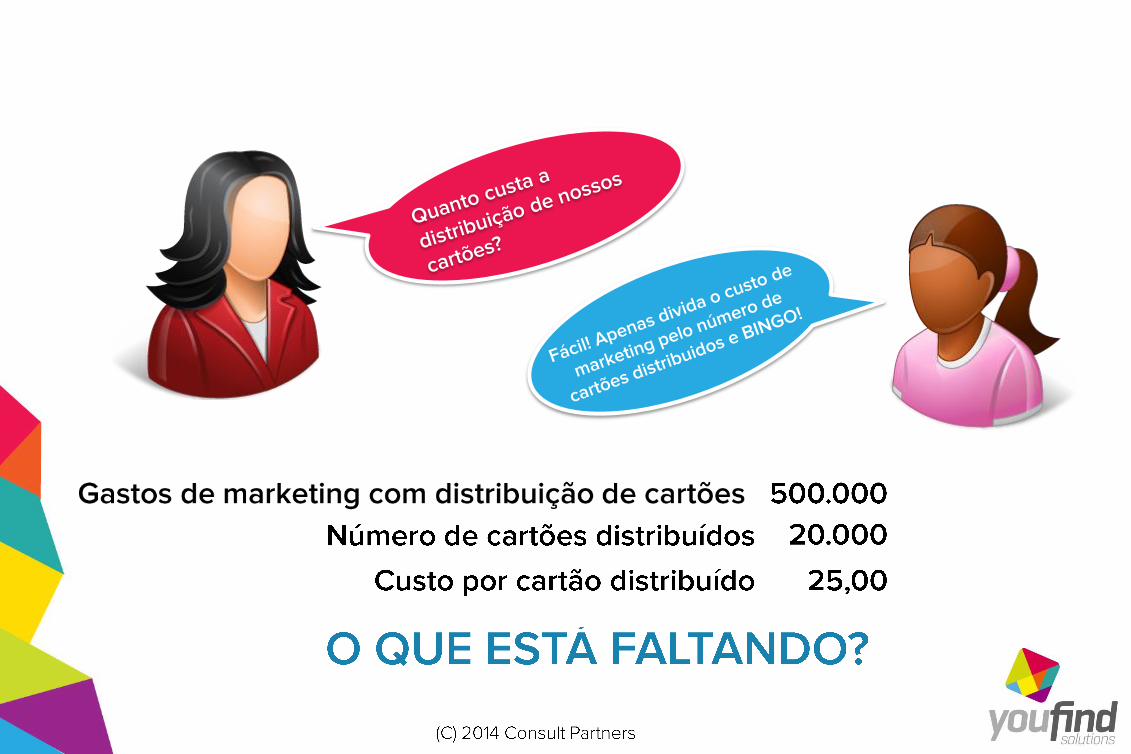
Answer:
R$ 250.000
•
•
•
Answer:
R$ 909.090.909
No seu planejamento de marketing, como você aplicaria a métrica do patrimônio médio de um homem em um bar?
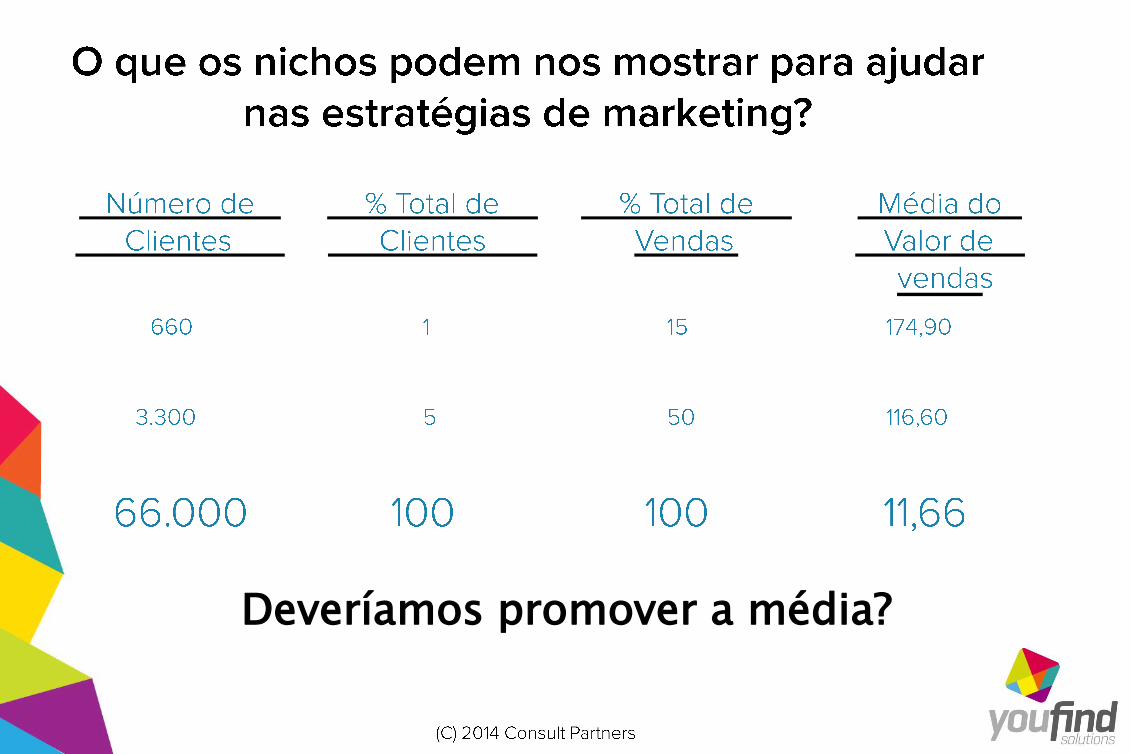
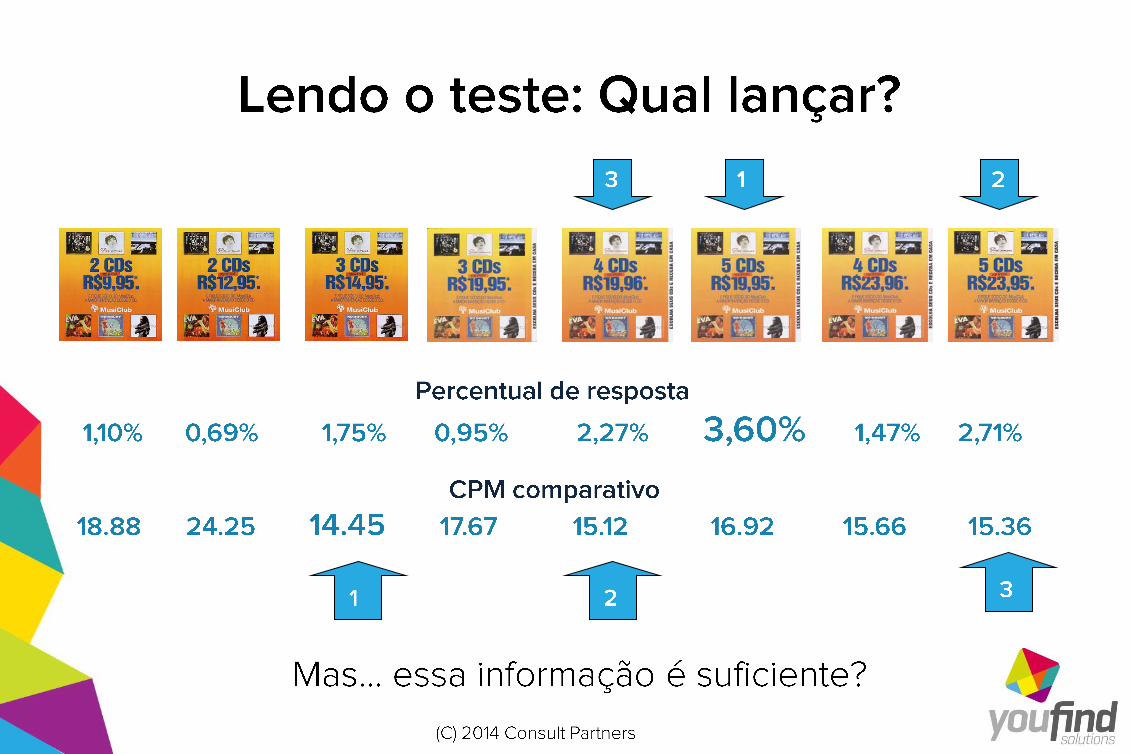
Deveríamos promover a média?

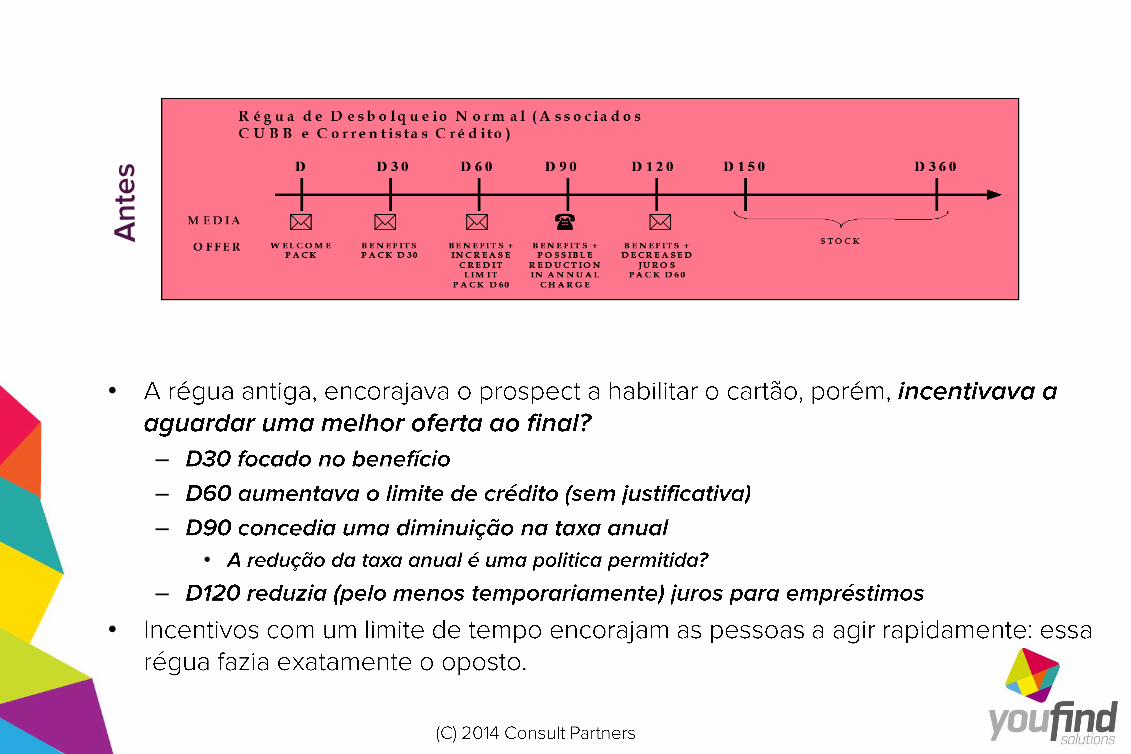
•
–
–
–
•
–
•
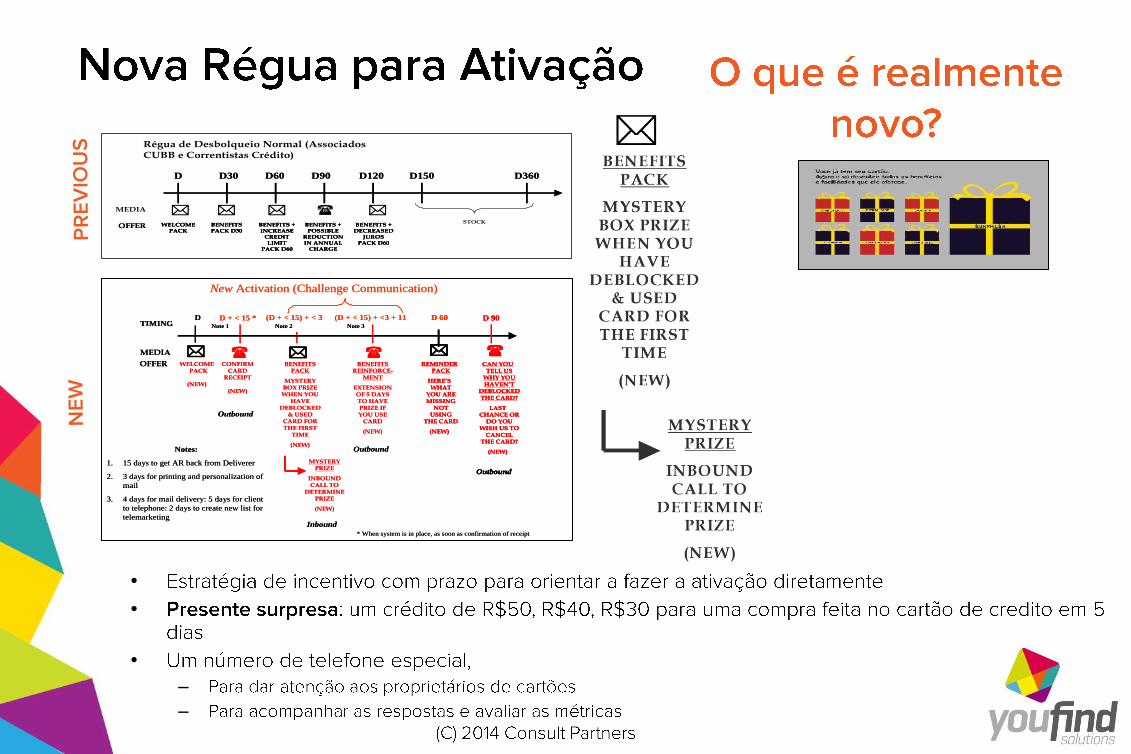
•
•
•
–
–
Régua de Desbolqueio Normal (Associados CUBB e Correntistas Crédito)
D D30 D60 D90 D120 D150 D360D D30 D60 D90 D120 D150 D360
STOCK
MEDIA
WELCOMEPACK
BENEFITSPACK D30
BENEFITS + INCREASE
CREDIT LIMIT
PACK D60
BENEFITS + DECREASED
JUROSPACK D60
BENEFITS + POSSIBLE
REDUCTION IN ANNUAL
CHARGE
OFFER WELCOMEPACK
BENEFITSPACK D30
BENEFITS + INCREASE
CREDIT LIMIT
PACK D60
BENEFITS + DECREASED
JUROSPACK D60
BENEFITS + POSSIBLE
REDUCTION IN ANNUAL
CHARGE
WELCOMEPACK
BENEFITSPACK D30
BENEFITS + INCREASE
CREDIT LIMIT
PACK D60
BENEFITS + DECREASED
JUROSPACK D60
BENEFITS + POSSIBLE
REDUCTION IN ANNUAL
CHARGE
OFFER
* When system is in place, as soon as confirmation of receipt
MEDIA
OFFER
D
D + < 15 *
CONFIRM
CARDRECEIPT
(NEW)
BENEFITS PACK
MYSTERY BOX PRIZE WHEN YOU
HAVE DEBLOCKED
& USED CARD FOR THE FIRST
TIME
(NEW)
(D + < 15) + < 3 (D + < 15) + <3 + 11
BENEFITS
REINFORCE-MENT
EXTENSION OF 5 DAYS TO HAVE PRIZE IF YOU USE
CARD
(NEW)
WELCOME PACK
(NEW)
New Activation (Challenge Communication)
TIMING
Outbound
Outbound
D 90
CAN YOU
TELL US WHY YOU HAVEN’T
DEBLOCKED THE CARD?
LAST CHANCE OR
DO YOU WISH US TO
CANCEL THE CARD?
(NEW)
Outbound
MYSTERY PRIZE
INBOUND CALL TO
DETERMINE PRIZE
(NEW)
Inbound
Notes:
1. 15 days to get AR back from Deliverer
2. 3 days for printing and personalization of
3. 4 days for mail delivery: 5 days for client
to telephone: 2 days to create new list for
telemarketing
Note 1 Note 3Note 2
REMINDER PACK
HERE’S WHAT
YOU ARE MISSING
NOT USING
THE CARD
(NEW)
D 60
* When system is in place, as soon as confirmation of receipt
MEDIA
OFFER
D
D + < 15 *
CONFIRM
CARDRECEIPT
(NEW)
BENEFITS PACK
MYSTERY BOX PRIZE WHEN YOU
HAVE DEBLOCKED
& USED CARD FOR THE FIRST
TIME
(NEW)
(D + < 15) + < 3 (D + < 15) + <3 + 11
BENEFITS
REINFORCE-MENT
EXTENSION OF 5 DAYS TO HAVE PRIZE IF YOU USE
CARD
(NEW)
WELCOME PACK
(NEW)
New Activation (Challenge Communication)
TIMING
Outbound
Outbound
D 90
CAN YOU
TELL US WHY YOU HAVEN’T
DEBLOCKED THE CARD?
LAST CHANCE OR
DO YOU WISH US TO
CANCEL THE CARD?
(NEW)
Outbound
D 90
CAN YOU
TELL US WHY YOU HAVEN’T
DEBLOCKED THE CARD?
LAST CHANCE OR
DO YOU WISH US TO
CANCEL THE CARD?
(NEW)
Outbound
MYSTERY PRIZE
INBOUND CALL TO
DETERMINE PRIZE
(NEW)
Inbound
Notes:
1. 15 days to get AR back from Deliverer
2. 3 days for printing and personalization of
3. 4 days for mail delivery: 5 days for client
to telephone: 2 days to create new list for
telemarketing
Note 1 Note 3Note 2
REMINDER PACK
HERE’S WHAT
YOU ARE MISSING
NOT USING
THE CARD
(NEW)
D 60
REMINDER PACK
HERE’S WHAT
YOU ARE MISSING
NOT USING
THE CARD
(NEW)
D 60
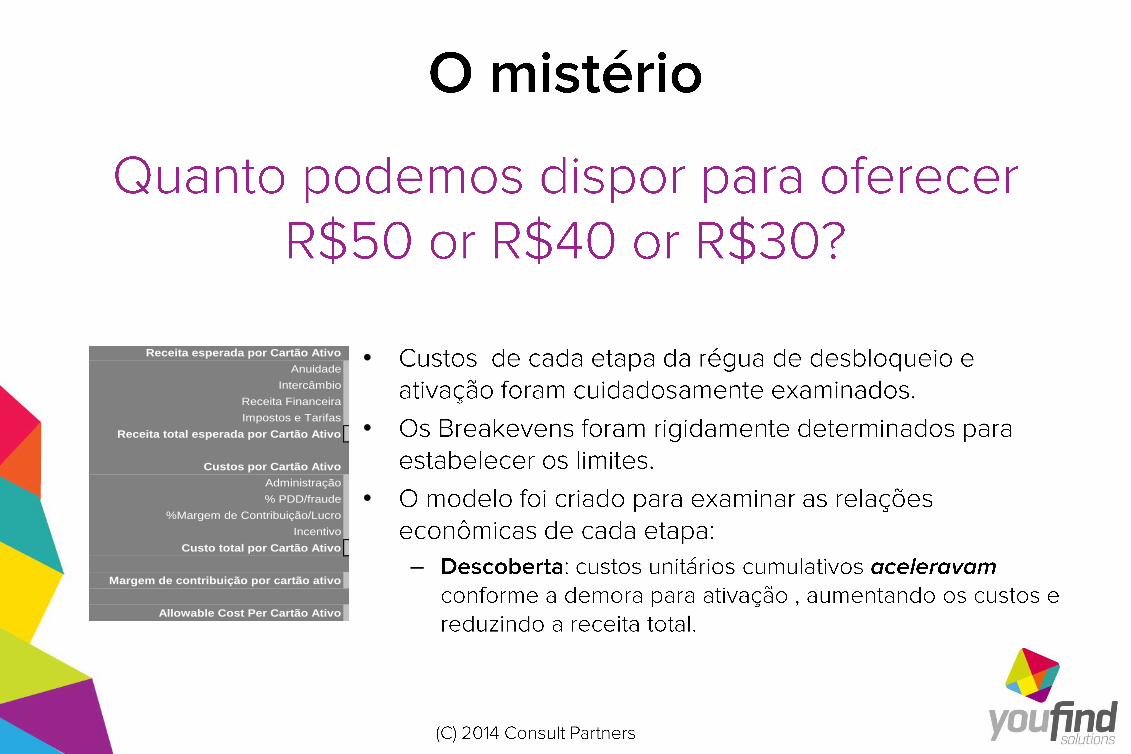
Receita esperada por Cartão Ativo
Anuidade 233.64
Intercâmbio 198.00
Receita Financeira 1,386.00
Impostos e Tarifas (158.40)
Receita total esperada por Cartão Ativo 1,659.24
Custos por Cartão Ativo
Administração 663.70
% PDD/fraude 497.77
%Margem de Contribuição/Lucro 248.89
Incentivo -
Custo total por Cartão Ativo 1,410.35
Margem de contribuição por cartão ativo 248.89
Allowable Cost Per Cartão Ativo 248.89
•
•
•
–
–
–
•
•
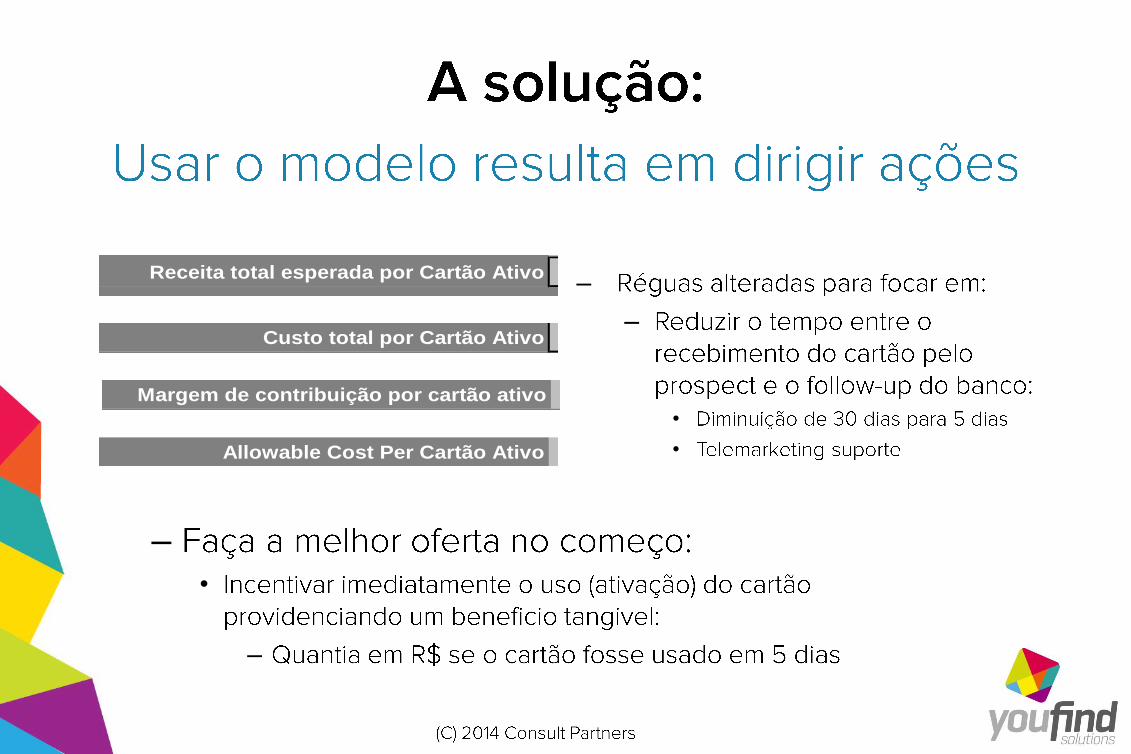
Receita esperada por Cartão Ativo
Anuidade 233.64
Intercâmbio 198.00
Receita Financeira 1,386.00
Impostos e Tarifas (158.40)
Receita total esperada por Cartão Ativo 1,659.24
Custos por Cartão Ativo
Administração 663.70
% PDD/fraude 497.77
%Margem de Contribuição/Lucro 248.89
Incentivo -
Custo total por Cartão Ativo 1,410.35
Margem de contribuição por cartão ativo 248.89
Allowable Cost Per Cartão Ativo 248.89
–•
–
•
•
•
•
•
Lucro Market Share or
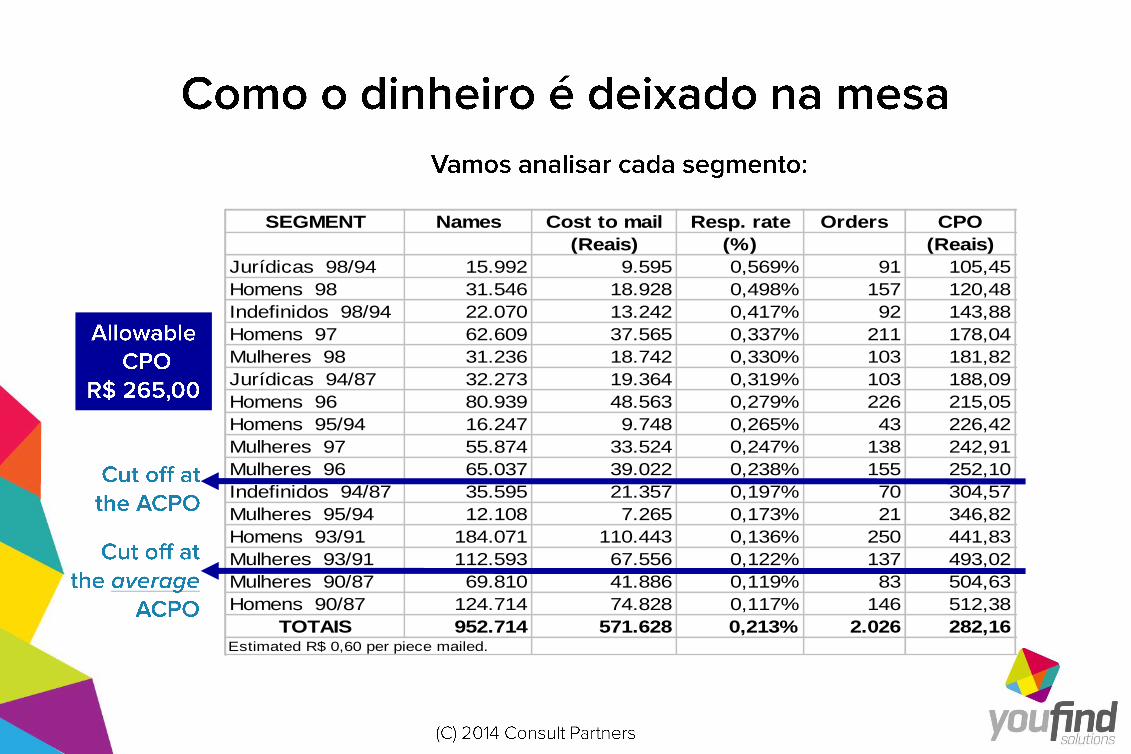
SEGMENT Names Cost to mail Resp. rate Orders CPO
(Reais) (%) (Reais)
Jurídicas 98/94 15.992 9.595 0,569% 91 105,45
Homens 98 31.546 18.928 0,498% 157 120,48
Indefinidos 98/94 22.070 13.242 0,417% 92 143,88
Homens 97 62.609 37.565 0,337% 211 178,04
Mulheres 98 31.236 18.742 0,330% 103 181,82
Jurídicas 94/87 32.273 19.364 0,319% 103 188,09
Homens 96 80.939 48.563 0,279% 226 215,05
Homens 95/94 16.247 9.748 0,265% 43 226,42
Mulheres 97 55.874 33.524 0,247% 138 242,91
Mulheres 96 65.037 39.022 0,238% 155 252,10
Indefinidos 94/87 35.595 21.357 0,197% 70 304,57
Mulheres 95/94 12.108 7.265 0,173% 21 346,82
Homens 93/91 184.071 110.443 0,136% 250 441,83
Mulheres 93/91 112.593 67.556 0,122% 137 493,02
Mulheres 90/87 69.810 41.886 0,119% 83 504,63
Homens 90/87 124.714 74.828 0,117% 146 512,38
TOTAIS 952.714 571.628 0,213% 2.026 282,16Estimated R$ 0,60 per piece mailed.
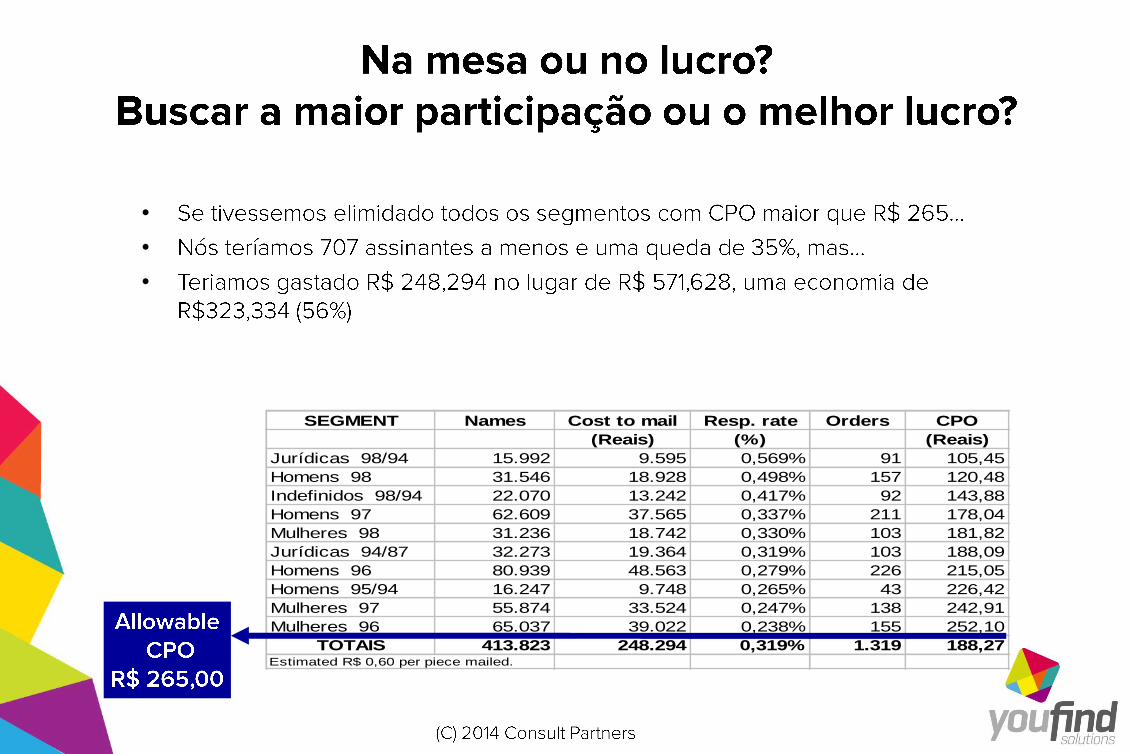
•
•
•
SEGMENT Names Cost to mail Resp. rate Orders CPO
(Reais) (%) (Reais)
Jurídicas 98/94 15.992 9.595 0,569% 91 105,45
Homens 98 31.546 18.928 0,498% 157 120,48
Indefinidos 98/94 22.070 13.242 0,417% 92 143,88
Homens 97 62.609 37.565 0,337% 211 178,04
Mulheres 98 31.236 18.742 0,330% 103 181,82
Jurídicas 94/87 32.273 19.364 0,319% 103 188,09
Homens 96 80.939 48.563 0,279% 226 215,05
Homens 95/94 16.247 9.748 0,265% 43 226,42
Mulheres 97 55.874 33.524 0,247% 138 242,91
Mulheres 96 65.037 39.022 0,238% 155 252,10
TOTAIS 413.823 248.294 0,319% 1.319 188,27Estimated R$ 0,60 per piece mailed.
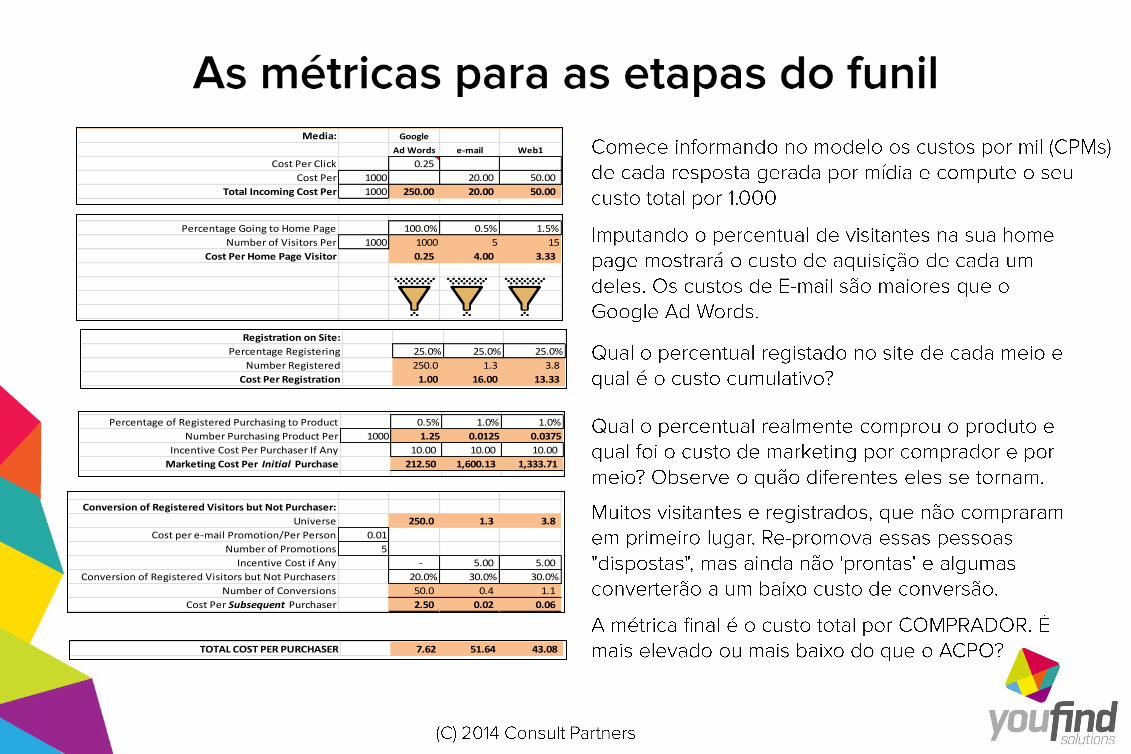
Media: Google
Ad Words e-mail Web1
Cost Per Click 0.25
Cost Per 1000 20.00 50.00
Total Incoming Cost Per 1000 250.00 20.00 50.00
Percentage Going to Home Page 100.0% 0.5% 1.5%
Number of Visitors Per 1000 1000 5 15
Cost Per Home Page Visitor 0.25 4.00 3.33
Registration on Site:
Percentage Registering 25.0% 25.0% 25.0%
Number Registered 250.0 1.3 3.8
Cost Per Registration 1.00 16.00 13.33
Percentage of Registered Purchasing to Product 0.5% 1.0% 1.0%
Number Purchasing Product Per 1000 1.25 0.0125 0.0375
Incentive Cost Per Purchaser If Any 10.00 10.00 10.00
Marketing Cost Per Initial Purchase 212.50 1,600.13 1,333.71
Conversion of Registered Visitors but Not Purchaser:
Universe 250.0 1.3 3.8
Cost per e-mail Promotion/Per Person 0.01
Number of Promotions 5
Incentive Cost if Any - 5.00 5.00
Conversion of Registered Visitors but Not Purchasers 20.0% 30.0% 30.0%
Number of Conversions 50.0 0.4 1.1
Cost Per Subsequent Purchaser 2.50 0.02 0.06
TOTAL COST PER PURCHASER 7.62 51.64 43.08
EVALUATION OF THE FUNNEL PROCESS
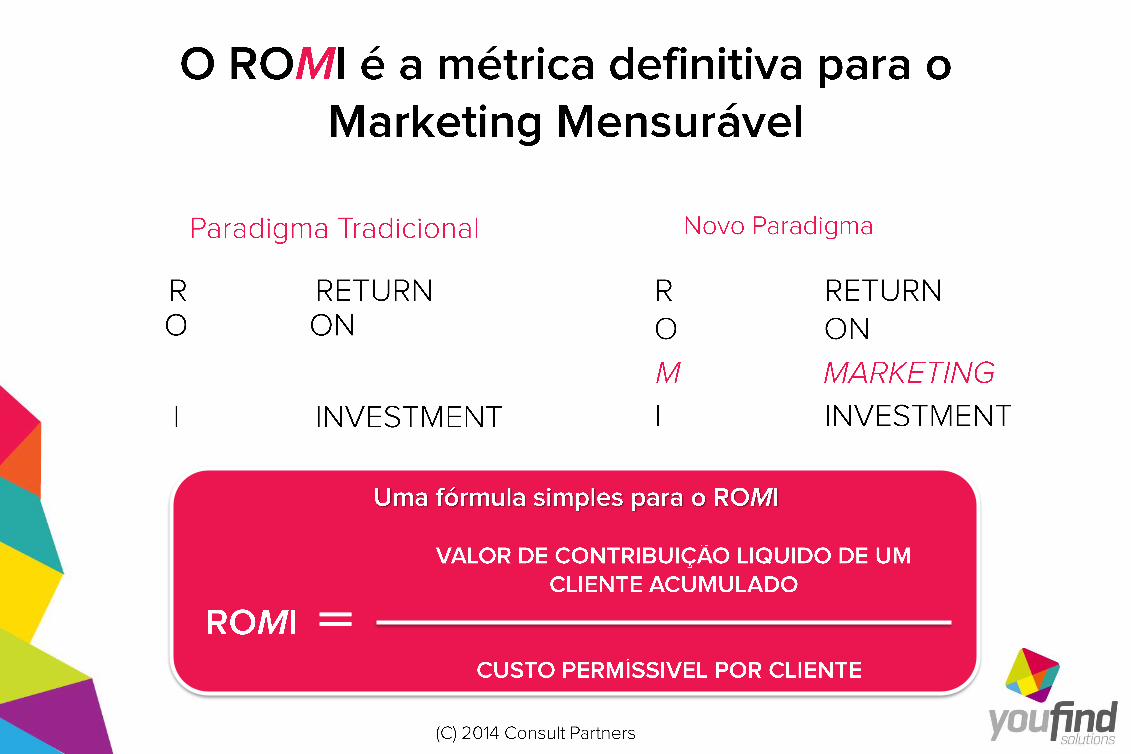
=
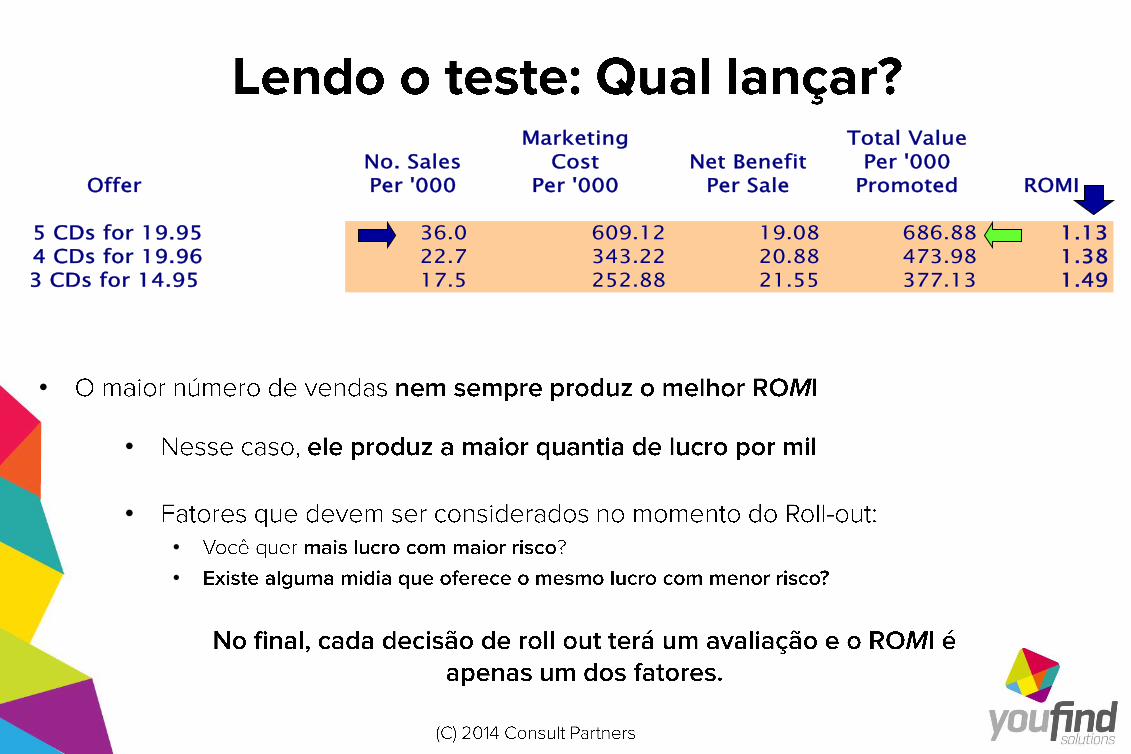
Marketing Total Value
No. Sales Cost Net Benefit Per '000
Offer Per '000 Per '000 Per Sale Promoted ROMI
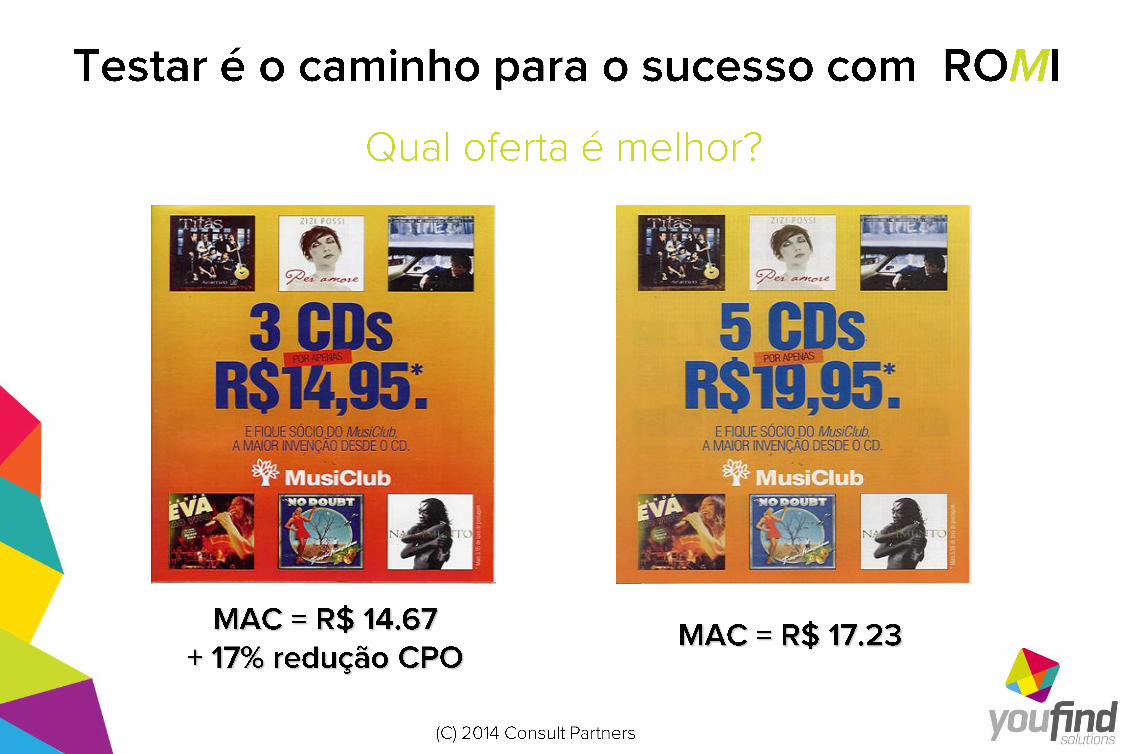
5 CDs for 19.95 36.0 609.12 19.08 686.88 1.13
4 CDs for 19.96 22.7 343.22 20.88 473.98 1.38
3 CDs for 14.95 17.5 252.88 21.55 377.13 1.49
•
•
•
•
•
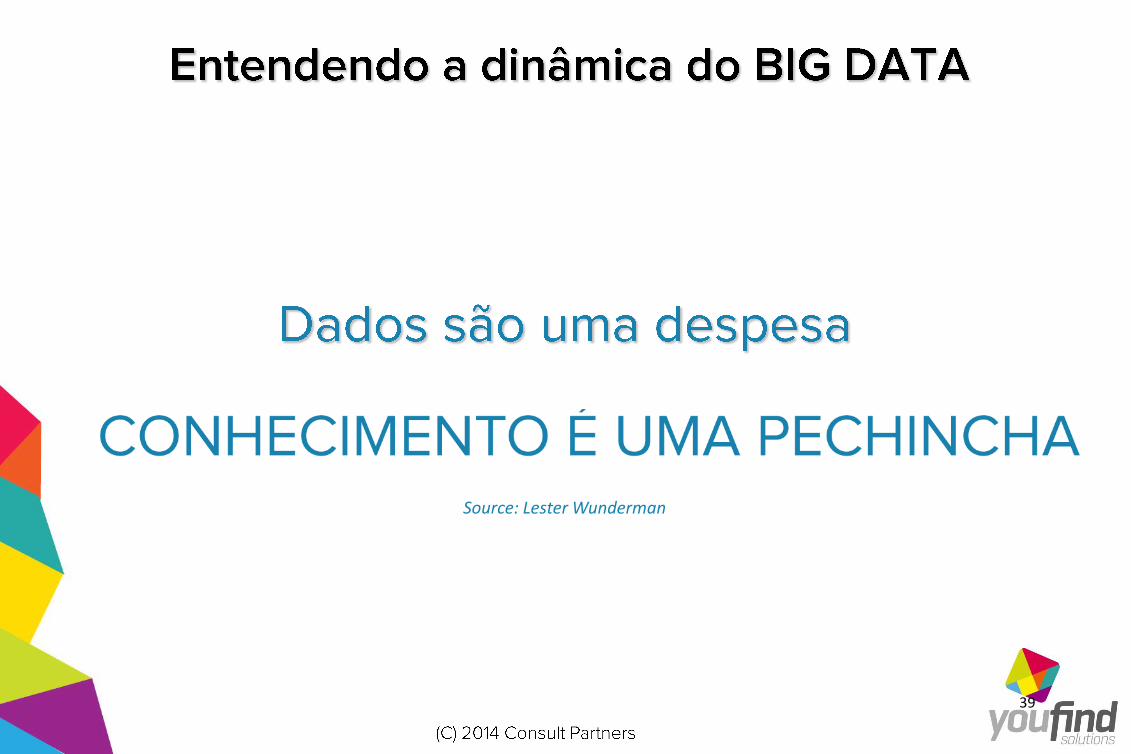
Source: Lester Wunderman
39
=
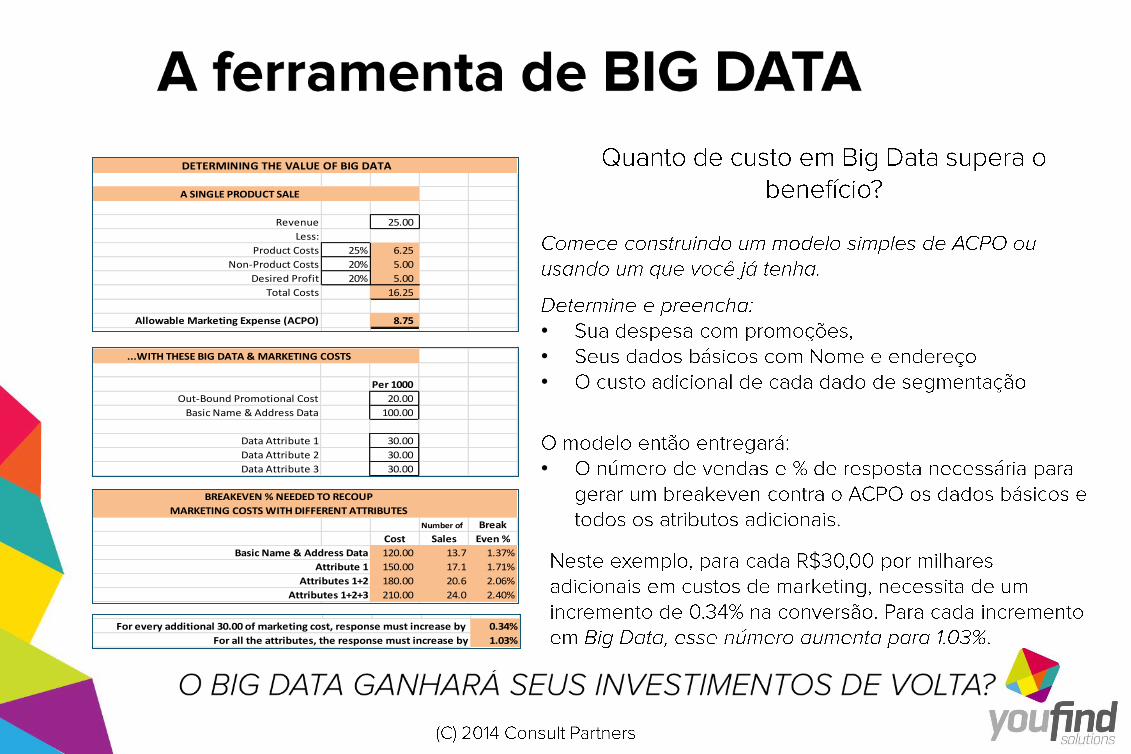
Revenue 25.00
Less:
Product Costs 25% 6.25
Non-Product Costs 20% 5.00
Desired Profit 20% 5.00
Total Costs 16.25
Allowable Marketing Expense (ACPO) 8.75
Per 1000
Out-Bound Promotional Cost 20.00
Basic Name & Address Data 100.00
Data Attribute 1 30.00
Data Attribute 2 30.00
Data Attribute 3 30.00
Number of Break
Cost Sales Even %
Basic Name & Address Data 120.00 13.7 1.37%
Attribute 1 150.00 17.1 1.71%
Attributes 1+2 180.00 20.6 2.06%
Attributes 1+2+3 210.00 24.0 2.40%
For every additional 30.00 of marketing cost, response must increase by 0.34%
For all the attributes, the response must increase by 1.03%
A SINGLE PRODUCT SALE
...WITH THESE BIG DATA & MARKETING COSTS
BREAKEVEN % NEEDED TO RECOUP
MARKETING COSTS WITH DIFFERENT ATTRIBUTES
DETERMINING THE VALUE OF BIG DATA
•
•
•
•
•
•