comparative dietary diversity and trophic ecology of two
TRANSCRIPT
Comparative Dietary Diversity and Trophic Ecology of TwoEstuarine Mesopredators
Andrea M. Kroetz1,2 & J. Marcus Drymon1,2& Sean P. Powers1,2
Received: 18 July 2015 /Revised: 1 November 2016 /Accepted: 4 November 2016# Coastal and Estuarine Research Federation 2016
Abstract Quantifying the trophic dynamics of mesopredatorsin coastal habitats is an essential precursor to understandingtheir role in linking multiple trophic levels. Traditional dietaryanalyses may miss key aspects of a species’ feeding ecologyand may thus fail to identify trophic linkages between preda-tors and economically important prey populations.We appliedstomach content and stable isotope analyses to estimate dietand trophic dynamics and investigated intraspecific dietarydiversity of bonnetheads (Sphyrna tiburo) and red drum(Sciaenops ocellatus). Both juvenile and adult bonnetheadsand juvenile red drum had diets comprised mainly of crusta-ceans, notably portunid crabs and penaeid shrimp, with vary-ing degrees of dietary and isotopic niche overlap. Juvenile andadult bonnetheads had high dietary and isotopic niche overlap,whereas the degree of overlap between bonnetheads and reddrum varied. Our findings indicate that bonnetheads are die-tary specialists whereas red drum are dietary generalists.Further analysis identified intraspecific variability in the dietof each species; adult bonnetheads had the highest prey diver-sity whereas red drum had the lowest. We show that dietaryand isotopic niche overlap and intraspecific variation in dietexist among juvenile and adult bonnetheads and juvenile reddrum, though to varying degrees. Our findings demonstratethe importance of fully examining the trophic ecology of
species that share habitats and resources, both at individualand population levels.
Keywords Stable isotopes . Stomach contents . Trophicecology . Dietary diversity . Coastal ecosystems . Estuarinefishes
Introduction
Food web structure is a compilation of the presence, abun-dance, and trophic interactions of all species within ecologicalcommunities. Mesopredators, here defined as trophically mid-ranking predators in a food web (Prugh et al. 2009), are oftenoverlooked but provide vital links between upper trophiclevels and primary consumers (Ritchie and Johnson 2009).Declines in large elasmobranchs (Ferretti et al. 2010; Wormet al. 2013; Dulvy et al. 2014) and other large predatory fish(Ward andMyers 2005; Kitchell et al. 2006) are well acknowl-edged and emphasize the importance of mesopredatorsthrough predation release and trophic cascades, particularlyin coastal ecosystems. Understanding trophic structure andpredator-prey interactions in coastal food webs is critical forpredicting the effects of predator declines and shifts in foodavailability attributed to human and natural causes (Garveyet al. 1998; Vander Zanden et al. 2000; Wetherbee andCortés 2004; Vaudo and Heithaus 2011).
Stomach content analysis is traditionally used to describethe diet of a species (Hyslop 1980) as it is a direct assessmentof what a predator has consumed. High taxonomic resolutioncan be achieved with this analysis and prey items can often bequantified; however, this type of analysis has limitations. Forexample, stomach contents only provide insight into what thepredator has eaten over relatively short time scales. In addi-tion, opportunistically consumed prey may appear to be an
Communicated by: Wayne S. Gardner
* Andrea M. [email protected]
1 Department of Marine Sciences, University of South Alabama,LSCB 25, Mobile, AL 36688, USA
2 Dauphin Island Sea Lab, 101 Bienville Blvd, DauphinIsland, AL 36528, USA
Estuaries and CoastsDOI 10.1007/s12237-016-0188-8
important dietary component, without being representative ofthe long-term diet. These issues could lead to errors inpredicting trophic levels (Polunin and Pinnegar 2002), andhence faulty inferences of the importance of predation on eco-nomically important prey. Stable isotope analysis provides acomplementary method that reduces biases associated withstomach content analysis. Carbon and nitrogen stable isotopevalues from consumed prey are assimilated and integrated intothe tissues of the consumer providing long-term dietary infor-mation (Fry 2006). Stable isotope analysis provides increasedanalytical capacity to understand food web structure and tro-phic interactions of populations. Using both techniques pro-vides a robust description of a species’ diet and its trophicrelationships.
Stomach content and stable isotope analyses provide theopportunity to describe intraspecific patterns and variation introphic interactions. Individual conspecific predators may usea variety of diet resources that are available, thus creatingvariation in trophic interactions (Bolnick et al. 2003).Quantifying dietary variability can provide insight into intra-and interspecific competition and potential resourcepartitioning that may occur. Recent studies suggest consider-able intraspecific variability in trophic interactions acrossmany taxa including large-bodied coastal predators (Matichet al. 2011; Kernaléguen et al. 2015; Rosenblatt et al. 2015).Understanding individual differences in diet is becoming anincreasingly important component to understanding trophicniche widths of predators (Rosenblatt et al. 2015). While in-traspecific variation has been increasingly characterized inlarge marine predators (Matich et al. 2011; Matich andHeithaus 2015; Rosenblatt et al. 2015), little information isavailable for mesopredators.
Bonnetheads (Sphyrna tiburo) and red drum (Sciaenopsocellatus) are important mesopredators in coastal ecosystems.Both species spend extensive portions of their lives in estuar-ies (Murphy and Taylor 1990; Compagno 1984). For exam-ple, larval and juvenile red drum depend on estuaries as nurs-ery habitat until maturity is reached at 3–6 years of age(Murphy and Taylor 1990; Rooker and Holt 1997).Similarly, bonnetheads spend considerable amounts of timewithin estuaries (Heupel et al. 2006; Ubeda et al. 2009) andoften return to specific estuaries over the course of severalyears (Driggers et al. 2014; Kroetz et al. 2015). Previous workhas shown considerable overlap in habitat use and trophicinteractions of these species, with red drum exhibiting moregeneralized diets (Overstreet and Heard 1978; Scharf andSchlight 2000; Facendola and Scharf 2012) than bonnetheads(Cortés et al. 1996). Both species have been suggested toundergo ontogenetic shifts in diet in the Gulf of Mexico(GOM; Llansó et al. 1998; Scharf and Schlight 2000; Betheaet al. 2007; Facendola and Scharf 2012) and have been docu-mented to consume crabs and shrimp with teleosts comprisinga larger portion of red drum diet compared with bonnetheads
(Overstreet and Heard 1978; Cortés et al. 1996; Scharf andSchlight 2000; Bethea et al. 2007; Facendola and Scharf2012). Despite these ecological similarities, the degree towhich individuals within these populations demonstrate tro-phic overlap remains unknown.
Given the documented spatial estuarine overlap, we initiateda comprehensive investigation to examine the trophic dynamicsof bonnetheads and red drum in the northern GOM. We usedcomplementary stomach content and stable isotope analyses,combined with metrics of dietary and isotopic niche overlapand intraspecific dietary variability to achieve a robust descrip-tion of the trophic dynamics between these co-occurringmesopredators. The goals of this study were to (1) describethe diet and identify the major dietary components of eachspecies and life stage, (2) assess the degree of dietary and iso-topic niche overlap between the two species, and (3) determinethe extent of intraspecific variation in the diet of each species.
Methods
Sample Collection
Juvenile and adult bonnetheads were collected primarily fromfishery-independent gillnet surveys conducted in the northernGOM, as well as opportunistically from commercial gillnetfishermen in Alabama state waters (Fig. 1). Bonnetheads col-lected for stomach samples weremeasured (stretch total lengthin cm), weighed (kg), and sex and life stage were determined.Bonnetheads were classified as either juvenile or adult basedonmaturity. Life stage for males was determined externally bythe development of the claspers following Clark and vonSchmidt (1965) and maturity in females was determined fromlength-maturity relationships in the GOM (Southeast Data,Assessment, and Review 2013). Red drum collected for stom-ach samples were obtained through the Alabama Departmentof Conservation and Natural Resources Marine ResourcesDivision (ADCNR MRD) monthly fishery-independent gill-net surveys and opportunistically from a fishery-dependentsurvey through the Alabama Deep Sea Fishing Rodeo(ADSFR) (Fig. 1). Red drum were measured (stretch totallength in cm), weighed (kg), and sexed. Red drum were alsoclassified as either juvenile or adult based onmaturity, and thiswas assessed based on length-at-age relationships for reddrum in the northern GOM (Hightower 2013). All stomachsamples for both species were collected from 2009 to 2014.Stomachs collected in the field were immediately placed onice and subsequently frozen in a −20 °C freezer. Potential preyitems of bonnetheads and red drum were collected byADCNR MRD Fisheries Assessment and MonitoringProgram (FAMP) trawl surveys conducted in MississippiSound and Mobile Bay, AL during the course of this study(Fig. 1). A 5-m otter trawl with 40 × 60-cmwooden doors, 35-
Estuaries and Coasts
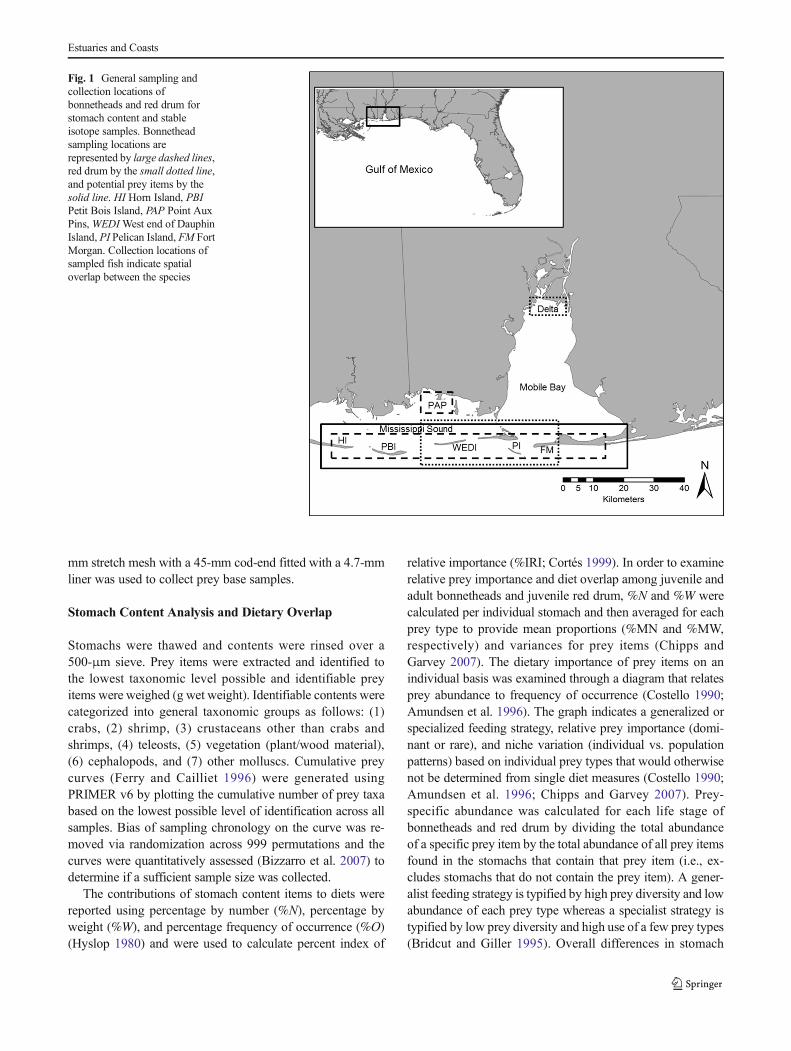
mm stretch mesh with a 45-mm cod-end fitted with a 4.7-mmliner was used to collect prey base samples.
Stomach Content Analysis and Dietary Overlap
Stomachs were thawed and contents were rinsed over a500-μm sieve. Prey items were extracted and identified tothe lowest taxonomic level possible and identifiable preyitems were weighed (g wet weight). Identifiable contents werecategorized into general taxonomic groups as follows: (1)crabs, (2) shrimp, (3) crustaceans other than crabs andshrimps, (4) teleosts, (5) vegetation (plant/wood material),(6) cephalopods, and (7) other molluscs. Cumulative preycurves (Ferry and Cailliet 1996) were generated usingPRIMER v6 by plotting the cumulative number of prey taxabased on the lowest possible level of identification across allsamples. Bias of sampling chronology on the curve was re-moved via randomization across 999 permutations and thecurves were quantitatively assessed (Bizzarro et al. 2007) todetermine if a sufficient sample size was collected.
The contributions of stomach content items to diets werereported using percentage by number (%N), percentage byweight (%W), and percentage frequency of occurrence (%O)(Hyslop 1980) and were used to calculate percent index of
relative importance (%IRI; Cortés 1999). In order to examinerelative prey importance and diet overlap among juvenile andadult bonnetheads and juvenile red drum, %N and %W werecalculated per individual stomach and then averaged for eachprey type to provide mean proportions (%MN and %MW,respectively) and variances for prey items (Chipps andGarvey 2007). The dietary importance of prey items on anindividual basis was examined through a diagram that relatesprey abundance to frequency of occurrence (Costello 1990;Amundsen et al. 1996). The graph indicates a generalized orspecialized feeding strategy, relative prey importance (domi-nant or rare), and niche variation (individual vs. populationpatterns) based on individual prey types that would otherwisenot be determined from single diet measures (Costello 1990;Amundsen et al. 1996; Chipps and Garvey 2007). Prey-specific abundance was calculated for each life stage ofbonnetheads and red drum by dividing the total abundanceof a specific prey item by the total abundance of all prey itemsfound in the stomachs that contain that prey item (i.e., ex-cludes stomachs that do not contain the prey item). A gener-alist feeding strategy is typified by high prey diversity and lowabundance of each prey type whereas a specialist strategy istypified by low prey diversity and high use of a few prey types(Bridcut and Giller 1995). Overall differences in stomach
Fig. 1 General sampling andcollection locations ofbonnetheads and red drum forstomach content and stableisotope samples. Bonnetheadsampling locations arerepresented by large dashed lines,red drum by the small dotted line,and potential prey items by thesolid line. HI Horn Island, PBIPetit Bois Island, PAP Point AuxPins,WEDIWest end of DauphinIsland, PI Pelican Island, FM FortMorgan. Collection locations ofsampled fish indicate spatialoverlap between the species
Estuaries and Coasts
content data among the three groups were assessed by a one-way multivariate analysis of similarity (ANOSIM) on a Bray-Curtis adjusted similarity index run in PRIMER v6.
Pianka’s niche overlap (Pianka 1976) was calculated using%W and %N and was compared with a null model (RA3algorithm, 1000 repetitions) to assess overlap. This null modelapproach was calculated in R statistical platform 3.1.1 usingthe package EcoSimR (Gotelli et al. 2015). Values of Pianka’sniche overlap index close to 0 reflect usage of exclusive re-source categories by the species being compared whereasvalues close to 1 reflect similar resource use at the alpha = 0.05significance level (Gotelli et al. 2015).
Stable Isotope and Niche Overlap Analysis
Muscle tissue from a subset of individuals examined for stom-ach content analysis was collected for stable isotope analysis.For this subset of individuals and for teleosts that were poten-tial prey items, a section of white muscle below the primarydorsal fin (Estrada et al. 2003; MacNeil et al. 2005) was ex-tracted. For all other potential prey items, white muscle tissuewas extracted from the organisms where available (i.e., clawsin crabs, mid-section of shrimp). In the laboratory, muscletissue was rinsed with deionized water and placed in aLabconco freeze-dry system and dried for a period of 24 h.Once completely dry, the muscle tissue was ground into a finepowder with a mortar and pestle and packed in tin capsules(Elementar Americas) in 2 mg (±0.05) aliquots for stable iso-tope analysis. Samples were sent to the University ofCalifornia Davis Stable Isotope Facility where a PDZEuropa ANCA-GSL elemental analyzer interfaced to a PDZEuropa 20/20 isotope ratio mass spectrometer (Sercon Ltd.,Cheshire, UK) was used to determine 13C/12C and 15N/14Nratios. During analysis, samples were interspersed with sever-al replicates of at least two different laboratory standards (pre-viously calibrated against NIST Standard Reference Materials(IAEA-N1, IAEA-N2, IAEA-N3, USGS-40, and USGS-41)with Pee Dee Belemnite as the standard reference material forC and atmospheric N2 for N. The experimental precision(standard deviation of replicates of the standard) for δ13Cwas 0.2 and 0.3 ‰ for δ15N. The C/N ratio of all predatorand potential prey item samples analyzed was <3.5; thus,lipids were not extracted from tissues (Post et al. 2007).
Differences in mean δ13C and δ15N of juvenile and adultbonnetheads and juvenile red drum were analyzed using mul-tivariate analysis of variance (MANOVA). Data for juvenileand adult bonnetheads were pooled if no significant differ-ences were found in mean δ13C and δ15N across sampledregions (Fig. 1) and year sampled. If significant differenceswere found, Bonferroni corrections were applied and pairwisecomparisons were used to determine which group or groupswere different. Assumptions of normality were assessed posthoc by examining the residuals from the MANOVA. To
determine if δ13C and δ15N signatures changed as a functionof body size (i.e., a proxy for ontogenetic shifts in diet), weused linear regression models. If no significant changes inδ13C and δ15N were present, then it was inferred that long-term diet did not change as the fish reached larger sizes. Therelative contributions of prey items to the isotopic signature ofbonnetheads and red drum were estimated using the isotopemixing model Stable Isotope Analysis in R (SIAR; Parnelland Jackson 2013). Three prey categories making up the ma-jority of dietary contributions as identified by stomach con-tents were used in the model to obtain defined results.
Quantitative metrics (known as Layman metrics) to assess tro-phic structure were calculated following Layman et al. (2007).Metrics included mean distance to centroid (CD), mean nearest-neighbor distance (M-NND), and standard deviation of nearest-neighbor distance (SD-NND). The CD provided the average de-gree of trophic diversity within a food web, and the M-NND andSD-NND represented density and evenness of species packing inisotopic niche space, respectively (Layman et al. 2007). To deter-mine isotopic niche width of each group sampled, a combinationof metrics was applied. Standard ellipse area (SEA) and total area(TA), as represented by convex hulls, were used to estimate theisotopic niches of sampled groups. Convex hull area (TA) encom-passes all samples from each species in the δ13C–δ15N bi-plotspace and represents the total amount of occupied niche spaceby a group (i.e., juvenile bonnetheads, adult bonnetheads, juvenilered drum); this then serves as a proxy for total extent of trophicdiversity within a food web (Layman et al. 2007). Standard ellipseareas corrected for sample size (SEAC) represent the bivariatestandard deviation of the data and are insensitive to bias associatedwith small sample size (Jackson et al. 2011). The SEAC can beused to identify potential interspecific competition for prey byevaluating the extent of overlap of the ellipse areas (Jacksonet al. 2011). The TA and SEAC were calculated using StableIsotope Bayesian Ellipses in R (SIBER) via the package SIAR(Jackson et al. 2011; Parnell and Jackson 2013).
Intraspecific Variation
Intraspecific variation in the diets of juvenile and adultbonnetheads and juvenile red drum was assessed on stomachcontent data using the Shannon-Weaver diversity index (H′)(Shannon and Weaver 1963). We analyzed each stomach sepa-rately to obtain a quantitative measure of prey diversity that wasconsumed by each animal. The higher the value of H′, the morediverse the diet is of that particular animal. We applied non-parametric Kruskal-Wallis test on the H′ values to determine ifthere were significant differences in prey diversity among juve-nile and adult bonnetheads and juvenile red drum. Pairwise mul-tiple comparisons among groups were assessed using Dunn’spost hoc analysis. Analyses were run in R using the packagesstats and PMCMR.
Estuaries and Coasts
Results
Bonnetheads
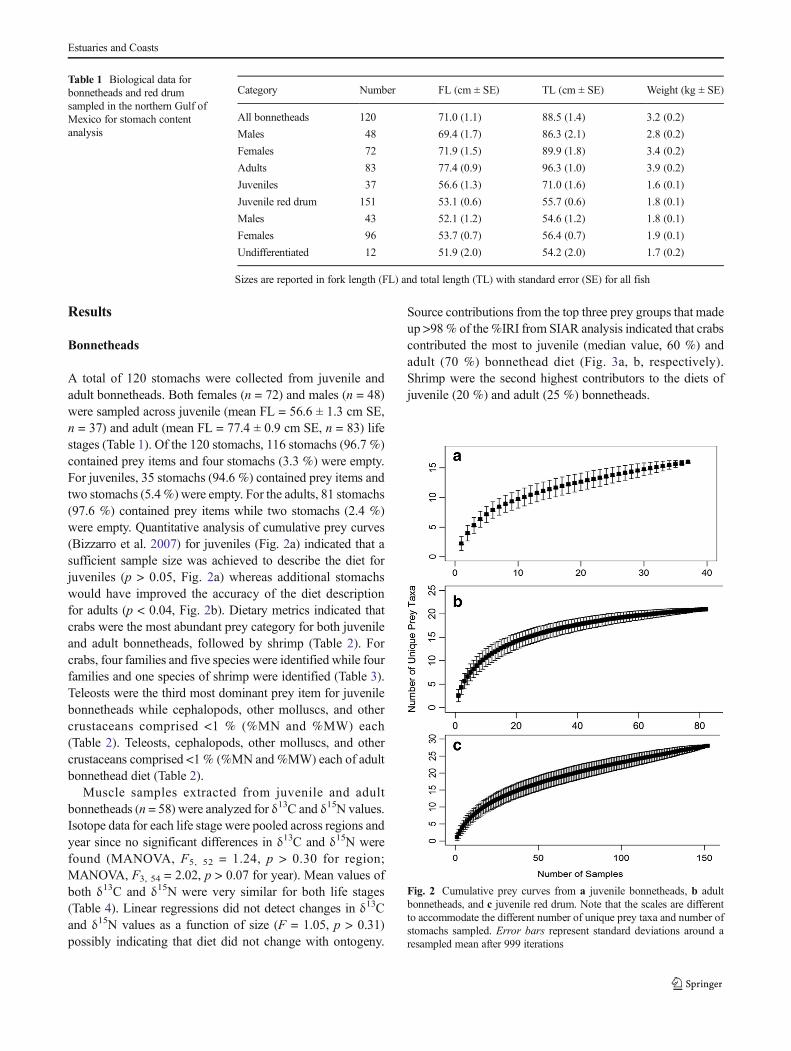
A total of 120 stomachs were collected from juvenile andadult bonnetheads. Both females (n = 72) and males (n = 48)were sampled across juvenile (mean FL = 56.6 ± 1.3 cm SE,n = 37) and adult (mean FL = 77.4 ± 0.9 cm SE, n = 83) lifestages (Table 1). Of the 120 stomachs, 116 stomachs (96.7 %)contained prey items and four stomachs (3.3 %) were empty.For juveniles, 35 stomachs (94.6 %) contained prey items andtwo stomachs (5.4%) were empty. For the adults, 81 stomachs(97.6 %) contained prey items while two stomachs (2.4 %)were empty. Quantitative analysis of cumulative prey curves(Bizzarro et al. 2007) for juveniles (Fig. 2a) indicated that asufficient sample size was achieved to describe the diet forjuveniles (p > 0.05, Fig. 2a) whereas additional stomachswould have improved the accuracy of the diet descriptionfor adults (p < 0.04, Fig. 2b). Dietary metrics indicated thatcrabs were the most abundant prey category for both juvenileand adult bonnetheads, followed by shrimp (Table 2). Forcrabs, four families and five species were identified while fourfamilies and one species of shrimp were identified (Table 3).Teleosts were the third most dominant prey item for juvenilebonnetheads while cephalopods, other molluscs, and othercrustaceans comprised <1 % (%MN and %MW) each(Table 2). Teleosts, cephalopods, other molluscs, and othercrustaceans comprised <1 % (%MN and %MW) each of adultbonnethead diet (Table 2).
Muscle samples extracted from juvenile and adultbonnetheads (n = 58) were analyzed for δ13C and δ15N values.Isotope data for each life stage were pooled across regions andyear since no significant differences in δ13C and δ15N werefound (MANOVA, F5, 52 = 1.24, p > 0.30 for region;MANOVA, F3, 54 = 2.02, p > 0.07 for year). Mean values ofboth δ13C and δ15N were very similar for both life stages(Table 4). Linear regressions did not detect changes in δ13Cand δ15N values as a function of size (F = 1.05, p > 0.31)possibly indicating that diet did not change with ontogeny.
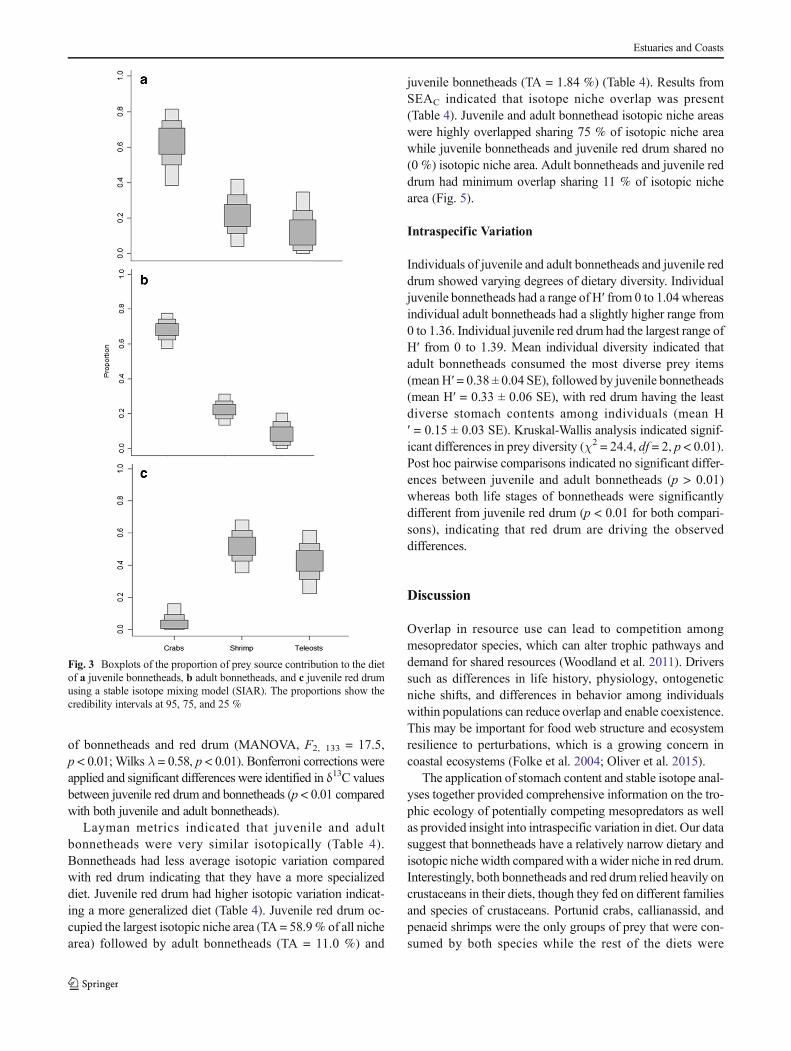
Source contributions from the top three prey groups that madeup >98% of the %IRI from SIAR analysis indicated that crabscontributed the most to juvenile (median value, 60 %) andadult (70 %) bonnethead diet (Fig. 3a, b, respectively).Shrimp were the second highest contributors to the diets ofjuvenile (20 %) and adult (25 %) bonnetheads.
Table 1 Biological data forbonnetheads and red drumsampled in the northern Gulf ofMexico for stomach contentanalysis
Category Number FL (cm ± SE) TL (cm ± SE) Weight (kg ± SE)
All bonnetheads 120 71.0 (1.1) 88.5 (1.4) 3.2 (0.2)
Males 48 69.4 (1.7) 86.3 (2.1) 2.8 (0.2)
Females 72 71.9 (1.5) 89.9 (1.8) 3.4 (0.2)
Adults 83 77.4 (0.9) 96.3 (1.0) 3.9 (0.2)
Juveniles 37 56.6 (1.3) 71.0 (1.6) 1.6 (0.1)
Juvenile red drum 151 53.1 (0.6) 55.7 (0.6) 1.8 (0.1)
Males 43 52.1 (1.2) 54.6 (1.2) 1.8 (0.1)
Females 96 53.7 (0.7) 56.4 (0.7) 1.9 (0.1)
Undifferentiated 12 51.9 (2.0) 54.2 (2.0) 1.7 (0.2)
Sizes are reported in fork length (FL) and total length (TL) with standard error (SE) for all fish
Fig. 2 Cumulative prey curves from a juvenile bonnetheads, b adultbonnetheads, and c juvenile red drum. Note that the scales are differentto accommodate the different number of unique prey taxa and number ofstomachs sampled. Error bars represent standard deviations around aresampled mean after 999 iterations
Estuaries and Coasts

Red Drum
Red drum stomach contents were analyzed from 151 individ-uals. Mean fork length of red drum sampled was 53.1 cm(±0.6 mm SE) and both male (n = 43), female (n = 96), andundetermined (i.e., sex could not be determined due to unde-veloped ovaries or testes; n = 12) red drum were sampled(Table 1). Based on recent length-at-age data for this speciesin the northern GOM, the red drum collected for this study fallwithin the size range of fish age 0–3 years and were thusclassified as juveniles (Hightower 2013). Of the 151 stomachsanalyzed, 105 (69.5 %) contained prey items and 46 (30.5 %)stomachs were empty. Analysis of the cumulative prey curvefor red drum (Fig. 2c) indicated that a sufficient sample sizewas reached (p > 0.05) to describe the diet. Shrimp were the
most abundant prey category closely followed by crabs(Table 2). For shrimp, three families were identified whereasfour families and one species of crab were identified (Table 3).Teleosts were the third most important prey category (Table 2)with six families and five species able to be identified(Table 3). Cephalopods, other molluscs, and other crustaceanscomprised <1 % (%MN and %MW) each of the diet of juve-nile red drum.
Muscle samples (n = 78) extracted from individualsretained for stomach content analysis were analyzed forδ13C and δ15N values for comparison with bonnetheads.
Table 2 Dietarymetrics representingmean percent by number (%MN),mean percent byweight (%MW), percent occurrence (%O), percent indexof relative importance (%IRI), and relative prey importance (Pi) as afunction of broad prey category for juvenile and adult bonnetheads andjuvenile red drum
Prey taxon %MN(±SE)
%MW(±SE)
%O %IRI %Pi
Crabs
Adult bonnethead 71.9 (3.7) 76.9 (4.1) 95.10 87.90 85.90
Juvenile bonnethead 58.7 (7.0) 64.1 (7.1) 85.70 83.80 78.00
Juvenile red drum 33.3 (4.2) 31.3 (4.2) 43.80 33.40 58.50
Shrimp
Adult bonnethead 23.8 (3.5) 15.1 (3.2) 44.40 10.60 30.20
Juvenile bonnethead 26.9 (6.3) 21.0 (5.9) 40.00 14.70 47.60
Juvenile red drum 39.6 (4.3) 41.7 (4.4) 51.40 49.40 68.10
Teleosts
Adult bonnethead 0.48 (0.3) 0.04 (0.0) 2.50 0.01 39.50
Juvenile bonnethead 6.10 (3.2) 7.40 (3.9) 14.30 1.50 54.20
Juvenile red drum 25.8 (3.8) 25.7 (3.9) 37.10 22.50 72.70
Cephalopods
Adult bonnethead 0.30 (0.3) 0.05 (0.1) 1.20 0.00 40.80
Juvenile bonnethead 0.00 (0.0) 0.00 (0.0) 0.00 0.00 0.00
Juvenile red drum 0.24 (0.2) 0.01 (0.0) 0.95 0.00 1.60
Other Molluscs
Adult bonnethead 0.70 (0.5) 0.02 (0.0) 2.50 0.01 0.79
Juvenile bonnethead 0.69 (0.7) 0.09 (0.1) 2.90 0.02 3.20
Juvenile red drum 0.07 (0.1) 0.02 (0.0) 0.95 0.00 2.20
Other crustaceans
Adult bonnethead 0.41 (0.3) 0.04 (0.0) 2.50 0.00 2.00
Juvenile bonnethead 0.00 (0.0) 0.00 (0.0) 0.00 0.00 0.00
Juvenile red drum 0.00 (0.0) 0.00 (0.0) 0.00 0.00 0.00
Plant material
Adult bonnethead – 0.64 (0.3) 13.60 – 2.80
Juvenile bonnethead – 3.98 (2.8) 31.40 – 1.90
Juvenile red drum – 1.18 (0.8) 14.30 – 4.30
Table 3 Reported stomach contents of juvenile and adult bonnetheadsand juvenile red drum collected in this study
Prey Category Juvenilebonnethead
Adultbonnethead
Juvenile reddrum
CrabsFamilyAlbuneidae XDiogenidae XMenippidae XPinnotheridae XPolybiidae X XPortunidae X X XXanthidae X
SpeciesArenaeus cribrarius X XCallinectes sapidus X X XCallinectes similis XClibanarius vittatus XOvalipes floridanus X X
ShrimpFamilyAlpheidae X XCallianassidae X X XPalaemonidae XPenaeidae X X XSquillidae X X
SpeciesSquilla empusa X X
CephalopodsFamilyLoliginidae X X
FishesFamilyBatrachoididae XBlenniidae XClupeidae XEngraulidae XSciaenidae XTrichiuridae X
SpeciesAnchoa mitchilli XBrevoortia patronus XCynoscion arenarius XMicropogonias undulatus XOpsanus tau XUnidentifiable fish X X X
PlantPlant matter (seagrass, twigs) X X X
Prey items were identified to the lowest taxonomic level possible and BX^denotes when a prey item was present in the stomach
Estuaries and Coasts
Significant differences in geographic sampling were found(MANOVA, F5, 72 = 3.40, p < 0.01; Wilks λ = 0.63,p < 0.01) for δ13C and δ15N. Pairwise comparisons identifiedone of the six locations (Mississippi Sound) differed in δ13C(p < 0.01) and thus this location was removed from the pooleddata. The mean δ13C and δ15N values were slightly moreenriched and depleted, respectively, compared withbonnetheads (Table 4). Linear regressions did not detectchanges in δ13C and δ15N values as a function of total length(F = 0.30, p > 0.59) possibly indicating that red drum diet didnot change with ontogeny. Source contributions from the topthree prey groups that made up >98 % of the %IRI from SIARanalysis indicated that shrimp were the most important con-tributors to the diet (median value, 55 %) followed by teleosts(45 %) (Fig. 3c).
Dietary Overlap
Pianka’s overlap index indicated that dietary niche overlap waspresent between juvenile and adult bonnetheads with varyingdegrees of overlap between bonnetheads and red drum(Table 4). With respect to %W, overlap of juvenile and adultbonnetheads was significant (0.90; p = 0.02); similarly, highoverlap (0.94; p = 0.06) was shown with respect to %N.Juvenile bonnetheads and juvenile red drum had significant over-lap (0.87; p = 0.02) with respect to %W and less overlap (0.61;p = 0.23) when calculated with %N. Adult bonnetheads andjuvenile red drum had non-significant dietary overlap with re-spect to %W (0.56; p = 0.30) and %N (0.45; p = 0.30). In thefeeding strategy diagram for bonnetheads, crabs were in the up-per right quadrant indicating that this was a dominant prey cate-gory and had a high contribution to dietary niche width for bothjuveniles and adults (Fig. 4a, b). Shrimp were located in theupper right quadrant for red drum (Fig. 4c) indicating that theywere a dominant prey category and also contributed the most tothe dietary niche of this species, closely followed by crabs. Theprey categories represented in the lower left quadrant were rare
occurrences in the diet and contributed very little to the dietaryniche in terms of prey-specific weight. For the bonnetheads andred drum, this included molluscs, cephalopods, other crusta-ceans, and plant material (Fig. 4). Teleosts were considered rarefor adult bonnetheads (Fig. 4b) whereas they contributed slightlymore to the diet of juvenile bonnetheads but still relatively rare(Fig. 4a). Teleosts were indicated as the third most dominant andimportant prey category that contributed to the diet of juvenilered drum. Multivariate analysis of the stomach content data re-vealed significant differences among the three groups (globalR = 0.22, p < 0.001). Pairwise comparisons indicated significantdifferences between both juvenile bonnetheads and juvenile reddrum (R = 0.20, p < 0.01) and between adult bonnetheads andjuvenile red drum (R = 0.30, p < 0.01). Significant differenceswere found between juvenile and adult bonnetheads (R = 0.14,p < 0.01) but to a lesser degree indicating that the stomach con-tents of these two groups are more similar to one another. Valuesof δ15N from bonnetheads with fish in their stomachs were com-pared with δ15N values from bonnetheads without fish in theirstomachs to determine if teleosts could have been assimilatedinto tissues over a longer time period. No significant differences(all bonnetheads ANOVA, F1, 54 = 0.56, p > 0.46) were foundindicating that though not all bonnethead stomachs containedteleosts at the time of analysis, for those individuals withoutteleosts in their stomachs at the time of sampling, teleosts mayhave still been incorporated into the dietary isotopic signatureover time. Following Bridcut and Giller (1995), results indicatedthat juvenile and adult bonnetheads followed more of a specialistdiet strategy with some supplementation or opportunistic feedingon teleosts while red drum followed a generalist strategy.
Isotopic Niche Overlap
In general, juvenile red drum had the largest range in δ15N andδ13C values and were the most enriched in 15N (Fig. 5).Bonnetheads were more enriched in 13C compared with reddrum. There was a significant difference in δ13C and δ15N values
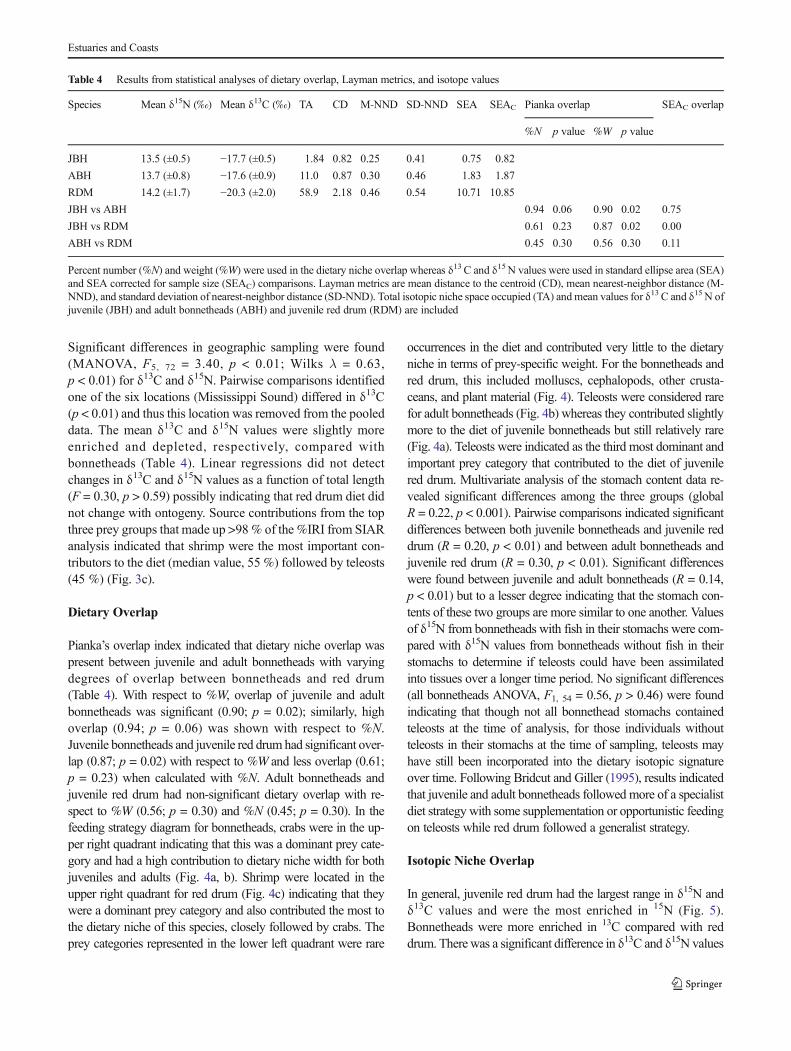
Table 4 Results from statistical analyses of dietary overlap, Layman metrics, and isotope values
Species Mean δ15N (‰) Mean δ13C (‰) TA CD M-NND SD-NND SEA SEAC Pianka overlap SEAC overlap
%N p value %W p value
JBH 13.5 (±0.5) −17.7 (±0.5) 1.84 0.82 0.25 0.41 0.75 0.82
ABH 13.7 (±0.8) −17.6 (±0.9) 11.0 0.87 0.30 0.46 1.83 1.87
RDM 14.2 (±1.7) −20.3 (±2.0) 58.9 2.18 0.46 0.54 10.71 10.85
JBH vs ABH 0.94 0.06 0.90 0.02 0.75
JBH vs RDM 0.61 0.23 0.87 0.02 0.00
ABH vs RDM 0.45 0.30 0.56 0.30 0.11
Percent number (%N) and weight (%W) were used in the dietary niche overlap whereas δ13 C and δ15N values were used in standard ellipse area (SEA)and SEA corrected for sample size (SEAC) comparisons. Layman metrics are mean distance to the centroid (CD), mean nearest-neighbor distance (M-NND), and standard deviation of nearest-neighbor distance (SD-NND). Total isotopic niche space occupied (TA) andmean values for δ13 C and δ15 N ofjuvenile (JBH) and adult bonnetheads (ABH) and juvenile red drum (RDM) are included
Estuaries and Coasts
of bonnetheads and red drum (MANOVA, F2, 133 = 17.5,p < 0.01; Wilks λ = 0.58, p < 0.01). Bonferroni corrections wereapplied and significant differences were identified in δ13C valuesbetween juvenile red drum and bonnetheads (p < 0.01 comparedwith both juvenile and adult bonnetheads).
Layman metrics indicated that juvenile and adultbonnetheads were very similar isotopically (Table 4).Bonnetheads had less average isotopic variation comparedwith red drum indicating that they have a more specializeddiet. Juvenile red drum had higher isotopic variation indicat-ing a more generalized diet (Table 4). Juvenile red drum oc-cupied the largest isotopic niche area (TA = 58.9% of all nichearea) followed by adult bonnetheads (TA = 11.0 %) and
juvenile bonnetheads (TA = 1.84 %) (Table 4). Results fromSEAC indicated that isotope niche overlap was present(Table 4). Juvenile and adult bonnethead isotopic niche areaswere highly overlapped sharing 75 % of isotopic niche areawhile juvenile bonnetheads and juvenile red drum shared no(0 %) isotopic niche area. Adult bonnetheads and juvenile reddrum had minimum overlap sharing 11 % of isotopic nichearea (Fig. 5).
Intraspecific Variation
Individuals of juvenile and adult bonnetheads and juvenile reddrum showed varying degrees of dietary diversity. Individualjuvenile bonnetheads had a range of H′ from 0 to 1.04 whereasindividual adult bonnetheads had a slightly higher range from0 to 1.36. Individual juvenile red drum had the largest range ofH′ from 0 to 1.39. Mean individual diversity indicated thatadult bonnetheads consumed the most diverse prey items(mean H′ = 0.38 ± 0.04 SE), followed by juvenile bonnetheads(mean H′ = 0.33 ± 0.06 SE), with red drum having the leastdiverse stomach contents among individuals (mean H′ = 0.15 ± 0.03 SE). Kruskal-Wallis analysis indicated signif-icant differences in prey diversity (χ2 = 24.4, df = 2, p < 0.01).Post hoc pairwise comparisons indicated no significant differ-ences between juvenile and adult bonnetheads (p > 0.01)whereas both life stages of bonnetheads were significantlydifferent from juvenile red drum (p < 0.01 for both compari-sons), indicating that red drum are driving the observeddifferences.
Discussion
Overlap in resource use can lead to competition amongmesopredator species, which can alter trophic pathways anddemand for shared resources (Woodland et al. 2011). Driverssuch as differences in life history, physiology, ontogeneticniche shifts, and differences in behavior among individualswithin populations can reduce overlap and enable coexistence.This may be important for food web structure and ecosystemresilience to perturbations, which is a growing concern incoastal ecosystems (Folke et al. 2004; Oliver et al. 2015).
The application of stomach content and stable isotope anal-yses together provided comprehensive information on the tro-phic ecology of potentially competing mesopredators as wellas provided insight into intraspecific variation in diet. Our datasuggest that bonnetheads have a relatively narrow dietary andisotopic niche width comparedwith a wider niche in red drum.Interestingly, both bonnetheads and red drum relied heavily oncrustaceans in their diets, though they fed on different familiesand species of crustaceans. Portunid crabs, callianassid, andpenaeid shrimps were the only groups of prey that were con-sumed by both species while the rest of the diets were
Fig. 3 Boxplots of the proportion of prey source contribution to the dietof a juvenile bonnetheads, b adult bonnetheads, and c juvenile red drumusing a stable isotope mixing model (SIAR). The proportions show thecredibility intervals at 95, 75, and 25 %
Estuaries and Coasts
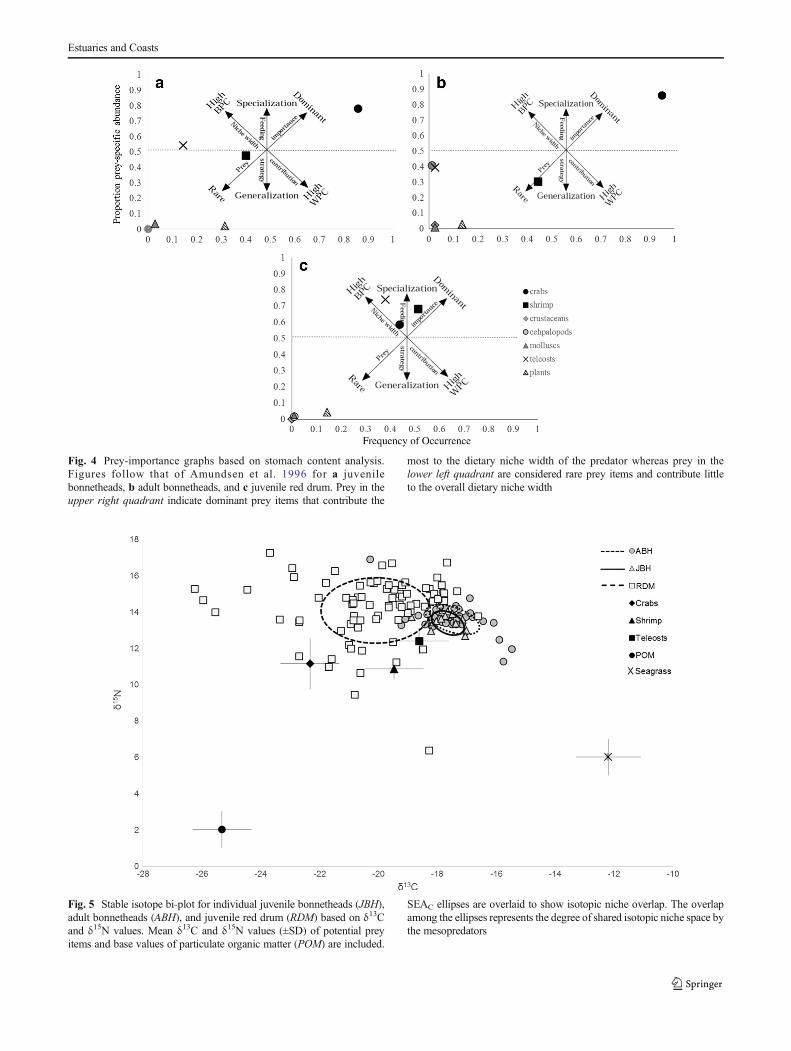
Fig. 4 Prey-importance graphs based on stomach content analysis.Figures follow that of Amundsen et al. 1996 for a juvenilebonnetheads, b adult bonnetheads, and c juvenile red drum. Prey in theupper right quadrant indicate dominant prey items that contribute the
most to the dietary niche width of the predator whereas prey in thelower left quadrant are considered rare prey items and contribute littleto the overall dietary niche width
Fig. 5 Stable isotope bi-plot for individual juvenile bonnetheads (JBH),adult bonnetheads (ABH), and juvenile red drum (RDM) based on δ13Cand δ15N values. Mean δ13C and δ15N values (±SD) of potential preyitems and base values of particulate organic matter (POM) are included.
SEAC ellipses are overlaid to show isotopic niche overlap. The overlapamong the ellipses represents the degree of shared isotopic niche space bythe mesopredators
Estuaries and Coasts
comprised of different crustacean prey. Differences in con-sumed prey groups could be attributed to availability of prey,dietary preferences, predator behavior, foraging strategies, orenergetic needs (Valiela 1995). Any one or a combination ofthese factors can lead to resource partitioning that may allowfor coexistence of these mesopredators. Differences in habitatuse and/or physiological tolerances between these speciesmay also account for differences in the diet trends that weobserved. Temperature and salinity have been identified asimportant factors that drive bonnethead distribution and hab-itat use (Ubeda et al. 2009; Froeschke et al. 2010, Kroetz et al.2015). Red drum associate with abiotic and biotic factors inboth age- and region-specific ways (Bacheler et al. 2009).Fluctuations in abiotic factors within our study region mayhave driven differential habitat use by the mesopredators,which could have affected what prey were available for con-sumption. Changes in mesopredator diversity, abundance, andbehavior can also lead to changes in food web dynamics(Ritchie and Johnson 2009; Baum and Worm 2009). Withinour study region, other mesopredators were likely present andmay have competed for prey resources, which could havecontributed to the differences we observed. Both Atlanticsharpnose sharks (Rhizoprionodon terraenovae) and blacktipsharks (Carcharhinus limbatus) inhabit our study area. Bothof these species have a diet comprised mainly of teleosts, butthey also consume crabs and shrimp within our study region(Hoffmayer and Parsons 2003; Drymon et al. 2012). Thispotential competition by other mesopredators may have influ-enced what prey were consumed and observed in our analysis.
We observed considerable differences in red drum andbonnethead dietary diversity. Red drum had significantly low-er prey diversity in their diets compared with bonnetheads.The higher prey diversity shown in individual bonnetheadscan be attributed to the many different species of crab presentin bonnethead stomachs at one time whereas lower dietarydiversity in red drum may be due to one species and/or preycategory present in stomachs, likely an artifact of stomachcontent analysis. Intraspecific variation in diet may play a rolein reducing interspecific competition within the northernGOM waters. For example, individual dietary preferencesand predator behavior may determine what prey are con-sumed. Juvenile red drum have been shown to exhibit sitefidelity to estuarine tidal creeks throughout Mobile Bay(Powers, unpublished data) and similarly, bonnetheads exhibitsite fidelity to specific areas in Mississippi Sound (Kroetzet al. 2015). Potential habitat partitioning may have affectedwhat prey were available and consumed by each species. Thiscould have potentially led to reduced competition of themesopredators allowing both species to consume similar preyitems and coexist in the same ecosystem.
If analyzing diet at the population or community level,intraspecific variation and dietary diversity can be lost.Similarly, if only a single metric is used to define trophic
relationships, specificity can be lost over temporal scales.For example, there was zero to minimal isotopic niche overlapof red drumwith juvenile and adult bonnetheads, respectively;this is similar to what was reported for these two species on theeast coast of the USA (Shaw et al. 2016). In contrast, stomachcontent analysis revealed more dietary overlap than suggestedby the stable isotope mixing models. In general, red drum hadoccupied a greater isotopic niche space than bonnetheads.These differences can be attributed to the different temporalscales of each analysis (i.e., short-term vs. long-term), isotopicvalues of our potential prey items, or mobility of bonnetheadsand red drum.
Defining ecological and dietary specialization forcoastal f ishes is difficult (Munroe et al . 2014).Specialization can be defined based on a multitude ofcharacteristics, including morphological and dietary strat-egies (Munroe et al. 2014). For example, bonnetheadscould be considered dietary specialists based on morpho-logical and feeding mechanics (Wilga and Motta 2000) aswell as from stomach content analysis (Cortés et al.1996). Our sampled population of mesopredatorybonnetheads and red drum occupied varying niche widthswith intraspecific diversity in consumed prey within eachpopulation. Resource scarcity can lead to trophic special-ization because individual predators that use a narrowrange of resources have the potential to be more efficientat exploiting resources (Bolnick et al. 2003). Both lifestages of bonnetheads and juvenile red drum overlap spa-tially and interspecific competition may be a driver of thevariation of prey resources that we observed. Intraspecificcompetition of juvenile and adult bonnetheads may not beas prominent as dietary and isotopic overlap was high,and we observed potential resource partitioning, mainlyby adult bonnetheads. Further investigation into thepredator-prey interactions of these two mesopredator spe-cies will provide the necessary information on inter- andintraspecific competition (Kroetz unpublished data) need-ed to determine the specific role that juvenile and adultbonnetheads and juvenile red drum play in ecosystemfunction.
Acknowledgements The funding for this project was provided by theDepartment of Marine Sciences at the University of South Alabama, theDauphin Island Sea Lab, and the Sport Fish Restoration Program via acontract from the Alabama Department of Conservation and NaturalResources Marine Resource Division (ADCNR MRD). We are gratefulfor assistance and cooperation from the Alabama Deep Sea FishingRodeo and John Mareska at ADCNR MRD for allowing us to samplered drum. Thank you to the members of the Fisheries Ecology Laboratoryat the Dauphin Island Sea Lab who provided field assistance. Thanks areowed to the anonymous reviewers for insightful comments and sugges-tions that greatly improved this manuscript. This research was approvedby the Institutional Animal Care and Use Committee (IACUC) and thestate of Alabama authorities.
Estuaries and Coasts
References
Amundsen, P.A., H.M. Gabler, and F.J. Staldvik. 1996. A new approachto graphical analysis of feeding strategy from stomach contents data-modification of the Costello (1990) method. Journal of Fish Biology48: 607–614.
Bacheler, N.M., L.M. Paramore, J.A. Buckel, and J.E. Hightower. 2009.Abiotic and biotic factors influence the habitat use of an estuarinefish. Marine Ecology Progress Series 377: 263–277.
Baum, J.K., and B.Worm. 2009. Cascading top-down effects of changingoceanic predator abundances. Journal of Animal Ecology 78: 699–714.
Bethea, D.M., L. Hale, J.K. Carlson, E. Cortés, C.A. Manire, and J.Gelsleichter. 2007. Geographic and ontogenetic variation in the dietand daily ration of the bonnethead shark, Sphyrna tiburo, from theeastern Gulf of Mexico. Marine Biology 152: 1009–1020.
Bizzarro, J.J., H.J. Robinson, C.S. Rinewalt, and D.A. Ebert. 2007.Comparative feeding ecology of four sympatric skate species offCentral California, USA. Environmental Biology of Fishes 80:197–220.
Bolnick, D.I., R. Svanbäck, J.A. Fordyce, L.H. Yang, J.M. Davis, C.D.Hulsey, and M.L. Forister. 2003. The ecology of individuals: inci-dence and implications of individual specialization. The AmericanNaturalist 161: 1–28.
Bridcut, E.E., and P.S. Giller. 1995. Diet variability and foraging strate-gies in brown trout (Salmo trutta): an analysis from subpopulationsto individuals. Canadian Journal of Fisheries and Aquatic Sciences52: 2543–2552.
Chipps, S.R., and J.E. Garvey. 2007. Assessment of diets and feedingpatterns. In Analysis and interpretation of freshwater fisheries data,ed. Christopher S. Guy and Michael L. Brown, 473–514. AmericanFisheries Society.
Clark, E., and K. von Schmidt. 1965. Sharks of the central gulf coast ofFlorida. Bulletin of Marine Science 15: 13–83.
Compagno, L.J.V. 1984. FAO species catalogue. Vol. 4. Sharks of theworld: an annotated and illustrated catalogue of shark species knownto date. Part 2. Carcharhiniformes. FAO Fisheries Synopsis 125:251–655.
Cortés, E. 1999. Standardized diet compositions and trophic levels ofsharks. ICES Journal of Marine Science 56: 707–717.
Cortés, E., C.A. Manire, and R.E. Hueter. 1996. Diet, feeding habits, anddiel feeding chronology of the bonnethead shark, Sphyrna tiburo, inSouthwest Florida. Bulletin of Marine Science 58: 353–367.
Costello, M.J. 1990. Predator feeding strategy and prey importance: anew graphical analysis. Journal of Fish Biology 36: 261–263.
Driggers, W.B., B.S. Frazier, D.H. Adams, G.F. Ulrich, C.M. Jones, E.R.Hoffmayer, and M.D. Campbell. 2014. Site fidelity of migratorybonnethead sharks Sphyrna tiburo (L. 1758) to specific estuariesin South Carolina, USA. Journal of Experimental Marine Biologyand Ecology 459: 61–69.
Drymon, J.M., S.P. Powers, and R.H. Carmichael. 2012. Trophic plastic-ity in the Atlantic sharpnose shark (Rhizoprionodon terraenovae)from the north Central Gulf of Mexico. Environmental Biology ofFishes 95: 21–35.
Dulvy, N.K., S.L. Fowler, J.A. Musick, R.D. Cavanagh, P.M. Kyne, L.R.Harrison, J.K. Carlson, L.N.K. Davidson, S.V. Fordham, M.P.Francis, C.M. Pollock, C.A. Simpfendorfer, G.H. Burgess, K.E.Carpenter, L.J.V. Compagno, D.A. Ebert, C. Gibson, M.R.Heupel, S.R. Livingstone, J.C. Sanciangco, J.D. Stevens, S.Valenti, and W.T. White. 2014. Extinction risk and conservation ofthe world’s sharks and rays. eLife 3 .p.e00590
Estrada, J.A., A.N. Rice, M.E. Lutcavage, and G.B. Skomal. 2003.Predicting trophic position in sharks of the north-West AtlanticOcean using stable isotope analysis. Journal of the MarineBiological Association of the UK 83: 1347–1350.
Facendola, J.J., and F.S. Scharf. 2012. Seasonal and ontogenetic variationin the diet and daily ration of estuarine red drum as derived fromfield-based estimates of gastric evacuation and consumption.Marine and Coastal Fisheries 4: 546–559.
Ferretti, F., B.Worm, G.L. Britten, M.R. Heithaus, and H.K. Lotze. 2010.Patterns and ecosystem consequences of shark declines in the ocean.Ecology Letters 13: 1055–1071.
Ferry, L.A., and G.M. Cailliet. 1996. Sample size and data analysis: arewe characterizing and comparing diet properly? In Feeding ecologyand nutrition, ed. D.D. MacKinlay and K.D. Shearer, 71–80.American Fisheries Society.
Folke, C., S. Carpenter, B. Walker, M. Scheffer, T. Elmqvist, L.Gunderson, and C.S. Holling. 2004. Regime shifts, resilience, andbiodiversity in ecosystem management. Annual Reviews in Ecologyand Evolution 35: 557–581.
Froeschke, J., G.W. Stunz, and M.L. Wildhaber. 2010. Environmentalinfluences on the occurrence of coastal sharks in estuarine waters.Marine Ecology Progress Series 407: 279–292.
Fry, B. 2006. Stable isotope ecology. New York: Springer-Verlag.Garvey, J.E., N.A. Dingledine, N.S. Donovan, and R.A. Stein. 1998.
Exploring spatial and temporal variation within reservoir food webs:predictions for fish assemblages. Ecological Applications 8: 104–120.
Gotelli, N.J., E.M. Hart, and A.M. Ellison. 2015. EcoSimR: Null modelanalysis for ecological data. doi: 10.5281/zenodo.16522.
Heupel, M.R., C.A. Simpfendorfer, A.B. Collins, and J.P. Tyminski.2006. Residency and movement patterns of bonnethead sharks,Sphyrna tiburo, in a large Florida estuary. Environmental Biologyof Fishes 76: 47–67. doi:10.1007/s10641-006-9007-6.
Hightower, C.L. 2013. Evaluating the current status of red drum(Sciaenops ocellatus) in offshore waters of the north central Gulfof Mexico: age and growth, abundance, and mercury concentration.University of South Alabama.
Hoffmayer, E.R., and G.R. Parsons. 2003. Food habits of three sharkspecies from the Mississippi sound in the northern Gulf ofMexico. Southeastern Naturalist 2: 271–280.
Hyslop, E.J. 1980. Stomach contents analysis—a review of methods andtheir application. Journal of Fish Biology 17: 411–429.
Jackson, A.L., R. Inger, A.C. Parnell, and S. Bearhop. 2011. Comparingisotopic niche widths among and within communities: SIBER—stable isotope Bayesian ellipses in R. Journal of Animal Ecology80: 595–602. doi:10.1111/j.1365-2656.2011.01806.x.
Kernaléguen, L., J.P.Y. Arnould, C. Guinet, and Y. Cherel. 2015.Determinants of individual foraging specialization in large marinevertebrates, the Antarctic and subantarctic fur seals. Journal ofAnimal Ecology. doi:10.1111/1365-2656.12347.
Kitchell, J.F., S.J.D. Martell, C.J. Walters, O.P. Jensen, I.C. Kaplan, J.Watters, T.E. Essington, and C.H. Boggs. 2006. Billfishes in anecosystem context. Bulletin of Marine Science 79: 669–682.
Kroetz, A.M., S.P. Powers, J.M. Drymon, and K. Park. 2015.Anthropogenic modification to a barrier island influence bonnethead(Sphyrna tiburo) movements in the northern Gulf of Mexico.Animal Biotelemetry 3: 38. doi:10.1186/s40317-015-0067-2.
Layman, C.A., D.A. Arrington, C.G.Montaña, and D.M. Post. 2007. Canstable isotope rations provide for community-wide measures of tro-phic structure? Ecology 88: 42–48.
Llansó, R.J., S.S. Bell, and F.E. Vose. 1998. Food habits of red drum andspotted seatrout in a restored mangrove impoundment. Estuaries 21:294–306.
MacNeil, M.A., G.B. Skomal, and A.T. Fisk. 2005. Stable isotopes frommultiple tissues reveal diet switching in sharks. Marine EcologyProgress Series 302: 199–206.
Matich, P., and M.R. Heithaus. 2015. Individual variation in onto-genetic niche shifts in habitat use and movement patterns of alarge estuarine predator (Carcharhinus leucas). Oecologia.doi:10.1007/s00442-015-3253-2.
Estuaries and Coasts
Matich, P., M.R. Heithaus, and C.A. Layman. 2011. Contrastingpatterns of individual specialization and trophic coupling intwo marine apex predators. Journal of Animal Ecology 80:294–305. doi:10.1111/j.1365-2656.2010.01753.x.
Munroe, S.E.M., C.A. Simpfendorfer, and M.R. Heupel. 2014. Definingshark ecological specialisation: concepts, context, and examples.Reviews in Fish Biology and Fisheries 24: 317–331.
Murphy, M.D., and R.G. Taylor. 1990. Reproduction, growth, and mor-tality of red drum Sciaenops ocellatus in Florida waters. FisheryBulletin 88: 531–542.
Oliver, T.H., M.S. Heard, N.J.B. Isaac, D.B. Roy, D. Procter, F.Eigenbroad, R. Freckleton, A. Hector, C.D.L. Orme, O.L. Petchey,V. Proenca, D. Raffaelli, K.B. Suttle, G.M. Mace, B. Martín-López,B.A. Woodcock, and J.M. Bullock. 2015. Biodiversity and resil-ience of ecosystem functions. Trends in Ecology and Evolution30(11): 673–684.
Overstreet, R.M., and R.W. Heard. 1978. Food of the red drum,Sciaenops ocellata, from Mississippi sound. Gulf ResearchReports 6: 131–135.
Parnell, A.C., and A.L. Jackson. 2013. SIAR: Stable IsotopeAnalysis in R.
Pianka, E.R. 1976. Competition and niche theory. In Theoretical ecology:principles and applications, ed. R.M. May, 114–141. Philadelphia:W.D. Saunders.
Polunin, N.V.C., and J.K. Pinnegar. 2002. Trophic ecology and the struc-ture of marine food webs. In Handbook of fish and fisheries volume1, ed. P. Hart and J. Reynolds, 301–320. Oxford: Blackwell Science.
Post, D.M., C.A. Layman, D.A. Arrington, G. Takimoto, J. Quattrochi,and C.G. Montaña. 2007. Getting to the fat of the matter models,methods and assumptions for dealing with lipids in stable isotopeanalyses. Oecologia 152: 179–189.
Prugh, L.R., C.J. Stoner, C.W. Epps, W.T. Bean, W.J. Ripple, A.S.Laliberte, and J.S. Brashares. 2009. The rise of the mesopredator.Bioscience 59: 779–791.
Ritchie, E.G., and C.N. Johnson. 2009. Predator interactions,mesopredator release and biodiversity conservation. EcologyLetters 12: 982–998.
Rooker, J.R., and S.A. Holt. 1997. Utilization of subtropical seagrassmeadows by newly settled red drum (Sciaenops ocellatus): patternsof distribution and growth. Marine Ecology Progress Series 158:139–149.
Rosenblatt, A.E., J.C. Nifong, M.R. Heithaus, F.J. Mazzotti, M.S.Cherkiss, B.M. Jeffery, R.M. Elsey, R.A. Decker, B.R. Silliman,L.J. Guillette Jr., R.H. Lowers, and J.C. Larson. 2015. Factors
affecting individual foraging specialization and temporal diet stabil-ity across the range of a large Bgeneralist^ apex predator.Oecologia.doi:10.1007/s00442-014-3201-6.
Scharf, F.S., and K.K. Schlight. 2000. Feeding habits of red drum(Sciaenops ocellatus) in Galveston Bay, Texas: seasonal diet varia-tion and predator-prey size relationships. Estuaries 23: 128–139.
Shannon, C.E., and W. Weaver. 1963. The mathematical theory ofcommunication. USA: University of Illinois Press.
Shaw, A.L., B.S. Frazier, J.R. Kucklick, and G. Sancho. 2016. Trophicecology of a predatory community in a shallow-water, high-salinityestuary assessed by stable isotope analysis. Marine and CoastalFisheries 8: 46–61.
Southeast Data, Assessment, and Review. 2013. Stock AssessmentReport HMS Bonnethead Shark.
Ubeda, A.J., C.A. Simpfendorfer, andM.R. Heupel. 2009. Movements ofbonnetheads, Sphyrna tiburo, as a response to salinity change in aFlorida estuary. Environmental Biology of Fishes 84: 293–303.
Valiela, Ivan. 1995. Food selection by consumers. In Processes, ed.Marine Ecological, 165–201. New York: Springer Science andBusiness Media.
Vander Zanden, M.J., B.J. Shuter, N.P. Lester, and J.B. Rasmussen. 2000.Within- and among-population variation in the trophic position of apelagic predator, lake trout (Salvelinus namaycush). CanadianJournal of Fisheries and Aquatic Sciences 57: 725–731.
Vaudo, J.J., and M.R. Heithaus. 2011. Dietary niche overlap in a near-shore elasmobranch mesopredator community. Marine EcologyProgress Series 425: 247–260.
Ward, P., and R.A. Myers. 2005. Shifts in open-ocean fish communitiescoinciding with the commencement of commercial fishing. Ecology86: 835–847.
Wetherbee, B.M., and E. Cortés. 2004. Food consumption and feedinghabits. In Biology of sharks and their relatives, ed. J.C. Carrier, J.A.Musick, and M.R. Heithaus, 223–244.
Wilga, C.D., and P.J. Motta. 2000. Durophagy in sharks: feedingmechan-ics of the hammerhead Sphyrna tiburo. The Journal of ExperimentalBiology 203: 2781–2796.
Woodland, R.J., D.H. Secor, and M.E. Wedge. 2011. Trophic resourceoverlap between small elasmobranchs and sympatric teleosts inmid-Atlantic bight nearshore habitats. Estuaries and Coasts 34: 391–404.
Worm, B., B. Davis, L. Kettemer, C.A. Ward-Paige, D. Chapman, M.R.Heithaus, S.T. Kessel, and S.H. Gruber. 2013. Global catches, ex-ploitation rates, and rebuilding options for sharks.Marine Policy 40:194–204.
Estuaries and Coasts