comparing measurements of carbon in diesel exhaust
TRANSCRIPT
Comparing Measurements of Carbon in Diesel Exhaust Aerosols Using the Aethalometer, NlOSH Method 5040,
and SMPS
lam Pou Ng, Hongbin Ma and David Kittelson Unlverslty of Minnesota
Art Miller N IOSHlCDC - Spokane Research Laboratory
ABSTRACT
Combu~tion aerosols consist mainly of elemental and organic carbon (EC and OC). Since EC strongly absorbs light and thus affects atmospheric visibility and radiation balance, there is great Interest in its measurement. To this end, the Natlonal Institute for Occupational Safety and Health (NIOSH) published a standard method to determine the mas8 of EC and OC on filter samples. Another common method of measurlng carbon in aerosols is the aethalometer, which uses light extinction to measure "black carbonp or BC, which Is considered to approximate EC. A thlrd method sometimes wed for estimating carbon in submicron combustion aerosols, is to measure partlcle size distribution8 uslng a scannlng mobility particle sizer (SMPS) and calculate mass uslng the assumption$ that the particles are spherical, carbonaceous and of known density. With an eye toward evaluating the use of these methods for measuring carbon in freshly emitted diesel aerosols, the objectjve of thlr paper is to compare the results among the8e methods and to investlgate the role of OC when measuring the mass concentration of elemental carbon (or black carbon) in aerosols emitted by a medium-duty Dlessl engine. Results indicate that the aethalometer rasponse cyelates well wlh the data from fdter samples (R 0.99), with a very slight posklve Interference at high levels of OC,
INTRODUCTION
Diesel engines a n widely used in heavy-duty applications b e ~ u s e of their excellent fuel economy and durabilky, but some concerns have been raised about thslr impact on the environment. [I], [2], [3] One area of concern focuses on the optical properties of the Diesel exhaust particles and their corresponding influenca on visibility and solar energy absorption. 141, 151, [6] Such particles consist mainly of elemental carbon (EC) and organic carbon (OC), The EC plays a key role In air
pollution due to its strong Ilght absorption properties, [I], [q so its measurement is an important and necessary aspect of environmental research.
In order to quantify the carbon In aerosols, the National Institute for Occupatial Safety and Health (NIOSH) recently published the Standard Method 5040, whlch is a method to determine the masses of EC end OC from a filter sample (NIOSH 1998). The method Is based on a thermal-optical technlque developed by Sunset Laboratorlw Inc and Is aerosol type and size independent. [8] Although the method is widely accepted, the sample collection and analysis processes are time consuming.
An alternative method for such carbon measurements la an instrument called the aethalometer, which has become widely used to measure the mass coneentmtlon of 'black carbon" in aerosols. It is related to the ability of particles d e p i t e d on a filter to attenuate a light beam in the aethalometer. [9], [ lo] Although the instrument requires aerosol dependent callbration, it is convenient to use and can provide a near real-time measurement. The aethalometer callbntlon process depends upon knowledge of the 'specific optical atlenuation cross- sectionu, commonly referred to as the sigma ( 0 ) value. [I I] , 1121, [13], [14] Slnce the slgma value Is s function of aerosol type, using a consant sigma value to calculate the BC ooncentration could cause over or underestimation of the actual carbon concentration In the ambient air, Aerosols that were well aged In the atmosphere as well as freshly emitted from Diesel engines wen studled previously. (1 51, [10]
The primary thrust of this work is to investlgate the respanse of the aethalomekr to freshly emitted Diesel exhaust aerosols and to quantlfy how this response varies as particles are treated to remove their organlc carbon oontent. This is done by comparing the measured values of BC with simultaneous
measurements of EC and OC derlved from filter samples. The BC and EC measurements were also compared with partlcle volume data derived from particle sire distributions simultaneously measured uslng a scanning mobility particle sizer (SMPS). This comparison was used to elucidate the relationship bebeen concentratfons of BC, EC, OC and the two submicron modes of Diesel exhaust particles, i.e. the nuclel and accumulation modes, [2]
EXPERIMENTAL SETUP AND EQUIPMENT
EXPERIMENTAL SETUP
The source of Diesel particulate for this work was a John Darn 4045 engine, which is a turbocharged, four cylinder, dlrect injection engine, typlcal of those used to power off-mad vehicles. Load to the engine was provided by a 150kW DC dynamometer, employing a Digalag controller. The fuel used for all tests was standard EPA #2 Diesel fuel with nominal sulfur level of 350 ppm, The engine speed wao 1400 RPM for all experiments and four engine load conditions wen used. The "lightesr load was 40 Nm (10% of full load) and the 'heavieC load was 360 Nm (90% of full lord). Intermediate settings d 50% and 75% were also used. The reason for chooolng a range of load conditions is that many of the particles generated at llghter loads are relatively volatile, while those generated at heavy loads a n mainly non-volatile. The response of the measurement methods to volatlle and non-volatlle carbonaceous aerosols was one of the key issues under investigation in this work.
The Issue of volatility was addressed uring a catalytic stripper to remove volatile materlal from the aerosols. The stripper used has a honeycomb structure with a catalytic surface mating, I171 The stripper is maintained at 300 deg C and as aerosol pahihiel through it, volatlle species are evaporated and oxidized. Solid particles are ideally not affected, but some an lost by diffusion and thermophoresls. [17], [I81
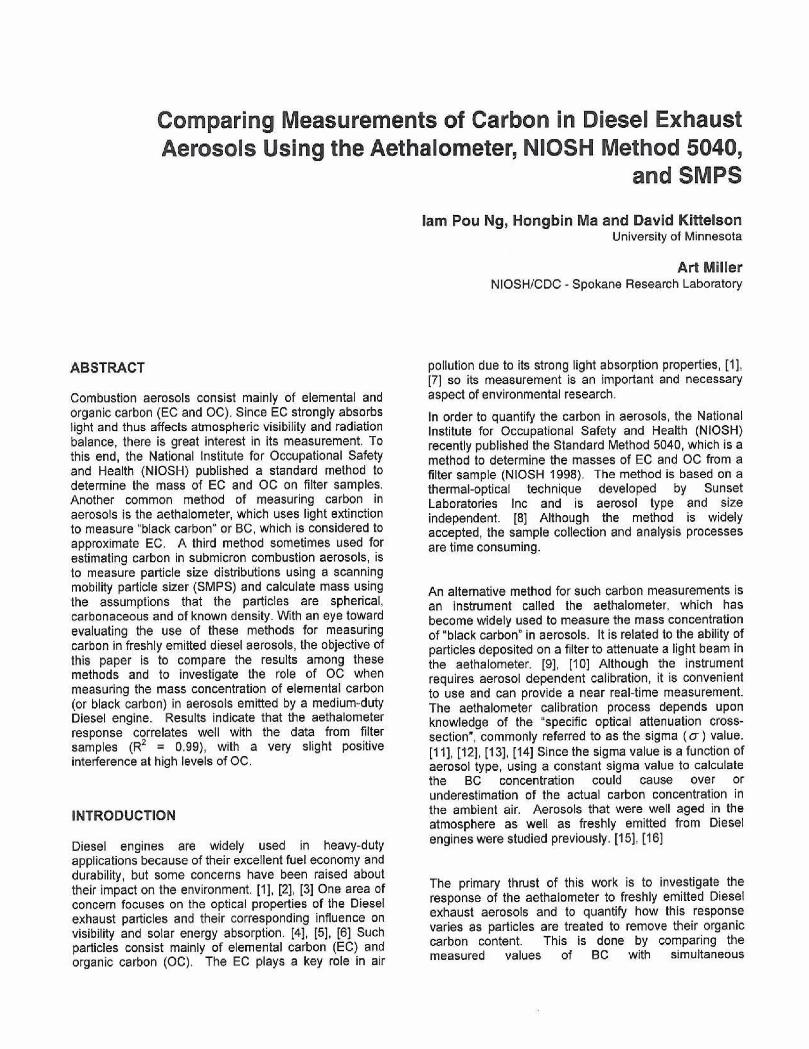
Figure 1 shows the setup for these experiments. To better simulate the Diesel aerosol exiting a vehicle tallpipe, the raw exhaust was diluted in two stages and passed through a dilutlon tunnel. The dllution ratlos were subsequently calculated for all tests by measuring NO In the raw and diluted exhaust. This was done for every test and all data presented in this report have been dilution-corrected to represent engine-out conditions. The ECIOC measurements were conducted at the first stage and the BC measurements wen taken at the second stage. This was done to prevent saturation of the aethalometer, and the effect on aerosol content is considered negtigible. [ I 91
Figure I.BIock diagram of the experimental sehip for the metho&- cornpadson tests.
ECIOC MEASUREMENTS
The mass concentration of the EC and OC were determined using the NlOSH Method 5040. Following the standard method, [20] samples wen collected using 37 mrn plastic filter cassettes containing pre-fired quarlz filters. The samples were drawn at 3 Ipm from the diluted exhaust by drawing aerosol through critical orifices using a vacuum pump. For each test condition, filter samples were collected in triplicate to ensure repeatablllty of results, and sampllng times ranged between 150 minutes at 10% load and 20 minutes at 90% load to ensure adequate filter loading. The filter loadings ranied from (3.3 to 80) pgcm' for EC and (0.5 to 26) pgcm for OC. The EClOC data presented In thls report are based on the average of the three samples taken at each condition, The samples were sent to a NIOSH-contracted lab (DataChem Labs In Salt Lake City), along with media blanks and field blanks as nqulred. The samples were analfled using the NlOSH standard method 5040 [8] and time-weghted average values of EC and OC in units of mgm were derived from the analytical nrults.
The NlOSH method uses the thermal-optical technique to quantify the EC and OC, and is considered a reference method. During implementation of the method, carbon volatilized below 850 OC in a helium atmosphere Is defined as OC, while carbon burned off at 850 OC in an atmosphere of oxygen and helium is defined as EC. The optlcal component of the method entails evaluation of the char, i.e. residue left on the filter due to pyrolysis of some OC during the first heating cycle. Thls char is oxldlzed at the beginning of the second heating cycle and its mass apportioned as OC. An optical technique la used to determine when this char Is gone from the flker, which Is why the method is called "thermal-optical".
AETHALOMETER MEASUREMENTS
The single channel aethalometer used In this work (Magee Scientific model AE-16) employs an optical method to measure the black carbon (BC). It measures BC using optical absorption of an 880nm wavelength light beam, by aerosol particles that have been deposited onto a filter. The instrument is mainly sensitive to solid (non-voktile, or *black") carbon, but other materials present in the sample may also prevent light from reaching the aethalometer sensor. Light attenuation could depend on interactions between particle morphology, nature of the deposit on the filter, and scatferinglabsorption of light by non-EC materials, any of which could influence the aethalometer response. The attenuation is a function of the amount of deposited BC. [Q], [10], [13j Equation (I) shows the definition of the attenuation, where I, and I are the transmitted light intensities through the blank and loaded filter, respectively. [13]
lo ATN = 100 x LM (-1
I
Equation (2) relates the attenuation to [BC], i.e. the mass concentration per unit area of the filter, which has units of ~gcrn '~ . [21] In the equatlon, "0" is the spectf~c attenuation cross-section, or so-called sigma value. The sigma value is not a 'physical constant' but a value of wavelength dependent. The sigma value for black carbon (BC) used by the AE-18 operating in near infrared at a wavelength of 880 nm is 16.6 mZg-'.
Using this value, the actual BC concentration of the sampled aerosol can be determined in units of ugmJ by using equation (31, where the inlet flow (F) and sampling time (T) are recorded by the aethalometer and the sampling spot area (A) is known (Aethalometer manual).
A BC = [BC] x -
TxF (3)
SMPS MEASUREMENTS
Particle size and concentration were determined using an SMPS, which measures particle size based on electrical mobility. The instrument used for this work was built in-house and is based on the "long-column DMA" design. [22] Flow rates of aerosol and clean sheath air are 1.0 and 10.0 Ipm respectively. During measurement, particles are first charged to Boltzmann equilibrium using a PO*'' source and then pass through the column of the differential mobility analyzer (DMA). The differential voltage in the column determines the size of particles that exit through a narrow slit at the far
end of the column. The voltage is scanned from zero to 10kV and back to zero over a four-minute period. During thls time a TSI model 3010 condensation particle counter (CPC) [23] counts the particles exiting the DMA and the counts are corrected for charge distribution and voltage ramping effects, yielding a number-weighted size distribution for the aerosol.
EXPERIMENTAL PROCEDURE
Experimental work was conducted between May 21 and May 25, 2004. As a baseline, EClOC filter samples were collected from the exhaust stream without the stripper in line, while simultaneous measurements were made using the aethalometer and SMPS. Then, the stripper was placed before all instruments and the sampling repeated using the same engine speed and loads.
The main purpose of this experiment was to compare measurements of carbon made with the aethalometer (BC concentration) the NIOSH Method 5040 (EC concentration), and the SMPS (particle volume estimations). Additionally, we wanted to investigate the change in the response of the three methods when the volatile component of the aerosol was removed. This was accomplished by using a catalytic stripper to remove the volatile fraction of the aerosol for some tests.
Over a period of about 20 to 150 minutes while the filter samples were belng collected, the SMPS recorded the size distribution approximately every four minutes, and the aethalometer measured BC mass concentration every two minutes. At the end of the sampling period, the BC and SMPS data were averaged to give one (time-weighted average) value of BC and particle size distribution for that test.
RESULTS AND DISCUSSION
ESTIMATING EXHAUST VOLUME CONCENTRATION USING PARTICLE SIZE DISTRIBUTIONS (SMPS DATA)
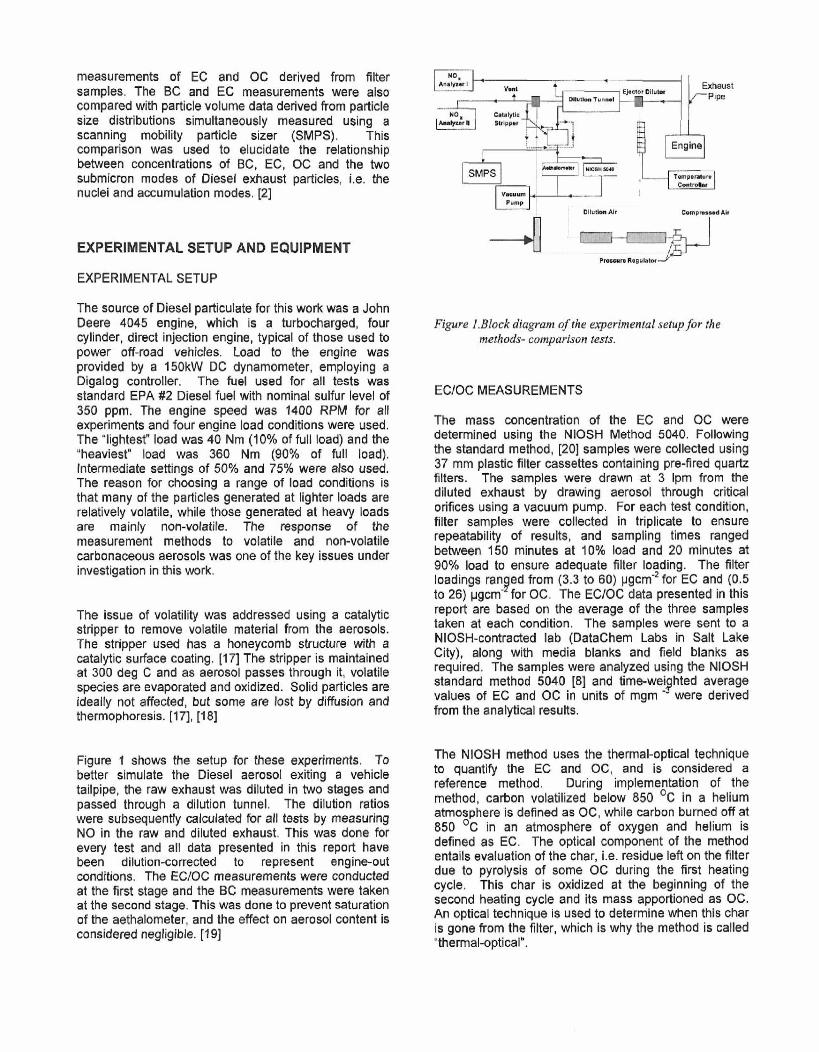
An SMPS was used to measure the particle number concentration, The size distributions of particles emitted by the John Deere engine at various loads are presented in Figure 2. Each plot includes a second curve which represents the particle size distribution after the exhaust has been put through the catalytic stripper (CS). Note that in each case the particle number is reduced through the stripper. Since the accumulation mode range contalns most of the particulate matter mass, 121 converting the number concentration to volume concentration using the SMPS data Is an indirect way to estimate the particulate mass before and after the stripper. The data of Figure 2 were used to estimate particulate volume concentration.
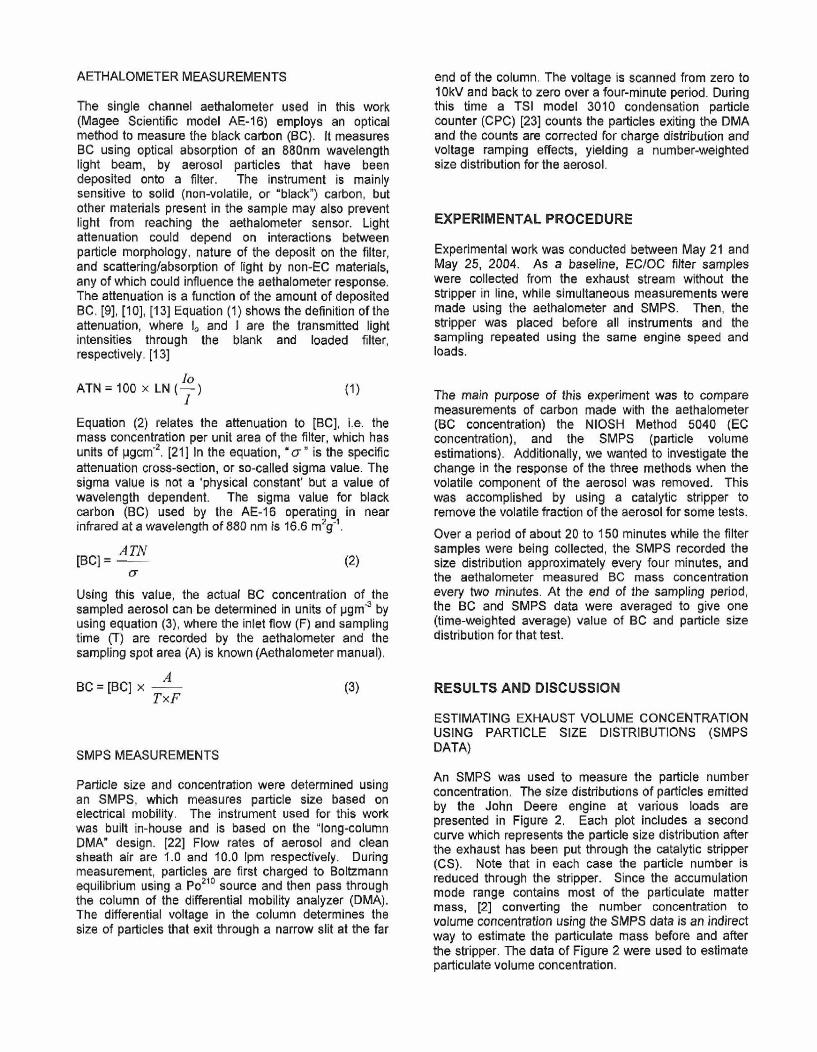
This was dons by using the averaged number weighted size distribution for each test condition and applying a curve fitting program to generate idealized lognormal volume concentration cunres, using the assumption of spherical particles of unit density (an example is shown in Figure 3). However, this method has rome uncertainty since no volume data beyond 300 nm is considered.
14# RPY, $00 Nm wlaa mnd wlthbul C h l b r W p o r
Figwe f ,SMPS data (all 4 loads both with and without stripper).
Figure 3 . h m p l e of W P S data showing how a lognormal cuwe was generated tm order to calculate vol~rme~.
COMPARING CARBON MASS CONCENTRATIONS MEASURED BY THE AETHALOMETER AND BY THE NlOSH METHOD 5040
Black carbon measurements were taken using the AE16 aethalometer, and filter samples were collected for analysis by the NlOSH method 5040. The results for all engine loads and for both raw and post-strlpper exhaust are shown in Flgure 4. Note that only one arthalometer measurement was made at both 50% and 90% engine load due to time constraints. Note also that the eoncentrations of both BC and EC are much higher at higher loads than at the lighter loads. This Is expected since the higher engine lord typically produces more solld carbonaceous material. The data in Figure 4 shows remarkably good agreement between black carbon (BC) measured wRh the aethalometer and elemental carbon measured with the NlOSH method.
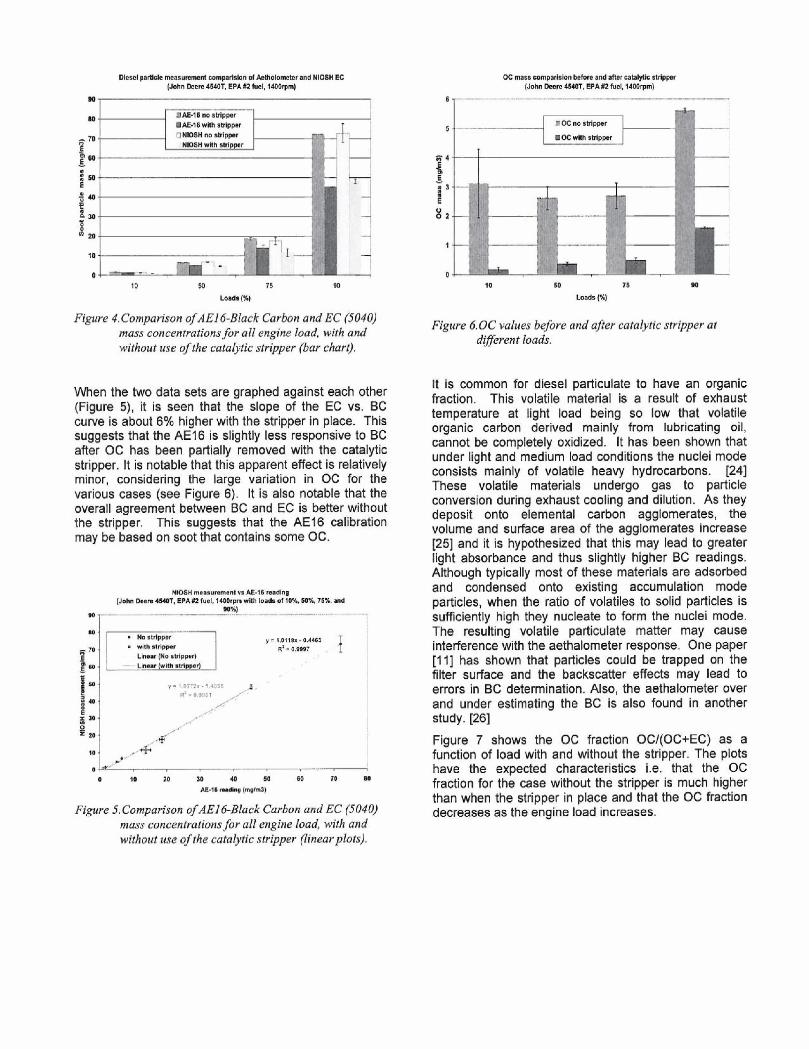
Figure 4.Compariron ofAEl4-Black Carbon and EC (5040) mass concentrations for all mgtne load, with and without use of the cataiytic stripper (bur chart),
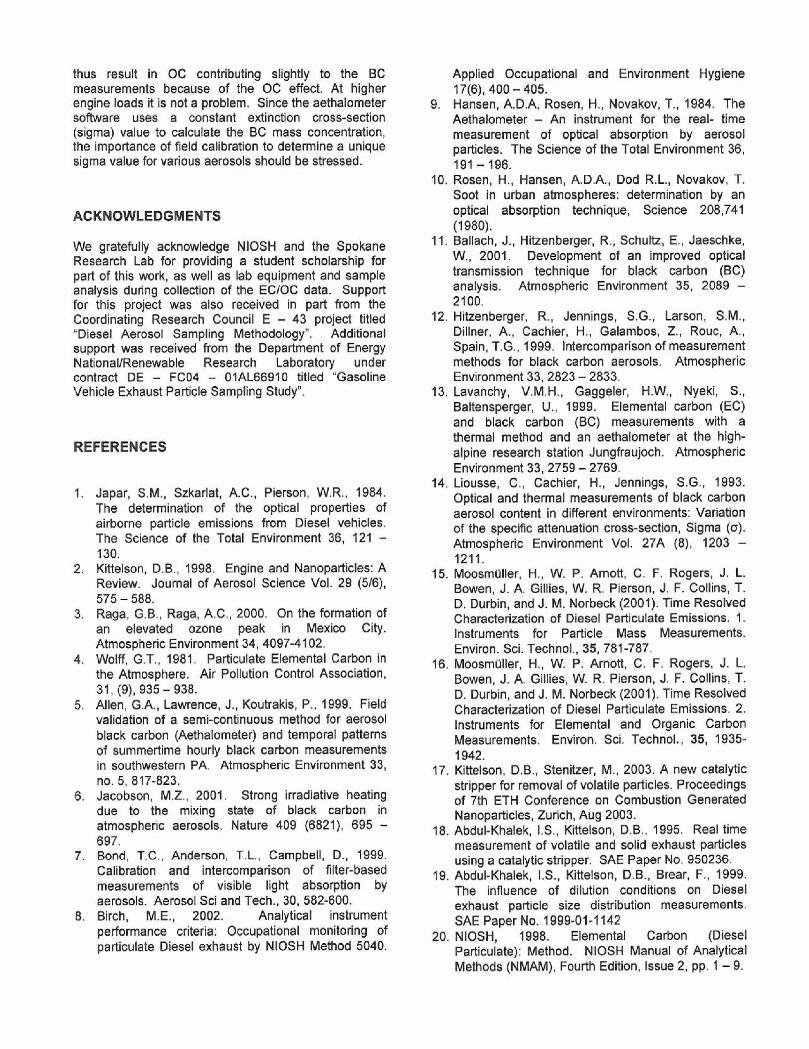
When the two data sets are graphed against each other (Figure 5), It Is seen that the slope of the EC vs. BC curve Is about 6% higher with the stripper in place. Thls suggests that the AEI6 is slightly less responsive to BC after OC has been partially removed with the catalytic stripper. It is notable that this eppa~nt effect Is relatively minor, considering ihe large variation in OC for the varlous cases (see Figure 6). It Is alro notable that the overall agreement between BC and EC is better without the stripper. This suggests that the AEl6 calibration may be based on soot that contains same OC.
#rwn MU-n M n p [John -&+ST. EPACP fuel. 1- wW lo& d 10% W% -5, md
Figure J.Comparison ofAEl&Black Carbon and E% (5040) mass concenhations for all engine load, with and without tape of the catat)jtic stripper (linear plots),
Figure 6.OC values b&re a d afir catalytic strlppr at daf.?ermt loads.
It is common for diesel particulate to have an organic fraction. This volatile materlal Is a result of exhaust temperature at Hght load belng so low that volatile organic carbon derived mainly from lubricating oil, cannot be completely oxidized. It has been shown that under light and medium load condition8 the nuclel mode consists mainly of volatile heavy hydrocarbans. [24] These volatile materials undergo gas to particle conversion during exhaust wollng and dilution, As they deposit onto elemental carbon agglomerates, the volume and surface area of the agglomerates increase [25] and it is hypothesized that thls may lead to greater light absorbance and thus slightly higher BC readings. Although typically most of these materials are adsorbed and condensed onto existing accumulation mode particles, when the ratio of volatiles to solid particles is sufficiently high they nucleate to form the nuclei mode. The resulting volatile particulate matter may cause interference with the aethalometer response. One paper [Ill has shown that particles could be trapped on the filter surface and the backscatter effects may lead to errors in BC determination. Also, the aethalometer over and under estimating the BC Is also found In another study. [26]
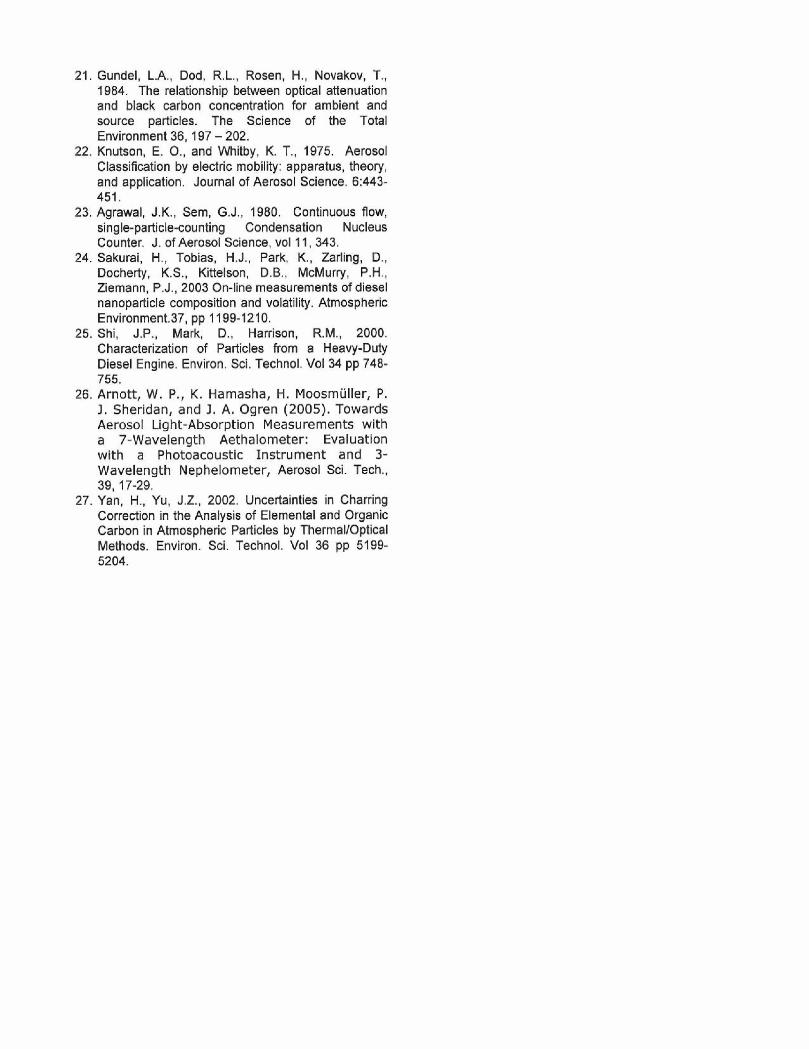
Flgun 7 shows the OC fraction OCI(OC+EC) as a function of load wlth and without the strlpper. The plots have the expected characteristics i.e. that the OC fraction for the case without the stripper is much higher than h e n the stripper In place and that the OC fractlon decreases as the engine load increases.
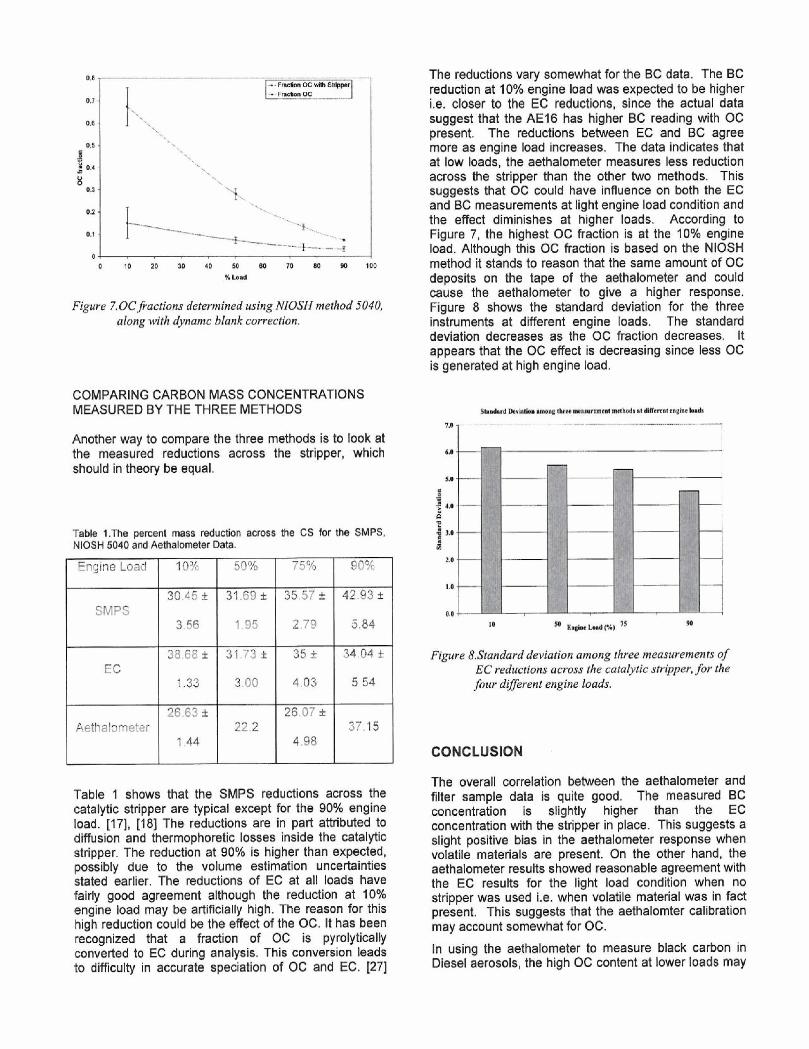
Figure 7,OCJractions determined wing NIUSH method 5040, along with dynarnc blank correction.
COMPARING CARBON MASS CONCENTRATIONS MEASURED BY THE THREE METHODS
Another way to compare the three methods is to look at the measured reductions across the dripper, which should in theory be equal.
Tabk 1.Tho pmnt mass mduetkn across the CS for the SMPS, NlOSH 1040 and Aehalometer Data.
Engine Load 10% 50% 75% 90%
30.45 i 31.69 i 35.57 * 42.93 3: SMPS
3.56 1 9 5 2.79 5.84
26.63 k 26.07 + Aethalometer 22.2 37.j5
1.44 4.98
Table 1 shows that the SMPS reductions across the catalytic stripper are typical except for the 90% engine load. [17], 11 81 The reductions are in part attributed to diffusion and thermophoretic losrer lnslde the catalytic stripper. The reduction at 90% is higher than expected, possibly due to the volume estimation uncertainties stated earlier. The reductions of EC at all loads have fairly good agreement although the reduction at 10% engine load may be artificially high. The reason for this high reduction could be the ebet of the OC, It has been rec@gnlzed that a fraction of OC is pyrolytically convebd to EC during analysis. This conversion leads to dlfflculty in accurate speciation of OC and EC. [27]
The reductions vary somewhat for the BC data. The BC reduction at 10% engine load was expected to be higher i.0. closer to the EC reductlon8, rince the actual data suggest that the AE16 has higher BC reading with OC present. The nductions between EC and BC agree more as engine load increases. The data indicates that at low loads, the aethalorneter measures less reduction across the stripper than the other two methods. This suggests that OC could Rave Influence on both the EC and BC measurements at Ilght engine load condition and the effect diminishes at higher loads. According to Figure 7, the highest OC fraction is at the 10% engine load. Although this OC fraction is based on the NIOSH method it stands to reason that the same amount of OC deposb on the hpe of the aethalometer and could cause the aethalometer to give a higher response. Figure 8 shows the standard deviation for the three instruments at different engine loads, The standard deviation decreases as the OC fraction decreases. It appears that the OC effect is decreasing since less OC is generated at high engine load.
Figure 8.Stundard deviation among three mea~urement;p of EC reductionr across the catalyrlc stripper, for the four &@rent engine ba&.
CONCLUSION
The overall correlation between the aethalometer and filter rample data is quite good. The measured BC concentration is slightly higher than the EC concentration with the stripper in place. This suggests a rllght positive bias in the aethalometer response when volatile materials are present. On the other hand, the aethalometer results showed reasonable agreement with the EC results for the light load wndklon when no stripper was used i.e. when volatile material was in fact present. This suggests that the rethalomter calibration may acwunt somewhat for OC.
In using the aethalometer to measure blad cahon in Diesel aerosols, the high OC content at lower loads may
thus result in OC contributing slightly to the BC measurements because of the OC effect. At higher engine loads it Is not a problem. Since the aethalometer software uses a constant extinction cross-section (sigma) value to calculate the BC mass concentration, the importance of field calibration to determine a unique sigma value for various aerosols should be stressed.
ACKNOWLEDGMENTS
We gratefully acknowledge NlOSH and the Spokane Research Lab for providing a student scholarship for part of this work, as well as lab equipment and sample analysis during collection of the EClOC data. Support for this project was also received in part from the Coordinating Research Council E - 43 project titled "Diesel Aerosol Sampling Methodologyu. Additional support was received from the Department of Energy NationallRenewable Research Laboratory under contract DE - FC04 - OlAL66910 titled "Gasoline Vehicle Exhaust Particle Sampling Study".
REFERENCES
4 . Japar, S.M., Szkarlat, A.C., Pierson, W.R., 1984. The determination of the optical properties of airborne particle emissions from Diesel vehicles. The Sclence of the Total Environment 36, 121 - 130.
2. Kittelson, D.B., 1898. Engine and Nanoparticles: A Review. Journal of Aerosol Science Vol. 29 (516), 575 - 588.
3. Raga, G.B., Raga, A.C., 2000. On the formation of an elevated ozone peak in Mexico City. Atmospheric Environment 34,4097-41 02.
4. Wolff, G.T., 198 t . Particulate Elemental Carbon in the Atmosphere. Air Pollution Control Association, 31, (g), 935 - 938.
5, Allen, G.A., Lawrence, J., Koutrakls, P., 1999. Field validation of a semi-continuous method for aerosol black carbon (Aethalometer) and temporal patterns of summsrtime hourly black carbon measurements in southwestern PA. Atmospheric Environment 33, no. 5, 817-823.
6. Jacobson, M.Z., 2001. Strong irradlatlve heating due to the mixing state of black carbon in atmospheric aerosols. Nature 409 (6821), 695 - 697.
7. Bond, T.C., Andenon, T.L., Campbell, D., 1999. Calibration and intercomparison of filter-based measurements of visible light absorption by aerosols. Aerosol Sci and Tech., 30, 582-800.
8. Birch, M.E,, 2002. Analytical instrument performance criteria: Occupational monitoring of particulate Diesel exhaust by NlOSH Method 5040.
Applied Occupational and Environment Hygiene 17(8), 400 - 405.
Q. Hansen, A.D.A, Rosen, H., Novakov, T., 1984. The Aethalometer - An instrument for the real- time measurement of optical absorption by aerosol particles. The Science of the Total Environment 36, 191 - 196.
10. Rosen, H., Hansen, A.D.A., Dod R.L., Novakov, T. Soot in urban atmospheres: determination by an optical absorption technique, Science 208,74 I (1 980).
11. Ballach, J., Hitzenberger, R., Schultr, E., Jaeschke, W., 2001. Development of an improved optical transmission technique for black carbon (BC) analysis. Atmospheric Environment 35, 2089 - 2100.
12. Hitzenberger, R., Jennings, S.G., Larson, S,M., Dillner, A., Cachier, H., Galambos, Z., Rouc, A., Spain, T.G., 1998, Intercomparison of measurement methods for black carbon aerosols. Atmospherlc Environment 33, 2823 - 2833.
13. Lavanchy, V.M.H., Gaggeler, H.W., Nyeki, S., Baltensperger, U., 1999. Elemental carbon (EC) and black carbon (BC) measurements with a thermal method and an aethalometer at the high- alpine research station Jungfraujoch. Atmospheric Environment 33,2759 - 2769.
14. Liousse, C., Cachier, H., Jennings, S.G., 1993. Optical and thermal measurements of black carbon aerosol content in different environments: Variation of the specific attenuation cross-section, Sigma (D). Atmospheric Environment Vol. 27A (8), 1203 - 1211.
15. MoosmUlter, H., W. P. Arnott, C. F. Rogers, J. L. Bowen, J. A. Gillies, W. R. Pierson, J. F. Collins, T. D. Durbin, and J. M. Norbeck (2001). Time Resolved Characterization of Diesel Particulate Emlsslons. 1. Instruments for Particle Mass Measurements. Environ. Sci. Technol., 35, 781-787.
16. MoosmUller, H., W. P. Arnott, C. F. Rogers, J. L. Bowen, J. A. Gillies, W. R. Pierson, J. F. Collins, T. D. Durbin, and J. M. Norbeck (2001). Time Resolved Characterization of Diesel Particulate Emissions. 2. Instruments for Elemental and Organic Carbon Measurements. Environ. Sci. Technol., 35, 1935- 1942.
17. Kittelson, D.B., Steniker, M., 2003. A new catalytic stripper for removal of volatile particles. Proceedings of 7th ETH Conference on Combustion Generated Nanoparticles, Zurich, Aug 2003.
18. AbdJ-Khalek, I.S., Kittelson, D.B., 1985. Real time measurement of volatile and solid exhaust particles using a catalytic stripper. SAE Paper No. 950236.
19. Abdul-Khalek, I.S., Kittelson, D.B., Brear, F., 1999. The influence of dilution conditions on Diesel exhaust particle size distribution measurements. SAE Paper No. 1999-01-1142
20. NIOSH, 1998. Elemental Carbon (Diesel Particulate): Method. NlOSH Manual of Analytical Methods (NIWAM), Fourth Edltlon, Issue 2, pp. 1 - 9.
21. Gundel, L.A., Ood, R.L., Rosen, H., Novakov, T., 1984. The relationship between optical attenuation and black carbon concentration for ambient and source particles. The Science of the Total Environment 36, 197 - 202.
22. Knutson, E. O., and Whltby, K. T., 1975. Aerosol Classification by electric mobility: apparatus, theory, and application. Journal of Aerosol Science. 6:443- 451.
23. Agrawal, J.K., Sem, G.J., 1980. Continuous Row, single-particle-counting Condensation Nucleus Counter. J. of Aerosol Sclenm, vol 11, 343.
24. Sakurai, H., Tobias, H.J., Park, K., Zarling, D., Docherty, K.S., Kittelson, D.B., McMurfy, P.H., Ziemann, P.J., 2003 On-line measurements of diesel nanoparticle composition and volatility. Atmospheric Envi~onrnent~37, pp 11 99-121 0.
25.Shi, J.P., Mark, D., Harrison, R.M., 2000. Characterization of Particles from a Heavy-Duty Diesel Engine. Environ. Scl. Technol. Vol34 pp 748- 755.
26. Arnott, W. P., K. Hamasha, H. Moosmiiller, P. 3 . Sheridan, and 3. A. Ogren (2005). Towards Aerosol Light-Absorption Measurements with a 7-Wavelength Aethalometer: Evaluation with a Photoacoustlc Instrument and 3- Wavelength Nephelometer, Aerosol Sci. Tech., 39, 17-29.
27. Yan, H., Yu, J.Z., 2002. Uncertainties in Charring Correction in the Analysis of Elemental and Organic Carbon in Atmospheric Particles by Thermalloptical Methods. Environ. Sci. Technol. Vol 36 pp 5199- 5204.