conference call results q1 2017 - schweizer...2017/05/05 · 05/05/2017 © schweizer electronic ag...
TRANSCRIPT

CONFERENCE CALL RESULTS Q1 2017 May 5, 2017
Marc Bunz (CFO) | Nicolas-Fabian Schweizer (CTO)

© Schweizer Electronic AG Seite 2
AGENDA
Market & Strategy Update Financials 2016
Financials Q1 2017
Outlook
SCHWEIZER Share
05/05/2017 © Schweizer Electronic AG | SE/ IR Circulation and Publication subject to prior approval by Schweizer Electronic AG | Page 3
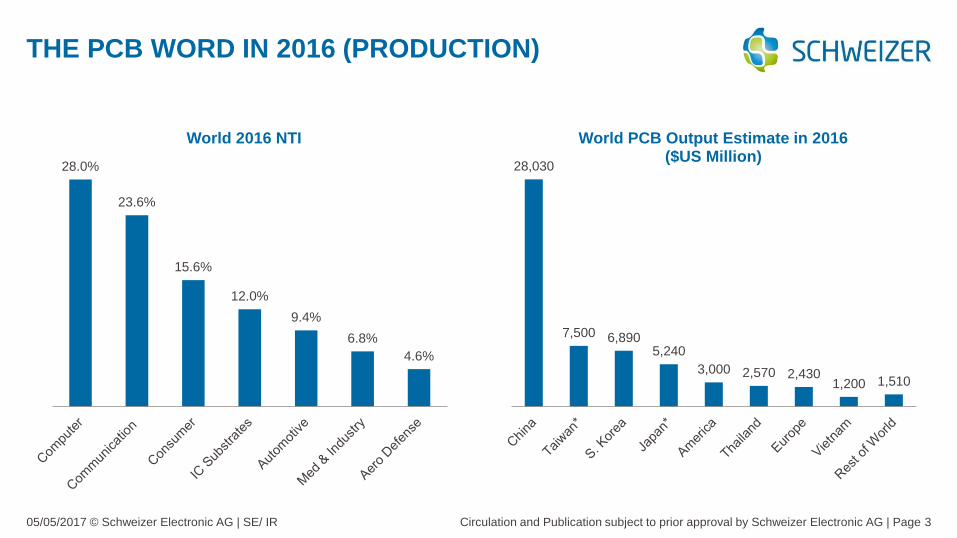
THE PCB WORD IN 2016 (PRODUCTION)
28.0%
23.6%
15.6%
12.0%
9.4%
6.8%
4.6%
World 2016 NTI
28,030
7,500 6,890 5,240
3,000 2,570 2,430 1,200 1,510
World PCB Output Estimate in 2016 ($US Million)

05/05/2017 © Schweizer Electronic AG | SE/ IR Circulation and Publication subject to prior approval by Schweizer Electronic AG | Page 4
• Based on Prismark’s research, the global PCB market is
expected to grow at 2.9% to 4% through to 2020. A large
percentage of the growth comes from China which
experiences the largest growth of between 4.2% and
6.0% through to 2020.
• Prismark has forecasted that the overall European PCB
market will contract at an annual rate of ~ 2% in the
coming years, due to the continuation of the shift from
European manufacturing to the Asian region.
• According to NTI, the annual growth in smartphone
shipments will be less than 5% in the coming years.
• Within the global PCB sector, the automotive segment of
the PCB sector is expected to deliver significant annual
growth.
GLOBAL PCB INDUSTRY
Time
Gro
wth
Global PCB Market : 2.9% - 4.0% annual growth from 2016-2020
PCB Market EU:
@ ~ 4% market share – YoY decline of ~ 2%
Automotive promises strong growth, less volatile
= everybody wants to participate
= Power, HF & Miniaturization
~ 8% market share in 2015 ~ 12% market share in 2020
Saturated Mobile Phone Market, new generation needs
new Technologies lots of “old technology” capacity
available
Source: Prismark, NTI, SE management
05/05/2017 © Schweizer Electronic AG | SE/ IR Circulation and Publication subject to prior approval by Schweizer Electronic AG | Page 5
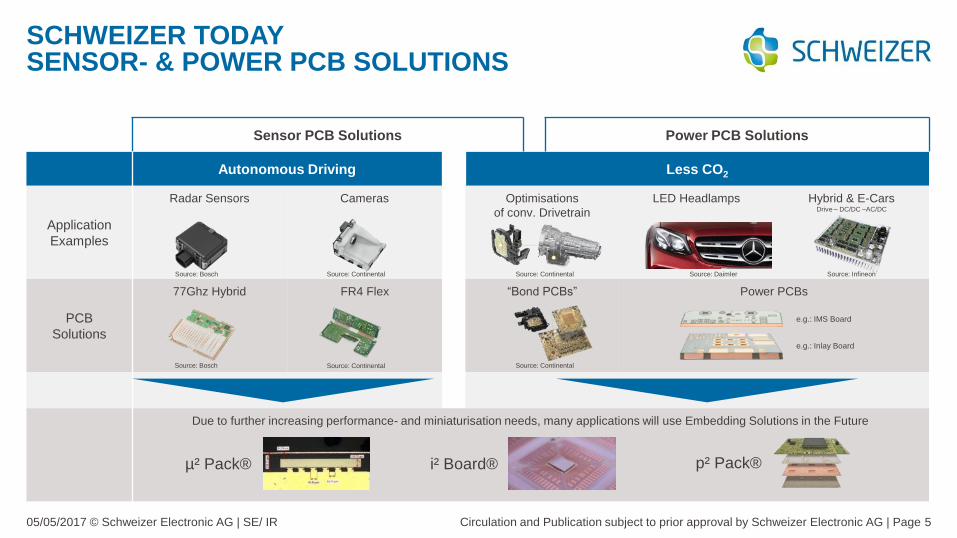
Sensor PCB Solutions Power PCB Solutions
Autonomous Driving Less CO2
Application
Examples
Radar Sensors Cameras Optimisations
of conv. Drivetrain
LED Headlamps Hybrid & E-Cars Drive – DC/DC –AC/DC
PCB
Solutions
77Ghz Hybrid FR4 Flex “Bond PCBs” Power PCBs
Due to further increasing performance- and miniaturisation needs, many applications will use Embedding Solutions in the Future
SCHWEIZER TODAY SENSOR- & POWER PCB SOLUTIONS
e.g.: Inlay Board
e.g.: IMS Board
p² Pack® i² Board® µ² Pack®
Source: Continental
Source: Continental
Source: Bosch
Source: Bosch
Source: Continental
Source: Continental
Source: Daimler Source: Infineon

05/05/2017 © Schweizer Electronic AG | SE/ IR Circulation and Publication subject to prior approval by Schweizer Electronic AG | Page 7
SE Market position
with Strategic partner
GROWTH STRATEGY
Embedding
Power
HF
e.g. Systems/Packaging
Powertrain
New core
competencies in new
fields
Add new core
competencies in
same/similar field
Growth in /
strengthening of core
competencies
grow with same
products in same
markets and/or region
(gain SoT)
Growth in disruptive
market segment
(new players, new
rules, high CAGR)
Existing competency
grow with same
products in new
markets and/or new
regions
Pure Organic Horizontal Diversification
w
Vertical Growth (SE‘s product innovation)
Ho
rizo
nta
l Gro
wth
(SE
inc
rea
sin
g s
ca
le)
Today
Le
ve
l 0
Le
ve
l 1
Le
ve
l 2
Level A Level B Level C
Le
ve
l 3
Meiko
WUS
Infineon SE
Acq
uis
ition P
ath
Industry Consolidation Path
05/05/2017 © Schweizer Electronic AG | SE/ IR Circulation and Publication subject to prior approval by Schweizer Electronic AG | Page 8
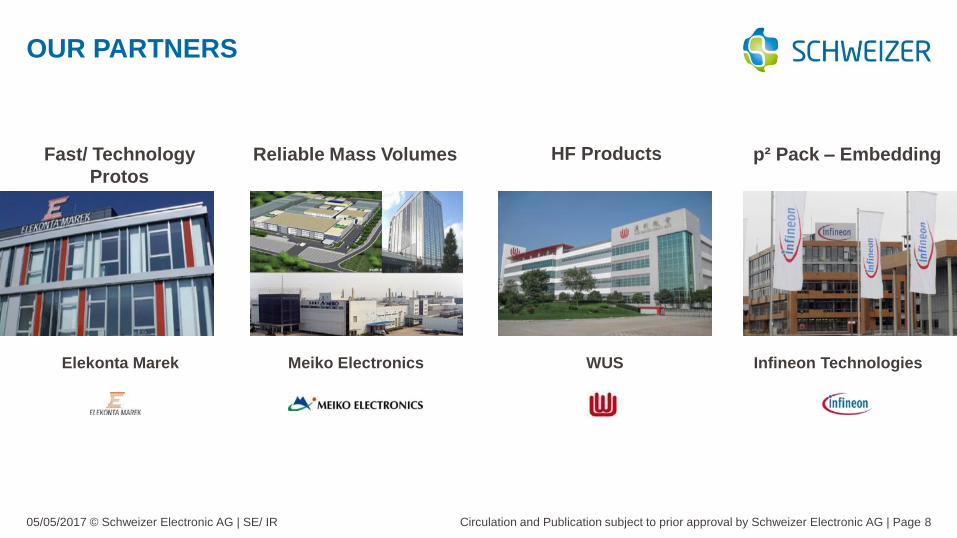
Elekonta Marek
OUR PARTNERS
Meiko Electronics WUS Infineon Technologies
Fast/ Technology
Protos
Reliable Mass Volumes HF Products p² Pack – Embedding

05/05/2017 © Schweizer Electronic AG | SE/ IR Circulation and Publication subject to prior approval by Schweizer Electronic AG | Page 9
SHAREHOLDER STRUCTURE
April, 2017 May, 2017

© Schweizer Electronic AG Seite 10
AGENDA
Market & Strategy Update
Financials 2016 Financials Q1 2017
Outlook
SCHWEIZER Share

05/05/2017 © Schweizer Electronic AG | SE/ IR Circulation and Publication subject to prior approval by Schweizer Electronic AG | Page 11
Key Figures
million EUR 2016 2015
Revenues 116.1 115.6 +0.5%
EBITDA 9.5 11.4 -16.7%
EBITDA Margin (%) 8.2 9.8
EBIT 1.8 3.7 -51.4%
EBIT Margin (%) 1.6 3.2
Open Orders 158.4 149.1 +6.2%
Order Intake 125.4 145.5 -13.8%
Profit after Tax 0.6 1.5 -58.4%
EPS (EUR) 0.16 0.39
Equity Ratio (%) 55.1 56.5
Net Gearing (%) -1.5 -5.1
FINANCIALS 2016
101,2
110,2 115,6 116,1
11.2 11.4 9.5
3.0 3.7 1.8 0.1 1.5 0.6
2013 2014 2015 2016
Sales EBITDA (IFRS) EBIT (IFRS) Profit after Tax (IFRS)
million EUR CAGR + 4,7 %
05/05/2017 © Schweizer Electronic AG | SE/ IR Circulation and Publication subject to prior approval by Schweizer Electronic AG | Page 12
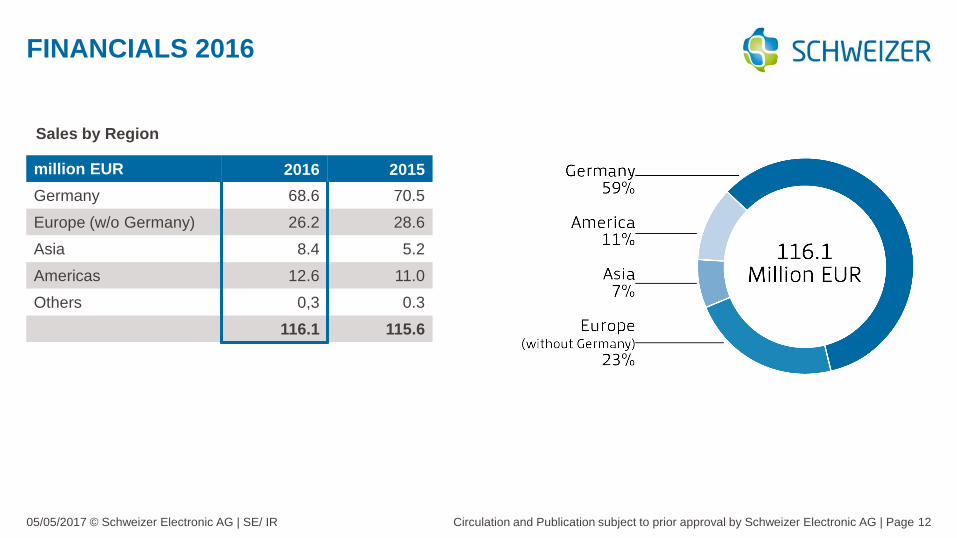
million EUR 2016 2015
Germany 68.6 70.5
Europe (w/o Germany) 26.2 28.6
Asia 8.4 5.2
Americas 12.6 11.0
Others 0,3 0.3
116.1 115.6
FINANCIALS 2016
Sales by Region

05/05/2017 © Schweizer Electronic AG | SE/ IR Circulation and Publication subject to prior approval by Schweizer Electronic AG | Page 13
million EUR 2016 2015
Automotive 87.8 84.7
Industry 21.0 23.0
Others 7.3 7.9
116.1 115.6
FINANCIALS 2016
Sales by Customer Segment

05/05/2017 © Schweizer Electronic AG | SE/ IR Circulation and Publication subject to prior approval by Schweizer Electronic AG | Page 14
FINANCIALS 2016
million EUR 2016 2015
Assets 117.7 119.4
Equity 64.8 67.4
Equity Ratio (%) 55.1 56.5
Net Gearing (%) -1.5 -5.1
Balance Structure

05/05/2017 © Schweizer Electronic AG | SE/ IR Circulation and Publication subject to prior approval by Schweizer Electronic AG | Page 15
FINANCIALS 2016
Cashflow
million EUR 2016 2015
Cashflow from
Operating Activities 6.5 4.9
Cashflow from
Investments -6.4 0.2
Cashflow from
Financing Activities -4.0 -2.7
Working Capital
million EUR 2016 2015
Inventory 16.2 15.5
Accounts
Receivables 23.5 23.3
Accounts
Payables 16.7 16.4
Working Capital 23.0 22.4

© Schweizer Electronic AG Seite 16
AGENDA
Market & Strategy Update
Financials 2016
Financials Q1 2017 Outlook
SCHWEIZER Share

05/05/2017 © Schweizer Electronic AG | SE/ IR Circulation and Publication subject to prior approval by Schweizer Electronic AG | Page 17
Key Figures
million EUR Q1 2017 Q1 2016
Revenues 32.4 28.2 +14.9%
EBITDA 3.5 2.2 +59.1%
EBITDA Margin (%) 10.7 7.8
EBIT 1.5 0.5 +200%
EBIT Margin (%) 4.5 1.8
Open Orders 157.5 150.0 +5.0%
Order Intake 31.7 29.3 +8.3%
Equity Ratio (%) 53.7 55.4
Net Gearing (%) 0.9 -2.5
FINANCIALS Q1 2017
28.2 29.8 29.1 29.0
32.4
2.2 2.4 2.9 2.0
3.5
0.5 0.4 0.9 0.0
1.5
Q1 2016 Q2 2016 Q3 2016 Q4 2016 Q1 2017
Sales EBITDA (IFRS) EBIT (IFRS)
million EUR
05/05/2017 © Schweizer Electronic AG | SE/ IR Circulation and Publication subject to prior approval by Schweizer Electronic AG | Page 18
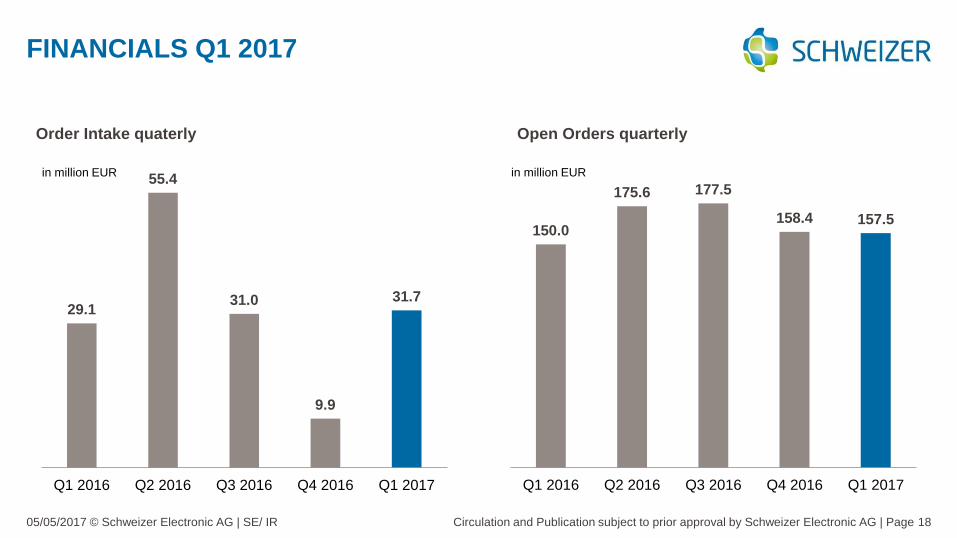
FINANCIALS Q1 2017
150.0
175.6 177.5
158.4 157.5
Q1 2016 Q2 2016 Q3 2016 Q4 2016 Q1 2017
in Mio. EUR in Mio. EUR in million EUR
29.1
55.4
31.0
9.9
31.7
Q1 2016 Q2 2016 Q3 2016 Q4 2016 Q1 2017
in Mio. EUR in Mio. EUR in million EUR
Order Intake quaterly Open Orders quarterly

05/05/2017 © Schweizer Electronic AG | SE/ IR Circulation and Publication subject to prior approval by Schweizer Electronic AG | Page 19
FINANCIALS Q1 2017
million EUR Q1 2017 Q1 2016
Germany 19.0 16.9
Europe (w/o Germany) 7.0 6.3
Asia 2.7 1.8
Americas 3.6 3.1
Others 0.1 0.1
32.4 28.2
Sales by Region

05/05/2017 © Schweizer Electronic AG | SE/ IR Circulation and Publication subject to prior approval by Schweizer Electronic AG | Page 20
FINANCIALS Q1 2017
million EUR Q1 2017 Q1 2016
Automotive 23.1 20.8
Industry 6.7 5.3
Others 2.6 2.1
32.4 28.2
Sales by Customer Segment

© Schweizer Electronic AG Seite 21
AGENDA
Market & Strategy Update
Financials 2016
Financials Q1 2017
Outlook SCHWEIZER Share

05/05/2017 © Schweizer Electronic AG | SE/ IR Circulation and Publication subject to prior approval by Schweizer Electronic AG | Page 22
OUTLOOK
Actual 2016 Target 2017
Sales / Growth Rate EUR 116.1 Mio. + 2 – 4%
EBITDA EUR 9.5 Mio. EUR 9,5 - 10,5 Mio.
EBITDA Margin 8.2% 8 – 9%
Investment Ratio 94.9% slightly higher 50%
Net Gearing -1.5% low single digits
Equity Ratio 55.1% 55 – 60%
Working Capital EUR 23.0 Mio. stable
depending on sales

© Schweizer Electronic AG Seite 23
AGENDA
Market & Strategy Update
Financials 2016
Financials Q1 2017
Outlook
SCHWEIZER Share

05/05/2017 © Schweizer Electronic AG | SE/ IR Circulation and Publication subject to prior approval by Schweizer Electronic AG | Page 24
SCHWEIZER SHARE
70%
80%
90%
100%
110%
120%
J16
F16
M16
A16
M16
J16
J16
A16
S16
O16
N16
D16
J17
F17
M17
A17
Schweizer Electronic AG TecDAX
Shareholder Structure Share Price 01 January 2016 – 30 April 2017

05/05/2017 © Schweizer Electronic AG | SE/ IR Circulation and Publication subject to prior approval by Schweizer Electronic AG | Page 25
DIVIDEND
0.55
0.60
0.65 0.65 0.651)
2012 2013 2014 2015 2016
Dividend (EUR)
2012 3,8%
2013 3,0%
2014 3,1%
2015 3,0%
2016 3.6%
1) Proposal to the Annual General Meeting 2) Dividend / Share Price at the Year End
Dividend Yield2)

Q & A

APPENDIX

05/05/2017 © Schweizer Electronic AG | SE/ IR Circulation and Publication subject to prior approval by Schweizer Electronic AG | Page 28
Date Publication/Event
2017-05-05 Interim Report 1st Quarter 2017
2017-05-05 Conference Call
2017-07-07 Annual General Meeting
2017-07-12 Planned Dividend Payment Date
2017-08-09 Financial Report (half-year)
2017-11-06 Interim Report 3st Quarter 2017
FINANCIAL CALENDER
05/05/2017 © Schweizer Electronic AG | SE/ IR Circulation and Publication subject to prior approval by Schweizer Electronic AG | Page 29
Nicolas-Fabian Schweizer
Chief Technology Officer
Ass. Jur. Nicolas-Fabian Schweizer is member of the Board since April 1st,
2011 and appointed until October 31st, 2018.
He is in charge of Sales & Marketing, Technology, the Division Systems,
Human Resources, Legal and Media & Communications.
Marc Bunz
Chief Financial Officer
Dipl.Kfm. Marc Bunz is member of the Board since April 1st, 2010 and
appointed until March 31st, 2018.
He is in charge of Operations, Finance & Controlling, Global Supply Chain,
Business Development, Information Technology, Purchasing and Investor
Relations.
EXECUTIVE BOARD
Bild vom GB

05/05/2017 © Schweizer Electronic AG | SE/ IR Circulation and Publication subject to prior approval by Schweizer Electronic AG | Page 30
This communication contains forward-looking statements and information – that is statements about events that lie in the future,
not the past. These forward-looking statements can be identified by formulations such as “expect”, “wish to”, “anticipate”,
“propose”, “plan”, “believe”, “seek to”, “estimate”, “become” or similar terms. While such forward-looking statements represent
our current expectations and particular assumptions, they are subject to various risks and uncertainties. A number of factors,
many of which are outside the control of Schweizer, have an impact on Schweizer’s business activities, strategy and results.
These factors could cause the actual results and performance of the Schweizer Group to differ materially from the information on
results and performance made explicit or implied in these forward-looking statements. On our part these uncertainties arise in
particular due to the following factors: Changes to the overall economic and business position (including margin developments in
the major divisions), challenges posed by the integration of important acquisitions and the implementation of joint ventures and
other major portfolio measures, changes to exchange and interest rates, the introduction of competing products or technologies
by other companies, failure to find acceptance of new products and services among Schweizer’s target client groups, changes to
the business strategy and various other factors. Should one or more of these risks or uncertainties be realised or it becomes
apparent that the underlying assumptions were incorrect, this could cause the actual results to differ materially both in a positive
and negative sense from the results referred to in forward-looking statements as expected, anticipated, proposed, planned,
projected or estimated. Schweizer does not obligate itself and does not intend to revise or correct these forward-looking
statements in light of developments which differ from those anticipated.
SAFE HARBOUR STATEMENT
