construction and analysis of generator actual capability …
TRANSCRIPT
CONSTRUCTION AND ANALYSIS OF GENERATOR ACTUAL
CAPABILITY CURVES USING THE NEW METHOD
M.M. Kostić*, N.Georgijević*, M. Ivanović*
Electrical Engineering Institute Nikola Tesla*
Abstract: • The actual capability curve of the generator can be determined by using the new
method for determination of Potier reactance, which is based on the no-load test and the
overexcitation test at zero-power-factor.
This method was tested on 348 MW turbogenerator unit at the "Kostolac B" thermal power plant,
and verified for operating modes around the rated value of active and reactive power, and adopted
by the Profession Council of JP EPS.
For the new study ″Generator capability curve construction (by the new method for determination
of Potier reactance)″, the capability curves are constructed for five turbogenerators, with power
rating from 110MW to 620MW. Capability curves from generator manufacturer's documentation
compared to the P-Q curves constructed using this new method, are significantly different.
Therefore, it was recommended to reconstruct P-Q curves periodically, every 6-7 years, or after
major repairs. Similar discrepancies of capability curves, compared to manufacturers, were obtained
during the testing of power generators in U.S.
Described differences of P-Q curves obtained using this new method compared to manufacturers
documentation are especially interesting for two turbogenerators, 110 MW and 200 MW connected
to 110 kV. Also, it was established that supply voltage variation within range 110 kV±5%, has
major influence on the capability curve region with coordinates (QG ≥ QG,N, PG ≤ PG,N), and the
corresponding results will be presented in this paper.
Key words: Potier reactance, no load test, reactive load test, capability curve.
1. INTRODUCTION
Generator capability curves (PG-QG) are necessary for the power plant operating stuff. The most
important part of this curve is the part which defines the generator regimes with increased reactive
power, within operating coordinates (QG ≥ QG,N, PG ≤ PG,N).
Significant differences of capability curves, compared to manufacturer's, were obtained during the
testing of power generators in U.S. [1, 2], Figure 1.
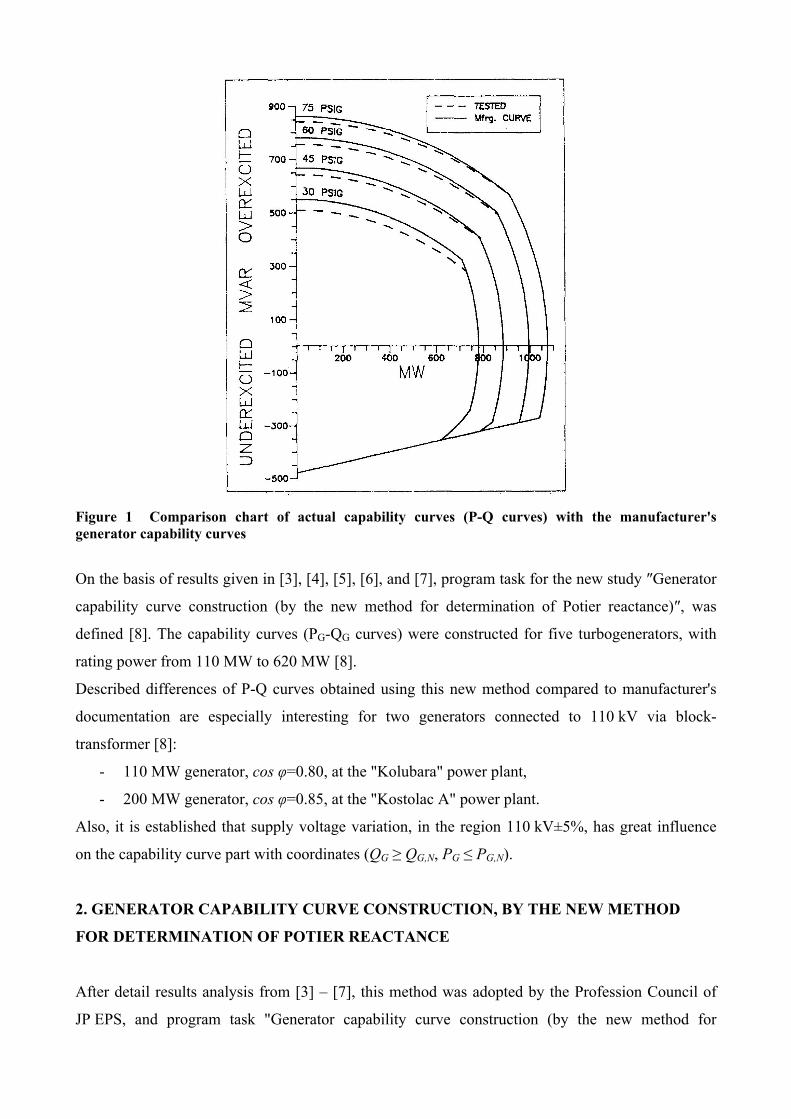
Figure 1 Comparison chart of actual capability curves (P-Q curves) with the manufacturer's generator capability curves
On the basis of results given in [3], [4], [5], [6], and [7], program task for the new study ″Generator
capability curve construction (by the new method for determination of Potier reactance)″, was
defined [8]. The capability curves (PG-QG curves) were constructed for five turbogenerators, with
rating power from 110 MW to 620 MW [8].
Described differences of P-Q curves obtained using this new method compared to manufacturer's
documentation are especially interesting for two generators connected to 110 kV via block-
transformer [8]:
- 110 MW generator, cos φ=0.80, at the "Kolubara" power plant,
- 200 MW generator, cos φ=0.85, at the "Kostolac A" power plant.
Also, it is established that supply voltage variation, in the region 110 kV±5%, has great influence
on the capability curve part with coordinates (QG ≥ QG,N, PG ≤ PG,N).
2. GENERATOR CAPABILITY CURVE CONSTRUCTION, BY THE NEW METHOD
FOR DETERMINATION OF POTIER REACTANCE
After detail results analysis from [3] – [7], this method was adopted by the Profession Council of
JP EPS, and program task "Generator capability curve construction (by the new method for
determination of Potier reactance)", was defined afterwards. Program task was defined for five
chosen turbogenerators in present working conditions, with usual Power System voltage regimes
[8]:
- A5 generator block, with 137.5 MVA rated apparent power and cosφ=0.80, at "Kolubara"
power plant;
- Generator block at "Morava" power plant, with 156.2/113 MVA rated/reduced apparent
power, and cosφ=0.80/0.84;
- A2 generator block, with 235.3 MVA rated apparent power and cosφ=0.85, at "Kostolac A"
power plant;
- B1, and B2 generator blocks, with 727.5 MVA rated apparent power and cosφ=0.85, at
"Nikola Tesla" power plant;
Parameters derived by manufacturers for these five generators are shown in Table 1
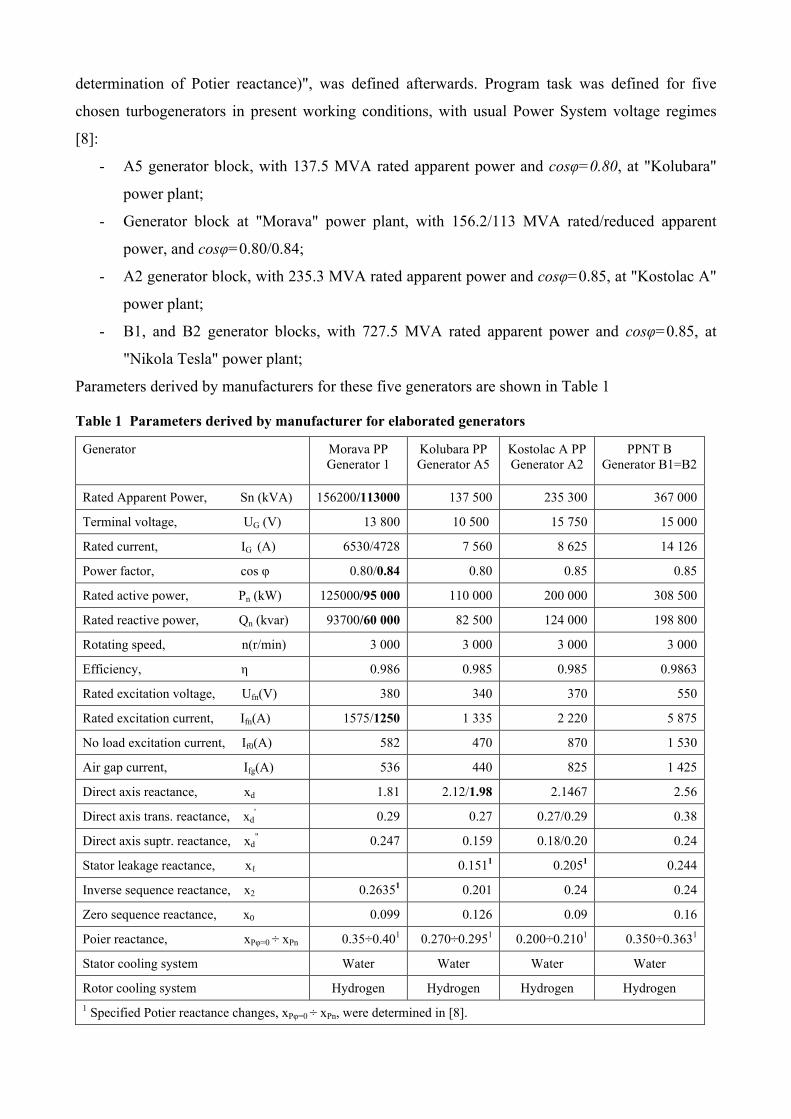
Table 1 Parameters derived by manufacturer for elaborated generators
Generator Morava PP Generator 1
Kolubara PP Generator A5
Kostolac A PP Generator A2
PPNT B Generator B1=B2
Rated Apparent Power, Sn (kVA) 156200/113000 137 500 235 300 367 000
Terminal voltage, UG (V) 13 800 10 500 15 750 15 000
Rated current, IG (A) 6530/4728 7 560 8 625 14 126
Power factor, cos φ 0.80/0.84 0.80 0.85 0.85
Rated active power, Pn (kW) 125000/95 000 110 000 200 000 308 500
Rated reactive power, Qn (kvar) 93700/60 000 82 500 124 000 198 800
Rotating speed, n(r/min) 3 000 3 000 3 000 3 000
Efficiency, η 0.986 0.985 0.985 0.9863
Rated excitation voltage, Ufn(V) 380 340 370 550
Rated excitation current, Ifn(A) 1575/1250 1 335 2 220 5 875
No load excitation current, If0(A) 582 470 870 1 530
Air gap current, Ifg(A) 536 440 825 1 425
Direct axis reactance, xd 1.81 2.12/1.98 2.1467 2.56
Direct axis trans. reactance, xd' 0.29 0.27 0.27/0.29 0.38
Direct axis suptr. reactance, xd" 0.247 0.159 0.18/0.20 0.24
Stator leakage reactance, xℓ 0.1511 0.2051 0.244
Inverse sequence reactance, x2 0.26351 0.201 0.24 0.24
Zero sequence reactance, x0 0.099 0.126 0.09 0.16
Poier reactance, xPφ=0 ÷ xPn 0.35÷0.401 0.270÷0.2951 0.200÷0.2101 0.350÷0.3631
Stator cooling system Water Water Water Water
Rotor cooling system Hydrogen Hydrogen Hydrogen Hydrogen
1 Specified Potier reactance changes, xPφ=0 ÷ xPn, were determined in [8].
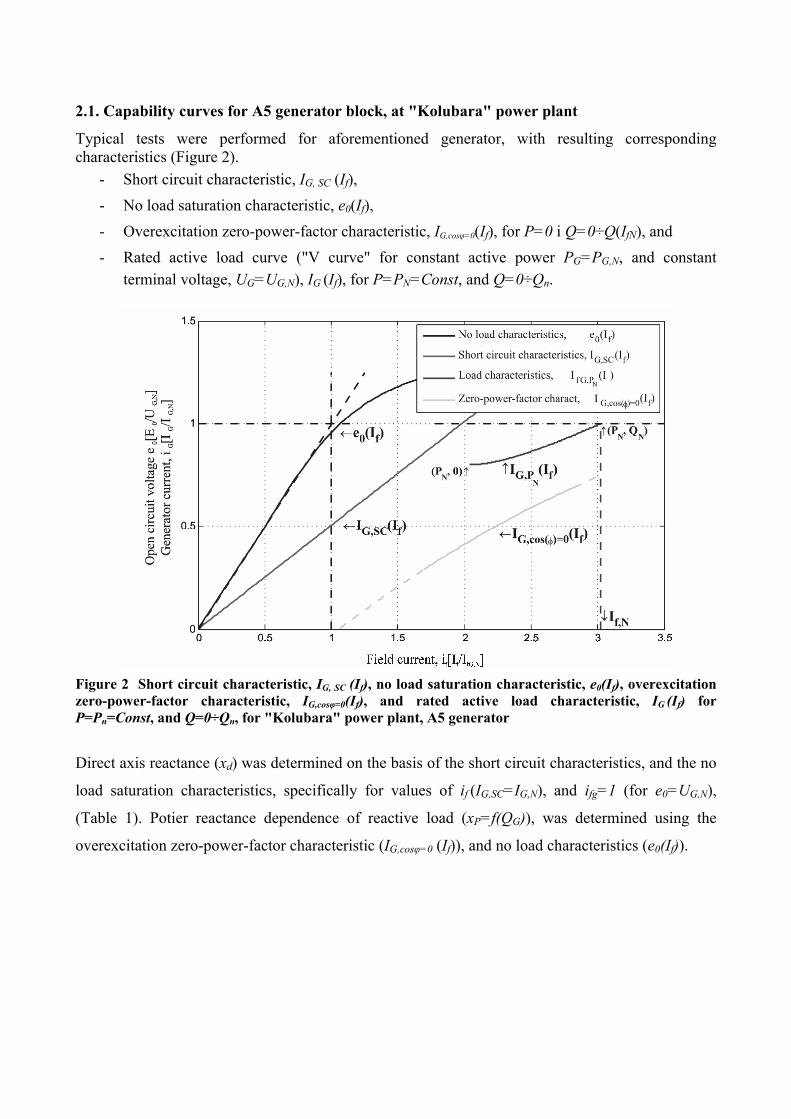
2.1. Capability curves for A5 generator block, at "Kolubara" power plant
Typical tests were performed for aforementioned generator, with resulting corresponding characteristics (Figure 2).
- Short circuit characteristic, IG, SC (If),
- No load saturation characteristic, e0(If),
- Overexcitation zero-power-factor characteristic, IG,cosφ=0(If), for P=0 i Q=0÷Q(IfN), and
- Rated active load curve ("V curve" for constant active power PG=PG,N, and constant
terminal voltage, UG=UG,N), IG (If), for P=PN=Const, and Q=0÷Qn.
Figure 2 Short circuit characteristic, IG, SC (If), no load saturation characteristic, e0(If), overexcitation zero-power-factor characteristic, IG,cosφ=0(If), and rated active load characteristic, IG (If) for
P=Pn=Const, and Q=0÷Qn, for "Kolubara" power plant, A5 generator
Direct axis reactance (xd) was determined on the basis of the short circuit characteristics, and the no
load saturation characteristics, specifically for values of if (IG,SC=IG,N), and ifg=1 (for e0=UG,N),
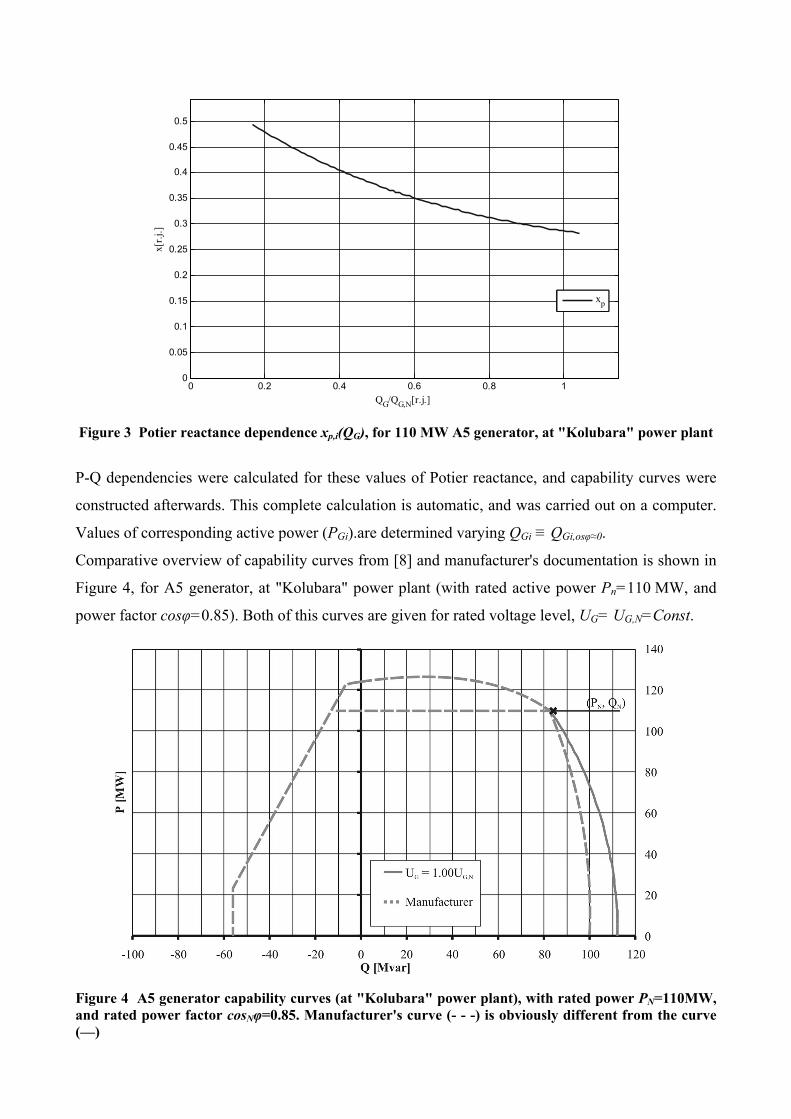
(Table 1). Potier reactance dependence of reactive load (xP=f(QG)), was determined using the
overexcitation zero-power-factor characteristic (IG,cosφ=0 (If)), and no load characteristics (e0(If)).
0 0.2 0.4 0.6 0.8 10
0.05
0.1
0.15
0.2
0.25
0.3
0.35
0.4
0.45
0.5
QG/QG,N[r.j.]
x[r
.j.]
xp
Figure 3 Potier reactance dependence xp,i(QG), for 110 MW A5 generator, at "Kolubara" power plant
P-Q dependencies were calculated for these values of Potier reactance, and capability curves were
constructed afterwards. This complete calculation is automatic, and was carried out on a computer.
Values of corresponding active power (PGi).are determined varying QGi ≡ QGi,osφ≈0.
Comparative overview of capability curves from [8] and manufacturer's documentation is shown in
Figure 4, for A5 generator, at "Kolubara" power plant (with rated active power Pn=110 MW, and
power factor cosφ=0.85). Both of this curves are given for rated voltage level, UG= UG,N=Const.
Figure 4 A5 generator capability curves (at "Kolubara" power plant), with rated power PN=110MW, and rated power factor cosNφ=0.85. Manufacturer's curve (- - -) is obviously different from the curve (—)

In practice, terminal voltage changes significantly by (reactive) power variation, even if there is no
voltage change in the connection point of the high voltage network and the block-transformer
(UPSYS=Const). In addition to Figure 4, P-Q curve for constant voltage of the high voltage
connection point is shown in Figure 5. Latter curve (UPSYS=Const) is below the first curve, i.e. for
given active power, maximum reactive power is less than in the first case. This could be concluded
from the fact, that terminal voltage rises as the reactive power rises above rated value (UG>UG,N).
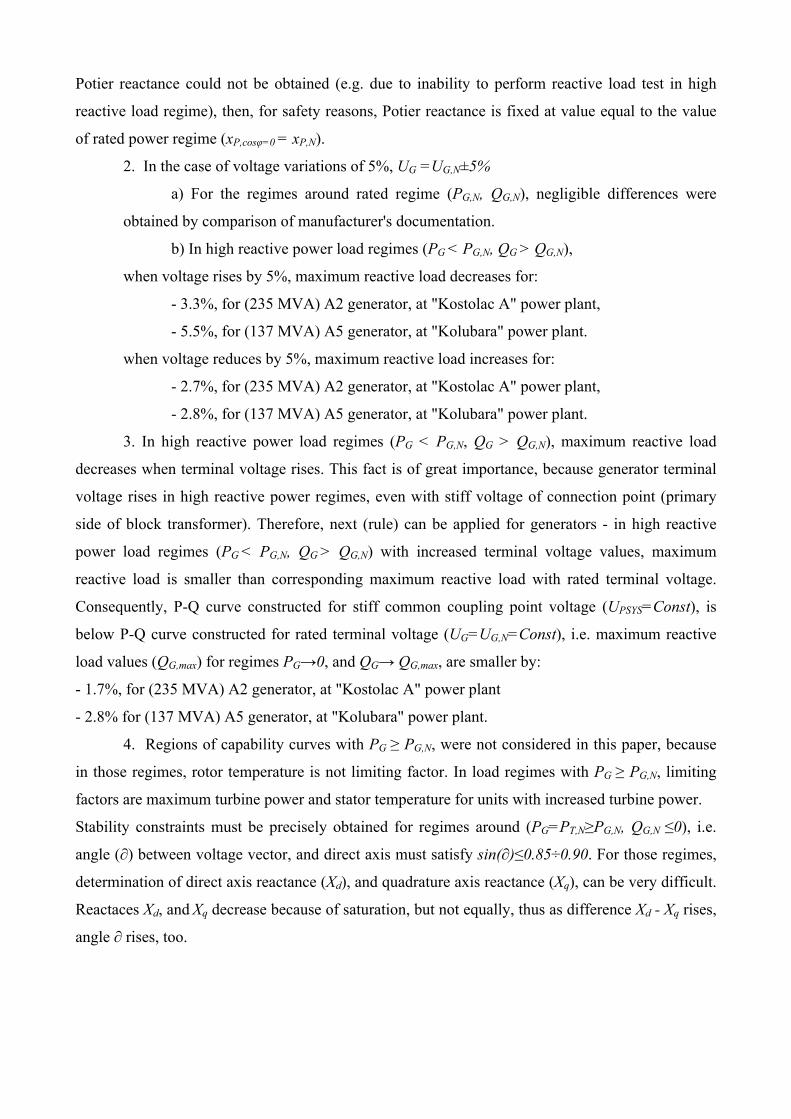
Therefore, it is useful to construct two more P-Q curves, for terminal voltage levels of UG1=
0.95UG,N=Const, and UG2= 1.05UG,N=Const. All these curves are shown in Figure 6
Figure 5 A5 generator capability curves (at "Kolubara" power plant), with rated power PN=110MW, and rated power factor cosφN=0.85. Manufacturer's curve for UG= UG,N=Const is dashed (- - -), and curves for UG= UG,N=Const, and UPSYS=Const, are solid (—)
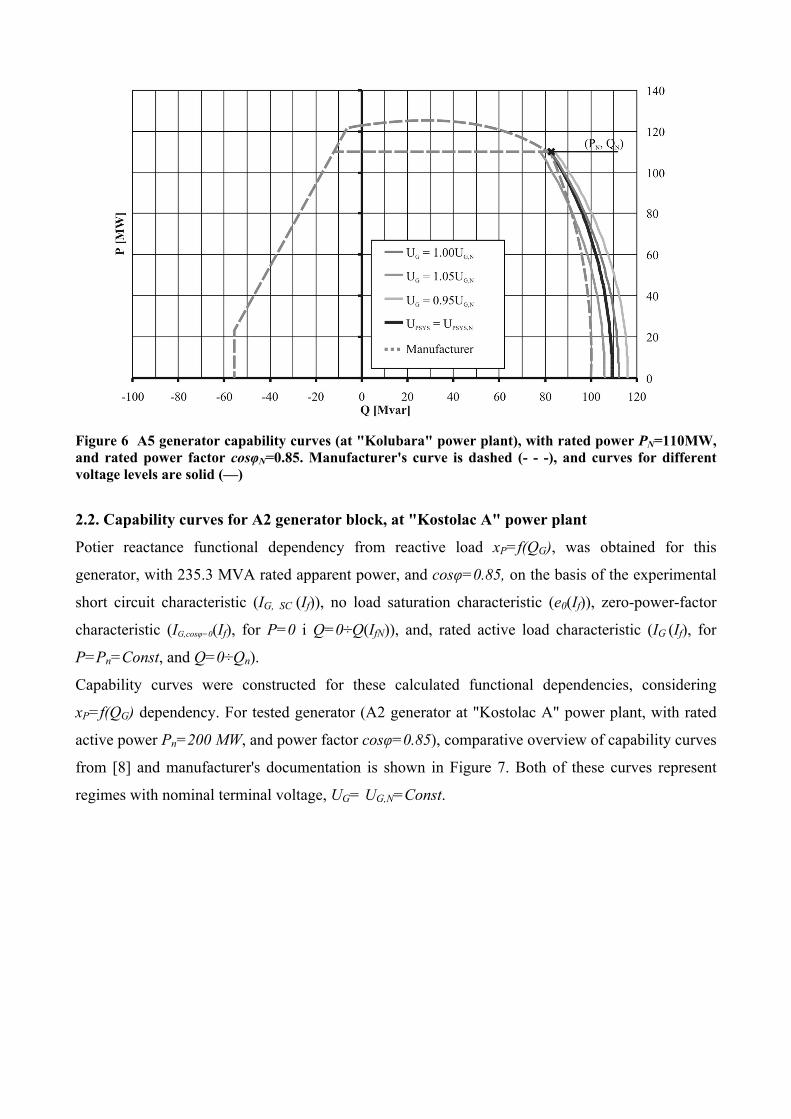
Figure 6 A5 generator capability curves (at "Kolubara" power plant), with rated power PN=110MW, and rated power factor cosφN=0.85. Manufacturer's curve is dashed (- - -), and curves for different voltage levels are solid (—)
2.2. Capability curves for A2 generator block, at "Kostolac A" power plant
Potier reactance functional dependency from reactive load xP=f(QG), was obtained for this
generator, with 235.3 MVA rated apparent power, and cosφ=0.85, on the basis of the experimental
short circuit characteristic (IG, SC (If)), no load saturation characteristic (e0(If)), zero-power-factor
characteristic (IG,cosφ=0(If), for P=0 i Q=0÷Q(IfN)), and, rated active load characteristic (IG (If), for
P=Pn=Const, and Q=0÷Qn).
Capability curves were constructed for these calculated functional dependencies, considering
xP=f(QG) dependency. For tested generator (A2 generator at "Kostolac A" power plant, with rated
active power Pn=200 MW, and power factor cosφ=0.85), comparative overview of capability curves
from [8] and manufacturer's documentation is shown in Figure 7. Both of these curves represent
regimes with nominal terminal voltage, UG= UG,N=Const.

Figure 7 A2 generator capability curves (at "Kostolac A" power plant), with rated power PN=200MW, and rated power factor cosφN=0.85. Manufacturer's curve (- - -) is obviously different from the curve (—)
In practice, terminal voltage changes significantly by (reactive) power variation, even if there is no
voltage change in the connection point of the high voltage network and the block-transformer
(UPSYS=Const). In addition to Figure 7, P-Q curve for constant voltage of the high voltage
connection point is shown in Figure 8. Latter curve (UPSYS=Const) is below the first curve, i.e. for
given active power, maximum reactive power is less than in the first case. This could be concluded
from the fact, that terminal voltage rises as the reactive power rises above rated value (UG>UG,N).
Also, on Figure 8, two more P-Q curves are shown for terminal voltage levels of UG1=
0.95UG,N=Const, and UG2= 1.05UG,N=Const

Figure 8 A2 generator capability curves (with rated power PN=110MW, and power factor cosφN=0.85). Manufacturer's curve is dashed (- - -), and curves for different voltage levels are solid (—)
3. GENERAL ANALYSIS OF TESTED GENERATOR'S CAPABILITY CURVES
In this paper, the results of real capability curve constructions (by "The new method for determining
Potier reactance") for actual working conditions, and usual power system regimes, are shown for:
- A5 generator, at "Kolubara" power plant (with 137.5 MVA rated apparent power,
cosφ=0.80)
- A2 generator, at "Kostolac A" power plant (with 235.3 MVA rated apparent power,
cosφ=0.85)
Based on capability curves comparison, qualitative results, that can be applied for all generators
(with small value deviations), were observed, [8]:
1. For rated terminal voltage (UG1 =UG,N):
a) in load regimes around rated values, there are no differences between curves in
manufacturer's documentation and curves obtained in this paper
b) in high reactive power load regimes (PG < PG,N, QG > QG,N), maximum allowed
reactive loads are larger by 10-12 % than corresponding reactive loads form manufacturer's
documentation.
Later is explained by the fact that Potier reactance is smaller in high reactive load regimes than in
rated regime (xP ≤ xP,N), as it is not usually assumed with capability curves provided by
manufacturer. The reason for this conservative approach is as follows – when accurate values of
Potier reactance could not be obtained (e.g. due to inability to perform reactive load test in high
reactive load regime), then, for safety reasons, Potier reactance is fixed at value equal to the value
of rated power regime (xP,cosφ=0 = xP,N).
2. In the case of voltage variations of 5%, UG =UG,N±5%
a) For the regimes around rated regime (PG,N, QG,N), negligible differences were
obtained by comparison of manufacturer's documentation.
b) In high reactive power load regimes (PG < PG,N, QG > QG,N),
when voltage rises by 5%, maximum reactive load decreases for:
- 3.3%, for (235 MVA) A2 generator, at "Kostolac A" power plant,
- 5.5%, for (137 MVA) A5 generator, at "Kolubara" power plant.
when voltage reduces by 5%, maximum reactive load increases for:
- 2.7%, for (235 MVA) A2 generator, at "Kostolac A" power plant,
- 2.8%, for (137 MVA) A5 generator, at "Kolubara" power plant.
3. In high reactive power load regimes (PG < PG,N, QG > QG,N), maximum reactive load
decreases when terminal voltage rises. This fact is of great importance, because generator terminal
voltage rises in high reactive power regimes, even with stiff voltage of connection point (primary
side of block transformer). Therefore, next (rule) can be applied for generators - in high reactive
power load regimes (PG < PG,N, QG > QG,N) with increased terminal voltage values, maximum
reactive load is smaller than corresponding maximum reactive load with rated terminal voltage.
Consequently, P-Q curve constructed for stiff common coupling point voltage (UPSYS=Const), is
below P-Q curve constructed for rated terminal voltage (UG=UG,N=Const), i.e. maximum reactive
load values (QG,max) for regimes PG→0, and QG→ QG,max, are smaller by:
- 1.7%, for (235 MVA) A2 generator, at "Kostolac A" power plant
- 2.8% for (137 MVA) A5 generator, at "Kolubara" power plant.
4. Regions of capability curves with PG ≥ PG,N, were not considered in this paper, because
in those regimes, rotor temperature is not limiting factor. In load regimes with PG ≥ PG,N, limiting
factors are maximum turbine power and stator temperature for units with increased turbine power.
Stability constraints must be precisely obtained for regimes around (PG=PT,N≥PG,N, QG,N ≤0), i.e.
angle (∂) between voltage vector, and direct axis must satisfy sin(∂)≤0.85÷0.90. For those regimes,
determination of direct axis reactance (Xd), and quadrature axis reactance (Xq), can be very difficult.
Reactaces Xd, and Xq decrease because of saturation, but not equally, thus as difference Xd - Xq rises,
angle ∂ rises, too.

3. CONCLUSION
Presented results show that real capability curves are, somewhat, different from the curves from
manufacturer's documentation. Similar differences that could be obtained for hydro generators are
likely even larger, because of larger deviation of magnetizing characteristics (magnetizing
characteristics deviations have been obtained for almost all hydro generators working for few
decades). More importantly, these generators work in high reactive power regimes, or even pure
reactive load regimes, more often, i.e. when there is a great need for local reactive power (because
long distant reactive power transport causes additional power losses), and there is not enough water.
REFERENCES
[1] E. Nilsson, J. Mersurio, Synchronous Generator Capability Curve Testing and Evolution, IEEE Tran.
Power Delivery and Systems, V. No. 2 January 1994, pp. 414-424
[2] M. M. Adibi, D. P. Milanović, Reactive Capability Limitation of Synchronous Machines, IEEE Tran.
Power Delivery and Systems, Vol. 9, No. 1, January 1994, pp. 29-40
[3] M.M.Kostic, B.Kostić, M.Ivanović, Construction of generator capable curves by new method for
determining of Potier reactance, Proceedings, International Conference Power Plants 2010, Vrnjačka
Banja-Serbia, October 2010.
[4] M.M.Kostic, Proposal for addition of IEC 34-4 Standard in part for determination of Potier reactance,
Proceedings, International Conference Power Plants 2010, Vrnjačka Banja-Serbia, October 2010.
[5] M. Kostić, B. Kostić, Studija Određivanje karakteristika regulacije, gubitaka snage i stvarnih
dijagrama aktivnih i reaktivnih snaga (P-Q krive generatora) blokova B1 i B2 u TE Kostolac B,
Elektrotehnički institut Nikola Tesla, Beograd 2010, str. 60.
[6] M. M. Kostić, "Nova metoda za određivanje Potjeove reaktanse sinhronih turbogeneratora",
"Elektroprivreda", No 4, 2009, str. 59-68
[7] M. M .Kostić, "Novo pravilo za određivanje Potjeove reaktanse za relevantna opterećenja
turbogeneratora", (rad je poslat u časopis "Elektroprivreda", Beograd, u januaru 2010. god.)
[8] M. Kostić, N. Georgijević, Konstruisanje stvarnih pogonskih karakteristika generatora (po novoj
metodi za određivanje Potjeove reaktanse), Elektrotehnički institut Nikola Tesla, Beograd 2012