cost and benefits of shifting towards low temperature
TRANSCRIPT
Cost and benefits of shifting towards lowtemperature district heating
Kirasić, Edi
Master's thesis / Diplomski rad
2021
Degree Grantor / Ustanova koja je dodijelila akademski / stručni stupanj: University of Zagreb, Faculty of Mechanical Engineering and Naval Architecture / Sveučilište u Zagrebu, Fakultet strojarstva i brodogradnje
Permanent link / Trajna poveznica: https://urn.nsk.hr/urn:nbn:hr:235:225497
Rights / Prava: In copyright
Download date / Datum preuzimanja: 2021-12-04
Repository / Repozitorij:
Repository of Faculty of Mechanical Engineering and Naval Architecture University of Zagreb
UNIVERSITY OF ZAGREB
Faculty of Mechanical Engineering and Naval Architecture
MASTER’S THESIS
Edi Kirasić
Zagreb, 2021

UNIVERSITY OF ZAGREB
Faculty of Mechanical Engineering and Naval Architecture
MASTER’S THESIS
Supervisor: Student:
Dr. Sc. Tomislav Pukšec Edi Kirasić
Zagreb, 2021

Izjavljujem da sam ovaj rad izradio samostalno koristeći znanja stečena tijekom studija i
navedenu literaturu.
Zahvaljujem se profesoru Tomislavu Pukšecu što mi je pružio priliku da pišem ovaj rada.
Posebno se zahvaljujem, Hrvoju Dorotiću, mentoru i prijatelju, na svom strpljenju, potpori
i savjetima koja mi je pružio prilikom pisanja ovog rada, ali i tijekom studiranja.
Naravno, želim se zahvaliti čitavoj svojoj obitelji i prijateljima na potpori tijekom
studiranja i nezaboravnih studentskih dana. Najviše se želim zahvaliti mami, svojoj sigurnoj
luci i stijeni, ali i tati, koji je i tijekom cijelog mog studiranja s neba pazio na mene.
Edi Kirasić
Edi Kirasić Master’s thesis
Faculty of Mechanical Engineering and Naval Architecture I
TABLE OF CONTENT
TABLE OF CONTENT .............................................................................................................. I
LIST OF FIGURES .................................................................................................................... II
LIST OF TABLES ................................................................................................................... III
NOMENCLATURE ................................................................................................................. IV
LIST OF ABBREVIATIONS (ACRONYMS) ......................................................................... V
SUMMARY ............................................................................................................................ VII
SAŽETAK ............................................................................................................................. VIII
1. INTRODUCTION ............................................................................................................... 1
2. LOW AND ULTRA-LOW TEMPERATURE DISTRICT HEATING .............................. 3
2.1. Heat sources ................................................................................................................. 3
2.2. Thermal energy storage ................................................................................................ 5
2.3. Network design ............................................................................................................ 6
2.4. Consumer substation .................................................................................................... 8
2.4.1. Space heating ........................................................................................................ 8
2.4.2. Domestic hot water preparation .......................................................................... 10
3. METHOD .......................................................................................................................... 16
3.1. Heat demand .............................................................................................................. 16
3.2. Network heat losses and pumping power .................................................................. 17
3.3. Heat pumps coefficients of performances .................................................................. 19
3.4. Systems seasonal coefficient of performance ............................................................ 22
3.5. Levelized cost of heat, carbon emission, and primary energy factors ....................... 23
4. CASE STUDY ................................................................................................................... 24
4.1. Input data .................................................................................................................... 29
4.2. System components sizing and costs ......................................................................... 34
5. RESULTS AND DISCUSSION ........................................................................................ 37
5.1. Levelized cost of heat (LCOH) .................................................................................. 38
5.2. Primary energy factor ................................................................................................. 51
5.3. CO2 factor .................................................................................................................. 57
6. CONCLUSION ................................................................................................................. 63
ACKNOWLEDGEMENT ....................................................................................................... 64
LITERATURE ......................................................................................................................... 65
ANNEX .................................................................................................................................... 69

Edi Kirasić Master’s thesis
Faculty of Mechanical Engineering and Naval Architecture II
LIST OF FIGURES
Figure 1 District heating development timeline [1] ............................................................... 1
Figure 2 Different types of connection to existing network [8] ............................................ 5
Figure 3 Tree and ring structure of a DH [7] ......................................................................... 6
Figure 4 Twin pipe configurations [4] ................................................................................... 7
Figure 5 Double pipe network [4] .......................................................................................... 7
Figure 6 Space heating temperature regimes in different systems [13] ................................. 8
Figure 7 Direct connection of SH [14] .................................................................................. 9
Figure 8 Indirect connection of SH [14] ................................................................................ 9
Figure 9 Legionella growth/decay rate [7] .......................................................................... 10
Figure 10 Instantaneous heat exchanger unit [7] ................................................................... 11
Figure 11 District heating storage unit [7] ............................................................................. 12
Figure 12 Apartment DHW units in multi-storey building [7] .............................................. 12
Figure 13 Booster HP with DH storage on the primary side [14] ......................................... 13
Figure 14 Booster HP for DHW (parallel connection to heating) [14] ................................. 13
Figure 15 Booster HP for DHW (serial connection to heating) [14] ..................................... 14
Figure 16 Operation modes of booster HP on the secondary side [14] ................................. 14
Figure 17 Air booster HP on the secondary side [14] ............................................................ 15
Figure 18 Heat loss data from existing DH networks in Denmark [15] ................................ 18
Figure 19 Cycle of a simple heat pump process and its heat load diagram [21] ................... 19
Figure 20 Lorenz efficiency curves [21] ................................................................................ 21
Figure 21 Four scenarios considered in the calculation [15] ................................................. 24
Figure 22 LTDH network ...................................................................................................... 25
Figure 23 ULTDH network with booster HP at consumer substation ................................... 25
Figure 24 ULTDH network with micro HP at consumer substation ..................................... 26
Figure 25 ULTDH network with ASHP at consumer substation .......................................... 26
Figure 26 Average outdoor temperature in Croatia in 2018 [26] .......................................... 29
Figure 27 Relative SH demand curve for Croatia in 2018 [13] ............................................. 30
Figure 28 Relative DHW demand curve for Croatia in 2018 [13] ........................................ 30
Figure 29 Heat loss curve [27] ............................................................................................... 31
Figure 30 ULTDH temperature variations [28] ..................................................................... 32
Figure 31 LTDH temperature variations [28] ........................................................................ 32
Figure 32 ULTDH network temperatures through the year .................................................. 33
Figure 33 LTDH network temperatures through the year ..................................................... 33
Figure 34 Pipe total cost as a diameter function [36] ............................................................ 35
Figure 35 LTDH network COP values .................................................................................. 37
Figure 36 ULTDH network COP values ............................................................................... 37
Figure 37 LCOH values for SH share=0,1 and plot ratio=0,2 ............................................... 38
Figure 38 Detailed overview of LCOH, SH share=0,1, plot ratio=0,2 .................................. 39
Figure 39 LCOH values for SH share=0,5 and plot ratio=1,2 ............................................... 40
Figure 40 Detailed overview of LCOH, SH share=0,5, plot ratio=1,2 .................................. 41
Figure 41 LCOH values for SH share=0,8 and plot ratio=2,0 ............................................... 42
Figure 42 Detailed overview of LCOH, SH share=0,8, plot ratio=2,0 .................................. 43
Edi Kirasić Master’s thesis
Faculty of Mechanical Engineering and Naval Architecture III
LIST OF TABLES
Table 1 ULTDH and LTDH main characteristics [3] .......................................................... 3
Table 2 TES characteristics [10] .......................................................................................... 5
Table 3 Scenarios characteristics ........................................................................................ 27
Table 4 Temperature of LTDH and ULTDH networks [°C] .............................................. 28
Table 5 DH components investment cost [15] ................................................................... 34
Table 6 Components O&M costs ....................................................................................... 35
Table 7 LCOH-LTDH_Micro_ASHP ................................................................................ 44
Table 8 LCOH-ULTDH_Micro_GWHP ............................................................................ 45
Table 9 LCOH-ULTDH_Micro_EH1HEX ........................................................................ 46
Table 10 LCOH-ULTDH_Micro_EH2HP ........................................................................... 46
Table 11 LCOH-ULTDH_Micro_EH3HP ........................................................................... 47
Table 12 LCOH-ULTDH_Air_ASHP .................................................................................. 48
Table 13 LCOH-ULTDH_Booster_ASHP ........................................................................... 48
Table 14 LCOH-LTDH_ASHP ............................................................................................ 49
Table 15 The Lowest LCOH ................................................................................................ 49
Table 16 The Lowest LCOH-cases ...................................................................................... 50
Table 17 The Lowest LCOH without the EH ....................................................................... 51
Table 18 The Lowest LCOH without the EH-cases ............................................................. 51
Table 19 Primary energy factor-ULTDH_Micro_ASHP ..................................................... 52
Table 20 Primary energy factor-ULTDH_Micro_GWHP ................................................... 53
Table 21 Primary energy factor-ULTDH_Micro_EH1HEX ................................................ 53
Table 22 Primary energy factor-ULTDH_Micro_EH2HP ................................................... 54
Table 23 Primary energy factor-ULTDH_Micro_EH3HP ................................................... 54
Table 24 Primary energy factor-ULTDH_Air_ASHP ......................................................... 55
Table 25 Primary energy factor-ULTDH_Booster_ASHP .................................................. 55
Table 26 Primary energy factor-LTDH_ASHP .................................................................... 56
Table 27 The lowest primary energy factor ......................................................................... 56
Table 28 CO2 factor-ULTDH_Micro_ASHP ....................................................................... 57
Table 29 CO2 factor-ULTDH_Micro_GWHP ..................................................................... 58
Table 30 CO2 factor-ULTDH_Micro_EH1HEX .................................................................. 58
Table 31 CO2 factor-ULTDH_Micro_EH2HP ..................................................................... 59
Table 32 CO2 factor-ULTDH_Micro_EH3HP ..................................................................... 59
Table 33 CO2 factor-ULTDH_Air_ASHP ........................................................................... 60
Table 34 CO2 factor-ULTDH_Booster_ASHP .................................................................... 61
Table 35 CO2 factor-LTDH_ASHP ...................................................................................... 61
Table 36 The lowest carbon emission factor ........................................................................ 62
Edi Kirasić Master’s thesis
Faculty of Mechanical Engineering and Naval Architecture IV
NOMENCLATURE
LTDH Low-temperature district heating
ULTDH Ultra-low temperature district heating
DH District heating
DHW Domestic hot water
SH Space hating
HEX Heat exchanger
HP Heat pump
HTDH High-temperature district heating
TES Thermal energy storage
RES Renewable energy source
IHEU Instantaneous heat exchanger
DHSU District heating storage unit
EU European Union
UV Ultraviolet
LHDD Linear heat density demand
ASHP Air source heat pump
GWHP Groundwater heat pump
EH Excess heat
GB Gas boiler
Edi Kirasić Master’s thesis
Faculty of Mechanical Engineering and Naval Architecture V
LIST OF ABBREVIATIONS (ACRONYMS)
Nomenclature Unit Description
𝑞𝐷𝐻𝑊 𝑘𝑊ℎ/𝑚2𝑎 specific annual domestic hot water demand
𝐴𝑑𝑖𝑠𝑡𝑟𝑖𝑐𝑡 𝑚2 district area
𝐴𝑏𝑢𝑖𝑙𝑑𝑖𝑛𝑔𝑠 𝑚2 buildings area
𝜖 − plot ratio
𝑄𝑡𝑜𝑡,𝐷𝐻𝑊 𝑀𝑊ℎ/𝑎 total annual domestic hot water demand
𝑠𝐻 − space heating share
𝑞𝑆 𝑘𝑊ℎ/𝑚2𝑎 specific annual heat demand
𝑞𝑆𝐻 𝑘𝑊ℎ/𝑚2𝑎 specific annual space heating demand
𝑄𝑡𝑜𝑡 𝑀𝑊ℎ/𝑎 total annual heat demand
𝑄𝑡𝑜𝑡,𝑆𝐻 𝑀𝑊ℎ/𝑎 total annual space heating demand
𝑤 − effective width
𝑞𝑙 𝑀𝑊ℎ/𝑚 linear heat density demand
𝐿 𝑚 trench length
𝑑𝑎 𝑚 average pipe diameter
𝑄𝑙𝑜𝑠𝑠 𝑀𝑊ℎ/𝑎 total annual heat losses
𝑇𝑠𝑢𝑝𝑝𝑙𝑦 ℃ network supply temperature
𝑇𝑟𝑒𝑡𝑢𝑟𝑛 ℃ network return temperature
𝑇𝑔𝑟𝑜𝑢𝑛𝑑 ℃ ground temperature
�̅�𝑠𝑢𝑝𝑝𝑙𝑦 ℃ weighted average supply temperature
�̅�𝑟𝑒𝑡𝑢𝑟𝑛 ℃ weighted average return temperature
�̇� 𝑚3/ℎ volume flow
𝑄𝑡𝑜𝑡,𝑑𝑒𝑙𝑖𝑣𝑒𝑟𝑒𝑑 𝑀𝑊ℎ/𝑎 total annual heat delivered to the network
𝑐𝑝,𝐻2𝑂 𝑘𝑊ℎ/(𝑘𝑔𝐾) water isobaric specific heat
𝜌𝐻2𝑂 𝑘𝑔/𝑚3 water density
∆𝑝𝐷𝐻 𝑃𝑎 pressure drop in the system
∆𝑝𝑛𝑒𝑡𝑤𝑜𝑟𝑘 𝑃𝑎/𝑚 pressure drop in the network
∆𝑝𝑠𝑢𝑏𝑠𝑡𝑎𝑡𝑖𝑜𝑛𝑠 𝑃𝑎 pressure drop at consumer substations
𝜂𝑝𝑢𝑚𝑝 − pump efficiency
𝑊𝑝𝑢𝑚𝑝 𝑀𝑊ℎ/𝑎 annual pump electricity consumption
𝑇𝐶,𝑖 𝐾 the inlet temperature of source in an evaporator
𝑇𝐶,𝑜 𝐾 the outlet temperature of source in an evaporator
∆𝑇𝐶 𝐾 a temperature difference of source in an evaporator
𝑇𝐻,𝑖 𝐾 the inlet temperature of a sink in heat pump condenser
𝑇𝐻,𝑜 𝐾 the outlet temperature of a sink in heat pump condenser
∆𝑇𝐻 𝐾 a temperature difference of sink in an evaporator
�̅�𝐻 𝐾 mean temperature of a sink
Edi Kirasić Master’s thesis
Faculty of Mechanical Engineering and Naval Architecture VI
�̅�𝐶 𝐾 mean temperature of a source
∆�̅�𝑙𝑖𝑓𝑡 𝐾 temperature lift
𝐶𝑂𝑃𝐿𝑜𝑟𝑒𝑛𝑧 − Lorenz coefficient of performance
𝜂𝐿𝑜𝑟𝑒𝑛𝑧 − Lorenz efficiency
𝐶𝑂𝑃 − coefficient of performance
�̇�𝑐𝑒𝑛𝑡𝑟𝑎𝑙 𝑀𝑊 the heat produced from the central unit in an hour
𝐶𝑂𝑃𝑑𝑒𝑐𝑒𝑛𝑡𝑟𝑎𝑙 − coefficient of performance of the decentral unit
�̇� 𝑀𝑊 the heat produced in an hour
�̇� 𝑀𝑊 electricity consumed in an hour
𝑊𝑡𝑜𝑡 𝑀𝑊ℎ/𝑎 total annual electricity consumption of district heating
𝑊𝑐𝑒𝑛𝑡𝑟𝑎𝑙 𝑀𝑊ℎ/𝑎 annual central unit electricity consumption
𝑊𝑑𝑒𝑐𝑒𝑛𝑡𝑟𝑎𝑙 𝑀𝑊ℎ/𝑎 annual decentral units electricity consumption
𝐶𝑂𝑃𝑠𝑦𝑠𝑡𝑒𝑚,𝑠𝑒𝑎𝑠𝑜𝑛𝑎𝑙 − system seasonal coefficient of performance
𝐿𝐶𝑂𝐻 €/𝑀𝑊ℎ levelized cost of heat
𝐶𝐴𝑃𝐸𝑋 € the capital cost of heat
𝑂𝑃𝐸𝑋 € the operational cost of heat
𝐶𝑅𝐹 − capital recovery factor
𝐼 € investment
𝑖 % discount rate
𝑛 𝑎 project lifetime
𝑂&𝑀 € operation and maintenance cost
𝐸 € total electricity cost
𝐺 € total gas cost
𝑓𝑝𝑟𝑖𝑚,𝑠𝑐𝑒𝑛𝑎𝑟𝑖𝑜 − primary energy factor of a scenario
𝑓𝑝𝑟𝑖𝑚 − primary energy factor
𝑓𝐶𝑂2,𝑠𝑐𝑒𝑛𝑎𝑟𝑖𝑜 − CO2 factor of a scenario
𝑓𝐶𝑂2 − CO2 factor
𝑇𝑡𝑜𝑡 𝑀𝑊ℎ/𝑎 total annual gas consumption
�̇�𝑑𝑒𝑐𝑒𝑛𝑡𝑟𝑎𝑙 𝑀𝑊 decentral unit heat capacity
𝑡𝑓𝑢𝑙𝑙𝑙𝑜𝑎𝑑 ℎ full load hours

Edi Kirasić Master’s thesis
Faculty of Mechanical Engineering and Naval Architecture VII
SUMMARY
Current energy and climate strategies will eventually phase out conventional district heating
systems unless they are prepared for lower heat demand caused by building refurbishment and
energy efficiency improvement programs. Also, future district heating systems will need to
reduce heat losses and CO2 emissions and replace fossil fuels with locally found renewable
energy and urban waste heat sources. Those changes will have a widespread positive impact on
communities. This thesis evaluates the costs and benefits of the novel, low, and ultra-low
temperature district heating systems, which are the path to the future.
The introduction of this thesis gives a short overview of LTDH and ULTDH systems, as well
as their main components and literature review. The second part, method, shows the techno-
economical procedure of assessing the costs and benefits of these systems. Heat demand,
electricity consumption, coefficients of performances, heat losses and other important
parameters in district heating analysis are presented. The section-case study describes the
example for which assessment methodology is developed. This section shows techno-economic
data used in the analysis. In the last section, results from the case study are evaluated and
discussed. Results showed the infeasibility of novel district heating systems for low plot ratios
and space heating shares, but they outperformed conventional natural gas boiler heating in CO2
emissions and primary energy consumption. All results from this case study are shown in the
Annex at the end.
Keywords: ultra-low temperature district heating, low-temperature district heating, heat pumps,
renewable energy sources, cost-benefit analysis, coefficient of performance, levelized cost of
heat, energy planning, carbon emission factor, primary energy factor
Edi Kirasić Master’s thesis
Faculty of Mechanical Engineering and Naval Architecture VIII
SAŽETAK
Trenutne energetske i klimatske strategije će u konačnici uzrokovati gašenje konvencionalnih
centraliziranih toplinskih sustava, ako ne budu spremni na smanjenje potreba za toplinskom
energijom uzrokovanih programima energetske obnove zgrada i poboljšanja energetske
učinkovitosti. Također, centralizirani toplinski sustavi budućnosti trebat će smanjiti toplinske
gubitke i emisije CO2, a potrošnju fosilnih goriva morat će zamijeniti lokalnim obnovljivim
izvorima energije i urbanim izvorima otpadne topline. Te promjene će imati dalekosežni
pozitivan utjecaj na zajednice. Ovaj diplomski rad procjenjuje koristi i troškove novih, nisko-
temperaturnih i izrazito nisko-temperaturnih centraliziranih toplinskih sustava koji su put
prema budućnosti.
U uvodu je dan kratki pregled nisko-temperaturnih i izrazito nisko-temperaturnih
centraliziranih toplinskih sustava, kao i pregled njihovih osnovnih komponenti i literature.
Drugi dio, metoda, prikazuje tehno-ekonomsku analizu procjena dobiti i troškova ovih sustava.
Prikazane su potrebe za toplinskom energijom, potrošnja električne energije, koeficijent
učinkovitosti dizalica topline, toplinski gubici i drugi važni parametri analize centraliziranih
toplinskih sustava. U poglavlju-studija slučaja, opisan je primjer za koji je razvijena
metodologija. U tom poglavlju su prikazani tehno-ekonomski podaci korišteni u analizi. U
zadnjem poglavlju analizirani su rezultati koji pokazuju neisplativost izgradnje modernih
centraliziranih toplinskih sustava za rijetko naseljena područja s malim udjelom potražnje za
grijanjem u ukupnoj potražnji toplinske energije, ali su bolji po pitanju emisija CO2 i potrošnji
primarne energije od konvencionalnog grijanja prirodnim plinom. Svi rezultati ove analize
slučaja prikazani su u dodatku koji se nalazi na kraju.
Ključne riječi: izrazito nisko temperaturni centralizirani toplinski sustavi, nisko temperaturni
centralizirani toplinski sustavi, dizalice topline, obnovljivi izvori energije, analiza troškovi i
dobiti, koeficijent učinkovitosti dizalica topline, nivelirana cijena toplinske energije, energetsko
planiranje, faktor emisije ugljikovog dioksida, faktor primarne energije
Edi Kirasić Master’s thesis
Faculty of Mechanical Engineering and Naval Architecture 1
1. INTRODUCTION
District heating (DH) systems play an essential role in the energy sector because of the heat
supply to consumers. The main advantages of this heating concept are heat production in one
central place for all consumers, which reduces costs, and professional supervision of the system,
which reduces system fouling. Traditional district heating systems can operate at temperatures
above 100 °C, which can cause high heat losses or high investment costs to insulate pipes to
reduce losses. Also, fossil fuels are the primary heat source of these systems. These problems
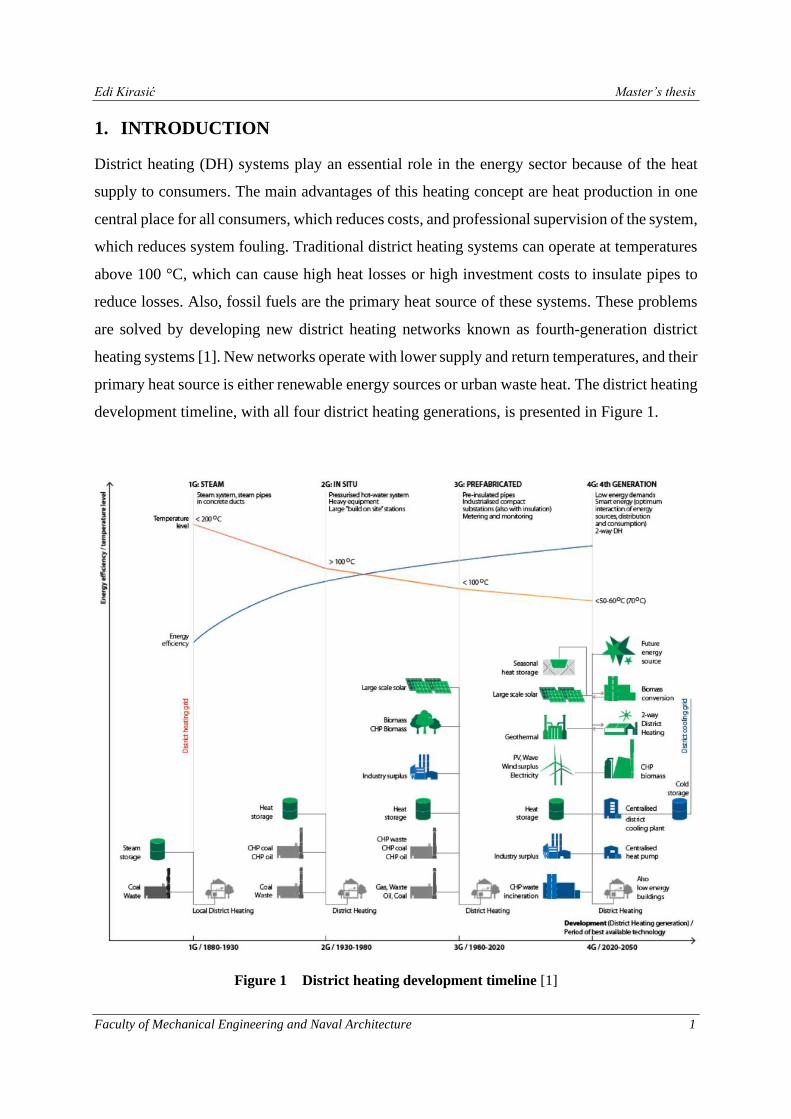
are solved by developing new district heating networks known as fourth-generation district
heating systems [1]. New networks operate with lower supply and return temperatures, and their
primary heat source is either renewable energy sources or urban waste heat. The district heating
development timeline, with all four district heating generations, is presented in Figure 1.
Figure 1 District heating development timeline [1]
Edi Kirasić Master’s thesis
Faculty of Mechanical Engineering and Naval Architecture 2
By lowering district heating temperatures, low-temperature renewable heat sources can be
implemented in the network, which helps to decarbonise this sector. Renewable energy sources
can be locally found, making this sector more reliable and less dependent on leading fossil fuel
exporters. Low temperatures lower heat losses and costs of the network, but temperatures can
sometimes be so low that the booster heating unit at the consumer substation must be used to
cover total heat demand. The need for an extra heating booster unit (mainly heat pumps) raises
costs and sometimes causes the infeasibility of a whole project if costs are higher than the
benefits that these new networks bring. For that reason, new district heating systems must be
carefully planned.
Fourth-generation district heating systems can be classified into two separate groups, low and
ultra-low temperature district heating systems (LTDH and ULTDH). The main difference
between them is that domestic hot water (DHW) and space heating (SH) demand can be covered
with heat delivered by the network in LTDH, while ULTDH systems need to have booster
element, most often heat pump, at consumer substation to raise the temperature for DHW needs
at higher temperatures to avoid Legionella [3].
Edi Kirasić Master’s thesis
Faculty of Mechanical Engineering and Naval Architecture 3
2. LOW AND ULTRA-LOW TEMPERATURE DISTRICT HEATING
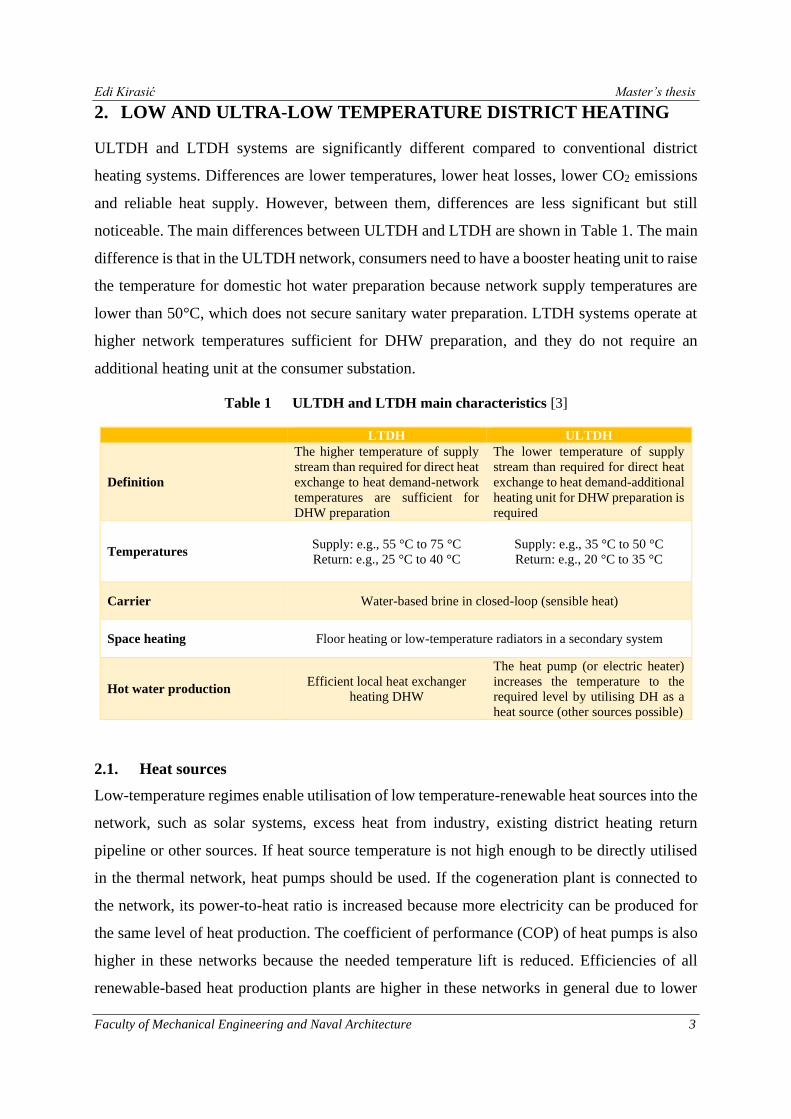
ULTDH and LTDH systems are significantly different compared to conventional district
heating systems. Differences are lower temperatures, lower heat losses, lower CO2 emissions
and reliable heat supply. However, between them, differences are less significant but still
noticeable. The main differences between ULTDH and LTDH are shown in Table 1. The main
difference is that in the ULTDH network, consumers need to have a booster heating unit to raise
the temperature for domestic hot water preparation because network supply temperatures are
lower than 50°C, which does not secure sanitary water preparation. LTDH systems operate at
higher network temperatures sufficient for DHW preparation, and they do not require an
additional heating unit at the consumer substation.
Table 1 ULTDH and LTDH main characteristics [3]
LTDH ULTDH
Definition
The higher temperature of supply
stream than required for direct heat
exchange to heat demand-network
temperatures are sufficient for
DHW preparation
The lower temperature of supply
stream than required for direct heat
exchange to heat demand-additional
heating unit for DHW preparation is
required
Temperatures Supply: e.g., 55 °C to 75 °C
Return: e.g., 25 °C to 40 °C
Supply: e.g., 35 °C to 50 °C
Return: e.g., 20 °C to 35 °C
Carrier Water-based brine in closed-loop (sensible heat)
Space heating Floor heating or low-temperature radiators in a secondary system
Hot water production Efficient local heat exchanger
heating DHW
The heat pump (or electric heater)
increases the temperature to the
required level by utilising DH as a
heat source (other sources possible)
2.1. Heat sources
Low-temperature regimes enable utilisation of low temperature-renewable heat sources into the
network, such as solar systems, excess heat from industry, existing district heating return
pipeline or other sources. If heat source temperature is not high enough to be directly utilised
in the thermal network, heat pumps should be used. If the cogeneration plant is connected to
the network, its power-to-heat ratio is increased because more electricity can be produced for
the same level of heat production. The coefficient of performance (COP) of heat pumps is also
higher in these networks because the needed temperature lift is reduced. Efficiencies of all
renewable-based heat production plants are higher in these networks in general due to lower
Edi Kirasić Master’s thesis
Faculty of Mechanical Engineering and Naval Architecture 4
temperatures. All that enables a connection of new heat sources to the network, which
decentralises this sector [4].
Sources such as air, ground, groundwater, seawater are used the most because they are
widespread, and their utilisation technology, heat pumps, operate at high efficiencies as
technology advances. Solar energy is also entering the heating sector, but it must be often
coupled with other sources or heat storages for periods without the sun [5]. When it comes to
industrial excess heat, such as chemical or process industry, it can also be used in these networks
directly through the heat exchangers, but lower temperature excess heat, e.g., from cooling,
requires heat pumps. In industry, heat that would be otherwise discharged into the environment
is used. Besides the environmental benefits, it is observed that it can profit excess heat
producers from selling heat to the network and reduce costs concerning cooling water
consumption [6]. Nevertheless, excess heat, either high or low grade, is not accessible as other
sources, and if it is, its fluctuations and temperature regimes must be evaluated carefully before
connecting to the district heating network [7].
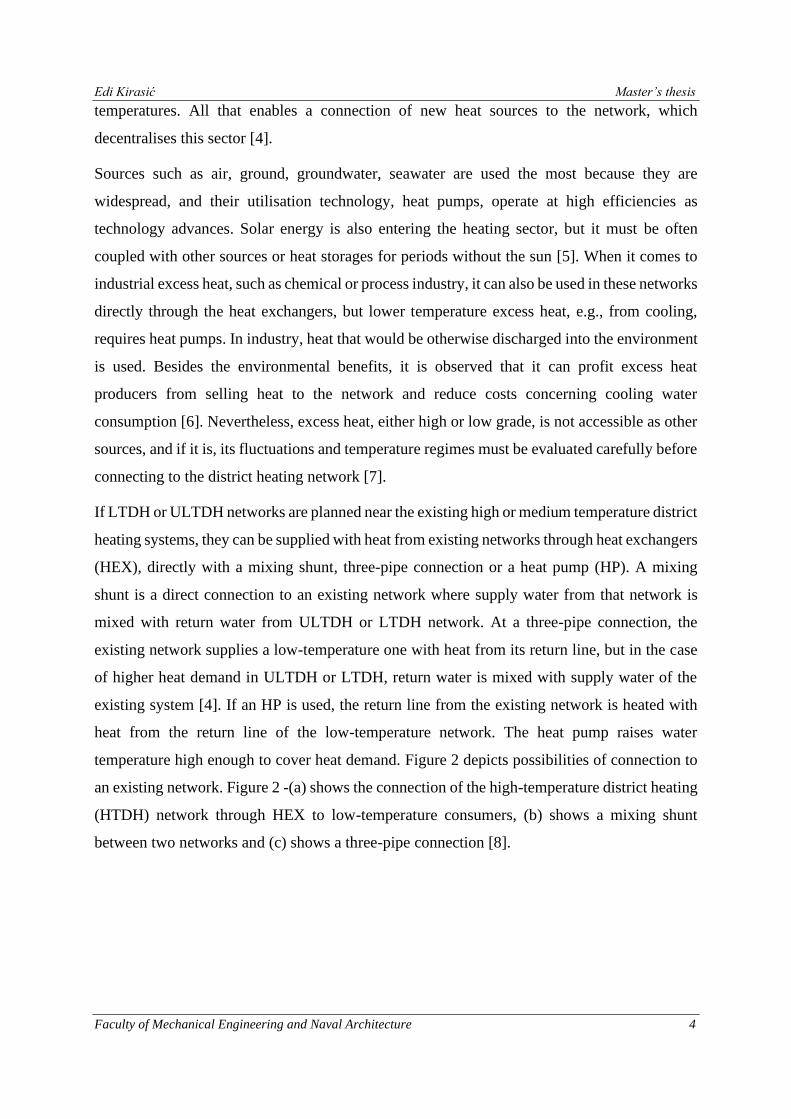
If LTDH or ULTDH networks are planned near the existing high or medium temperature district
heating systems, they can be supplied with heat from existing networks through heat exchangers
(HEX), directly with a mixing shunt, three-pipe connection or a heat pump (HP). A mixing
shunt is a direct connection to an existing network where supply water from that network is
mixed with return water from ULTDH or LTDH network. At a three-pipe connection, the
existing network supplies a low-temperature one with heat from its return line, but in the case
of higher heat demand in ULTDH or LTDH, return water is mixed with supply water of the
existing system [4]. If an HP is used, the return line from the existing network is heated with
heat from the return line of the low-temperature network. The heat pump raises water
temperature high enough to cover heat demand. Figure 2 depicts possibilities of connection to
an existing network. Figure 2 -(a) shows the connection of the high-temperature district heating
(HTDH) network through HEX to low-temperature consumers, (b) shows a mixing shunt
between two networks and (c) shows a three-pipe connection [8].

Edi Kirasić Master’s thesis
Faculty of Mechanical Engineering and Naval Architecture 5
Figure 2 Different types of connection to existing network [8]
2.2. Thermal energy storage
Thermal energy storages (TES) can are used to prevent heat supply disruptions due to various
factors, or they can be used as an alternative to utilise low-cost electricity via heat pumps.
Because of that, they play a vital role in future energy systems supplied with heat from
intermittent renewable energy sources (RES). Cheap storage medium, mostly water, and their
simple construction cause their cost-effectiveness [9]. Table 2 shows different thermal storage
types, including their main characteristics and differences.
Table 2 TES characteristics [10]
Type TTEA (tanks) PTS (Pits) BTES (Boreholes) ATES (Aquifers)
Storage medium Water Water (gravel-water) Soil surrounding the
boreholes
Groundwater in
aquifers
Specific capacity
[kWh/m3] 60-80
60-80 (30-50 for gravel-water)
15-30 30-40
Water equivalents 1m3 TES=1m3 water 1m3 TES=1m3 water 3-5m3 TES=1m3 water 2-5m3 TES=1m3
water
Geological requirements
Stable ground conditions.
Preferably no groundwater.
5-15m deep.
Stable ground conditions.
Preferably no
groundwater. 5-15m deep.
Drillable ground. High
heat capacity. High thermal conductivity.
Low hydraulic
conductivity. Groundwater flow
<1m/s. 30-100m deep.
High yield aquifer.
Application Short-term/diurnal TES,
buffer TES.
Long-term/seasonal
TES for production higher than 20.000
MWh/year. Short
term TES for large
TES.
Long-term/seasonal TES for DH plants
production higher than
20.000 MWh/year.
Long-term/seasonal
heat and cold TES.
Storage temperatures
[°C] 5 to 95 5 to 95 5 to 90 7 to 18
Specific investment cost
[€/m3 water equivalent] 110-200€/m3 (if > 2.000m3)
20-40€/m3 (if > 50.000m3)
20-40€/m3 (if >
50.000m3 water equivalent including
buffer tank)
50-60€/m3 (cost
depends on charge capacity rather
storage capacity)
Advantages High charge/discharge
capacity.
High
charge/discharge capacity. Low
investment cost.
Most underground properties are suitable.
Provides heat and
cold TES. Many geologically
suitable sites.
Disadvantages High specific investment cost Large area
requirements
Low charge/discharge
capacity (potential need of a buffer tank)
Low temperatures
and temperature differences
Edi Kirasić Master’s thesis
Faculty of Mechanical Engineering and Naval Architecture 6
2.3. Network design
Compared with traditional district heating systems, LTDH and ULTDH have lower network
temperatures that reduce differential pressure in the network, which increases needed pumping
power to keep water flow at desired levels. However, this increase in pumping power is
negligible compared to heat savings [11].
While designing these new networks, one must consider simultaneously factor to account for
DHW consumption at different consumer substations at the same time. That increases the
needed heat supply of the network and its hydraulic load. The network needs to be designed to
maintain predefined water velocity [4].
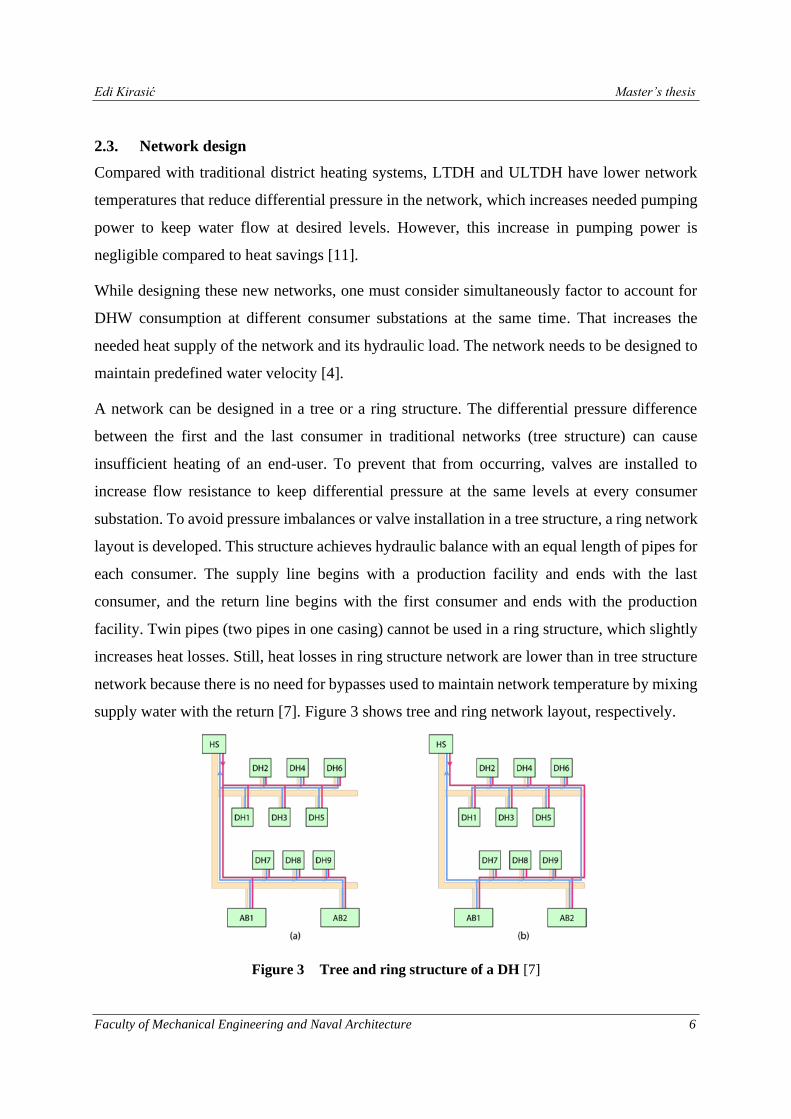
A network can be designed in a tree or a ring structure. The differential pressure difference
between the first and the last consumer in traditional networks (tree structure) can cause
insufficient heating of an end-user. To prevent that from occurring, valves are installed to
increase flow resistance to keep differential pressure at the same levels at every consumer
substation. To avoid pressure imbalances or valve installation in a tree structure, a ring network
layout is developed. This structure achieves hydraulic balance with an equal length of pipes for
each consumer. The supply line begins with a production facility and ends with the last
consumer, and the return line begins with the first consumer and ends with the production
facility. Twin pipes (two pipes in one casing) cannot be used in a ring structure, which slightly
increases heat losses. Still, heat losses in ring structure network are lower than in tree structure
network because there is no need for bypasses used to maintain network temperature by mixing
supply water with the return [7]. Figure 3 shows tree and ring network layout, respectively.
Figure 3 Tree and ring structure of a DH [7]
Edi Kirasić Master’s thesis
Faculty of Mechanical Engineering and Naval Architecture 7
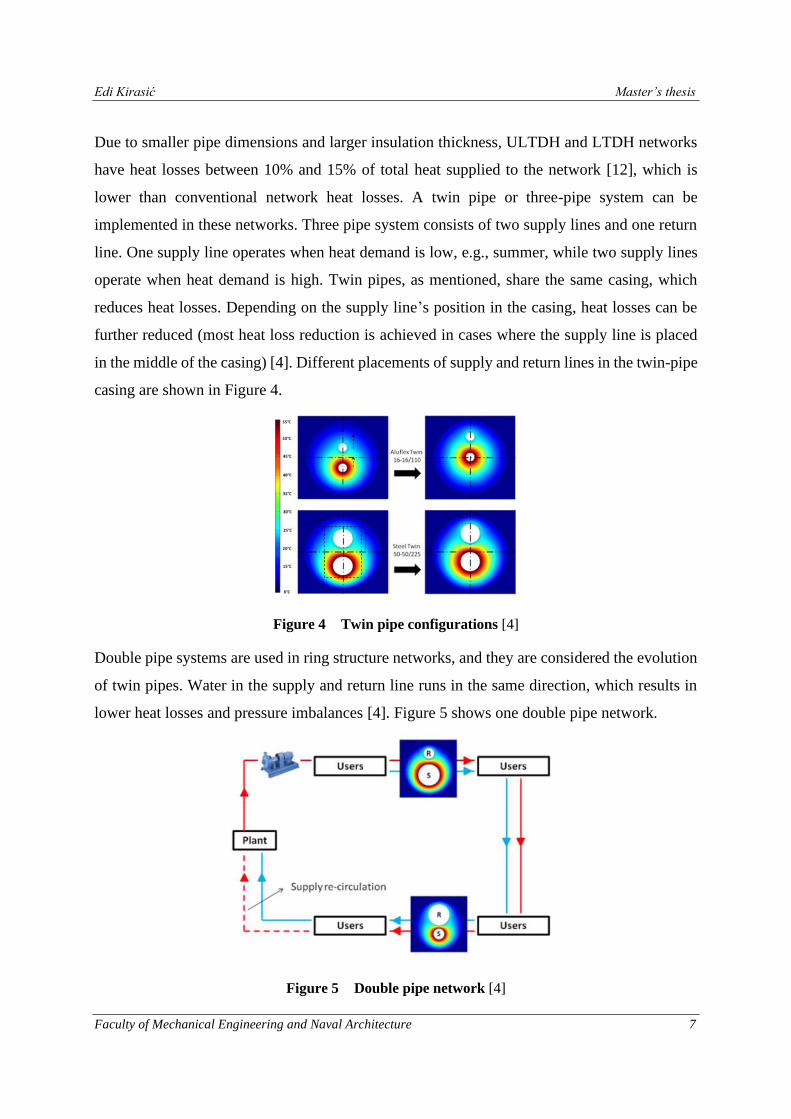
Due to smaller pipe dimensions and larger insulation thickness, ULTDH and LTDH networks
have heat losses between 10% and 15% of total heat supplied to the network [12], which is
lower than conventional network heat losses. A twin pipe or three-pipe system can be
implemented in these networks. Three pipe system consists of two supply lines and one return
line. One supply line operates when heat demand is low, e.g., summer, while two supply lines
operate when heat demand is high. Twin pipes, as mentioned, share the same casing, which
reduces heat losses. Depending on the supply line’s position in the casing, heat losses can be
further reduced (most heat loss reduction is achieved in cases where the supply line is placed
in the middle of the casing) [4]. Different placements of supply and return lines in the twin-pipe
casing are shown in Figure 4.
Figure 4 Twin pipe configurations [4]
Double pipe systems are used in ring structure networks, and they are considered the evolution
of twin pipes. Water in the supply and return line runs in the same direction, which results in
lower heat losses and pressure imbalances [4]. Figure 5 shows one double pipe network.
Figure 5 Double pipe network [4]
Edi Kirasić Master’s thesis
Faculty of Mechanical Engineering and Naval Architecture 8
2.4. Consumer substation
At the end of each district heating system, consumers with their substations are located. In
LTDH and ULTDH, space heating (at substations) is provided mostly indirectly through heat
exchanges, but direct connections to the network also exist (without the transfer element). To
maintain DHW temperatures at higher levels to prevent Legionella growth, consumer
substations in LTDH networks are equipped with instantaneous heat exchangers (IHEU) or
district heating storage units (DHSU). ULTDH networks for DHW preparations have heat
pumps, boilers, solar collectors, or other heating units to raise the temperature.
2.4.1. Space heating
Buildings connected to ULTDH or LTDH networks are ones where thermal comfort can be
achieved with lower temperatures. They are new and well-insulated objects. Existing objects
can be connected to the network if they are renovated and can satisfy comfort levels with given
temperatures. Planning of heat production according to the consumer needs is a shift from the
traditional DH planning process where the focus was on the production facility [4].
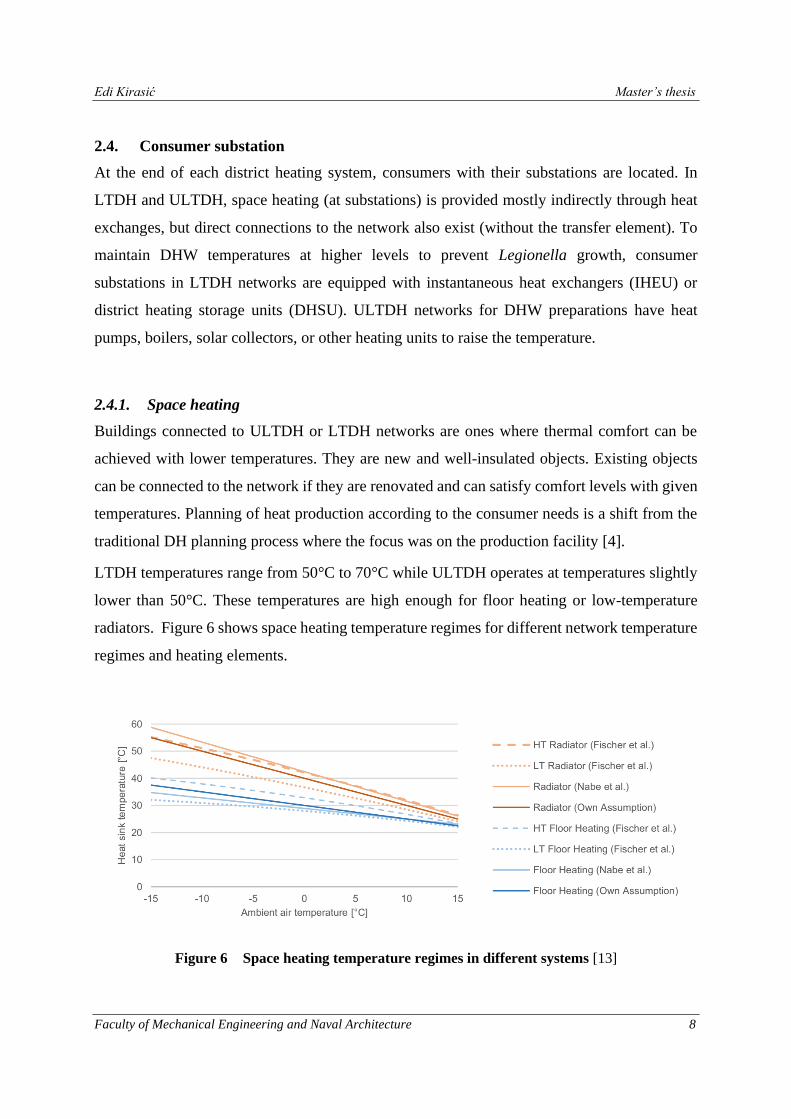
LTDH temperatures range from 50°C to 70°C while ULTDH operates at temperatures slightly
lower than 50°C. These temperatures are high enough for floor heating or low-temperature
radiators. Figure 6 shows space heating temperature regimes for different network temperature
regimes and heating elements.
Figure 6 Space heating temperature regimes in different systems [13]
Edi Kirasić Master’s thesis
Faculty of Mechanical Engineering and Naval Architecture 9
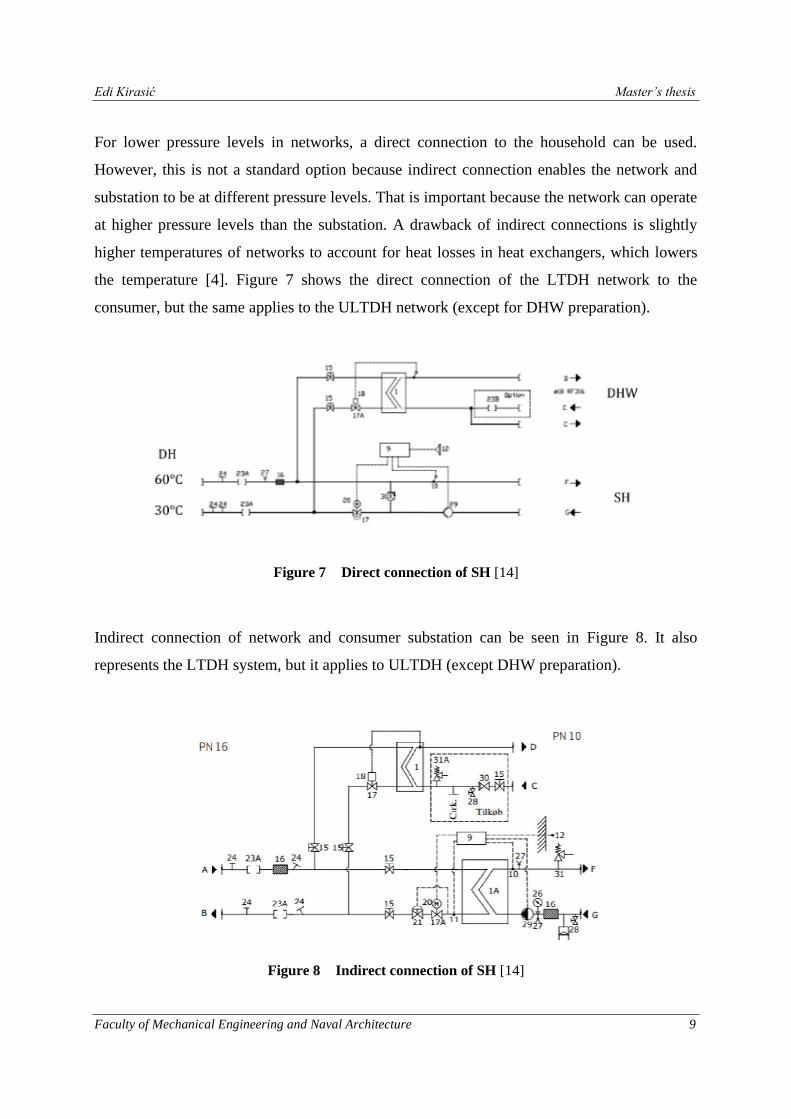
For lower pressure levels in networks, a direct connection to the household can be used.
However, this is not a standard option because indirect connection enables the network and
substation to be at different pressure levels. That is important because the network can operate
at higher pressure levels than the substation. A drawback of indirect connections is slightly
higher temperatures of networks to account for heat losses in heat exchangers, which lowers
the temperature [4]. Figure 7 shows the direct connection of the LTDH network to the
consumer, but the same applies to the ULTDH network (except for DHW preparation).
Figure 7 Direct connection of SH [14]
Indirect connection of network and consumer substation can be seen in Figure 8. It also
represents the LTDH system, but it applies to ULTDH (except DHW preparation).
Figure 8 Indirect connection of SH [14]
Edi Kirasić Master’s thesis
Faculty of Mechanical Engineering and Naval Architecture 10
2.4.2. Domestic hot water preparation
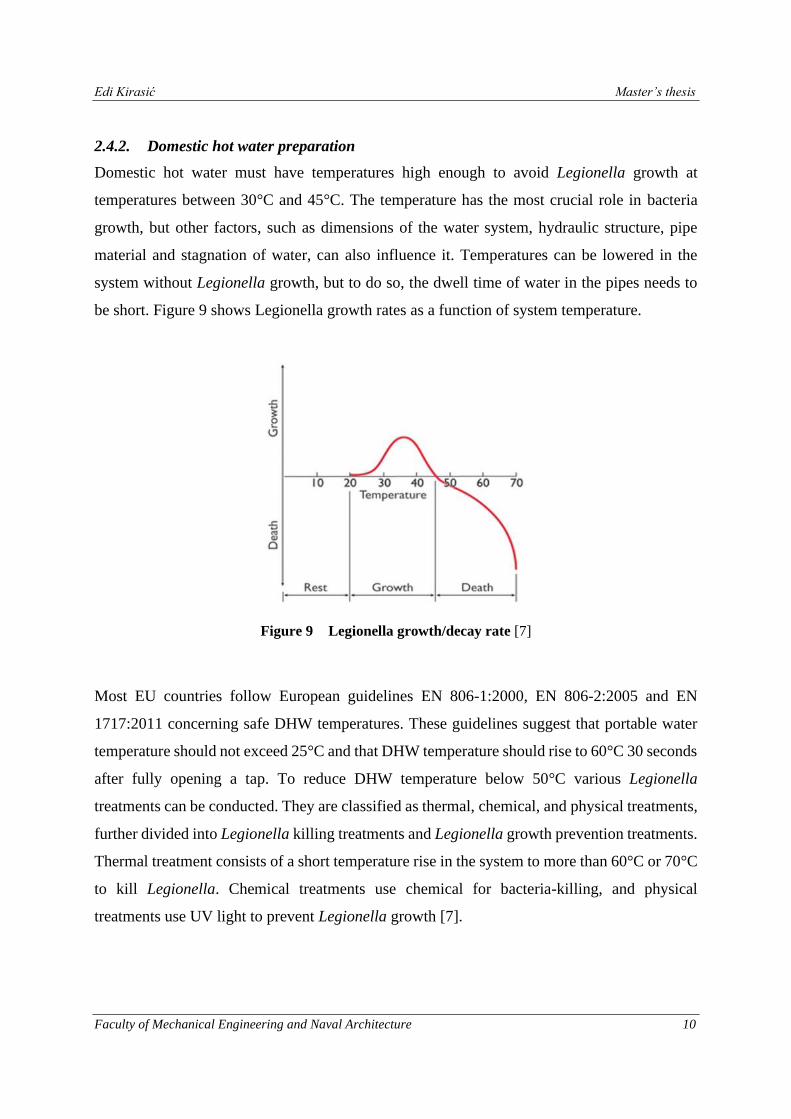
Domestic hot water must have temperatures high enough to avoid Legionella growth at
temperatures between 30°C and 45°C. The temperature has the most crucial role in bacteria
growth, but other factors, such as dimensions of the water system, hydraulic structure, pipe
material and stagnation of water, can also influence it. Temperatures can be lowered in the
system without Legionella growth, but to do so, the dwell time of water in the pipes needs to
be short. Figure 9 shows Legionella growth rates as a function of system temperature.
Figure 9 Legionella growth/decay rate [7]
Most EU countries follow European guidelines EN 806-1:2000, EN 806-2:2005 and EN
1717:2011 concerning safe DHW temperatures. These guidelines suggest that portable water
temperature should not exceed 25°C and that DHW temperature should rise to 60°C 30 seconds
after fully opening a tap. To reduce DHW temperature below 50°C various Legionella
treatments can be conducted. They are classified as thermal, chemical, and physical treatments,
further divided into Legionella killing treatments and Legionella growth prevention treatments.
Thermal treatment consists of a short temperature rise in the system to more than 60°C or 70°C
to kill Legionella. Chemical treatments use chemical for bacteria-killing, and physical
treatments use UV light to prevent Legionella growth [7].
Edi Kirasić Master’s thesis
Faculty of Mechanical Engineering and Naval Architecture 11
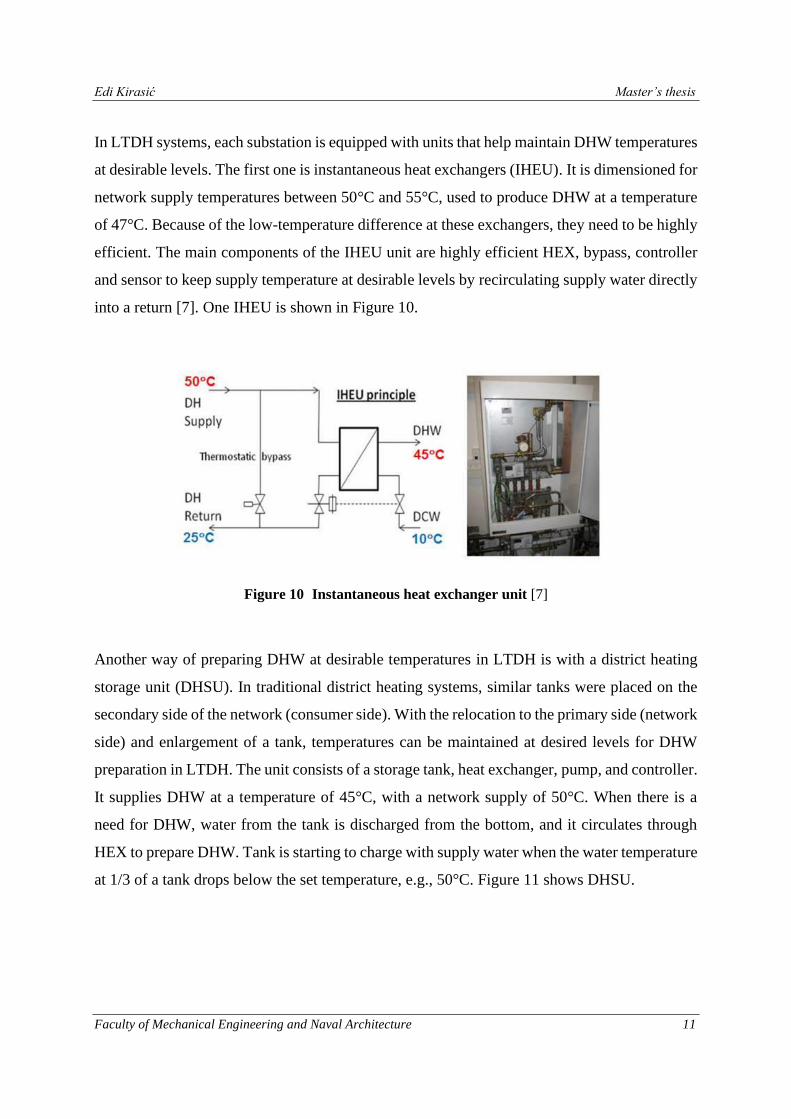
In LTDH systems, each substation is equipped with units that help maintain DHW temperatures
at desirable levels. The first one is instantaneous heat exchangers (IHEU). It is dimensioned for
network supply temperatures between 50°C and 55°C, used to produce DHW at a temperature
of 47°C. Because of the low-temperature difference at these exchangers, they need to be highly
efficient. The main components of the IHEU unit are highly efficient HEX, bypass, controller
and sensor to keep supply temperature at desirable levels by recirculating supply water directly
into a return [7]. One IHEU is shown in Figure 10.
Figure 10 Instantaneous heat exchanger unit [7]
Another way of preparing DHW at desirable temperatures in LTDH is with a district heating
storage unit (DHSU). In traditional district heating systems, similar tanks were placed on the
secondary side of the network (consumer side). With the relocation to the primary side (network
side) and enlargement of a tank, temperatures can be maintained at desired levels for DHW
preparation in LTDH. The unit consists of a storage tank, heat exchanger, pump, and controller.
It supplies DHW at a temperature of 45°C, with a network supply of 50°C. When there is a
need for DHW, water from the tank is discharged from the bottom, and it circulates through
HEX to prepare DHW. Tank is starting to charge with supply water when the water temperature
at 1/3 of a tank drops below the set temperature, e.g., 50°C. Figure 11 shows DHSU.
Edi Kirasić Master’s thesis
Faculty of Mechanical Engineering and Naval Architecture 12
Figure 11 District heating storage unit [7]
When IHEU and DHSU are compared, it can be noticed that tanks shave peak heat load and
reduce pipe dimensions. On the other hand, IHEUs are a cost-effective solution that better
extract heat from supply water than DHSU but with larger pipe dimensions which increase heat
losses. Despite the increase in losses, they are still considered negligible compared to
conventional units [4].
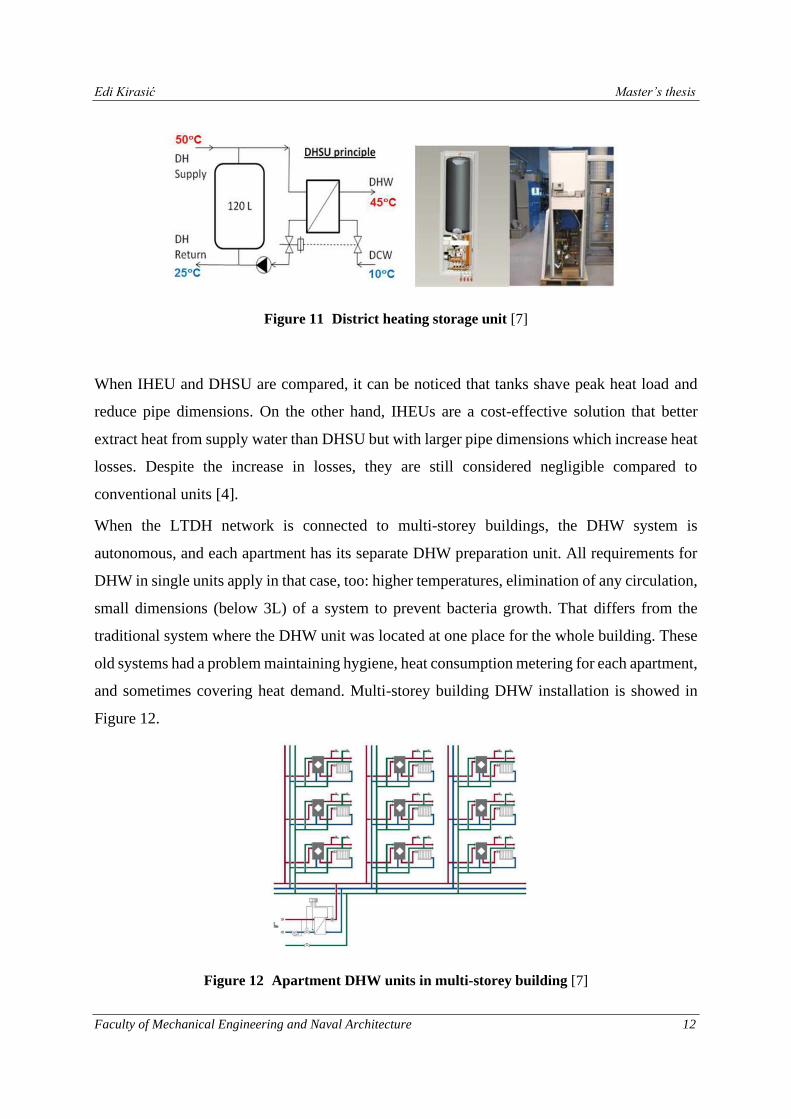
When the LTDH network is connected to multi-storey buildings, the DHW system is
autonomous, and each apartment has its separate DHW preparation unit. All requirements for
DHW in single units apply in that case, too: higher temperatures, elimination of any circulation,
small dimensions (below 3L) of a system to prevent bacteria growth. That differs from the
traditional system where the DHW unit was located at one place for the whole building. These
old systems had a problem maintaining hygiene, heat consumption metering for each apartment,
and sometimes covering heat demand. Multi-storey building DHW installation is showed in
Figure 12.
Figure 12 Apartment DHW units in multi-storey building [7]
Edi Kirasić Master’s thesis
Faculty of Mechanical Engineering and Naval Architecture 13
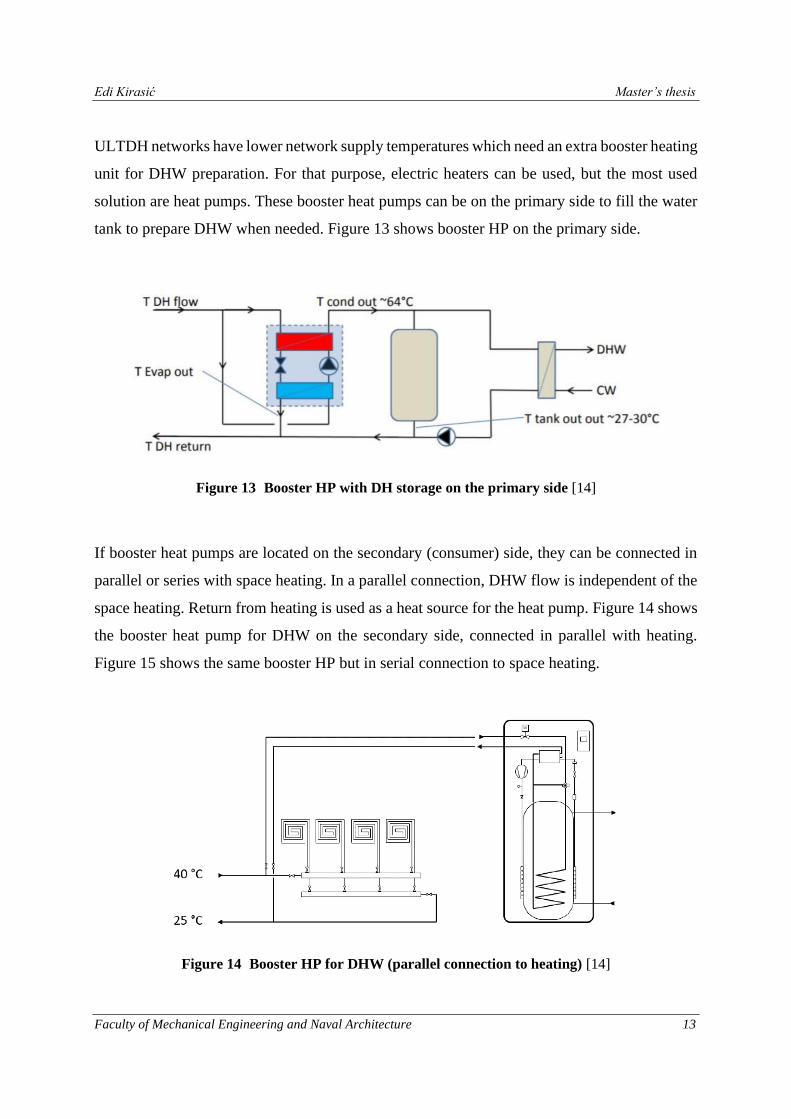
ULTDH networks have lower network supply temperatures which need an extra booster heating
unit for DHW preparation. For that purpose, electric heaters can be used, but the most used
solution are heat pumps. These booster heat pumps can be on the primary side to fill the water
tank to prepare DHW when needed. Figure 13 shows booster HP on the primary side.
Figure 13 Booster HP with DH storage on the primary side [14]
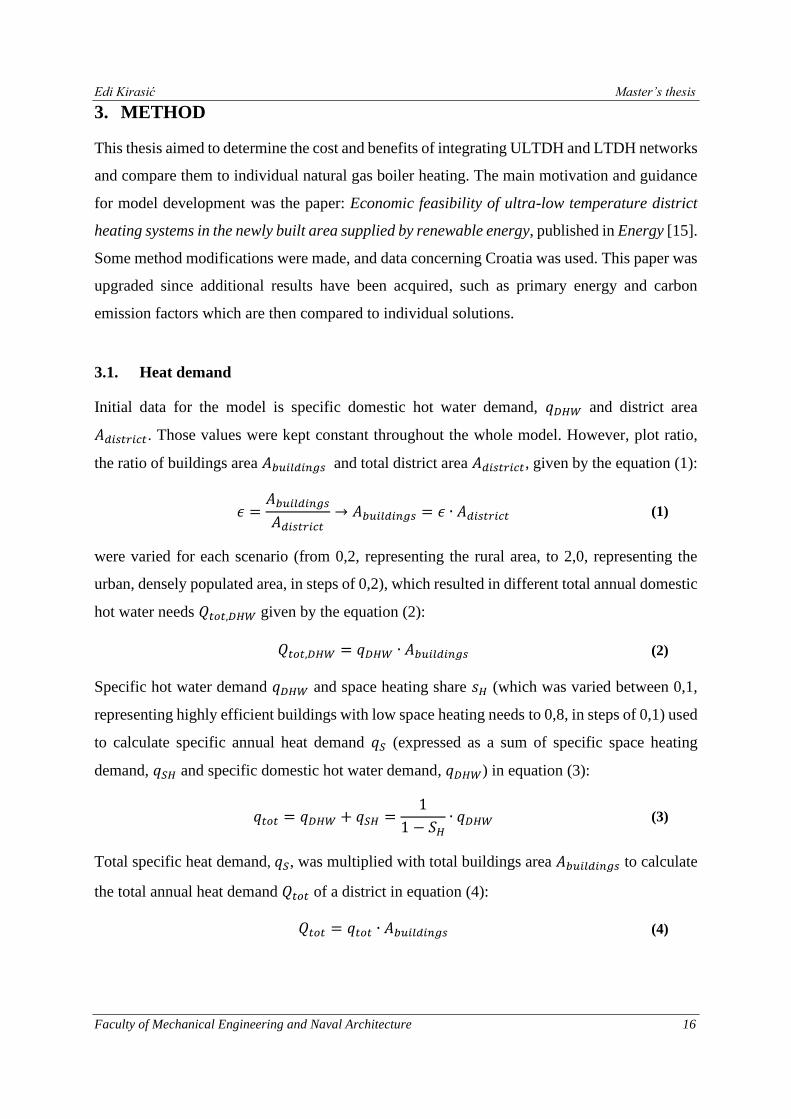
If booster heat pumps are located on the secondary (consumer) side, they can be connected in
parallel or series with space heating. In a parallel connection, DHW flow is independent of the
space heating. Return from heating is used as a heat source for the heat pump. Figure 14 shows
the booster heat pump for DHW on the secondary side, connected in parallel with heating.
Figure 15 shows the same booster HP but in serial connection to space heating.
Figure 14 Booster HP for DHW (parallel connection to heating) [14]

Edi Kirasić Master’s thesis
Faculty of Mechanical Engineering and Naval Architecture 14
Figure 15 Booster HP for DHW (serial connection to heating) [14]
Booster HPs on the secondary side have three different modes of operation. In the first mode,
ULTDH is used directly to preheat DHW through the coil. When the temperature starts to
increase, the second mode, the water-to-water heat pump circuit, is activated. In this phase, heat
is transferred directly from the coil and HP to the domestic hot water. The third mode presents
a phase when heat from the coil is completely extracted, and only HP is used for DHW
preparation. All three modes are presented in Figure 16, respectively.
Figure 16 Operation modes of booster HP on the secondary side [14]

Edi Kirasić Master’s thesis
Faculty of Mechanical Engineering and Naval Architecture 15
As well as water to the water heat pump, air to a water heat pump can also be used. Figure 17
shows the usage of an air heat pump for DHW preparation. In this case, the coil connected to
the ULTDH preheats the water in the tank.
Figure 17 Air booster HP on the secondary side [14]
Edi Kirasić Master’s thesis
Faculty of Mechanical Engineering and Naval Architecture 16
3. METHOD
This thesis aimed to determine the cost and benefits of integrating ULTDH and LTDH networks
and compare them to individual natural gas boiler heating. The main motivation and guidance
for model development was the paper: Economic feasibility of ultra-low temperature district
heating systems in the newly built area supplied by renewable energy, published in Energy [15].
Some method modifications were made, and data concerning Croatia was used. This paper was
upgraded since additional results have been acquired, such as primary energy and carbon
emission factors which are then compared to individual solutions.
3.1. Heat demand
Initial data for the model is specific domestic hot water demand, 𝑞𝐷𝐻𝑊 and district area
𝐴𝑑𝑖𝑠𝑡𝑟𝑖𝑐𝑡. Those values were kept constant throughout the whole model. However, plot ratio,
the ratio of buildings area 𝐴𝑏𝑢𝑖𝑙𝑑𝑖𝑛𝑔𝑠 and total district area 𝐴𝑑𝑖𝑠𝑡𝑟𝑖𝑐𝑡, given by the equation (1):
𝜖 =𝐴𝑏𝑢𝑖𝑙𝑑𝑖𝑛𝑔𝑠
𝐴𝑑𝑖𝑠𝑡𝑟𝑖𝑐𝑡→ 𝐴𝑏𝑢𝑖𝑙𝑑𝑖𝑛𝑔𝑠 = 𝜖 ∙ 𝐴𝑑𝑖𝑠𝑡𝑟𝑖𝑐𝑡 (1)
were varied for each scenario (from 0,2, representing the rural area, to 2,0, representing the
urban, densely populated area, in steps of 0,2), which resulted in different total annual domestic
hot water needs 𝑄𝑡𝑜𝑡,𝐷𝐻𝑊 given by the equation (2):
𝑄𝑡𝑜𝑡,𝐷𝐻𝑊 = 𝑞𝐷𝐻𝑊 ∙ 𝐴𝑏𝑢𝑖𝑙𝑑𝑖𝑛𝑔𝑠 (2)
Specific hot water demand 𝑞𝐷𝐻𝑊 and space heating share 𝑠𝐻 (which was varied between 0,1,
representing highly efficient buildings with low space heating needs to 0,8, in steps of 0,1) used
to calculate specific annual heat demand 𝑞𝑆 (expressed as a sum of specific space heating
demand, 𝑞𝑆𝐻 and specific domestic hot water demand, 𝑞𝐷𝐻𝑊) in equation (3):
𝑞𝑡𝑜𝑡 = 𝑞𝐷𝐻𝑊 + 𝑞𝑆𝐻 =1
1 − 𝑆𝐻∙ 𝑞𝐷𝐻𝑊 (3)
Total specific heat demand, 𝑞𝑆, was multiplied with total buildings area 𝐴𝑏𝑢𝑖𝑙𝑑𝑖𝑛𝑔𝑠 to calculate
the total annual heat demand 𝑄𝑡𝑜𝑡 of a district in equation (4):
𝑄𝑡𝑜𝑡 = 𝑞𝑡𝑜𝑡 ∙ 𝐴𝑏𝑢𝑖𝑙𝑑𝑖𝑛𝑔𝑠 (4)
Edi Kirasić Master’s thesis
Faculty of Mechanical Engineering and Naval Architecture 17
From the total annual heating demand 𝑄𝑡𝑜𝑡 and total annual domestic hot water demand
𝑄𝑡𝑜𝑡,𝐷𝐻𝑊, one can calculate the total annual space heating demand 𝑄𝑡𝑜𝑡,𝑆𝐻 from equation (5):
𝑄𝑡𝑜𝑡,𝑆𝐻 = 𝑄𝑡𝑜𝑡 − 𝑄𝑡𝑜𝑡,𝐷𝐻𝑊 (5)
3.2. Network heat losses and pumping power
Heat losses are an important factor in each cost-benefit analysis of any district heating systems.
Even though heat losses are lower in ULTDH and LTDH networks than in conventional
networks, they can still influence network profitability. To assess heat losses, linear heat density
demand (LHDD), 𝑞𝑙 must be known. In determining LHDD, the following approach is used
[16]. The first step is to determine the effective width of a network, 𝑤 as a function of plot ratio
𝜖, using equation (6) described in literature [17]:
𝑤 = 61,8 ∙ 𝜖−0,15 (6)
After effective width is found, linear heat density demand 𝑞𝑙 is calculated in (7) from [15]:
𝑞𝑙 =𝑄𝑡𝑜𝑡𝐿
= 𝑞𝑡𝑜𝑡 ∙ 𝜖 ∙ 𝑤 (7)
After determining LHDD with specific total heat demand 𝑞𝑡𝑜𝑡, plot ratio 𝜖 and effective width
𝑤, trench length 𝐿 can be calculated with equation (8):
𝐿 =𝑄𝑡𝑜𝑡𝑞𝑙
(8)
Average pipe diameter in district heating network 𝑑𝑎 in metres, was determined with known
linear heat density demand from equation (9) from [16]:
𝑑𝑎 = 0,0486 ∙ ln (𝑄𝑡𝑜𝑡𝐿) + 0,0007 (9)
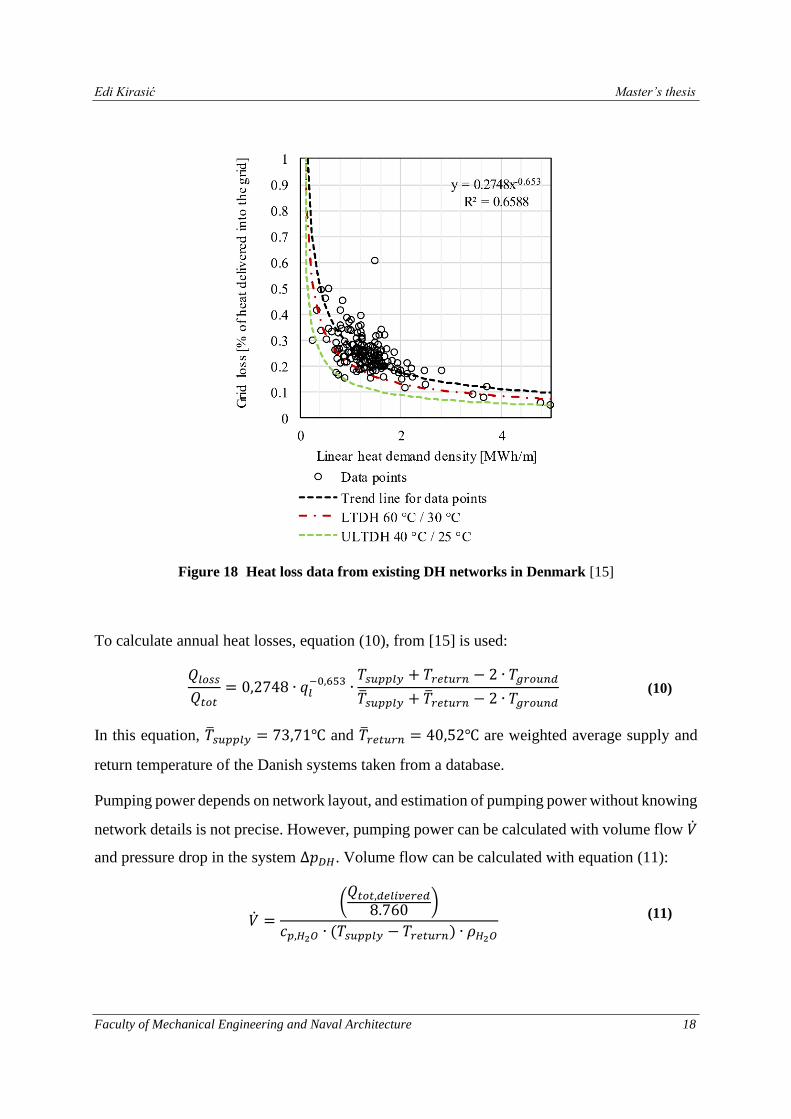
Finally, to calculate heat losses in the network, heat loss data from Denmark existing district
heating networks was used [18] to determine the correlation between LHDD and heat losses
shown in Figure 18.
Edi Kirasić Master’s thesis
Faculty of Mechanical Engineering and Naval Architecture 18
Figure 18 Heat loss data from existing DH networks in Denmark [15]
To calculate annual heat losses, equation (10), from [15] is used:
𝑄𝑙𝑜𝑠𝑠𝑄𝑡𝑜𝑡
= 0,2748 ∙ 𝑞𝑙−0,653 ∙
𝑇𝑠𝑢𝑝𝑝𝑙𝑦 + 𝑇𝑟𝑒𝑡𝑢𝑟𝑛 − 2 ∙ 𝑇𝑔𝑟𝑜𝑢𝑛𝑑
�̅�𝑠𝑢𝑝𝑝𝑙𝑦 + �̅�𝑟𝑒𝑡𝑢𝑟𝑛 − 2 ∙ 𝑇𝑔𝑟𝑜𝑢𝑛𝑑 (10)
In this equation, �̅�𝑠𝑢𝑝𝑝𝑙𝑦 = 73,71℃ and �̅�𝑟𝑒𝑡𝑢𝑟𝑛 = 40,52℃ are weighted average supply and
return temperature of the Danish systems taken from a database.
Pumping power depends on network layout, and estimation of pumping power without knowing
network details is not precise. However, pumping power can be calculated with volume flow �̇�
and pressure drop in the system ∆𝑝𝐷𝐻. Volume flow can be calculated with equation (11):
�̇� =(𝑄𝑡𝑜𝑡,𝑑𝑒𝑙𝑖𝑣𝑒𝑟𝑒𝑑
8.760)
𝑐𝑝,𝐻2𝑂 ∙ (𝑇𝑠𝑢𝑝𝑝𝑙𝑦 − 𝑇𝑟𝑒𝑡𝑢𝑟𝑛) ∙ 𝜌𝐻2𝑂
(11)
Edi Kirasić Master’s thesis
Faculty of Mechanical Engineering and Naval Architecture 19
Where 𝑄𝑡𝑜𝑡,𝑑𝑒𝑙𝑖𝑣𝑒𝑟𝑒𝑑 represents total annual heat delivered to the network (total heat demand
and network heat losses), 𝑐𝑝,𝐻2𝑂 represents water isobaric specific heat, 𝜌𝐻2𝑂 represents water
density and 𝑇𝑠𝑢𝑝𝑝𝑙𝑦 and 𝑇𝑟𝑒𝑡𝑢𝑟𝑛 represent supply and return network temperatures, respectively.
Pressure drop in the network, ∆𝑝𝑛𝑒𝑡𝑤𝑜𝑟𝑘 was assumed to be 100 Pa/m [15], and pressure drop
at consumer substations ∆𝑝𝑠𝑢𝑏𝑠𝑡𝑎𝑡𝑖𝑜𝑛𝑠 was assumed to be 100.000 Pa [19]. Overall pressure
drop, ∆𝑝𝐷𝐻 in the system can be calculated with equation (12):
∆𝑝𝐷𝐻 = ∆𝑝𝑛𝑒𝑡𝑤𝑜𝑟𝑘 + ∆𝑝𝑠𝑢𝑏𝑠𝑡𝑎𝑡𝑖𝑜𝑛𝑠 = 2 ∙ 𝐿 ∙ 100 + ∆𝑝𝑠𝑢𝑏𝑠𝑡𝑎𝑡𝑖𝑜𝑛𝑠 (12)
Necessary annual energy for pumping 𝑊𝑝𝑢𝑚𝑝 is calculated with equation (13):
𝑊𝑝𝑢𝑚𝑝 = ∆𝑝𝐷𝐻 ∙ �̇� ∙ 𝜂𝑝𝑢𝑚𝑝 ∙ 8.760 (13)
Where 𝜂𝑝𝑢𝑚𝑝 is pump efficiency, in this case 0,8 [20].
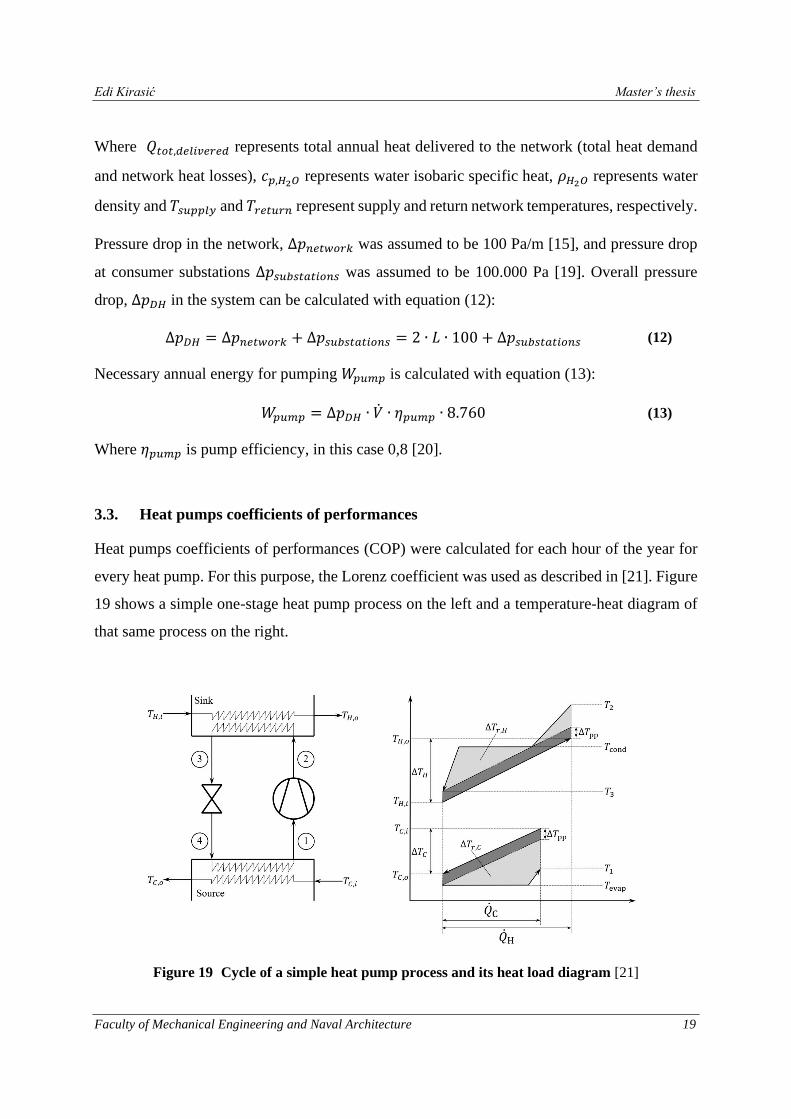
3.3. Heat pumps coefficients of performances
Heat pumps coefficients of performances (COP) were calculated for each hour of the year for
every heat pump. For this purpose, the Lorenz coefficient was used as described in [21]. Figure
19 shows a simple one-stage heat pump process on the left and a temperature-heat diagram of
that same process on the right.
Figure 19 Cycle of a simple heat pump process and its heat load diagram [21]
Edi Kirasić Master’s thesis
Faculty of Mechanical Engineering and Naval Architecture 20
Temperature 𝑇𝐶,𝑖 represents inlet temperature of heat source in heat pump evaporator, while
𝑇𝐶,𝑜 represents its outlet temperature, which is lower than inlet temperature because of cooling.
The temperature difference of these two temperatures is calculated with equation (14):
∆𝑇𝐶 = 𝑇𝐶,𝑖 − 𝑇𝐶,𝑜 (14)
Temperature 𝑇𝐻,𝑖 represents inlet temperature of a sink medium in heat pump condenser, a
medium which enters the condenser at that temperature, exits it with outlet temperature 𝑇𝐻,𝑜.
The outlet temperature is higher than the inlet temperature for the sink medium. The
temperature difference between outlet and inlet temperature of a sink medium is calculated with
equation (15):
∆𝑇𝐻 = 𝑇𝐻,𝑜 − 𝑇𝐻,𝑖 (15)
The unit for temperature difference calculation is irrelevant, but the temperature must be
converted to Kelvins for the following equations. To calculate Lorenz COP, the mean
temperature of a sink �̅�𝐻 from the equation (16) needs to be found:
�̅�𝐻 =
∆𝑇𝐻
ln (𝑇𝐻,𝑜𝑇𝐻,𝑖
)
(16)
Besides the sink medium, the mean temperature of a source �̅�𝐶 needs also to be found from
equation (17):
�̅�𝐶 =
∆𝑇𝐶
ln (𝑇𝐶,𝑜𝑇𝐶,𝑖
)
(17)
For cases, where the temperature of a source medium does not change after passing through the
heat pump evaporator, �̅�𝐶 represent only source temperature in Kelvin degrees. The difference
between the mean temperatures of the heat sink and the heat source is referred to as temperature
lift calculated with the following equation (18):
∆�̅�𝑙𝑖𝑓𝑡 = �̅�𝐻 − �̅�𝐶 (18)
Edi Kirasić Master’s thesis
Faculty of Mechanical Engineering and Naval Architecture 21
In the end, the Lorenz coefficient of performance, 𝐶𝑂𝑃𝐿𝑜𝑟𝑒𝑛𝑧 can be calculated as the ratio of
the mean temperature of the heat sink �̅�𝐻 and the mean temperature lift ∆�̅�𝑙𝑖𝑓𝑡 showed in
equation (19):
𝐶𝑂𝑃𝐿𝑜𝑟𝑒𝑛𝑧 =�̅�𝐻
�̅�𝐻 − �̅�𝐶=
�̅�𝐻
∆�̅�𝑙𝑖𝑓𝑡 (19)
To avoid model faultily 𝐶𝑂𝑃𝐿𝑜𝑟𝑒𝑛𝑧 results in few cases, where the mean temperature of a sink
is higher than the mean temperature of a source (summer hours), the mean temperature lift
∆�̅�𝑙𝑖𝑓𝑡 has been limited with a minimum value of five.
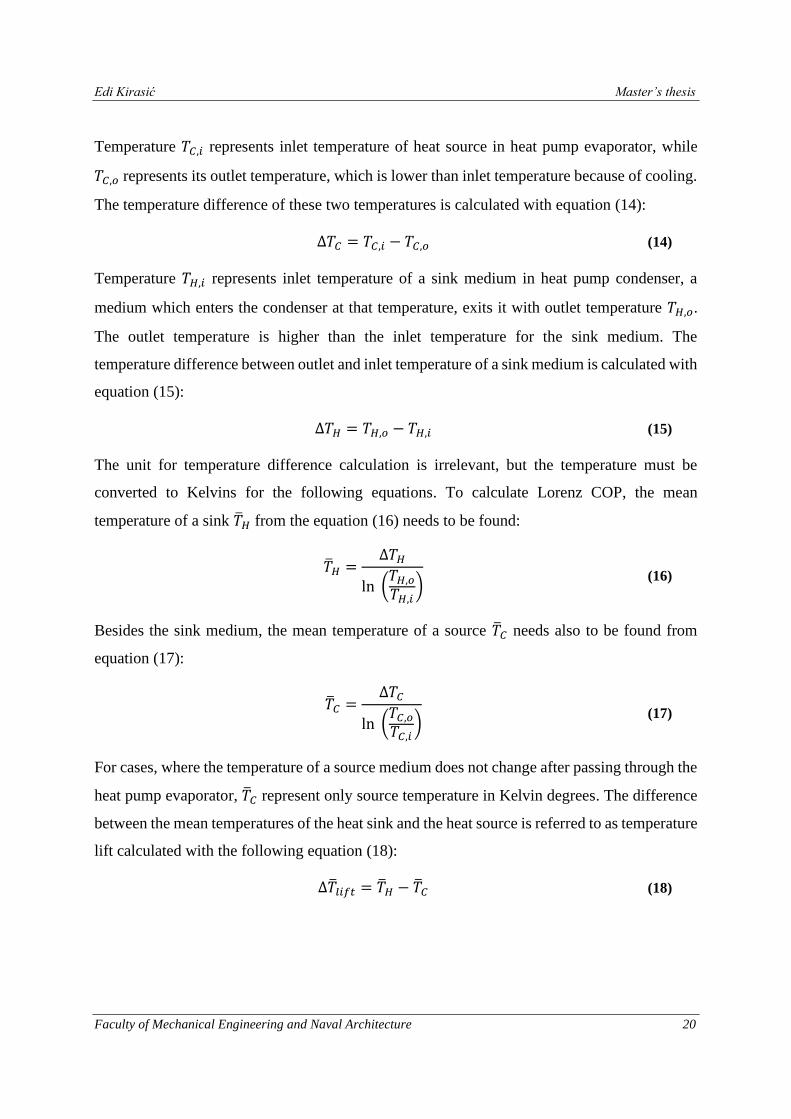
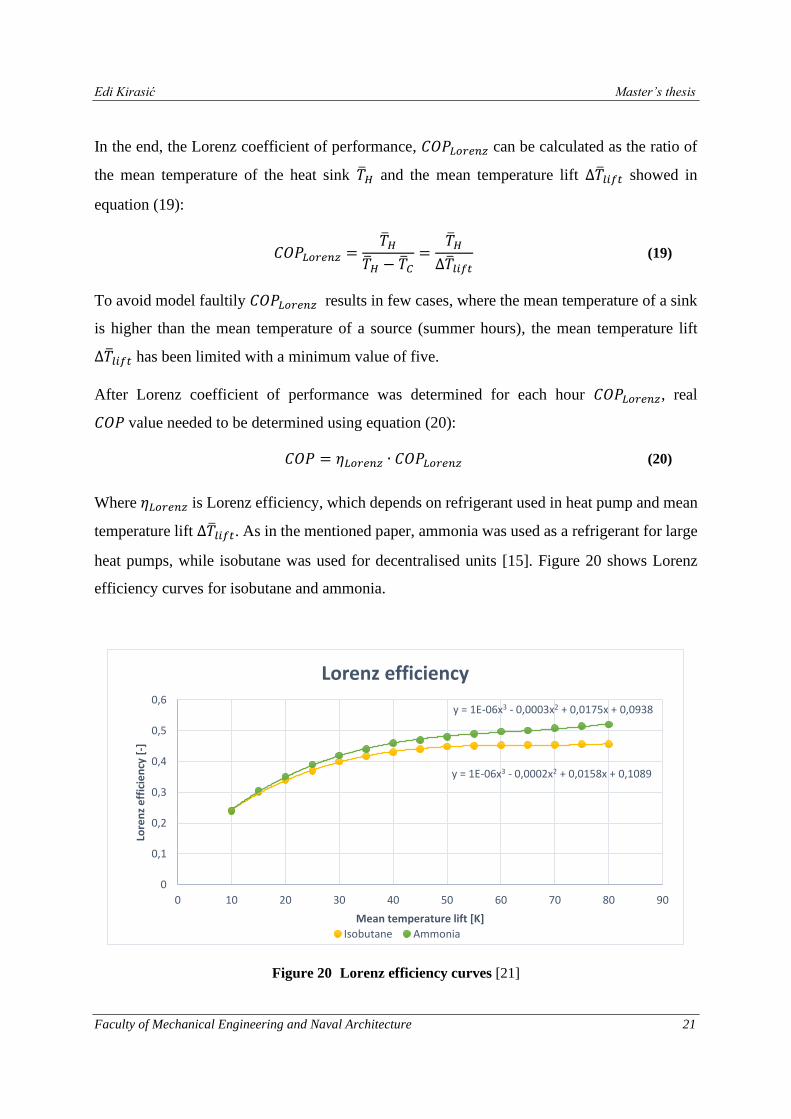
After Lorenz coefficient of performance was determined for each hour 𝐶𝑂𝑃𝐿𝑜𝑟𝑒𝑛𝑧, real
𝐶𝑂𝑃value needed to be determined using equation (20):
𝐶𝑂𝑃 = 𝜂𝐿𝑜𝑟𝑒𝑛𝑧 ∙ 𝐶𝑂𝑃𝐿𝑜𝑟𝑒𝑛𝑧 (20)
Where 𝜂𝐿𝑜𝑟𝑒𝑛𝑧 is Lorenz efficiency, which depends on refrigerant used in heat pump and mean
temperature lift ∆�̅�𝑙𝑖𝑓𝑡. As in the mentioned paper, ammonia was used as a refrigerant for large
heat pumps, while isobutane was used for decentralised units [15]. Figure 20 shows Lorenz
efficiency curves for isobutane and ammonia.
Figure 20 Lorenz efficiency curves [21]
y = 1E-06x3 - 0,0002x2 + 0,0158x + 0,1089
y = 1E-06x3 - 0,0003x2 + 0,0175x + 0,0938
0
0,1
0,2
0,3
0,4
0,5
0,6
0 10 20 30 40 50 60 70 80 90
Lore
nz
eff
icie
ncy
[-]
Mean temperature lift [K]
Lorenz efficiency
Isobutane Ammonia
Edi Kirasić Master’s thesis
Faculty of Mechanical Engineering and Naval Architecture 22
After final values of the coefficient of performances were calculated for each hour of the year,
a reduction for COP for air source heat pumps was applied to account for electricity loss due to
defrosting needs of these units at outdoor temperatures below 7°C. The reduction factor of air
source heat pump COP was taken as 0,84 [22].
3.4. Systems seasonal coefficient of performance
In LTDH cases, total heat production was in the central unit. In ULTDH cases, a portion of the
heat demand was produced in the central unit, and the rest was produced at decentral units. In
ULTDH cases with air source heat pump at consumer substations, ASHPs at consumer
substations covered only domestic hot water demand, while the central unit produced heat for
heating. In ULTDH with micro heat pumps and ULTDH with booster heat pumps at a building
level, the heat produced from the central unit in each hour was calculated with equation (21):
�̇�𝑐𝑒𝑛𝑡𝑟𝑎𝑙 = �̇�𝑡𝑜𝑡,𝑑𝑒𝑙𝑖𝑣𝑒𝑟𝑒𝑑 −�̇�𝑡𝑜𝑡,𝐷𝐻𝑊
𝐶𝑂𝑃𝑑𝑒𝑐𝑒𝑛𝑡𝑟𝑎𝑙 (21)
Where �̇�𝑡𝑜𝑡,𝑑𝑒𝑙𝑖𝑣𝑒𝑟𝑒𝑑 is total heat supplied to the network in a given hour (SH demand, DHW
demand and heat losses), �̇�𝑡𝑜𝑡,𝐷𝐻𝑊 is total DHW demand in a given hour and 𝐶𝑂𝑃𝑑𝑒𝑐𝑒𝑛𝑡𝑟𝑎𝑙 is
decentral unit COP (either booster heat pump or micro heat pump).
After calculation of COP value and heat production of each unit for each hour and each heat
pump, hourly electricity consumption could be calculated with equation (22):
𝐶𝑂𝑃 =�̇�
�̇�→ �̇� =
�̇�
𝐶𝑂𝑃 (22)
Total annual electricity consumption of district heating system is the sum of annual central unit
electricity consumption 𝑊𝑐𝑒𝑛𝑡𝑟𝑎𝑙, annual pump electricity consumption 𝑊𝑝𝑢𝑚𝑝, and, if present,
annual decentral units electricity consumption 𝑊𝑑𝑒𝑐𝑒𝑛𝑡𝑟𝑎𝑙 as shown in equation (23):
𝑊𝑡𝑜𝑡 = 𝑊𝑐𝑒𝑛𝑡𝑟𝑎𝑙 +𝑊𝑝𝑢𝑚𝑝 +𝑊𝑑𝑒𝑐𝑒𝑛𝑡𝑟𝑎𝑙 (23)
System seasonal coefficient of performance is then calculated as a ratio of total heat delivered
to the customers, 𝑄𝑡𝑜𝑡 and total electricity consumption of a system in one year, 𝑊𝑡𝑜𝑡 as in (24):
𝐶𝑂𝑃𝑠𝑦𝑠𝑡𝑒𝑚,𝑠𝑒𝑎𝑠𝑜𝑛𝑎𝑙 =𝑄𝑡𝑜𝑡𝑊𝑡𝑜𝑡
(24)

Edi Kirasić Master’s thesis
Faculty of Mechanical Engineering and Naval Architecture 23
3.5. Levelized cost of heat, carbon emission, and primary energy factors
Levelized cost of heat (𝐿𝐶𝑂𝐻) was calculated as the sum of 𝐶𝐴𝑃𝐸𝑋 and 𝑂𝑃𝐸𝑋 divided by
delivered heat to the consumers. 𝐶𝐴𝑃𝐸𝑋 was calculated using equation (25):
𝐶𝐴𝑃𝐸𝑋 = 𝐶𝑅𝐹 ∙ 𝐼 =𝑖 ∙ (1 + 𝑖)𝑛
(1 + 𝑖)𝑛 − 1∙ 𝐼 (25)
Where 𝐶𝑅𝐹 is capital recovery factor [23] calculated for each part of investment separately,
taking into account lifetime 𝑛 and discount rate 𝑖 suggested by Croatian National Bank [24]. 𝐼
represents investment cost of certain part of a system.
𝑂𝑃𝐸𝑋 was calculated as a sum of all 𝑂&𝑀 costs added to total electricity cost or total gas
consumption cost. 𝑂𝑃𝐸𝑋 is shown in equation (26):
𝑂𝑃𝐸𝑋 =∑𝑂&𝑀𝑖
𝑁
𝑖=1
+ (𝐸𝑜𝑟𝐺) (26)
𝐿𝐶𝑂𝐻 value was then calculated as a ratio of 𝐶𝐴𝑃𝐸𝑋 and 𝑂𝑃𝐸𝑋 sum and total heat delivered
to the consumers in a year, as in equation (27):
𝐿𝐶𝑂𝐻 =𝐶𝐴𝑃𝐸𝑋 + 𝑂𝑃𝐸𝑋
𝑄𝑡𝑜𝑡 (27)
Primary energy factor 𝑓𝑝𝑟𝑖𝑚,𝑠𝑐𝑒𝑛𝑎𝑟𝑖𝑜 was calculated as a ratio of primary energy used over total
heat delivered 𝑄𝑡𝑜𝑡 to the consumers in a year. Firstly, total electricity 𝑊𝑡𝑜𝑡 or gas 𝑇𝑡𝑜𝑡
consumption was converted to primary energy. The result was then divided with total heat
consumption of consumers 𝑄𝑡𝑜𝑡, as in equation (28):
𝑓𝑝𝑟𝑖𝑚,𝑠𝑐𝑒𝑛𝑎𝑟𝑖𝑜 =(𝑊𝑡𝑜𝑡𝑜𝑟𝑇𝑡𝑜𝑡) ∙ 𝑓𝑝𝑟𝑖𝑚
𝑄𝑡𝑜𝑡 (28)
A similar procedure has taken place while determining the CO2 factor (carbon emission factor).
Electricity 𝑊𝑡𝑜𝑡 or gas 𝑇𝑡𝑜𝑡 consumption was multiplied with CO2 factors 𝑓𝐶𝑂2 Those values
are at the end divided by the total heat consumption of consumers 𝑄𝑡𝑜𝑡, as in equation (29):
𝑓𝐶𝑂2,𝑠𝑐𝑒𝑛𝑎𝑟𝑖𝑜 =(𝑊𝑡𝑜𝑡𝑜𝑟𝑇𝑡𝑜𝑡) ∙ 𝑓𝐶𝑂2
𝑄𝑡𝑜𝑡 (29)

Edi Kirasić Master’s thesis
Faculty of Mechanical Engineering and Naval Architecture 24
4. CASE STUDY
Four scenarios were developed:
• LTDH network (LTDH).
• ULTDH network with booster heat pumps at the building level (ULTDH_Booster).
• ULTDH network with micro heat pumps in each apartment (ULTDH_Micro).
• ULTDH network where central heat source covers space heating (SH) demand and
DHW demand is covered through air source heat pumps (ASHP) at the building level
(ULTDH_Air).
For each scenario heat source for the central heat pump was varied. District heating systems
were supplied by a central air source heat pump, groundwater heat pump, excess heat pump, or
heat exchangers supplied with excess heat. The last central supply option is an ideal scenario
because it is hard to find year-round excess heat at high enough temperatures. Figure 21 presents
variations of consumer substations. Figure 21 (a) represents the LTDH system with heat
exchangers at the consumer substation Figure 21 (b) depicts a ULTDH system with a heat
exchanger for space heating and booster heat pump on the primary side for DHW demand of a
whole building. Here supply from the network is used as a source and sink for the heat pump.
Figure 21 (c) represents the ULTDH case where the network is used to cover space heating
demand while air source heat pumps cover DHW demand. Figure 21 (d) presents the ULTDH
network with micro heat pumps in each apartment for DHW preparation.
Figure 21 Four scenarios considered in the calculation [15]
Edi Kirasić Master’s thesis
Faculty of Mechanical Engineering and Naval Architecture 25
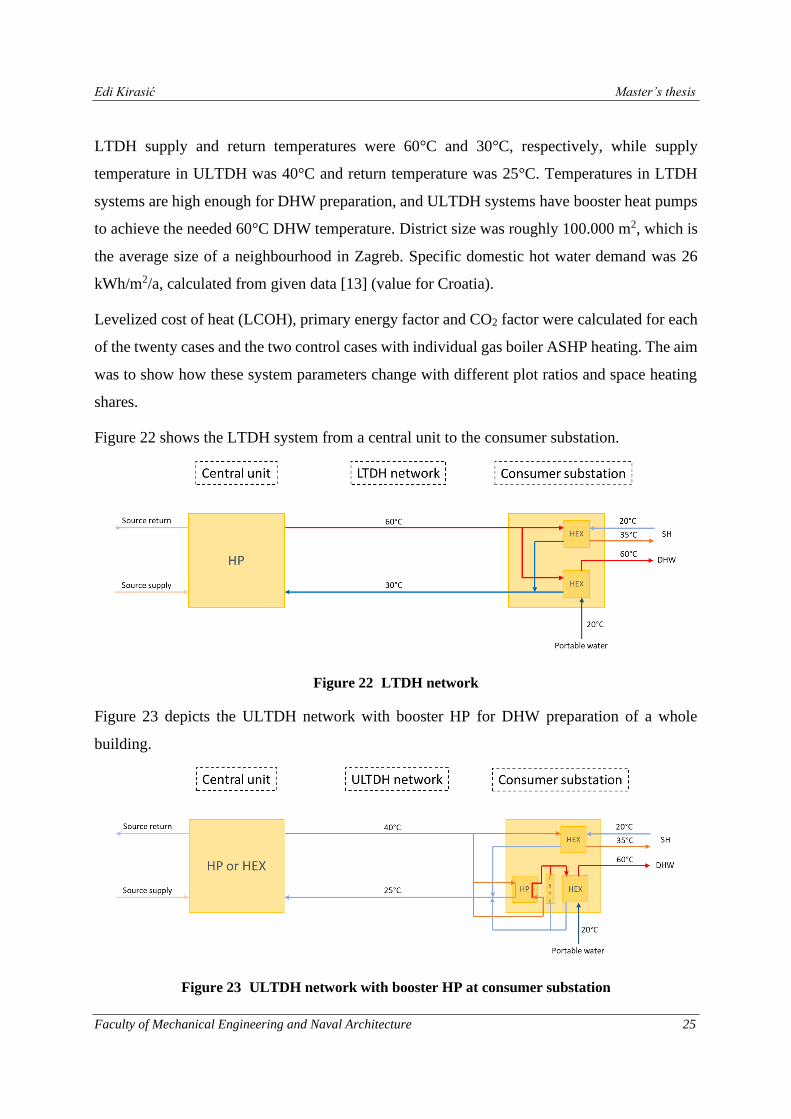
LTDH supply and return temperatures were 60°C and 30°C, respectively, while supply
temperature in ULTDH was 40°C and return temperature was 25°C. Temperatures in LTDH
systems are high enough for DHW preparation, and ULTDH systems have booster heat pumps
to achieve the needed 60°C DHW temperature. District size was roughly 100.000 m2, which is
the average size of a neighbourhood in Zagreb. Specific domestic hot water demand was 26
kWh/m2/a, calculated from given data [13] (value for Croatia).
Levelized cost of heat (LCOH), primary energy factor and CO2 factor were calculated for each
of the twenty cases and the two control cases with individual gas boiler ASHP heating. The aim
was to show how these system parameters change with different plot ratios and space heating
shares.
Figure 22 shows the LTDH system from a central unit to the consumer substation.
Figure 22 LTDH network
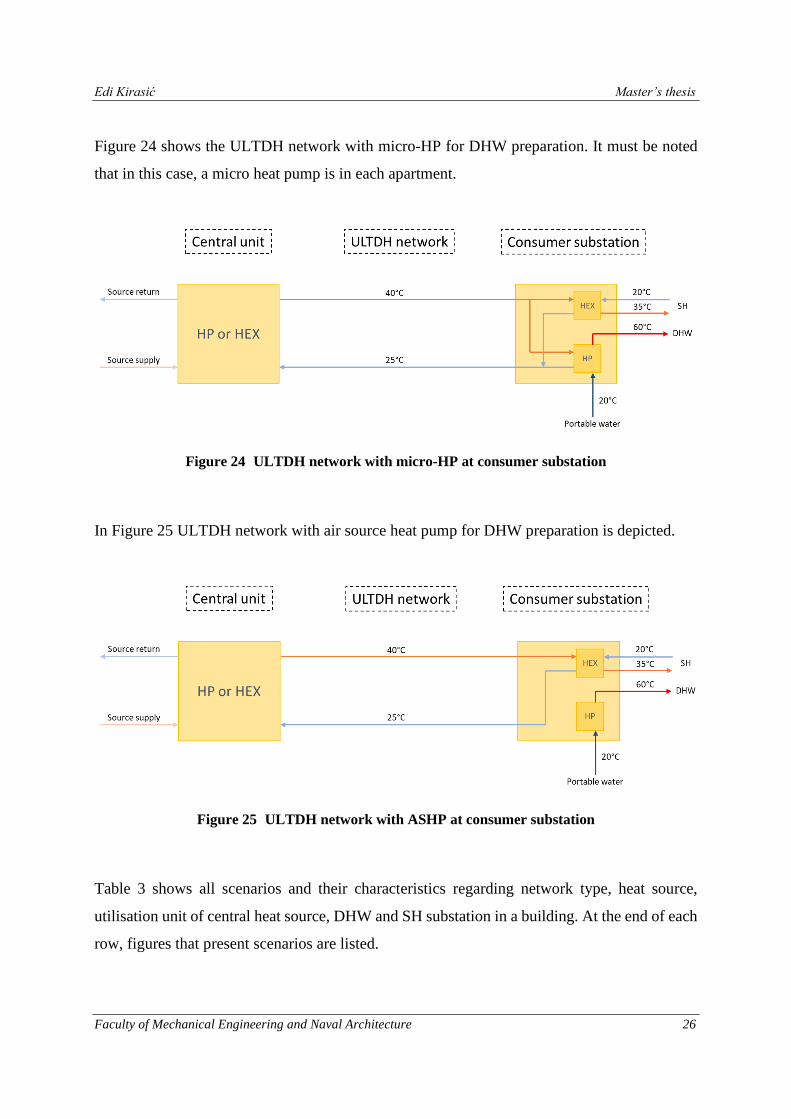
Figure 23 depicts the ULTDH network with booster HP for DHW preparation of a whole
building.
Figure 23 ULTDH network with booster HP at consumer substation
Edi Kirasić Master’s thesis
Faculty of Mechanical Engineering and Naval Architecture 26
Figure 24 shows the ULTDH network with micro-HP for DHW preparation. It must be noted
that in this case, a micro heat pump is in each apartment.
Figure 24 ULTDH network with micro-HP at consumer substation
In Figure 25 ULTDH network with air source heat pump for DHW preparation is depicted.
Figure 25 ULTDH network with ASHP at consumer substation
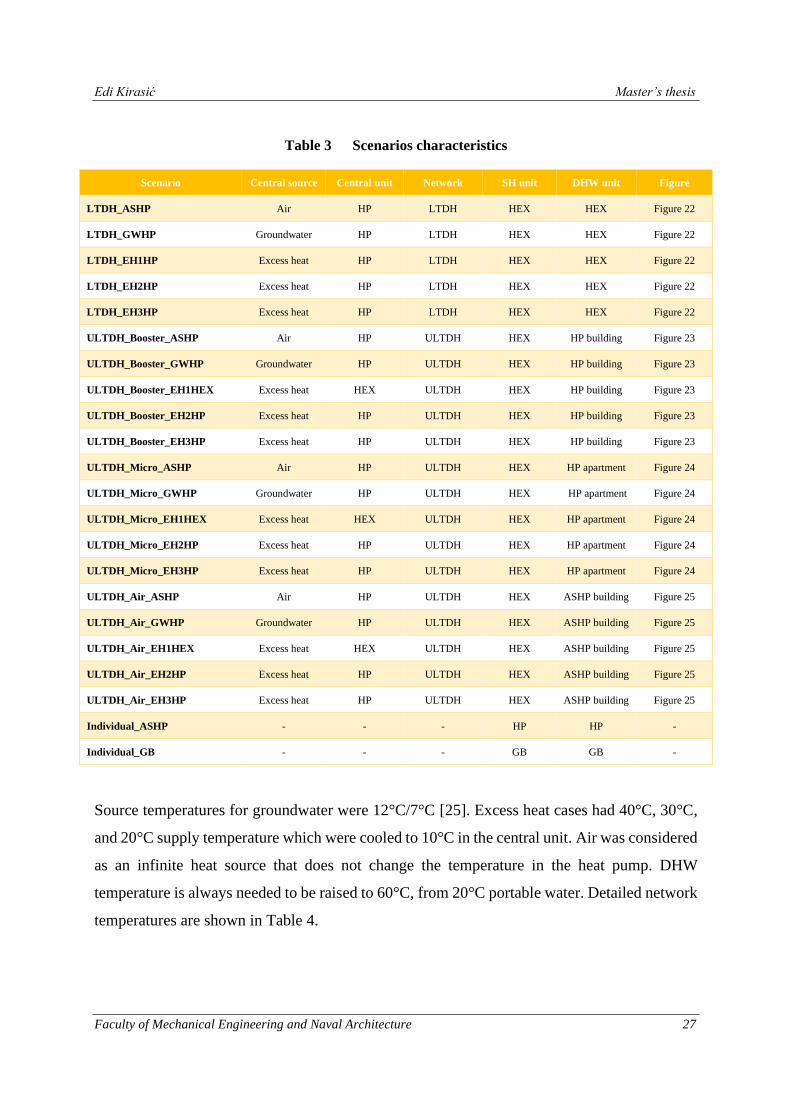
Table 3 shows all scenarios and their characteristics regarding network type, heat source,
utilisation unit of central heat source, DHW and SH substation in a building. At the end of each
row, figures that present scenarios are listed.
Edi Kirasić Master’s thesis
Faculty of Mechanical Engineering and Naval Architecture 27
Table 3 Scenarios characteristics
Scenario Central source Central unit Network SH unit DHW unit Figure
LTDH_ASHP Air HP LTDH HEX HEX Figure 22
LTDH_GWHP Groundwater HP LTDH HEX HEX Figure 22
LTDH_EH1HP Excess heat HP LTDH HEX HEX Figure 22
LTDH_EH2HP Excess heat HP LTDH HEX HEX Figure 22
LTDH_EH3HP Excess heat HP LTDH HEX HEX Figure 22
ULTDH_Booster_ASHP Air HP ULTDH HEX HP building Figure 23
ULTDH_Booster_GWHP Groundwater HP ULTDH HEX HP building Figure 23
ULTDH_Booster_EH1HEX Excess heat HEX ULTDH HEX HP building Figure 23
ULTDH_Booster_EH2HP Excess heat HP ULTDH HEX HP building Figure 23
ULTDH_Booster_EH3HP Excess heat HP ULTDH HEX HP building Figure 23
ULTDH_Micro_ASHP Air HP ULTDH HEX HP apartment Figure 24
ULTDH_Micro_GWHP Groundwater HP ULTDH HEX HP apartment Figure 24
ULTDH_Micro_EH1HEX Excess heat HEX ULTDH HEX HP apartment Figure 24
ULTDH_Micro_EH2HP Excess heat HP ULTDH HEX HP apartment Figure 24
ULTDH_Micro_EH3HP Excess heat HP ULTDH HEX HP apartment Figure 24
ULTDH_Air_ASHP Air HP ULTDH HEX ASHP building Figure 25
ULTDH_Air_GWHP Groundwater HP ULTDH HEX ASHP building Figure 25
ULTDH_Air_EH1HEX Excess heat HEX ULTDH HEX ASHP building Figure 25
ULTDH_Air_EH2HP Excess heat HP ULTDH HEX ASHP building Figure 25
ULTDH_Air_EH3HP Excess heat HP ULTDH HEX ASHP building Figure 25
Individual_ASHP - - - HP HP -
Individual_GB - - - GB GB -
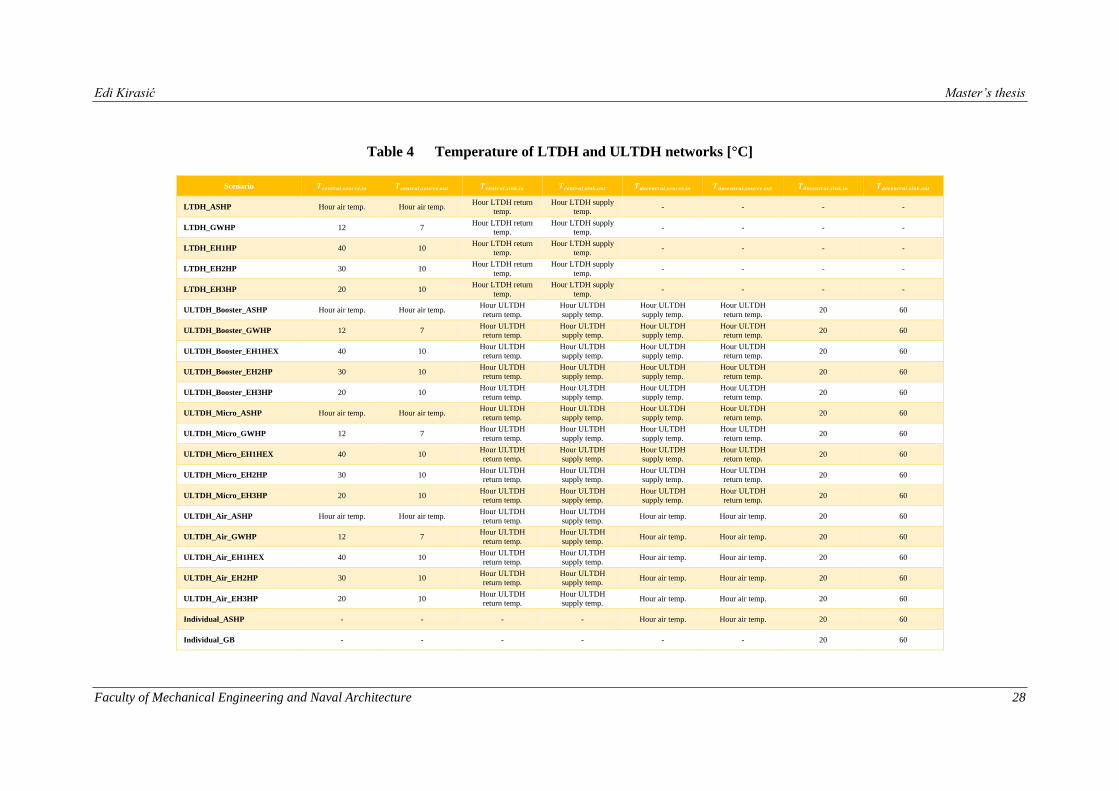
Source temperatures for groundwater were 12°C/7°C [25]. Excess heat cases had 40°C, 30°C,
and 20°C supply temperature which were cooled to 10°C in the central unit. Air was considered
as an infinite heat source that does not change the temperature in the heat pump. DHW
temperature is always needed to be raised to 60°C, from 20°C portable water. Detailed network
temperatures are shown in Table 4.
Edi Kirasić Master’s thesis
Faculty of Mechanical Engineering and Naval Architecture 28
Table 4 Temperature of LTDH and ULTDH networks [°C]
Scenario 𝑻𝒄𝒆𝒏𝒕𝒓𝒂𝒍,𝒔𝒐𝒖𝒓𝒄𝒆,𝒊𝒏 𝑻𝒄𝒆𝒏𝒕𝒓𝒂𝒍,𝒔𝒐𝒖𝒓𝒄𝒆,𝒐𝒖𝒕 𝑻𝒄𝒆𝒏𝒕𝒓𝒂𝒍,𝒔𝒊𝒏𝒌,𝒊𝒏 𝑻𝒄𝒆𝒏𝒕𝒓𝒂𝒍,𝒔𝒊𝒏𝒌,𝒐𝒖𝒕 𝑻𝒅𝒆𝒄𝒆𝒏𝒕𝒓𝒂𝒍,𝒔𝒐𝒖𝒓𝒄𝒆,𝒊𝒏 𝑻𝒅𝒆𝒄𝒆𝒏𝒕𝒓𝒂𝒍,𝒔𝒐𝒖𝒓𝒄𝒆,𝒐𝒖𝒕 𝑻𝒅𝒆𝒄𝒆𝒏𝒕𝒓𝒂𝒍,𝒔𝒊𝒏𝒌,𝒊𝒏 𝑻𝒅𝒆𝒄𝒆𝒏𝒕𝒓𝒂𝒍,𝒔𝒊𝒏𝒌,𝒐𝒖𝒕
LTDH_ASHP Hour air temp. Hour air temp. Hour LTDH return
temp.
Hour LTDH supply
temp. - - - -
LTDH_GWHP 12 7 Hour LTDH return
temp.
Hour LTDH supply
temp. - - - -
LTDH_EH1HP 40 10 Hour LTDH return
temp.
Hour LTDH supply
temp. - - - -
LTDH_EH2HP 30 10 Hour LTDH return
temp.
Hour LTDH supply
temp. - - - -
LTDH_EH3HP 20 10 Hour LTDH return
temp.
Hour LTDH supply
temp. - - - -
ULTDH_Booster_ASHP Hour air temp. Hour air temp. Hour ULTDH
return temp.
Hour ULTDH
supply temp.
Hour ULTDH
supply temp.
Hour ULTDH
return temp. 20 60
ULTDH_Booster_GWHP 12 7 Hour ULTDH
return temp.
Hour ULTDH
supply temp.
Hour ULTDH
supply temp.
Hour ULTDH
return temp. 20 60
ULTDH_Booster_EH1HEX 40 10 Hour ULTDH
return temp.
Hour ULTDH
supply temp.
Hour ULTDH
supply temp.
Hour ULTDH
return temp. 20 60
ULTDH_Booster_EH2HP 30 10 Hour ULTDH
return temp.
Hour ULTDH
supply temp.
Hour ULTDH
supply temp.
Hour ULTDH
return temp. 20 60
ULTDH_Booster_EH3HP 20 10 Hour ULTDH
return temp.
Hour ULTDH
supply temp.
Hour ULTDH
supply temp.
Hour ULTDH
return temp. 20 60
ULTDH_Micro_ASHP Hour air temp. Hour air temp. Hour ULTDH
return temp.
Hour ULTDH
supply temp.
Hour ULTDH
supply temp.
Hour ULTDH
return temp. 20 60
ULTDH_Micro_GWHP 12 7 Hour ULTDH
return temp.
Hour ULTDH
supply temp.
Hour ULTDH
supply temp.
Hour ULTDH
return temp. 20 60
ULTDH_Micro_EH1HEX 40 10 Hour ULTDH
return temp.
Hour ULTDH
supply temp.
Hour ULTDH
supply temp.
Hour ULTDH
return temp. 20 60
ULTDH_Micro_EH2HP 30 10 Hour ULTDH
return temp.
Hour ULTDH
supply temp.
Hour ULTDH
supply temp.
Hour ULTDH
return temp. 20 60
ULTDH_Micro_EH3HP 20 10 Hour ULTDH
return temp.
Hour ULTDH
supply temp.
Hour ULTDH
supply temp.
Hour ULTDH
return temp. 20 60
ULTDH_Air_ASHP Hour air temp. Hour air temp. Hour ULTDH
return temp.
Hour ULTDH
supply temp. Hour air temp. Hour air temp. 20 60
ULTDH_Air_GWHP 12 7 Hour ULTDH
return temp.
Hour ULTDH
supply temp. Hour air temp. Hour air temp. 20 60
ULTDH_Air_EH1HEX 40 10 Hour ULTDH
return temp.
Hour ULTDH
supply temp. Hour air temp. Hour air temp. 20 60
ULTDH_Air_EH2HP 30 10 Hour ULTDH
return temp.
Hour ULTDH
supply temp. Hour air temp. Hour air temp. 20 60
ULTDH_Air_EH3HP 20 10 Hour ULTDH
return temp.
Hour ULTDH
supply temp. Hour air temp. Hour air temp. 20 60
Individual_ASHP - - - - Hour air temp. Hour air temp. 20 60
Individual_GB - - - - - - 20 60

Edi Kirasić Master’s thesis
Faculty of Mechanical Engineering and Naval Architecture 29
4.1. Input data
The model was developed according to Croatian data. Hourly temperatures were taken for
average outdoor temperature in Croatia for 2018 [26]. Hourly temperature values throughout
the year are shown in Figure 26.
Figure 26 Average outdoor temperature in Croatia in 2018 [26]
SH and DHW demand were modelled according to the total SH and DHW demand of
households in Croatia in 2018 [13]. Figure 27 shows household relative SH demand through
the year. Figure 28 shows household relative domestic hot water demand throughout the year.
-20
-10
0
10
20
30
40
12
38
47
57
12
94
91
18
61
42
31
66
01
89
72
13
42
37
12
60
82
84
53
08
23
31
93
55
63
79
34
03
04
26
74
50
44
74
14
97
85
21
55
45
25
68
95
92
66
16
36
40
06
63
76
87
47
11
17
34
87
58
57
82
28
05
98
29
68
53
3
Tem
pe
ratu
re[°
C]
Time [h]
Average outdoor temperature in Croatia

Edi Kirasić Master’s thesis
Faculty of Mechanical Engineering and Naval Architecture 30
Figure 27 Relative SH demand curve for Croatia in 2018 [13]
Figure 28 Relative DHW demand curve for Croatia in 2018 [13]
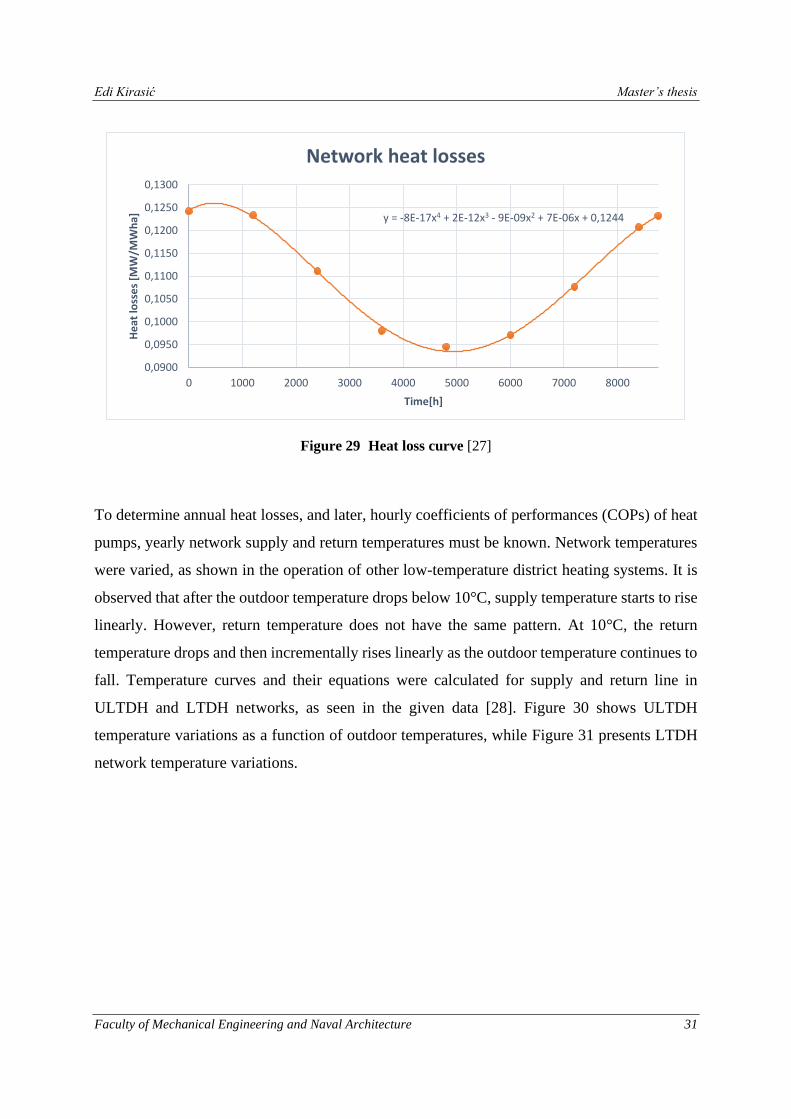
To determine the heat losses of a network, the heat loss distribution curve needs to be known.
The curve equation that distributes heat losses over the year was calculated from the given data
[27]. Because the heat losses are calculated as annual value, the curve was fitted to spread losses
over 8.760 hours. Figure 29 shows the calculated relative heat loss curve.
0
0,0001
0,0002
0,0003
0,0004
0,0005
0,00061
25
95
17
77
51
03
31
29
11
54
91
80
72
06
52
32
32
58
12
83
93
09
73
35
53
61
33
87
14
12
94
38
74
64
54
90
35
16
15
41
95
67
75
93
56
19
36
45
16
70
96
96
77
22
57
48
37
74
17
99
98
25
78
51
5
SH d
em
and
[M
W/M
Wh
a]
Time [h]
Relative space heating demand curve
0
0,00002
0,00004
0,00006
0,00008
0,0001
0,00012
0,00014
0,00016
0,00018
12
59
51
77
75
10
33
12
91
15
49
18
07
20
65
23
23
25
81
28
39
30
97
33
55
36
13
38
71
41
29
43
87
46
45
49
03
51
61
54
19
56
77
59
35
61
93
64
51
67
09
69
67
72
25
74
83
77
41
79
99
82
57
85
15
DH
W d
em
and
[M
W/M
Wh
a]
Time [h]
Relative domestic hot water demand curve
Edi Kirasić Master’s thesis
Faculty of Mechanical Engineering and Naval Architecture 31
Figure 29 Heat loss curve [27]
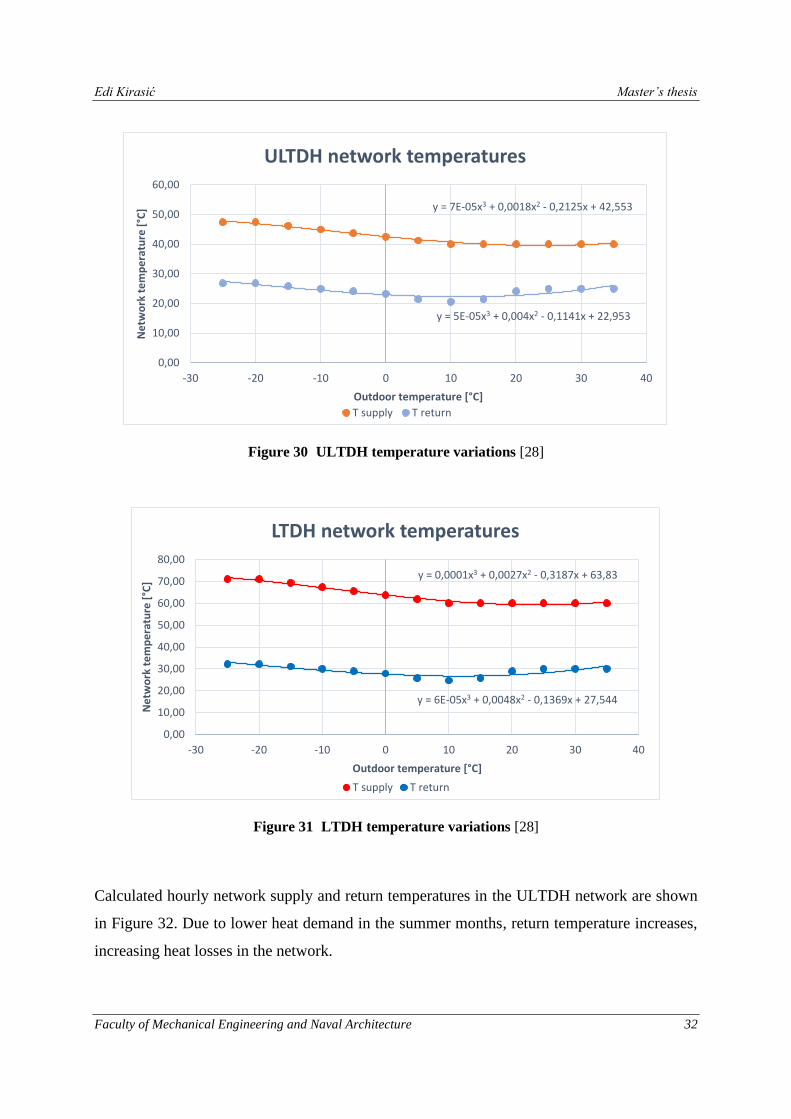
To determine annual heat losses, and later, hourly coefficients of performances (COPs) of heat
pumps, yearly network supply and return temperatures must be known. Network temperatures
were varied, as shown in the operation of other low-temperature district heating systems. It is
observed that after the outdoor temperature drops below 10°C, supply temperature starts to rise
linearly. However, return temperature does not have the same pattern. At 10°C, the return
temperature drops and then incrementally rises linearly as the outdoor temperature continues to
fall. Temperature curves and their equations were calculated for supply and return line in
ULTDH and LTDH networks, as seen in the given data [28]. Figure 30 shows ULTDH
temperature variations as a function of outdoor temperatures, while Figure 31 presents LTDH
network temperature variations.
y = -8E-17x4 + 2E-12x3 - 9E-09x2 + 7E-06x + 0,1244
0,0900
0,0950
0,1000
0,1050
0,1100
0,1150
0,1200
0,1250
0,1300
0 1000 2000 3000 4000 5000 6000 7000 8000
He
at lo
sse
s [M
W/M
Wh
a]
Time[h]
Network heat losses
Edi Kirasić Master’s thesis
Faculty of Mechanical Engineering and Naval Architecture 32
Figure 30 ULTDH temperature variations [28]
Figure 31 LTDH temperature variations [28]
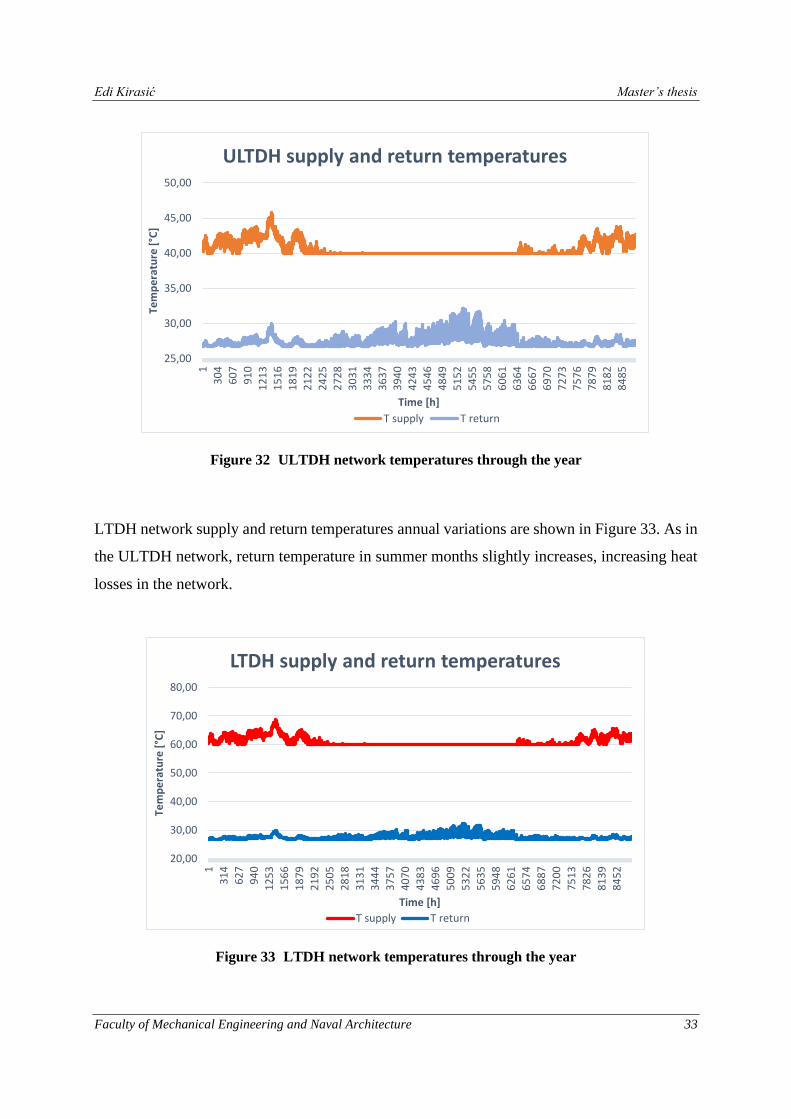
Calculated hourly network supply and return temperatures in the ULTDH network are shown
in Figure 32. Due to lower heat demand in the summer months, return temperature increases,
increasing heat losses in the network.
y = 7E-05x3 + 0,0018x2 - 0,2125x + 42,553
y = 5E-05x3 + 0,004x2 - 0,1141x + 22,953
0,00
10,00
20,00
30,00
40,00
50,00
60,00
-30 -20 -10 0 10 20 30 40
Ne
two
rk t
em
pe
ratu
re [
°C]
Outdoor temperature [°C]
ULTDH network temperatures
T supply T return
y = 0,0001x3 + 0,0027x2 - 0,3187x + 63,83
y = 6E-05x3 + 0,0048x2 - 0,1369x + 27,544
0,00
10,00
20,00
30,00
40,00
50,00
60,00
70,00
80,00
-30 -20 -10 0 10 20 30 40
Ne
two
rk t
em
pe
ratu
re [
°C]
Outdoor temperature [°C]
LTDH network temperatures
T supply T return
Edi Kirasić Master’s thesis
Faculty of Mechanical Engineering and Naval Architecture 33
Figure 32 ULTDH network temperatures through the year
LTDH network supply and return temperatures annual variations are shown in Figure 33. As in
the ULTDH network, return temperature in summer months slightly increases, increasing heat
losses in the network.
Figure 33 LTDH network temperatures through the year
25,00
30,00
35,00
40,00
45,00
50,00
13
04
60
79
10
12
13
15
16
18
19
21
22
24
25
27
28
30
31
33
34
36
37
39
40
42
43
45
46
48
49
51
52
54
55
57
58
60
61
63
64
66
67
69
70
72
73
75
76
78
79
81
82
84
85
Tem
pe
ratu
re [
°C]
Time [h]
ULTDH supply and return temperatures
T supply T return
20,00
30,00
40,00
50,00
60,00
70,00
80,00
1
31
4
62
7
94
0
12
53
15
66
18
79
21
92
25
05
28
18
31
31
34
44
37
57
40
70
43
83
46
96
50
09
53
22
56
35
59
48
62
61
65
74
68
87
72
00
75
13
78
26
81
39
84
52
Tem
pe
ratu
re [
°C]
Time [h]
LTDH supply and return temperatures
T supply T return
Edi Kirasić Master’s thesis
Faculty of Mechanical Engineering and Naval Architecture 34
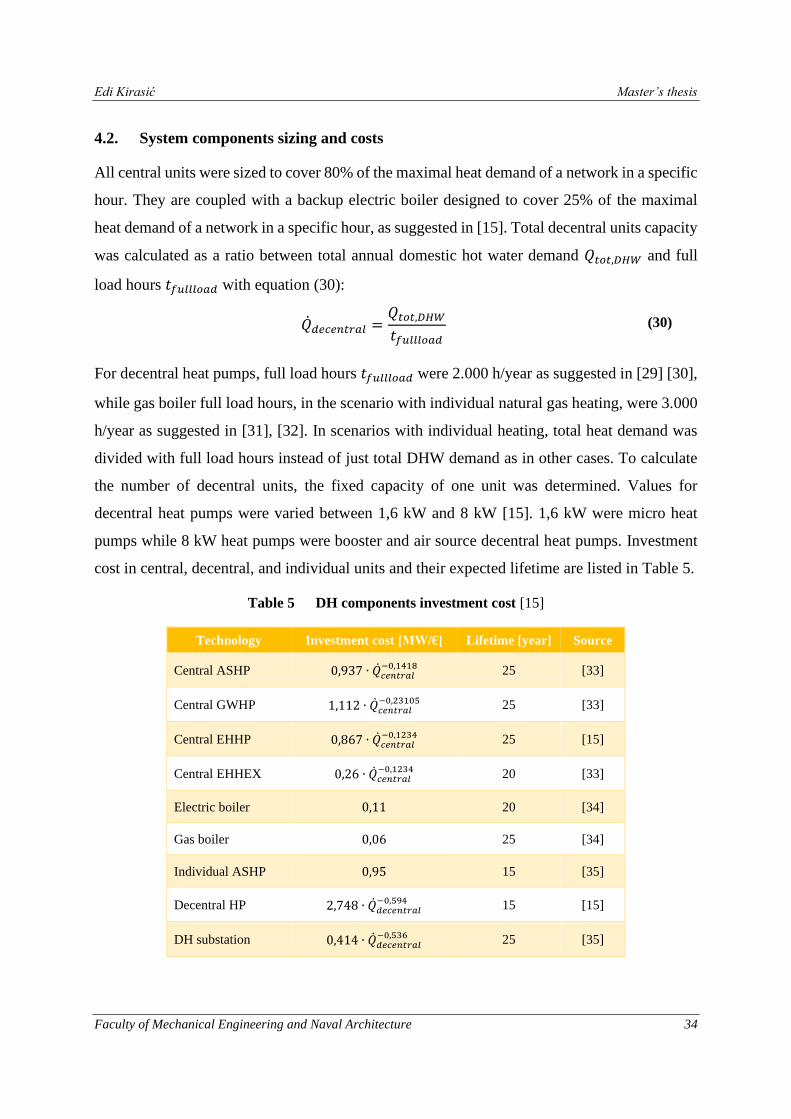
4.2. System components sizing and costs
All central units were sized to cover 80% of the maximal heat demand of a network in a specific
hour. They are coupled with a backup electric boiler designed to cover 25% of the maximal
heat demand of a network in a specific hour, as suggested in [15]. Total decentral units capacity
was calculated as a ratio between total annual domestic hot water demand 𝑄𝑡𝑜𝑡,𝐷𝐻𝑊 and full
load hours 𝑡𝑓𝑢𝑙𝑙𝑙𝑜𝑎𝑑 with equation (30):
�̇�𝑑𝑒𝑐𝑒𝑛𝑡𝑟𝑎𝑙 =𝑄𝑡𝑜𝑡,𝐷𝐻𝑊𝑡𝑓𝑢𝑙𝑙𝑙𝑜𝑎𝑑
(30)
For decentral heat pumps, full load hours 𝑡𝑓𝑢𝑙𝑙𝑙𝑜𝑎𝑑 were 2.000 h/year as suggested in [29] [30],
while gas boiler full load hours, in the scenario with individual natural gas heating, were 3.000
h/year as suggested in [31], [32]. In scenarios with individual heating, total heat demand was
divided with full load hours instead of just total DHW demand as in other cases. To calculate
the number of decentral units, the fixed capacity of one unit was determined. Values for
decentral heat pumps were varied between 1,6 kW and 8 kW [15]. 1,6 kW were micro heat
pumps while 8 kW heat pumps were booster and air source decentral heat pumps. Investment
cost in central, decentral, and individual units and their expected lifetime are listed in Table 5.
Table 5 DH components investment cost [15]
Technology Investment cost [MW/€] Lifetime [year] Source
Central ASHP 0,937 ∙ �̇�𝑐𝑒𝑛𝑡𝑟𝑎𝑙−0,1418
25 [33]
Central GWHP 1,112 ∙ �̇�𝑐𝑒𝑛𝑡𝑟𝑎𝑙−0,23105
25 [33]
Central EHHP 0,867 ∙ �̇�𝑐𝑒𝑛𝑡𝑟𝑎𝑙−0,1234
25 [15]
Central EHHEX 0,26 ∙ �̇�𝑐𝑒𝑛𝑡𝑟𝑎𝑙−0,1234
20 [33]
Electric boiler 0,11 20 [34]
Gas boiler 0,06 25 [34]
Individual ASHP 0,95 15 [35]
Decentral HP 2,748 ∙ �̇�𝑑𝑒𝑐𝑒𝑛𝑡𝑟𝑎𝑙−0,594
15 [15]
DH substation 0,414 ∙ �̇�𝑑𝑒𝑐𝑒𝑛𝑡𝑟𝑎𝑙−0,536
25 [35]
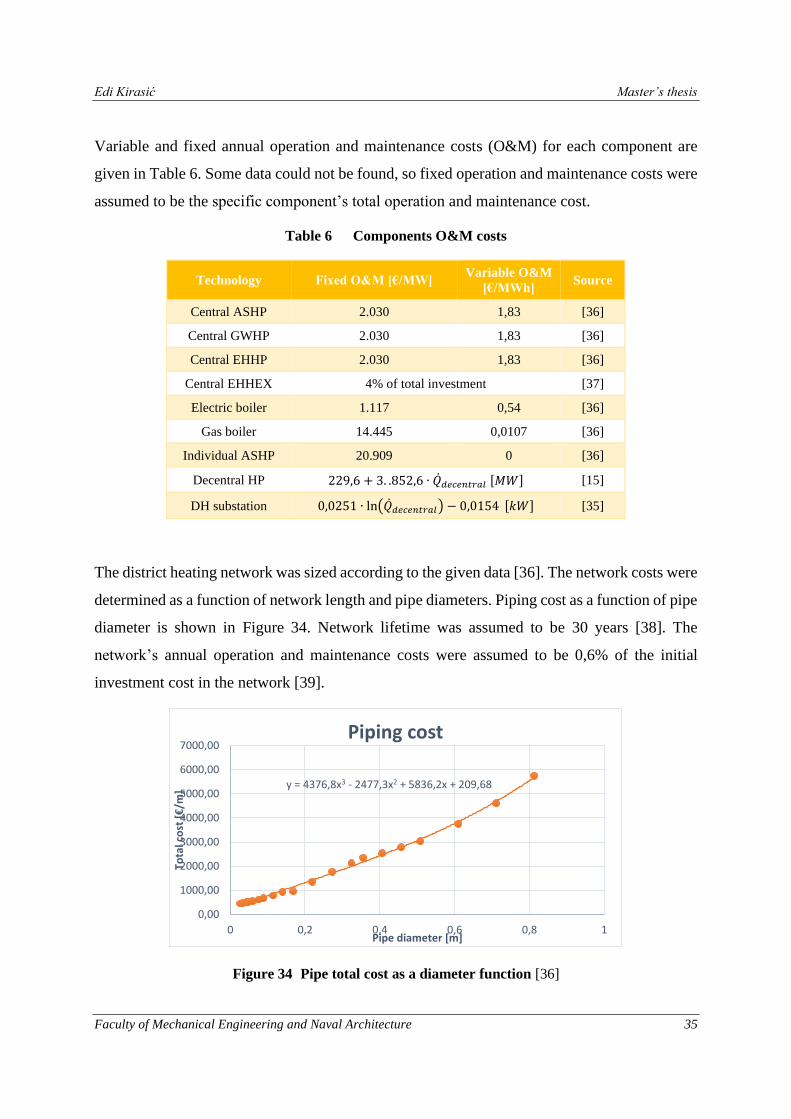
Edi Kirasić Master’s thesis
Faculty of Mechanical Engineering and Naval Architecture 35
Variable and fixed annual operation and maintenance costs (O&M) for each component are
given in Table 6. Some data could not be found, so fixed operation and maintenance costs were
assumed to be the specific component’s total operation and maintenance cost.
Table 6 Components O&M costs
Technology Fixed O&M [€/MW] Variable O&M
[€/MWh] Source
Central ASHP 2.030 1,83 [36]
Central GWHP 2.030 1,83 [36]
Central EHHP 2.030 1,83 [36]
Central EHHEX 4% of total investment [37]
Electric boiler 1.117 0,54 [36]
Gas boiler 14.445 0,0107 [36]
Individual ASHP 20.909 0 [36]
Decentral HP 229,6 + 3. .852,6 ∙ �̇�𝑑𝑒𝑐𝑒𝑛𝑡𝑟𝑎𝑙 [𝑀𝑊] [15]
DH substation 0,0251 ∙ ln(�̇�𝑑𝑒𝑐𝑒𝑛𝑡𝑟𝑎𝑙) − 0,0154[𝑘𝑊] [35]
The district heating network was sized according to the given data [36]. The network costs were
determined as a function of network length and pipe diameters. Piping cost as a function of pipe
diameter is shown in Figure 34. Network lifetime was assumed to be 30 years [38]. The
network’s annual operation and maintenance costs were assumed to be 0,6% of the initial
investment cost in the network [39].
Figure 34 Pipe total cost as a diameter function [36]
y = 4376,8x3 - 2477,3x2 + 5836,2x + 209,68
0,00
1000,00
2000,00
3000,00
4000,00
5000,00
6000,00
7000,00
0 0,2 0,4 0,6 0,8 1
Tota
l co
st [
€/m
]
Pipe diameter [m]
Piping cost

Edi Kirasić Master’s thesis
Faculty of Mechanical Engineering and Naval Architecture 36
The price of electricity was taken from Eurostat as the average electricity price (without taxes)
for households and non-household consumers in Europe. Prices were 81,10 €/MWh for non-
households and 126,90 €/MWh for households [40]. Gas prices were considered as average
European prices for households, 47,60 €/MWh [41].
When it comes to primary energy calculation, primary factor, 𝑓𝑝𝑟𝑖𝑚 for electricity was 1,614,
and for natural gas 1,095 [42]. Carbon emission factors 𝑓𝐶𝑂2 were taken from Croatian data
(0,22 tCO2/MWh for natural gas and 0,12 tCO2/MWh for electricity [42]).
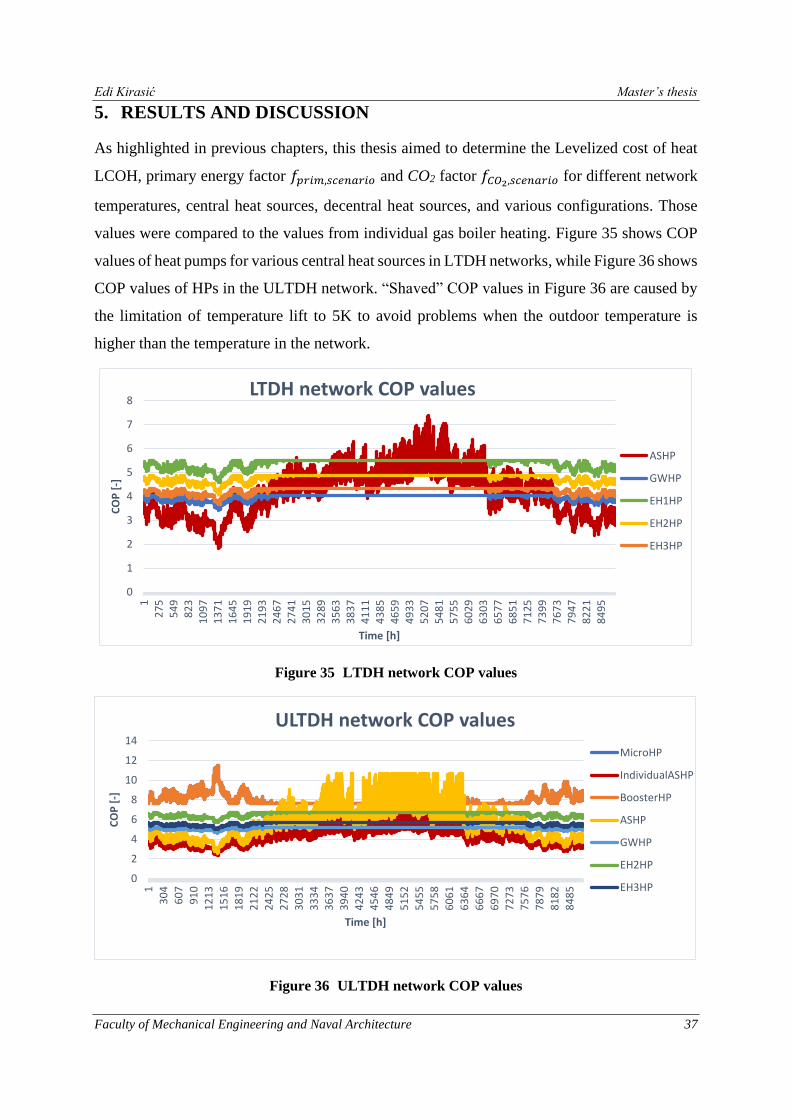
Edi Kirasić Master’s thesis
Faculty of Mechanical Engineering and Naval Architecture 37
5. RESULTS AND DISCUSSION
As highlighted in previous chapters, this thesis aimed to determine the Levelized cost of heat
LCOH, primary energy factor 𝑓𝑝𝑟𝑖𝑚,𝑠𝑐𝑒𝑛𝑎𝑟𝑖𝑜 and CO2 factor 𝑓𝐶𝑂2,𝑠𝑐𝑒𝑛𝑎𝑟𝑖𝑜 for different network
temperatures, central heat sources, decentral heat sources, and various configurations. Those
values were compared to the values from individual gas boiler heating. Figure 35 shows COP
values of heat pumps for various central heat sources in LTDH networks, while Figure 36 shows
COP values of HPs in the ULTDH network. “Shaved” COP values in Figure 36 are caused by
the limitation of temperature lift to 5K to avoid problems when the outdoor temperature is
higher than the temperature in the network.
Figure 35 LTDH network COP values
Figure 36 ULTDH network COP values
0
1
2
3
4
5
6
7
8
12
75
54
98
23
10
97
13
71
16
45
19
19
21
93
24
67
27
41
30
15
32
89
35
63
38
37
41
11
43
85
46
59
49
33
52
07
54
81
57
55
60
29
63
03
65
77
68
51
71
25
73
99
76
73
79
47
82
21
84
95
CO
P [
-]
Time [h]
LTDH network COP values
ASHP
GWHP
EH1HP
EH2HP
EH3HP
0
2
4
6
8
10
12
14
1
30
4
60
7
91
0
12
13
15
16
18
19
21
22
24
25
27
28
30
31
33
34
36
37
39
40
42
43
45
46
48
49
51
52
54
55
57
58
60
61
63
64
66
67
69
70
72
73
75
76
78
79
81
82
84
85
CO
P [
-]
Time [h]
ULTDH network COP values
MicroHP
IndividualASHP
BoosterHP
ASHP
GWHP
EH2HP
EH3HP

Edi Kirasić Master’s thesis
Faculty of Mechanical Engineering and Naval Architecture 38
5.1. Levelized cost of heat (LCOH)
The following charts compare LCOH values for different values of plot ratio and SH share.
LCOH for the space heating share of 0,1 (efficient buildings) and plot ratio 0,2 (rural area) is
shown in Figure 37. The red line represents the LCOH value of individual gas boiler heating of
75,06 €/MWh. The values above the line represent infeasible solutions compared to individual
gas heating. In a district with mentioned characteristics, all values are above the red line,
indicating infeasibility compared to individual gas boiler heating.
Figure 37 LCOH values for SH share=0,1 and plot ratio=0,2
The highest LCOH can be observed in the ULTDH_Micro_GWHP case due to the high
investment cost in the central heat pump and decentral heat pumps. In each subgroup, scenarios
with central GWHP have the highest LCOH values due to the high investment cost in a central
unit. The subgroup with the highest overall LCOH values is the ULTDH network with micro
heat pumps for DHW preparation at each apartment. The reason for that is the high investment
cost in decentral and central units and low heat demand. LTDH subgroup has lower LCOH
0
50
100
150
200
250
300
350
400
450
LCO
H [
€/M
Wh
]
Levilized cost of heat [LCOH] SH share=0,1 Plot ratio=0,2
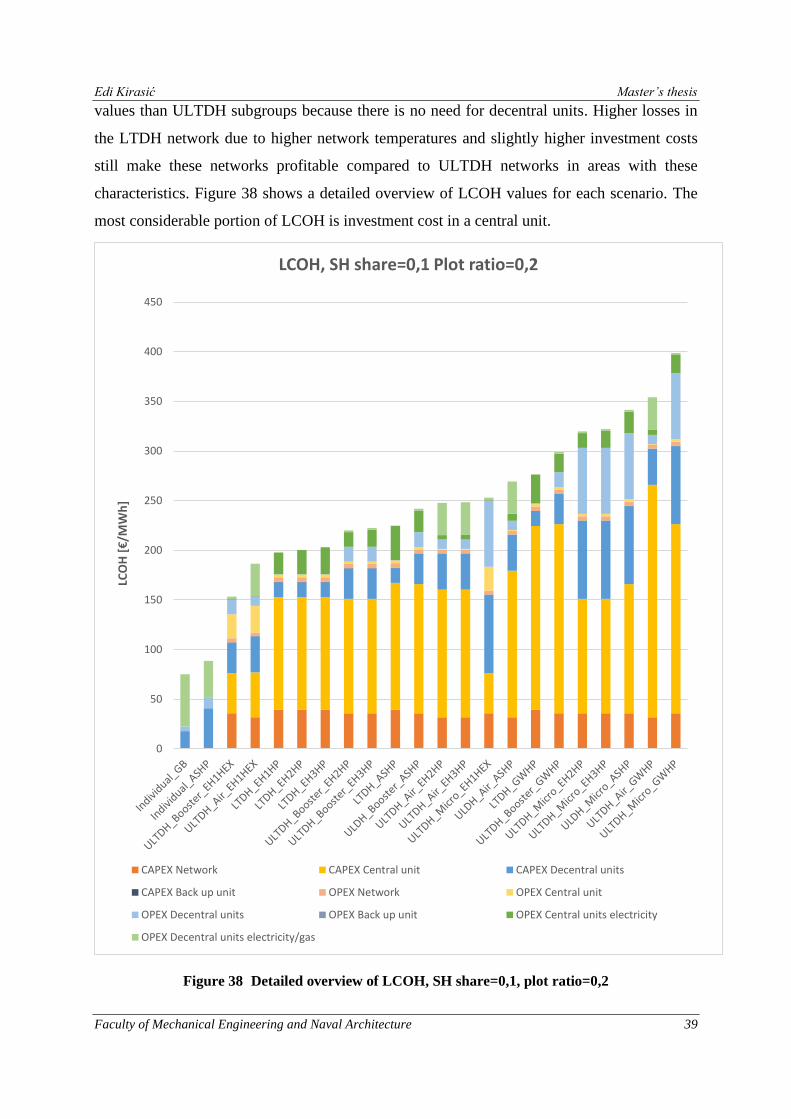
Edi Kirasić Master’s thesis
Faculty of Mechanical Engineering and Naval Architecture 39
values than ULTDH subgroups because there is no need for decentral units. Higher losses in
the LTDH network due to higher network temperatures and slightly higher investment costs
still make these networks profitable compared to ULTDH networks in areas with these
characteristics. Figure 38 shows a detailed overview of LCOH values for each scenario. The
most considerable portion of LCOH is investment cost in a central unit.
Figure 38 Detailed overview of LCOH, SH share=0,1, plot ratio=0,2
0
50
100
150
200
250
300
350
400
450
LCO
H [
€/M
Wh
]
LCOH, SH share=0,1 Plot ratio=0,2
CAPEX Network CAPEX Central unit CAPEX Decentral units
CAPEX Back up unit OPEX Network OPEX Central unit
OPEX Decentral units OPEX Back up unit OPEX Central units electricity
OPEX Decentral units electricity/gas
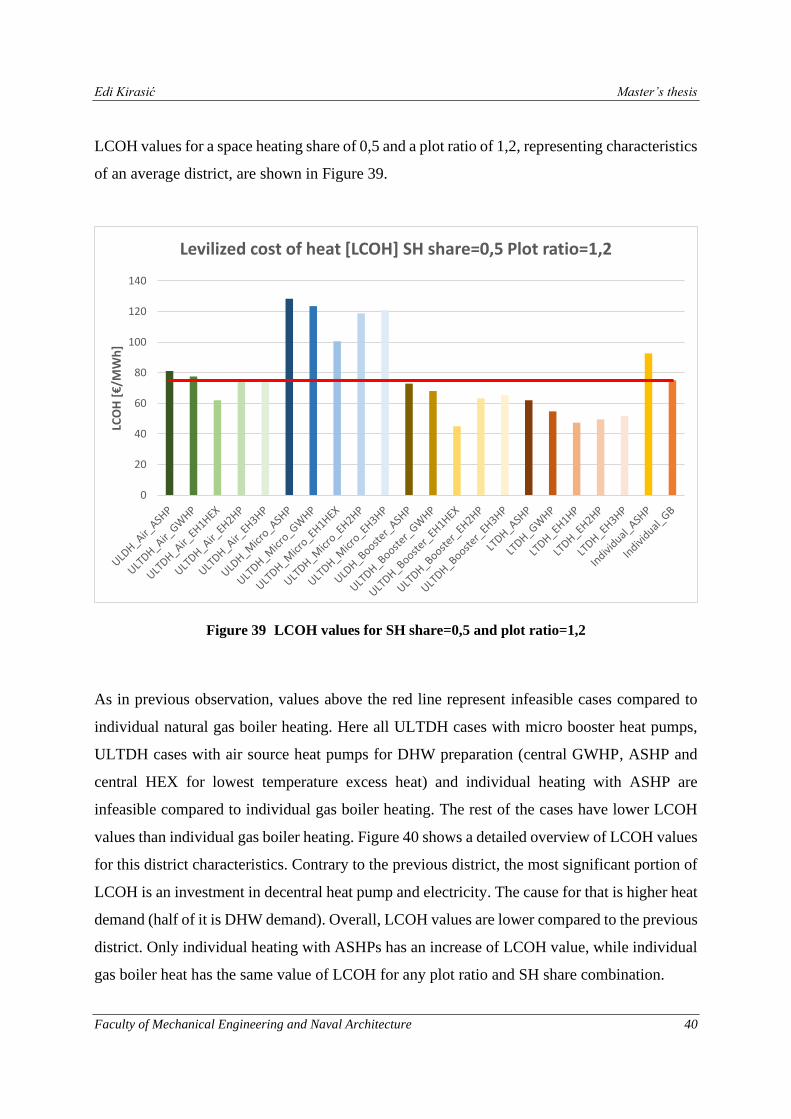
Edi Kirasić Master’s thesis
Faculty of Mechanical Engineering and Naval Architecture 40
LCOH values for a space heating share of 0,5 and a plot ratio of 1,2, representing characteristics
of an average district, are shown in Figure 39.
Figure 39 LCOH values for SH share=0,5 and plot ratio=1,2
As in previous observation, values above the red line represent infeasible cases compared to
individual natural gas boiler heating. Here all ULTDH cases with micro booster heat pumps,
ULTDH cases with air source heat pumps for DHW preparation (central GWHP, ASHP and
central HEX for lowest temperature excess heat) and individual heating with ASHP are
infeasible compared to individual gas boiler heating. The rest of the cases have lower LCOH
values than individual gas boiler heating. Figure 40 shows a detailed overview of LCOH values
for this district characteristics. Contrary to the previous district, the most significant portion of
LCOH is an investment in decentral heat pump and electricity. The cause for that is higher heat
demand (half of it is DHW demand). Overall, LCOH values are lower compared to the previous
district. Only individual heating with ASHPs has an increase of LCOH value, while individual
gas boiler heat has the same value of LCOH for any plot ratio and SH share combination.
0
20
40
60
80
100
120
140
LCO
H [
€/M
Wh
]
Levilized cost of heat [LCOH] SH share=0,5 Plot ratio=1,2

Edi Kirasić Master’s thesis
Faculty of Mechanical Engineering and Naval Architecture 41
Figure 40 Detailed overview of LCOH, SH share=0,5, plot ratio=1,2
LCOH for space heating share of 0,8 and plot ratio 2 (urban area) is shown in Figure 41. All
low and ultra-low temperature networks are below the LCOH value of individual gas boiler
heating. That is because high heat demand compensates for investment cost in ULTDH and
LTDH in districts such as this. Also, there is a lower need for DHW, which significantly reduces
the overall investment cost of a network.
0
20
40
60
80
100
120
140
LCO
H [
€/M
Wh
]
LCOH, SH share=0,5 Plot ratio=1,2
CAPEX Network CAPEX Central unit CAPEX Decentral units
CAPEX Back up unit OPEX Network OPEX Central unit
OPEX Decentral units OPEX Back up unit OPEX Central units electricity
OPEX Decentral units electricity/gas
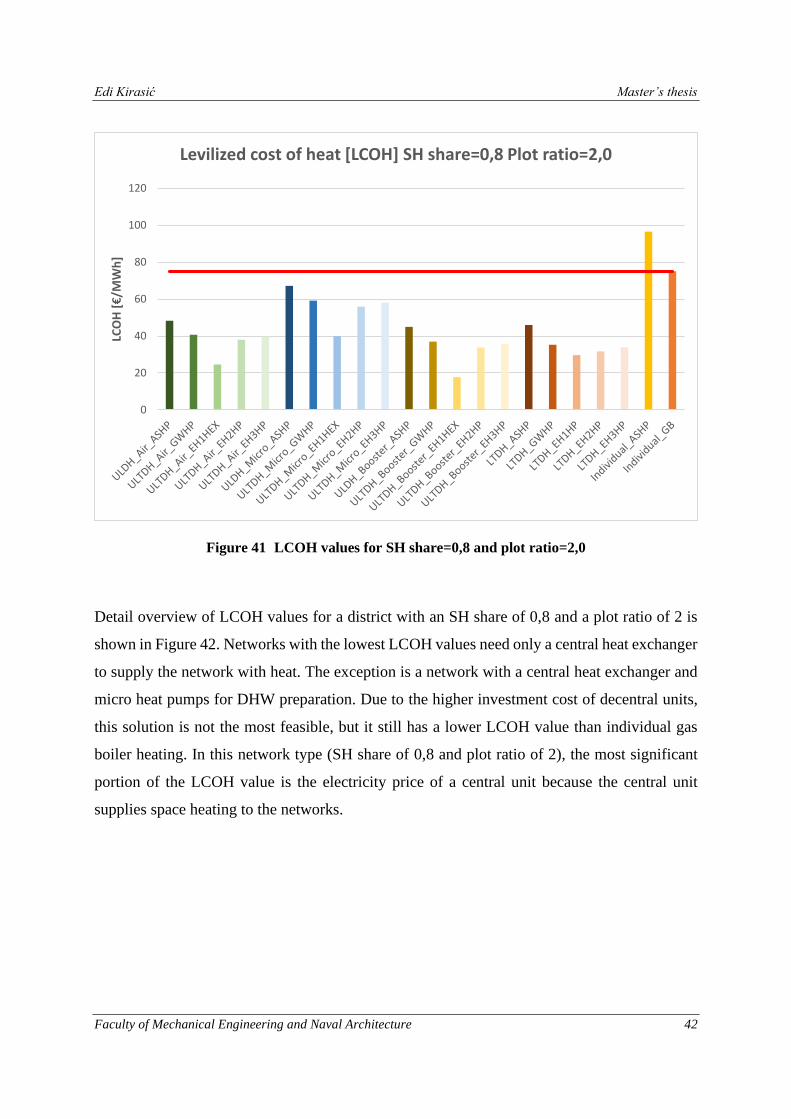
Edi Kirasić Master’s thesis
Faculty of Mechanical Engineering and Naval Architecture 42
Figure 41 LCOH values for SH share=0,8 and plot ratio=2,0
Detail overview of LCOH values for a district with an SH share of 0,8 and a plot ratio of 2 is
shown in Figure 42. Networks with the lowest LCOH values need only a central heat exchanger
to supply the network with heat. The exception is a network with a central heat exchanger and
micro heat pumps for DHW preparation. Due to the higher investment cost of decentral units,
this solution is not the most feasible, but it still has a lower LCOH value than individual gas
boiler heating. In this network type (SH share of 0,8 and plot ratio of 2), the most significant
portion of the LCOH value is the electricity price of a central unit because the central unit
supplies space heating to the networks.
0
20
40
60
80
100
120
LCO
H [
€/M
Wh
]
Levilized cost of heat [LCOH] SH share=0,8 Plot ratio=2,0
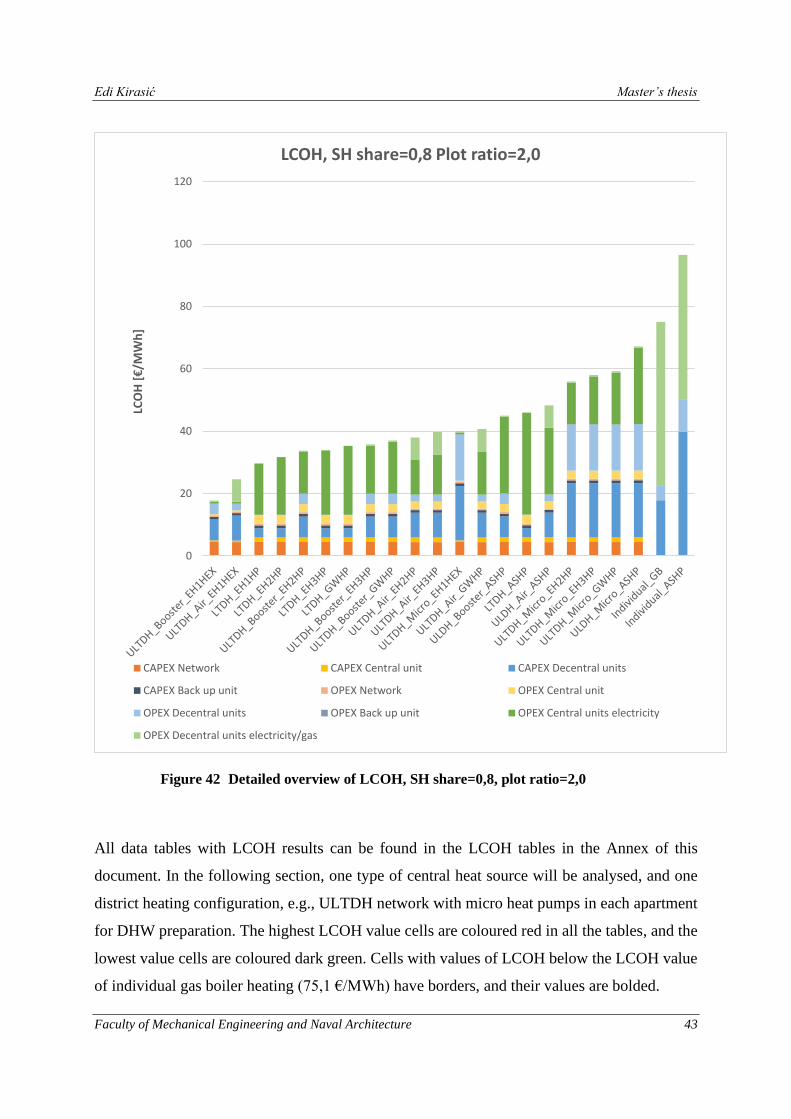
Edi Kirasić Master’s thesis
Faculty of Mechanical Engineering and Naval Architecture 43
Figure 42 Detailed overview of LCOH, SH share=0,8, plot ratio=2,0
All data tables with LCOH results can be found in the LCOH tables in the Annex of this
document. In the following section, one type of central heat source will be analysed, and one
district heating configuration, e.g., ULTDH network with micro heat pumps in each apartment
for DHW preparation. The highest LCOH value cells are coloured red in all the tables, and the
lowest value cells are coloured dark green. Cells with values of LCOH below the LCOH value
of individual gas boiler heating (75,1 €/MWh) have borders, and their values are bolded.
0
20
40
60
80
100
120
LCO
H [
€/M
Wh
]
LCOH, SH share=0,8 Plot ratio=2,0
CAPEX Network CAPEX Central unit CAPEX Decentral units
CAPEX Back up unit OPEX Network OPEX Central unit
OPEX Decentral units OPEX Back up unit OPEX Central units electricity
OPEX Decentral units electricity/gas

Edi Kirasić Master’s thesis
Faculty of Mechanical Engineering and Naval Architecture 44
Table 7 below shows the ULTDH network, with central ASHP, with micro heat pumps in each
apartment unit.
Table 7 LCOH-LTDH_Micro_ASHP
High investment cost in micro heat pumps makes this district heating solution infeasible
compared to individual natural gas heating for most plot ratio and space heating share
combinations. Only scenarios with a high space heating share of 0,8 and plot ratios of 0,8 and
above show feasibility compared to gas heating. The reason for that is increased overall heat
demand and lower investment in decentral units because DHW need is low compared to SH
need.
Table 8 below shows the ULTDH network, with central GWHP, with micro heat pumps in each
apartment unit. Compared to the previous case with central ASHP, the case with central GWHP
has higher LCOH for lower space heating shares and lower plot ratios (due to higher central
heat pump investment). However, as SH share increase, LCOH values start to drop faster than
those for central ASHP, and for SH ratios above 0,6, the GWHP scenario is more profitable and
ends with more feasible cases than ASHP. The reason for this can be the low efficiency of
ASHP due to frosting and other weather conditions, which increases needed electricity
consumption.
2,0 192,1 174,2 156,4 138,7 120,9 103,1 85,2 67,2
1,8 194,4 176,2 158,2 140,2 122,2 104,2 86,1 67,8
1,6 197,1 178,6 160,3 142,1 123,8 105,5 87,1 68,5
1,4 200,6 181,7 163,1 144,5 125,8 107,1 88,4 69,4
1,2 205,1 185,7 166,6 147,5 128,4 109,2 90,0 70,5
1,0 211,3 191,2 171,4 151,7 132,0 112,2 92,3 72,1
0,8 220,2 199,1 178,3 157,7 137,0 116,3 95,5 74,4
0,6 234,7 212,0 189,7 167,5 145,3 123,1 100,7 78,0
0,4 262,3 236,3 210,9 185,8 160,8 135,7 110,4 84,8
0,2 341,5 306,0 271,7 238,0 204,6 171,2 137,7 103,6
0,1 0,2 0,3 0,4 0,5 0,6 0,7 0,8
LCOH-ULTDH_Micro_ASHP [€/MWhh]
Plo
t ra
tio
[-]
Space heating share [-]

Edi Kirasić Master’s thesis
Faculty of Mechanical Engineering and Naval Architecture 45
Table 8 LCOH-ULTDH_Micro_GWHP
Table 9 shows the ULTDH network, with central HEX with excess heat at temperatures high
enough to not need the heat pump in a central location. Micro heat pumps are in each apartment
unit. This is an ideal scenario because it is hard to find an excess heat source with high enough
temperatures throughout the year (temperatures above 40°C). Compared to previous cases, this
case has lower LCOH values throughout the entire table. However, lower electricity
consumption cannot make up for the high investment costs in micro heat pumps, and thus
LCOH values for low space heating shares and low plot ratios are still higher than those for
individual gas boiler heating. This case is profitable for every plot ratio value with a space
heating share of 0,8, and most of the plot ratios with a space heating share of 0,7. In these cases,
investment in decentral heat pumps for DHW preparation is lower.
2,0 191,2 171,9 153,0 134,2 115,5 96,8 78,0 59,2
1,8 193,8 174,2 155,0 135,9 116,9 97,9 78,9 59,8
1,6 197,0 176,9 157,3 137,9 118,6 99,2 79,9 60,5
1,4 201,2 180,6 160,5 140,6 120,8 101,0 81,3 61,4
1,2 206,5 185,2 164,5 143,9 123,6 103,3 83,0 62,6
1,0 214,2 191,8 170,1 148,7 127,5 106,5 85,4 64,2
0,8 225,4 201,5 178,4 155,7 133,3 111,0 88,8 66,6
0,6 244,3 217,7 192,2 167,3 142,9 118,6 94,5 70,4
0,4 281,8 249,8 219,5 190,1 161,5 133,4 105,5 77,8
0,2 398,7 349,1 303,2 259,7 218,0 177,5 138,1 99,3
0,1 0,2 0,3 0,4 0,5 0,6 0,7 0,8
Space heating share [-]
LCOH-ULTDH_Micro_GWHP [€/MWhh]
Plo
t ra
tio
[-]
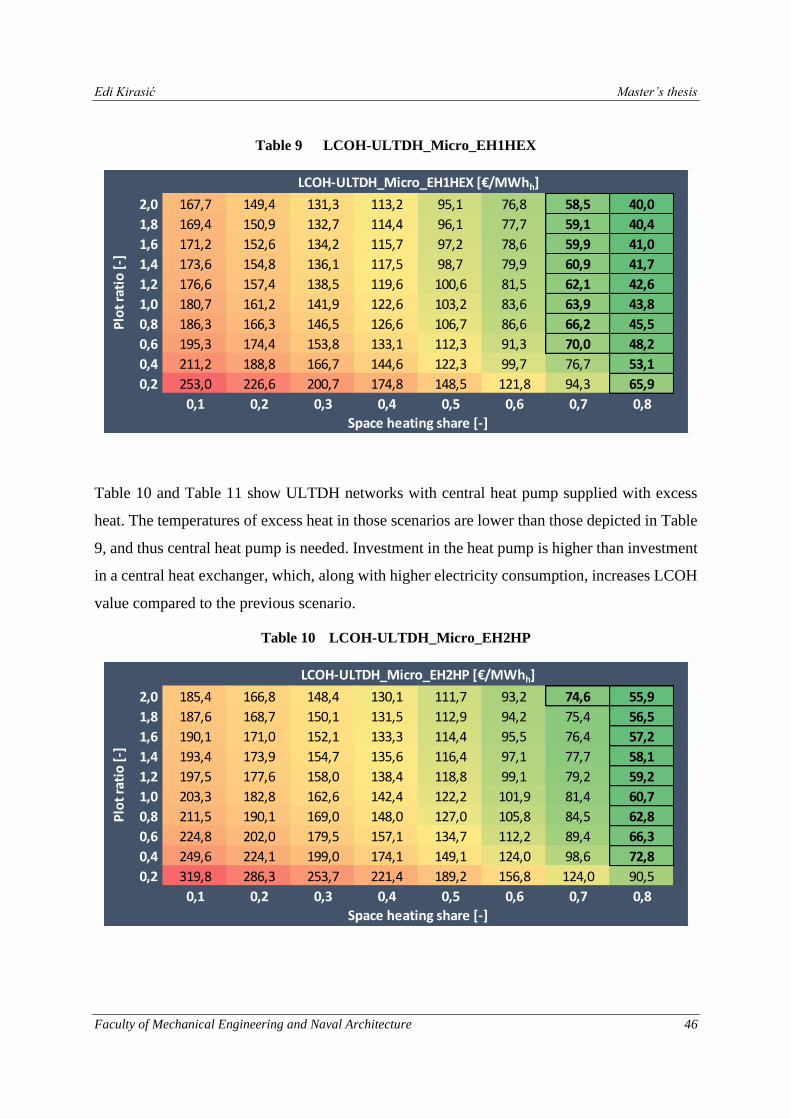
Edi Kirasić Master’s thesis
Faculty of Mechanical Engineering and Naval Architecture 46
Table 9 LCOH-ULTDH_Micro_EH1HEX
Table 10 and Table 11 show ULTDH networks with central heat pump supplied with excess
heat. The temperatures of excess heat in those scenarios are lower than those depicted in Table
9, and thus central heat pump is needed. Investment in the heat pump is higher than investment
in a central heat exchanger, which, along with higher electricity consumption, increases LCOH
value compared to the previous scenario.
Table 10 LCOH-ULTDH_Micro_EH2HP
2,0 167,7 149,4 131,3 113,2 95,1 76,8 58,5 40,0
1,8 169,4 150,9 132,7 114,4 96,1 77,7 59,1 40,4
1,6 171,2 152,6 134,2 115,7 97,2 78,6 59,9 41,0
1,4 173,6 154,8 136,1 117,5 98,7 79,9 60,9 41,7
1,2 176,6 157,4 138,5 119,6 100,6 81,5 62,1 42,6
1,0 180,7 161,2 141,9 122,6 103,2 83,6 63,9 43,8
0,8 186,3 166,3 146,5 126,6 106,7 86,6 66,2 45,5
0,6 195,3 174,4 153,8 133,1 112,3 91,3 70,0 48,2
0,4 211,2 188,8 166,7 144,6 122,3 99,7 76,7 53,1
0,2 253,0 226,6 200,7 174,8 148,5 121,8 94,3 65,9
0,1 0,2 0,3 0,4 0,5 0,6 0,7 0,8
Space heating share [-]
LCOH-ULTDH_Micro_EH1HEX [€/MWhh]
Plo
t ra
tio
[-]
2,0 185,4 166,8 148,4 130,1 111,7 93,2 74,6 55,9
1,8 187,6 168,7 150,1 131,5 112,9 94,2 75,4 56,5
1,6 190,1 171,0 152,1 133,3 114,4 95,5 76,4 57,2
1,4 193,4 173,9 154,7 135,6 116,4 97,1 77,7 58,1
1,2 197,5 177,6 158,0 138,4 118,8 99,1 79,2 59,2
1,0 203,3 182,8 162,6 142,4 122,2 101,9 81,4 60,7
0,8 211,5 190,1 169,0 148,0 127,0 105,8 84,5 62,8
0,6 224,8 202,0 179,5 157,1 134,7 112,2 89,4 66,3
0,4 249,6 224,1 199,0 174,1 149,1 124,0 98,6 72,8
0,2 319,8 286,3 253,7 221,4 189,2 156,8 124,0 90,5
0,1 0,2 0,3 0,4 0,5 0,6 0,7 0,8
Plo
t ra
tio
[-]
Space heating share [-]
LCOH-ULTDH_Micro_EH2HP [€/MWhh]
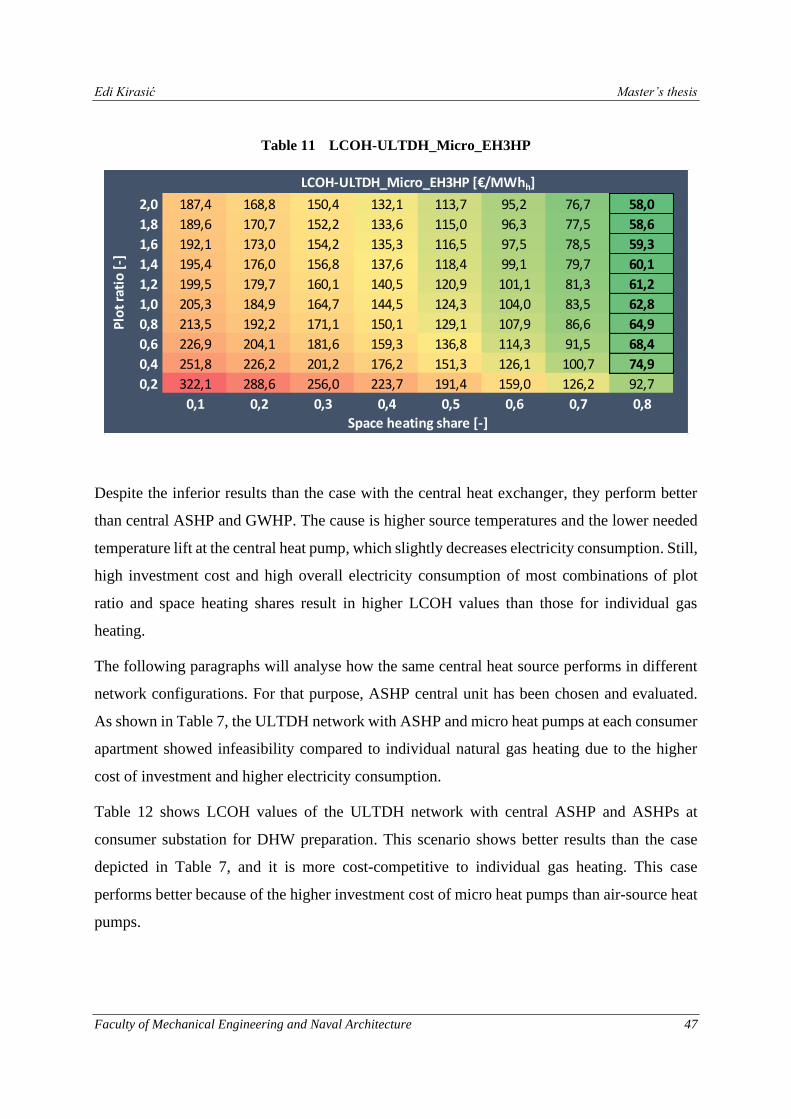
Edi Kirasić Master’s thesis
Faculty of Mechanical Engineering and Naval Architecture 47
Table 11 LCOH-ULTDH_Micro_EH3HP
Despite the inferior results than the case with the central heat exchanger, they perform better
than central ASHP and GWHP. The cause is higher source temperatures and the lower needed
temperature lift at the central heat pump, which slightly decreases electricity consumption. Still,
high investment cost and high overall electricity consumption of most combinations of plot
ratio and space heating shares result in higher LCOH values than those for individual gas
heating.
The following paragraphs will analyse how the same central heat source performs in different
network configurations. For that purpose, ASHP central unit has been chosen and evaluated.
As shown in Table 7, the ULTDH network with ASHP and micro heat pumps at each consumer
apartment showed infeasibility compared to individual natural gas heating due to the higher
cost of investment and higher electricity consumption.
Table 12 shows LCOH values of the ULTDH network with central ASHP and ASHPs at
consumer substation for DHW preparation. This scenario shows better results than the case
depicted in Table 7, and it is more cost-competitive to individual gas heating. This case
performs better because of the higher investment cost of micro heat pumps than air-source heat
pumps.
2,0 187,4 168,8 150,4 132,1 113,7 95,2 76,7 58,0
1,8 189,6 170,7 152,2 133,6 115,0 96,3 77,5 58,6
1,6 192,1 173,0 154,2 135,3 116,5 97,5 78,5 59,3
1,4 195,4 176,0 156,8 137,6 118,4 99,1 79,7 60,1
1,2 199,5 179,7 160,1 140,5 120,9 101,1 81,3 61,2
1,0 205,3 184,9 164,7 144,5 124,3 104,0 83,5 62,8
0,8 213,5 192,2 171,1 150,1 129,1 107,9 86,6 64,9
0,6 226,9 204,1 181,6 159,3 136,8 114,3 91,5 68,4
0,4 251,8 226,2 201,2 176,2 151,3 126,1 100,7 74,9
0,2 322,1 288,6 256,0 223,7 191,4 159,0 126,2 92,7
0,1 0,2 0,3 0,4 0,5 0,6 0,7 0,8
Space heating share [-]
Plo
t ra
tio
[-]
LCOH-ULTDH_Micro_EH3HP [€/MWhh]
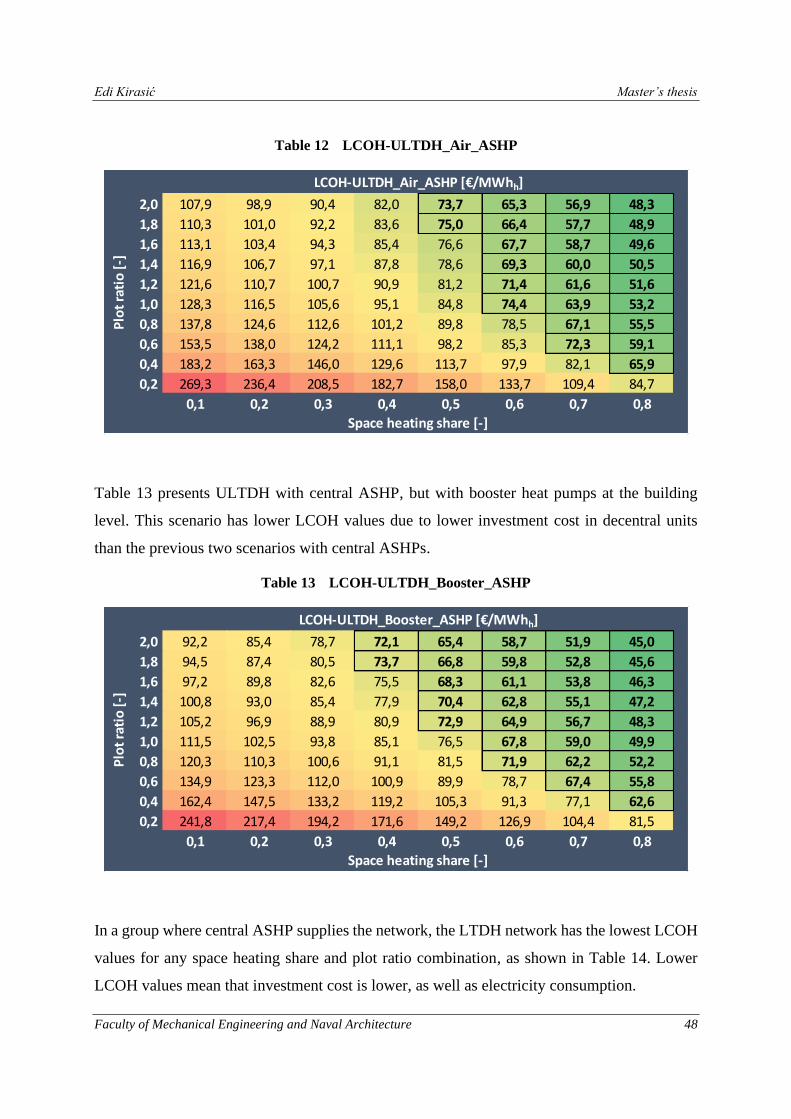
Edi Kirasić Master’s thesis
Faculty of Mechanical Engineering and Naval Architecture 48
Table 12 LCOH-ULTDH_Air_ASHP
Table 13 presents ULTDH with central ASHP, but with booster heat pumps at the building
level. This scenario has lower LCOH values due to lower investment cost in decentral units
than the previous two scenarios with central ASHPs.
Table 13 LCOH-ULTDH_Booster_ASHP
In a group where central ASHP supplies the network, the LTDH network has the lowest LCOH
values for any space heating share and plot ratio combination, as shown in Table 14. Lower
LCOH values mean that investment cost is lower, as well as electricity consumption.
2,0 107,9 98,9 90,4 82,0 73,7 65,3 56,9 48,3
1,8 110,3 101,0 92,2 83,6 75,0 66,4 57,7 48,9
1,6 113,1 103,4 94,3 85,4 76,6 67,7 58,7 49,6
1,4 116,9 106,7 97,1 87,8 78,6 69,3 60,0 50,5
1,2 121,6 110,7 100,7 90,9 81,2 71,4 61,6 51,6
1,0 128,3 116,5 105,6 95,1 84,8 74,4 63,9 53,2
0,8 137,8 124,6 112,6 101,2 89,8 78,5 67,1 55,5
0,6 153,5 138,0 124,2 111,1 98,2 85,3 72,3 59,1
0,4 183,2 163,3 146,0 129,6 113,7 97,9 82,1 65,9
0,2 269,3 236,4 208,5 182,7 158,0 133,7 109,4 84,7
0,1 0,2 0,3 0,4 0,5 0,6 0,7 0,8
LCOH-ULTDH_Air_ASHP [€/MWhh]
Space heating share [-]
Plo
t ra
tio
[-]
2,0 92,2 85,4 78,7 72,1 65,4 58,7 51,9 45,0
1,8 94,5 87,4 80,5 73,7 66,8 59,8 52,8 45,6
1,6 97,2 89,8 82,6 75,5 68,3 61,1 53,8 46,3
1,4 100,8 93,0 85,4 77,9 70,4 62,8 55,1 47,2
1,2 105,2 96,9 88,9 80,9 72,9 64,9 56,7 48,3
1,0 111,5 102,5 93,8 85,1 76,5 67,8 59,0 49,9
0,8 120,3 110,3 100,6 91,1 81,5 71,9 62,2 52,2
0,6 134,9 123,3 112,0 100,9 89,9 78,7 67,4 55,8
0,4 162,4 147,5 133,2 119,2 105,3 91,3 77,1 62,6
0,2 241,8 217,4 194,2 171,6 149,2 126,9 104,4 81,5
0,1 0,2 0,3 0,4 0,5 0,6 0,7 0,8
Space heating share [-]
LCOH-ULTDH_Booster_ASHP [€/MWhh]
Plo
t ra
tio
[-]
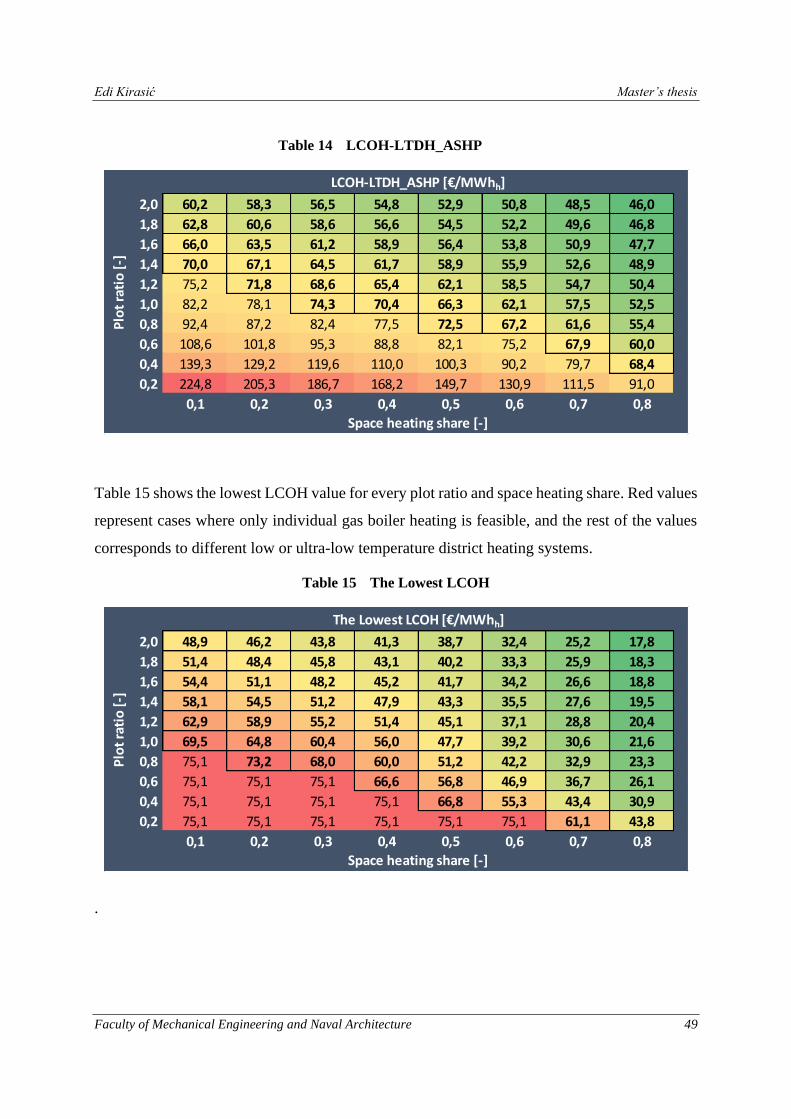
Edi Kirasić Master’s thesis
Faculty of Mechanical Engineering and Naval Architecture 49
Table 14 LCOH-LTDH_ASHP
Table 15 shows the lowest LCOH value for every plot ratio and space heating share. Red values
represent cases where only individual gas boiler heating is feasible, and the rest of the values
corresponds to different low or ultra-low temperature district heating systems.
Table 15 The Lowest LCOH
.
2,0 60,2 58,3 56,5 54,8 52,9 50,8 48,5 46,0
1,8 62,8 60,6 58,6 56,6 54,5 52,2 49,6 46,8
1,6 66,0 63,5 61,2 58,9 56,4 53,8 50,9 47,7
1,4 70,0 67,1 64,5 61,7 58,9 55,9 52,6 48,9
1,2 75,2 71,8 68,6 65,4 62,1 58,5 54,7 50,4
1,0 82,2 78,1 74,3 70,4 66,3 62,1 57,5 52,5
0,8 92,4 87,2 82,4 77,5 72,5 67,2 61,6 55,4
0,6 108,6 101,8 95,3 88,8 82,1 75,2 67,9 60,0
0,4 139,3 129,2 119,6 110,0 100,3 90,2 79,7 68,4
0,2 224,8 205,3 186,7 168,2 149,7 130,9 111,5 91,0
0,1 0,2 0,3 0,4 0,5 0,6 0,7 0,8
Space heating share [-]
Plo
t ra
tio
[-]
LCOH-LTDH_ASHP [€/MWhh]
2,0 48,9 46,2 43,8 41,3 38,7 32,4 25,2 17,8
1,8 51,4 48,4 45,8 43,1 40,2 33,3 25,9 18,3
1,6 54,4 51,1 48,2 45,2 41,7 34,2 26,6 18,8
1,4 58,1 54,5 51,2 47,9 43,3 35,5 27,6 19,5
1,2 62,9 58,9 55,2 51,4 45,1 37,1 28,8 20,4
1,0 69,5 64,8 60,4 56,0 47,7 39,2 30,6 21,6
0,8 75,1 73,2 68,0 60,0 51,2 42,2 32,9 23,3
0,6 75,1 75,1 75,1 66,6 56,8 46,9 36,7 26,1
0,4 75,1 75,1 75,1 75,1 66,8 55,3 43,4 30,9
0,2 75,1 75,1 75,1 75,1 75,1 75,1 61,1 43,8
0,1 0,2 0,3 0,4 0,5 0,6 0,7 0,8
Space heating share [-]
Plo
t ra
tio
[-]
The Lowest LCOH [€/MWhh]
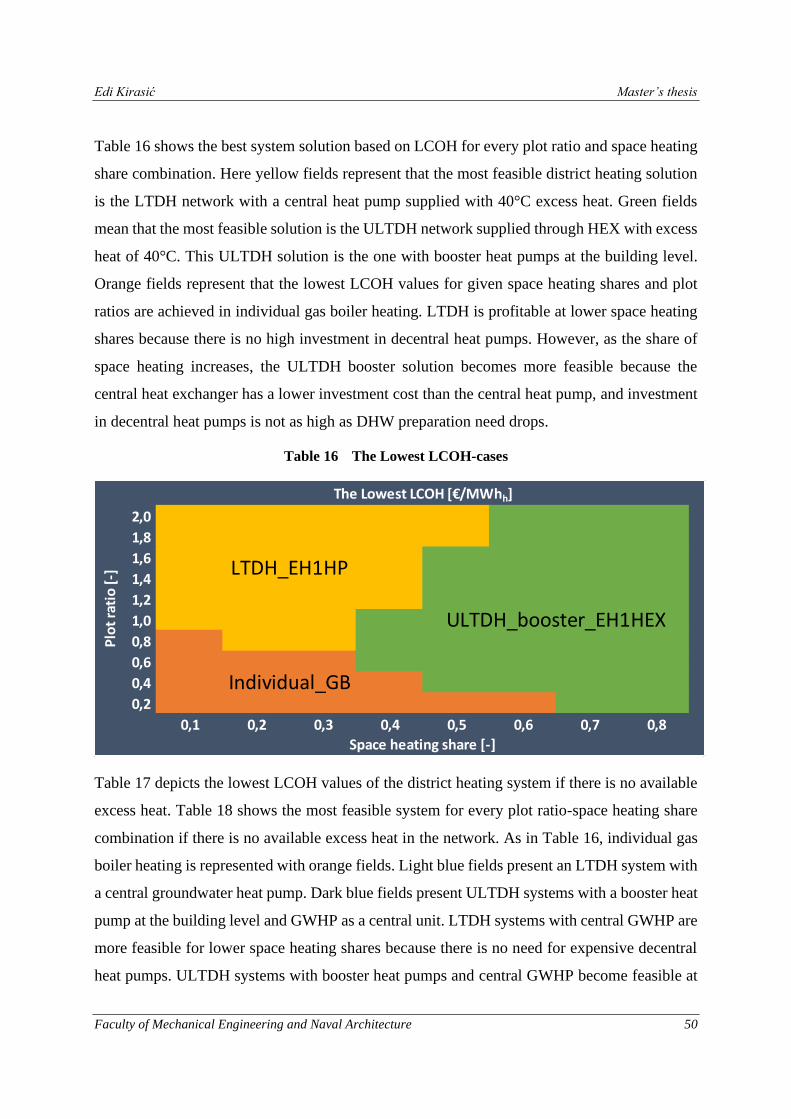
Edi Kirasić Master’s thesis
Faculty of Mechanical Engineering and Naval Architecture 50
Table 16 shows the best system solution based on LCOH for every plot ratio and space heating
share combination. Here yellow fields represent that the most feasible district heating solution
is the LTDH network with a central heat pump supplied with 40°C excess heat. Green fields
mean that the most feasible solution is the ULTDH network supplied through HEX with excess
heat of 40°C. This ULTDH solution is the one with booster heat pumps at the building level.
Orange fields represent that the lowest LCOH values for given space heating shares and plot
ratios are achieved in individual gas boiler heating. LTDH is profitable at lower space heating
shares because there is no high investment in decentral heat pumps. However, as the share of
space heating increases, the ULTDH booster solution becomes more feasible because the
central heat exchanger has a lower investment cost than the central heat pump, and investment
in decentral heat pumps is not as high as DHW preparation need drops.
Table 16 The Lowest LCOH-cases
Table 17 depicts the lowest LCOH values of the district heating system if there is no available
excess heat. Table 18 shows the most feasible system for every plot ratio-space heating share
combination if there is no available excess heat in the network. As in Table 16, individual gas
boiler heating is represented with orange fields. Light blue fields present an LTDH system with
a central groundwater heat pump. Dark blue fields present ULTDH systems with a booster heat
pump at the building level and GWHP as a central unit. LTDH systems with central GWHP are
more feasible for lower space heating shares because there is no need for expensive decentral
heat pumps. ULTDH systems with booster heat pumps and central GWHP become feasible at
2,0
1,8
1,6
1,4
1,2
1,0
0,8
0,6
0,4
0,2
0,1 0,2 0,3 0,4 0,5 0,6 0,7 0,8
The Lowest LCOH [€/MWhh]
Plo
t ra
tio
[-]
Space heating share [-]
ULTDH_booster_EH1HEX
Individual_GB
LTDH_EH1HP
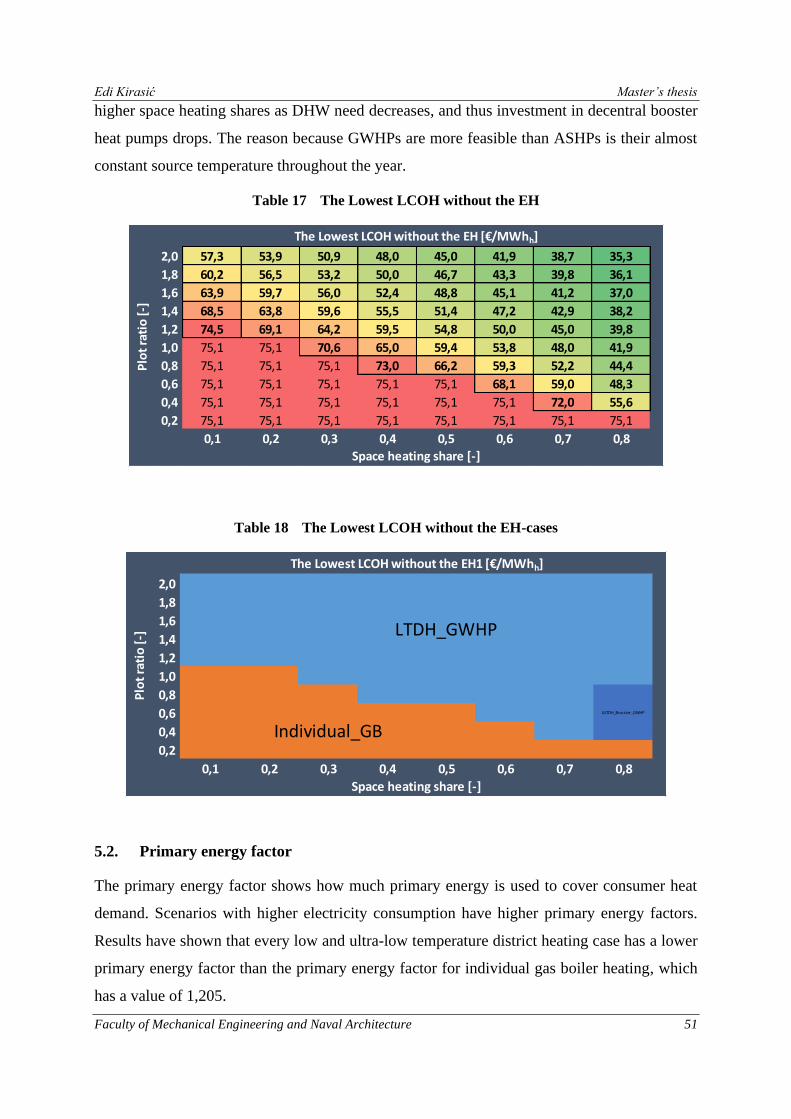
Edi Kirasić Master’s thesis
Faculty of Mechanical Engineering and Naval Architecture 51
higher space heating shares as DHW need decreases, and thus investment in decentral booster
heat pumps drops. The reason because GWHPs are more feasible than ASHPs is their almost
constant source temperature throughout the year.
Table 17 The Lowest LCOH without the EH
Table 18 The Lowest LCOH without the EH-cases
5.2. Primary energy factor
The primary energy factor shows how much primary energy is used to cover consumer heat
demand. Scenarios with higher electricity consumption have higher primary energy factors.
Results have shown that every low and ultra-low temperature district heating case has a lower
primary energy factor than the primary energy factor for individual gas boiler heating, which
has a value of 1,205.
2,0 57,3 53,9 50,9 48,0 45,0 41,9 38,7 35,3
1,8 60,2 56,5 53,2 50,0 46,7 43,3 39,8 36,1
1,6 63,9 59,7 56,0 52,4 48,8 45,1 41,2 37,0
1,4 68,5 63,8 59,6 55,5 51,4 47,2 42,9 38,2
1,2 74,5 69,1 64,2 59,5 54,8 50,0 45,0 39,8
1,0 75,1 75,1 70,6 65,0 59,4 53,8 48,0 41,9
0,8 75,1 75,1 75,1 73,0 66,2 59,3 52,2 44,4
0,6 75,1 75,1 75,1 75,1 75,1 68,1 59,0 48,3
0,4 75,1 75,1 75,1 75,1 75,1 75,1 72,0 55,6
0,2 75,1 75,1 75,1 75,1 75,1 75,1 75,1 75,1
0,1 0,2 0,3 0,4 0,5 0,6 0,7 0,8
Plo
t ra
tio
[-]
Space heating share [-]
The Lowest LCOH without the EH [€/MWhh]
2,0
1,8
1,6
1,4
1,2
1,0
0,8
0,6
0,4
0,2
0,1 0,2 0,3 0,4 0,5 0,6 0,7 0,8
The Lowest LCOH without the EH1 [€/MWhh]
Plo
t ra
tio
[-]
Space heating share [-]
LTDH_GWHP
Individual_GBULTDH_Booster_GWHP
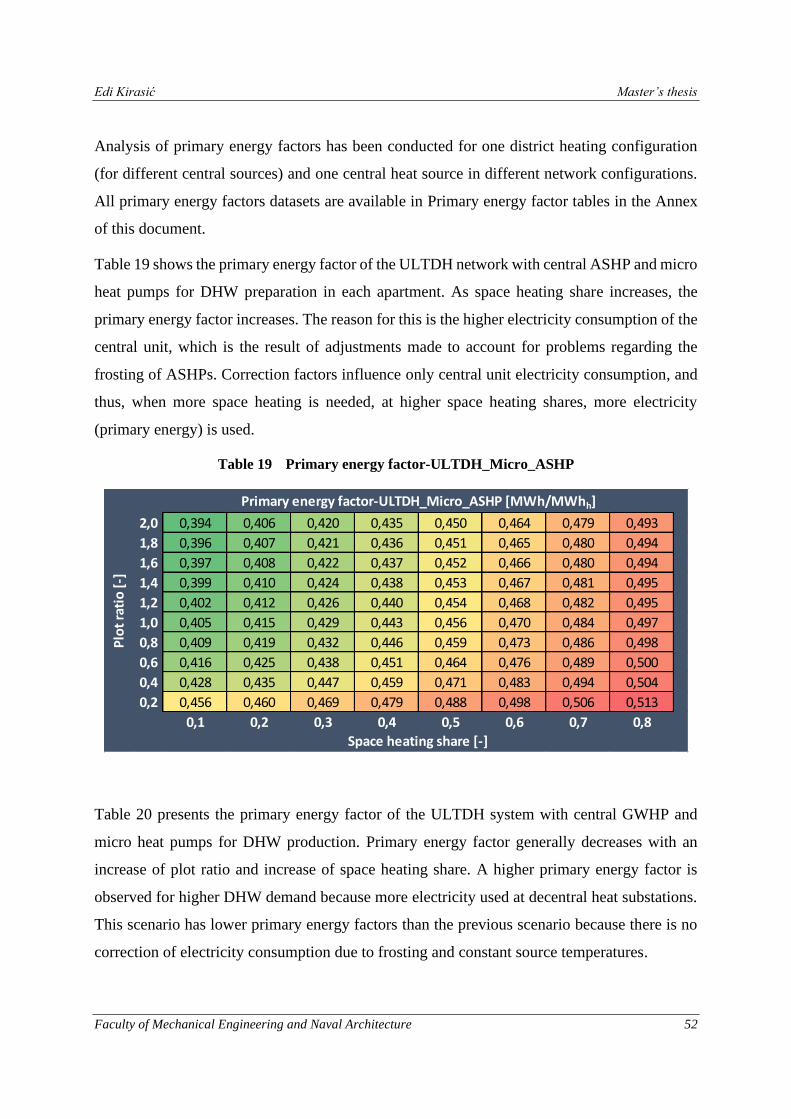
Edi Kirasić Master’s thesis
Faculty of Mechanical Engineering and Naval Architecture 52
Analysis of primary energy factors has been conducted for one district heating configuration
(for different central sources) and one central heat source in different network configurations.
All primary energy factors datasets are available in Primary energy factor tables in the Annex
of this document.
Table 19 shows the primary energy factor of the ULTDH network with central ASHP and micro
heat pumps for DHW preparation in each apartment. As space heating share increases, the
primary energy factor increases. The reason for this is the higher electricity consumption of the
central unit, which is the result of adjustments made to account for problems regarding the
frosting of ASHPs. Correction factors influence only central unit electricity consumption, and
thus, when more space heating is needed, at higher space heating shares, more electricity
(primary energy) is used.
Table 19 Primary energy factor-ULTDH_Micro_ASHP
Table 20 presents the primary energy factor of the ULTDH system with central GWHP and
micro heat pumps for DHW production. Primary energy factor generally decreases with an
increase of plot ratio and increase of space heating share. A higher primary energy factor is
observed for higher DHW demand because more electricity used at decentral heat substations.
This scenario has lower primary energy factors than the previous scenario because there is no
correction of electricity consumption due to frosting and constant source temperatures.
2,0 0,394 0,406 0,420 0,435 0,450 0,464 0,479 0,493
1,8 0,396 0,407 0,421 0,436 0,451 0,465 0,480 0,494
1,6 0,397 0,408 0,422 0,437 0,452 0,466 0,480 0,494
1,4 0,399 0,410 0,424 0,438 0,453 0,467 0,481 0,495
1,2 0,402 0,412 0,426 0,440 0,454 0,468 0,482 0,495
1,0 0,405 0,415 0,429 0,443 0,456 0,470 0,484 0,497
0,8 0,409 0,419 0,432 0,446 0,459 0,473 0,486 0,498
0,6 0,416 0,425 0,438 0,451 0,464 0,476 0,489 0,500
0,4 0,428 0,435 0,447 0,459 0,471 0,483 0,494 0,504
0,2 0,456 0,460 0,469 0,479 0,488 0,498 0,506 0,513
0,1 0,2 0,3 0,4 0,5 0,6 0,7 0,8
Space heating share [-]
Plo
t ra
tio
[-]
Primary energy factor-ULTDH_Micro_ASHP [MWh/MWhh]

Edi Kirasić Master’s thesis
Faculty of Mechanical Engineering and Naval Architecture 53
Table 20 Primary energy factor-ULTDH_Micro_GWHP
Table 21 shows the primary energy factor for the ULTDH system with a central heat exchanger
(40°C excess heat) and micro heat pumps for DHW production. As space heating share
increases, the primary energy factor decreases because there is less need for electricity as
domestic hot water needs decrease and the central unit does not require electricity to operate.
In this ULTDH subgroup, this case has the lowest overall primary energy factor.
Table 21 Primary energy factor-ULTDH_Micro_EH1HEX
2,0 0,337 0,334 0,334 0,334 0,335 0,335 0,335 0,335
1,8 0,339 0,335 0,334 0,335 0,335 0,336 0,336 0,336
1,6 0,340 0,336 0,336 0,336 0,336 0,336 0,336 0,336
1,4 0,342 0,337 0,337 0,337 0,337 0,337 0,337 0,337
1,2 0,344 0,339 0,339 0,338 0,338 0,338 0,338 0,337
1,0 0,347 0,342 0,341 0,340 0,340 0,340 0,339 0,338
0,8 0,351 0,345 0,344 0,343 0,343 0,342 0,341 0,339
0,6 0,356 0,350 0,348 0,347 0,346 0,345 0,343 0,341
0,4 0,367 0,359 0,356 0,354 0,352 0,350 0,348 0,344
0,2 0,391 0,380 0,375 0,371 0,367 0,363 0,358 0,352
0,1 0,2 0,3 0,4 0,5 0,6 0,7 0,8
Space heating share [-]
Plo
t ra
tio
[-]
Primary energy factor-ULTDH_Micro_GWHP [MWh/MWhh]
2,0 0,041 0,032 0,029 0,026 0,024 0,021 0,019 0,017
1,8 0,041 0,032 0,029 0,026 0,024 0,021 0,019 0,017
1,6 0,041 0,032 0,029 0,026 0,024 0,021 0,019 0,016
1,4 0,041 0,032 0,029 0,026 0,024 0,021 0,019 0,016
1,2 0,041 0,032 0,029 0,026 0,024 0,021 0,019 0,016
1,0 0,041 0,032 0,029 0,026 0,023 0,021 0,018 0,016
0,8 0,041 0,032 0,029 0,026 0,023 0,021 0,018 0,016
0,6 0,042 0,032 0,028 0,026 0,023 0,021 0,018 0,016
0,4 0,043 0,032 0,028 0,026 0,023 0,020 0,018 0,015
0,2 0,045 0,033 0,028 0,026 0,023 0,020 0,018 0,015
0,1 0,2 0,3 0,4 0,5 0,6 0,7 0,8
Space heating share [-]
Plo
t ra
tio
[-]
Primary energy factor-ULTDH_Micro_EH1HEX [MWh/MWhh]
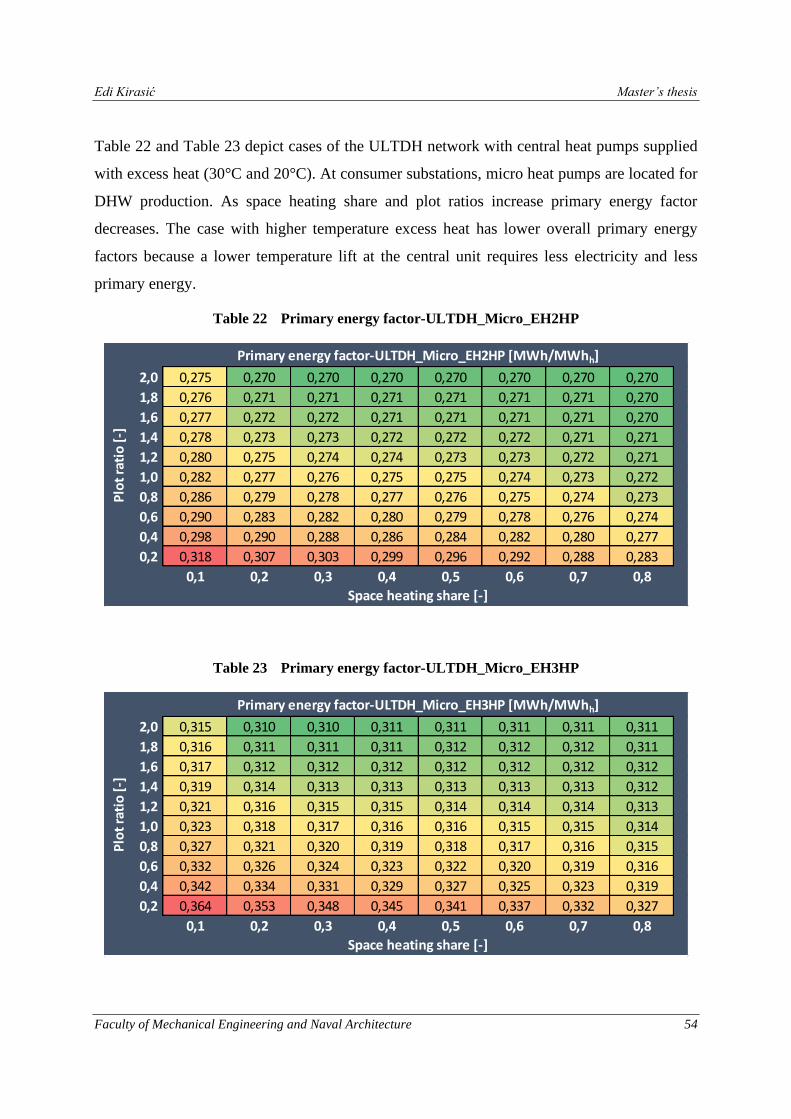
Edi Kirasić Master’s thesis
Faculty of Mechanical Engineering and Naval Architecture 54
Table 22 and Table 23 depict cases of the ULTDH network with central heat pumps supplied
with excess heat (30°C and 20°C). At consumer substations, micro heat pumps are located for
DHW production. As space heating share and plot ratios increase primary energy factor
decreases. The case with higher temperature excess heat has lower overall primary energy
factors because a lower temperature lift at the central unit requires less electricity and less
primary energy.
Table 22 Primary energy factor-ULTDH_Micro_EH2HP
Table 23 Primary energy factor-ULTDH_Micro_EH3HP
2,0 0,275 0,270 0,270 0,270 0,270 0,270 0,270 0,270
1,8 0,276 0,271 0,271 0,271 0,271 0,271 0,271 0,270
1,6 0,277 0,272 0,272 0,271 0,271 0,271 0,271 0,270
1,4 0,278 0,273 0,273 0,272 0,272 0,272 0,271 0,271
1,2 0,280 0,275 0,274 0,274 0,273 0,273 0,272 0,271
1,0 0,282 0,277 0,276 0,275 0,275 0,274 0,273 0,272
0,8 0,286 0,279 0,278 0,277 0,276 0,275 0,274 0,273
0,6 0,290 0,283 0,282 0,280 0,279 0,278 0,276 0,274
0,4 0,298 0,290 0,288 0,286 0,284 0,282 0,280 0,277
0,2 0,318 0,307 0,303 0,299 0,296 0,292 0,288 0,283
0,1 0,2 0,3 0,4 0,5 0,6 0,7 0,8
Space heating share [-]
Plo
t ra
tio
[-]
Primary energy factor-ULTDH_Micro_EH2HP [MWh/MWhh]
2,0 0,315 0,310 0,310 0,311 0,311 0,311 0,311 0,311
1,8 0,316 0,311 0,311 0,311 0,312 0,312 0,312 0,311
1,6 0,317 0,312 0,312 0,312 0,312 0,312 0,312 0,312
1,4 0,319 0,314 0,313 0,313 0,313 0,313 0,313 0,312
1,2 0,321 0,316 0,315 0,315 0,314 0,314 0,314 0,313
1,0 0,323 0,318 0,317 0,316 0,316 0,315 0,315 0,314
0,8 0,327 0,321 0,320 0,319 0,318 0,317 0,316 0,315
0,6 0,332 0,326 0,324 0,323 0,322 0,320 0,319 0,316
0,4 0,342 0,334 0,331 0,329 0,327 0,325 0,323 0,319
0,2 0,364 0,353 0,348 0,345 0,341 0,337 0,332 0,327
0,1 0,2 0,3 0,4 0,5 0,6 0,7 0,8
Space heating share [-]
Plo
t ra
tio
[-]
Primary energy factor-ULTDH_Micro_EH3HP [MWh/MWhh]
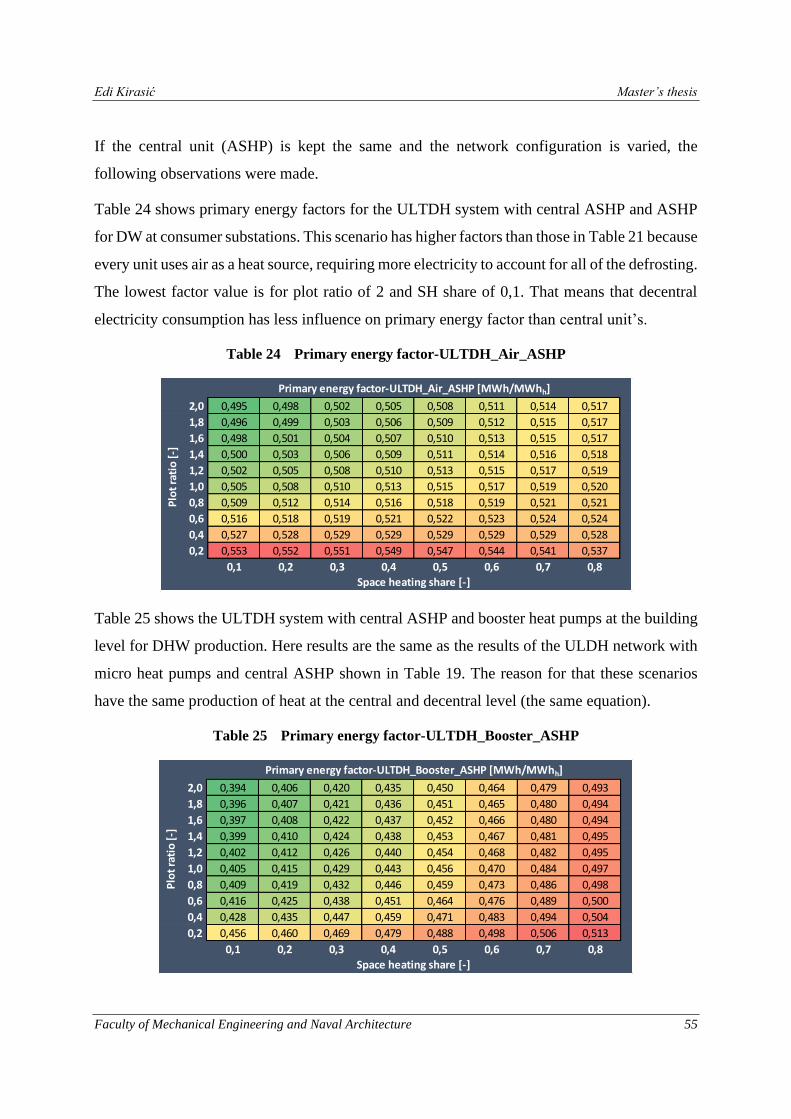
Edi Kirasić Master’s thesis
Faculty of Mechanical Engineering and Naval Architecture 55
If the central unit (ASHP) is kept the same and the network configuration is varied, the
following observations were made.
Table 24 shows primary energy factors for the ULTDH system with central ASHP and ASHP
for DW at consumer substations. This scenario has higher factors than those in Table 21 because
every unit uses air as a heat source, requiring more electricity to account for all of the defrosting.
The lowest factor value is for plot ratio of 2 and SH share of 0,1. That means that decentral
electricity consumption has less influence on primary energy factor than central unit’s.
Table 24 Primary energy factor-ULTDH_Air_ASHP
Table 25 shows the ULTDH system with central ASHP and booster heat pumps at the building
level for DHW production. Here results are the same as the results of the ULDH network with
micro heat pumps and central ASHP shown in Table 19. The reason for that these scenarios
have the same production of heat at the central and decentral level (the same equation).
Table 25 Primary energy factor-ULTDH_Booster_ASHP
2,0 0,495 0,498 0,502 0,505 0,508 0,511 0,514 0,517
1,8 0,496 0,499 0,503 0,506 0,509 0,512 0,515 0,517
1,6 0,498 0,501 0,504 0,507 0,510 0,513 0,515 0,517
1,4 0,500 0,503 0,506 0,509 0,511 0,514 0,516 0,518
1,2 0,502 0,505 0,508 0,510 0,513 0,515 0,517 0,519
1,0 0,505 0,508 0,510 0,513 0,515 0,517 0,519 0,520
0,8 0,509 0,512 0,514 0,516 0,518 0,519 0,521 0,521
0,6 0,516 0,518 0,519 0,521 0,522 0,523 0,524 0,524
0,4 0,527 0,528 0,529 0,529 0,529 0,529 0,529 0,528
0,2 0,553 0,552 0,551 0,549 0,547 0,544 0,541 0,537
0,1 0,2 0,3 0,4 0,5 0,6 0,7 0,8
Space heating share [-]
Primary energy factor-ULTDH_Air_ASHP [MWh/MWhh]
Plo
t ra
tio
[-]
2,0 0,394 0,406 0,420 0,435 0,450 0,464 0,479 0,493
1,8 0,396 0,407 0,421 0,436 0,451 0,465 0,480 0,494
1,6 0,397 0,408 0,422 0,437 0,452 0,466 0,480 0,494
1,4 0,399 0,410 0,424 0,438 0,453 0,467 0,481 0,495
1,2 0,402 0,412 0,426 0,440 0,454 0,468 0,482 0,495
1,0 0,405 0,415 0,429 0,443 0,456 0,470 0,484 0,497
0,8 0,409 0,419 0,432 0,446 0,459 0,473 0,486 0,498
0,6 0,416 0,425 0,438 0,451 0,464 0,476 0,489 0,500
0,4 0,428 0,435 0,447 0,459 0,471 0,483 0,494 0,504
0,2 0,456 0,460 0,469 0,479 0,488 0,498 0,506 0,513
0,1 0,2 0,3 0,4 0,5 0,6 0,7 0,8
Space heating share [-]
Plo
t ra
tio
[-]
Primary energy factor-ULTDH_Booster_ASHP [MWh/MWhh]
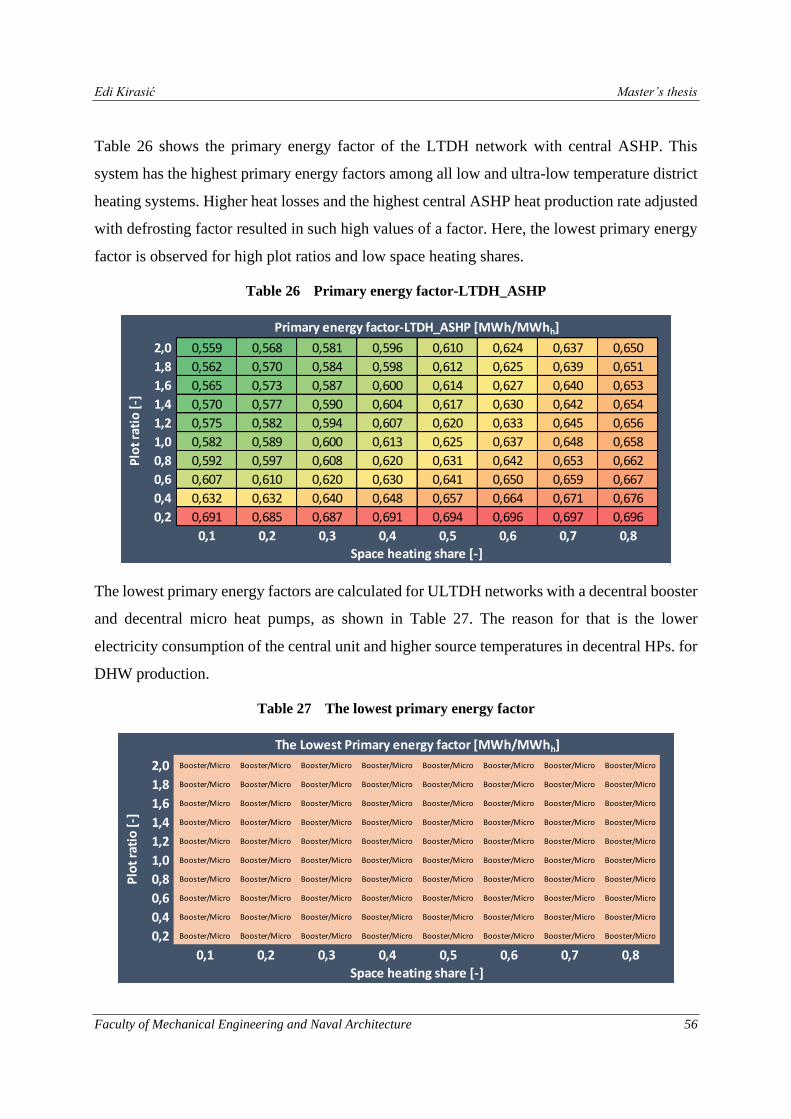
Edi Kirasić Master’s thesis
Faculty of Mechanical Engineering and Naval Architecture 56
Table 26 shows the primary energy factor of the LTDH network with central ASHP. This
system has the highest primary energy factors among all low and ultra-low temperature district
heating systems. Higher heat losses and the highest central ASHP heat production rate adjusted
with defrosting factor resulted in such high values of a factor. Here, the lowest primary energy
factor is observed for high plot ratios and low space heating shares.
Table 26 Primary energy factor-LTDH_ASHP
The lowest primary energy factors are calculated for ULTDH networks with a decentral booster
and decentral micro heat pumps, as shown in Table 27. The reason for that is the lower
electricity consumption of the central unit and higher source temperatures in decentral HPs. for
DHW production.
Table 27 The lowest primary energy factor
2,0 0,559 0,568 0,581 0,596 0,610 0,624 0,637 0,650
1,8 0,562 0,570 0,584 0,598 0,612 0,625 0,639 0,651
1,6 0,565 0,573 0,587 0,600 0,614 0,627 0,640 0,653
1,4 0,570 0,577 0,590 0,604 0,617 0,630 0,642 0,654
1,2 0,575 0,582 0,594 0,607 0,620 0,633 0,645 0,656
1,0 0,582 0,589 0,600 0,613 0,625 0,637 0,648 0,658
0,8 0,592 0,597 0,608 0,620 0,631 0,642 0,653 0,662
0,6 0,607 0,610 0,620 0,630 0,641 0,650 0,659 0,667
0,4 0,632 0,632 0,640 0,648 0,657 0,664 0,671 0,676
0,2 0,691 0,685 0,687 0,691 0,694 0,696 0,697 0,696
0,1 0,2 0,3 0,4 0,5 0,6 0,7 0,8
Plo
t ra
tio
[-]
Space heating share [-]
Primary energy factor-LTDH_ASHP [MWh/MWhh]
2,0 Booster/Micro Booster/Micro Booster/Micro Booster/Micro Booster/Micro Booster/Micro Booster/Micro Booster/Micro
1,8 Booster/Micro Booster/Micro Booster/Micro Booster/Micro Booster/Micro Booster/Micro Booster/Micro Booster/Micro
1,6 Booster/Micro Booster/Micro Booster/Micro Booster/Micro Booster/Micro Booster/Micro Booster/Micro Booster/Micro
1,4 Booster/Micro Booster/Micro Booster/Micro Booster/Micro Booster/Micro Booster/Micro Booster/Micro Booster/Micro
1,2 Booster/Micro Booster/Micro Booster/Micro Booster/Micro Booster/Micro Booster/Micro Booster/Micro Booster/Micro
1,0 Booster/Micro Booster/Micro Booster/Micro Booster/Micro Booster/Micro Booster/Micro Booster/Micro Booster/Micro
0,8 Booster/Micro Booster/Micro Booster/Micro Booster/Micro Booster/Micro Booster/Micro Booster/Micro Booster/Micro
0,6 Booster/Micro Booster/Micro Booster/Micro Booster/Micro Booster/Micro Booster/Micro Booster/Micro Booster/Micro
0,4 Booster/Micro Booster/Micro Booster/Micro Booster/Micro Booster/Micro Booster/Micro Booster/Micro Booster/Micro
0,2 Booster/Micro Booster/Micro Booster/Micro Booster/Micro Booster/Micro Booster/Micro Booster/Micro Booster/Micro
0,1 0,2 0,3 0,4 0,5 0,6 0,7 0,8
The Lowest Primary energy factor [MWh/MWhh]
Plo
t ra
tio
[-]
Space heating share [-]
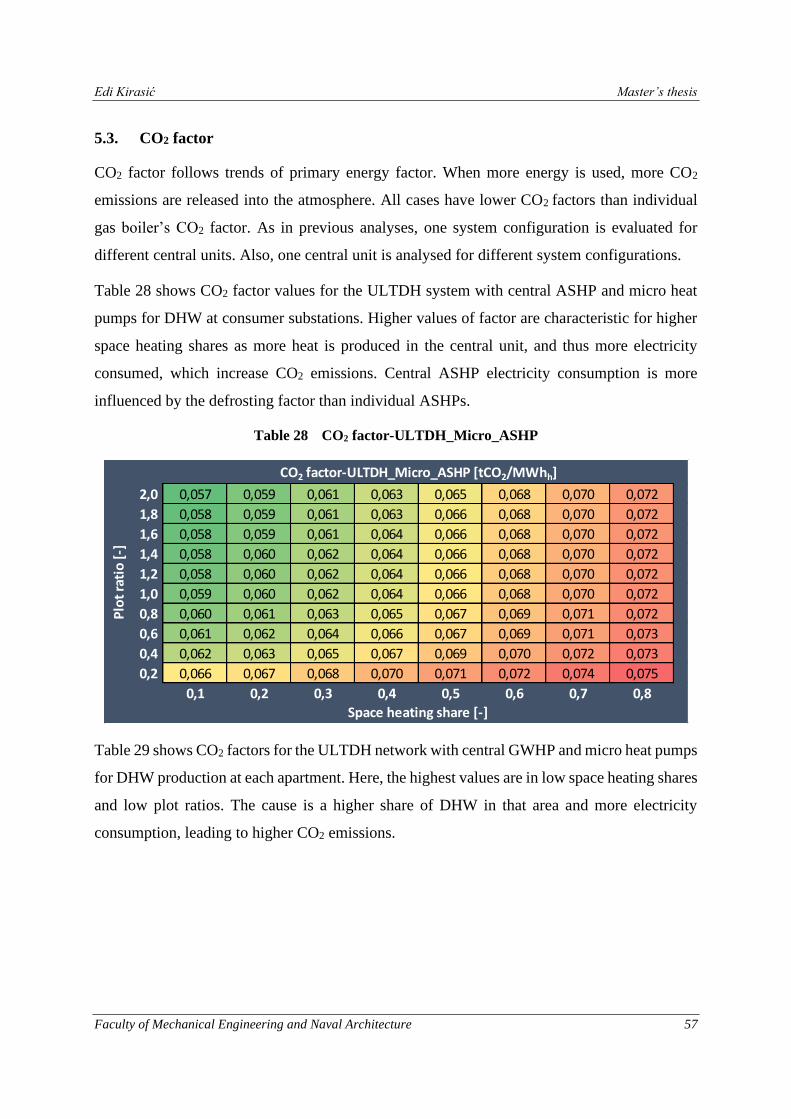
Edi Kirasić Master’s thesis
Faculty of Mechanical Engineering and Naval Architecture 57
5.3. CO2 factor
CO2 factor follows trends of primary energy factor. When more energy is used, more CO2
emissions are released into the atmosphere. All cases have lower CO2 factors than individual
gas boiler’s CO2 factor. As in previous analyses, one system configuration is evaluated for
different central units. Also, one central unit is analysed for different system configurations.
Table 28 shows CO2 factor values for the ULTDH system with central ASHP and micro heat
pumps for DHW at consumer substations. Higher values of factor are characteristic for higher
space heating shares as more heat is produced in the central unit, and thus more electricity
consumed, which increase CO2 emissions. Central ASHP electricity consumption is more
influenced by the defrosting factor than individual ASHPs.
Table 28 CO2 factor-ULTDH_Micro_ASHP
Table 29 shows CO2 factors for the ULTDH network with central GWHP and micro heat pumps
for DHW production at each apartment. Here, the highest values are in low space heating shares
and low plot ratios. The cause is a higher share of DHW in that area and more electricity
consumption, leading to higher CO2 emissions.
2,0 0,057 0,059 0,061 0,063 0,065 0,068 0,070 0,072
1,8 0,058 0,059 0,061 0,063 0,066 0,068 0,070 0,072
1,6 0,058 0,059 0,061 0,064 0,066 0,068 0,070 0,072
1,4 0,058 0,060 0,062 0,064 0,066 0,068 0,070 0,072
1,2 0,058 0,060 0,062 0,064 0,066 0,068 0,070 0,072
1,0 0,059 0,060 0,062 0,064 0,066 0,068 0,070 0,072
0,8 0,060 0,061 0,063 0,065 0,067 0,069 0,071 0,072
0,6 0,061 0,062 0,064 0,066 0,067 0,069 0,071 0,073
0,4 0,062 0,063 0,065 0,067 0,069 0,070 0,072 0,073
0,2 0,066 0,067 0,068 0,070 0,071 0,072 0,074 0,075
0,1 0,2 0,3 0,4 0,5 0,6 0,7 0,8
Space heating share [-]
Plo
t ra
tio
[-]
CO2 factor-ULTDH_Micro_ASHP [tCO2/MWhh]

Edi Kirasić Master’s thesis
Faculty of Mechanical Engineering and Naval Architecture 58
Table 29 CO2 factor-ULTDH_Micro_GWHP
Table 30 depicts CO2 factors for the ULTDH network with micro heat pumps for DHW
preparation and central HEX with excess heat as a heat source. Here, as SH share increases CO2
factor decreases because less electricity is needed for DHW production.
Table 30 CO2 factor-ULTDH_Micro_EH1HEX
2,0 0,049 0,049 0,049 0,049 0,049 0,049 0,049 0,049
1,8 0,049 0,049 0,049 0,049 0,049 0,049 0,049 0,049
1,6 0,049 0,049 0,049 0,049 0,049 0,049 0,049 0,049
1,4 0,050 0,049 0,049 0,049 0,049 0,049 0,049 0,049
1,2 0,050 0,049 0,049 0,049 0,049 0,049 0,049 0,049
1,0 0,050 0,050 0,050 0,050 0,049 0,049 0,049 0,049
0,8 0,051 0,050 0,050 0,050 0,050 0,050 0,050 0,049
0,6 0,052 0,051 0,051 0,051 0,050 0,050 0,050 0,050
0,4 0,053 0,052 0,052 0,052 0,051 0,051 0,051 0,050
0,2 0,057 0,055 0,055 0,054 0,053 0,053 0,052 0,051
0,1 0,2 0,3 0,4 0,5 0,6 0,7 0,8
Space heating share [-]
Plo
t ra
tio
[-]
CO2 factor-ULTDH_Micro_GWHP [tCO2/MWhh]
2,0 0,006 0,005 0,004 0,004 0,003 0,003 0,003 0,002
1,8 0,006 0,005 0,004 0,004 0,003 0,003 0,003 0,002
1,6 0,006 0,005 0,004 0,004 0,003 0,003 0,003 0,002
1,4 0,006 0,005 0,004 0,004 0,003 0,003 0,003 0,002
1,2 0,006 0,005 0,004 0,004 0,003 0,003 0,003 0,002
1,0 0,006 0,005 0,004 0,004 0,003 0,003 0,003 0,002
0,8 0,006 0,005 0,004 0,004 0,003 0,003 0,003 0,002
0,6 0,006 0,005 0,004 0,004 0,003 0,003 0,003 0,002
0,4 0,006 0,005 0,004 0,004 0,003 0,003 0,003 0,002
0,2 0,007 0,005 0,004 0,004 0,003 0,003 0,003 0,002
0,1 0,2 0,3 0,4 0,5 0,6 0,7 0,8
Space heating share [-]
Plo
t ra
tio
[-]
CO2 factor-ULTDH_Micro_EH1HEX [tCO2/MWhh]
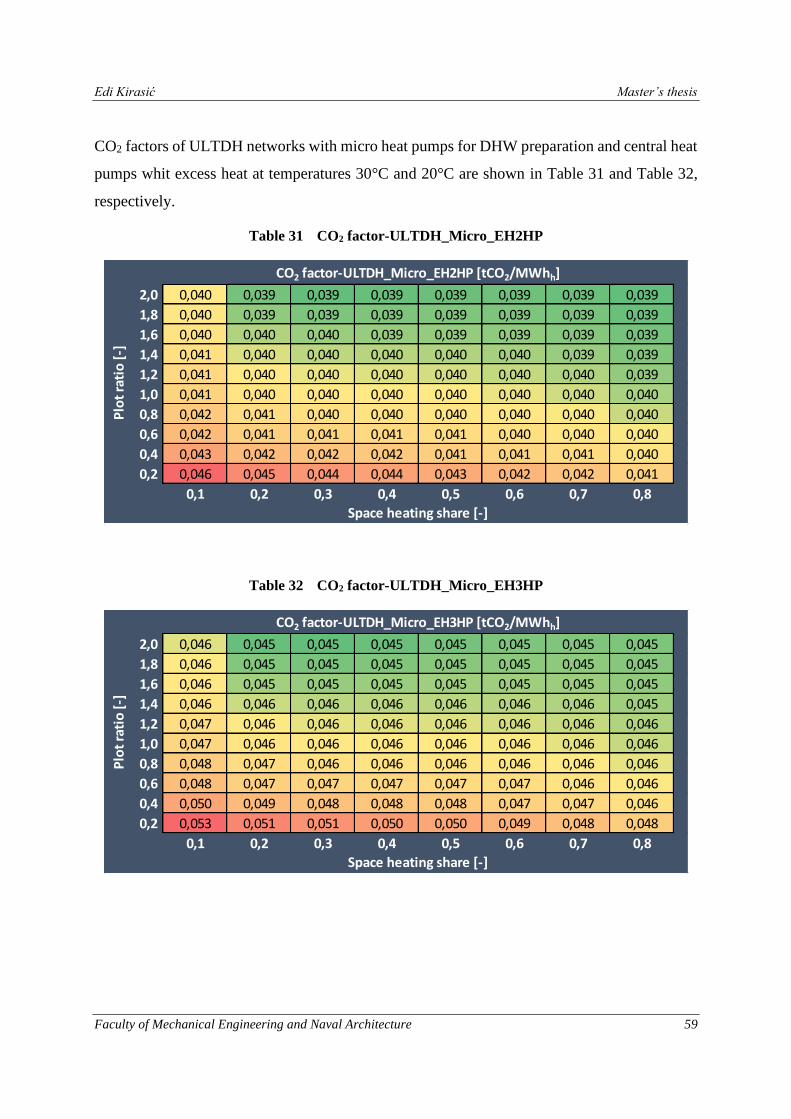
Edi Kirasić Master’s thesis
Faculty of Mechanical Engineering and Naval Architecture 59
CO2 factors of ULTDH networks with micro heat pumps for DHW preparation and central heat
pumps whit excess heat at temperatures 30°C and 20°C are shown in Table 31 and Table 32,
respectively.
Table 31 CO2 factor-ULTDH_Micro_EH2HP
Table 32 CO2 factor-ULTDH_Micro_EH3HP
2,0 0,040 0,039 0,039 0,039 0,039 0,039 0,039 0,039
1,8 0,040 0,039 0,039 0,039 0,039 0,039 0,039 0,039
1,6 0,040 0,040 0,040 0,039 0,039 0,039 0,039 0,039
1,4 0,041 0,040 0,040 0,040 0,040 0,040 0,039 0,039
1,2 0,041 0,040 0,040 0,040 0,040 0,040 0,040 0,039
1,0 0,041 0,040 0,040 0,040 0,040 0,040 0,040 0,040
0,8 0,042 0,041 0,040 0,040 0,040 0,040 0,040 0,040
0,6 0,042 0,041 0,041 0,041 0,041 0,040 0,040 0,040
0,4 0,043 0,042 0,042 0,042 0,041 0,041 0,041 0,040
0,2 0,046 0,045 0,044 0,044 0,043 0,042 0,042 0,041
0,1 0,2 0,3 0,4 0,5 0,6 0,7 0,8
Space heating share [-]
Plo
t ra
tio
[-]
CO2 factor-ULTDH_Micro_EH2HP [tCO2/MWhh]
2,0 0,046 0,045 0,045 0,045 0,045 0,045 0,045 0,045
1,8 0,046 0,045 0,045 0,045 0,045 0,045 0,045 0,045
1,6 0,046 0,045 0,045 0,045 0,045 0,045 0,045 0,045
1,4 0,046 0,046 0,046 0,046 0,046 0,046 0,046 0,045
1,2 0,047 0,046 0,046 0,046 0,046 0,046 0,046 0,046
1,0 0,047 0,046 0,046 0,046 0,046 0,046 0,046 0,046
0,8 0,048 0,047 0,046 0,046 0,046 0,046 0,046 0,046
0,6 0,048 0,047 0,047 0,047 0,047 0,047 0,046 0,046
0,4 0,050 0,049 0,048 0,048 0,048 0,047 0,047 0,046
0,2 0,053 0,051 0,051 0,050 0,050 0,049 0,048 0,048
0,1 0,2 0,3 0,4 0,5 0,6 0,7 0,8
Space heating share [-]
Plo
t ra
tio
[-]
CO2 factor-ULTDH_Micro_EH3HP [tCO2/MWhh]
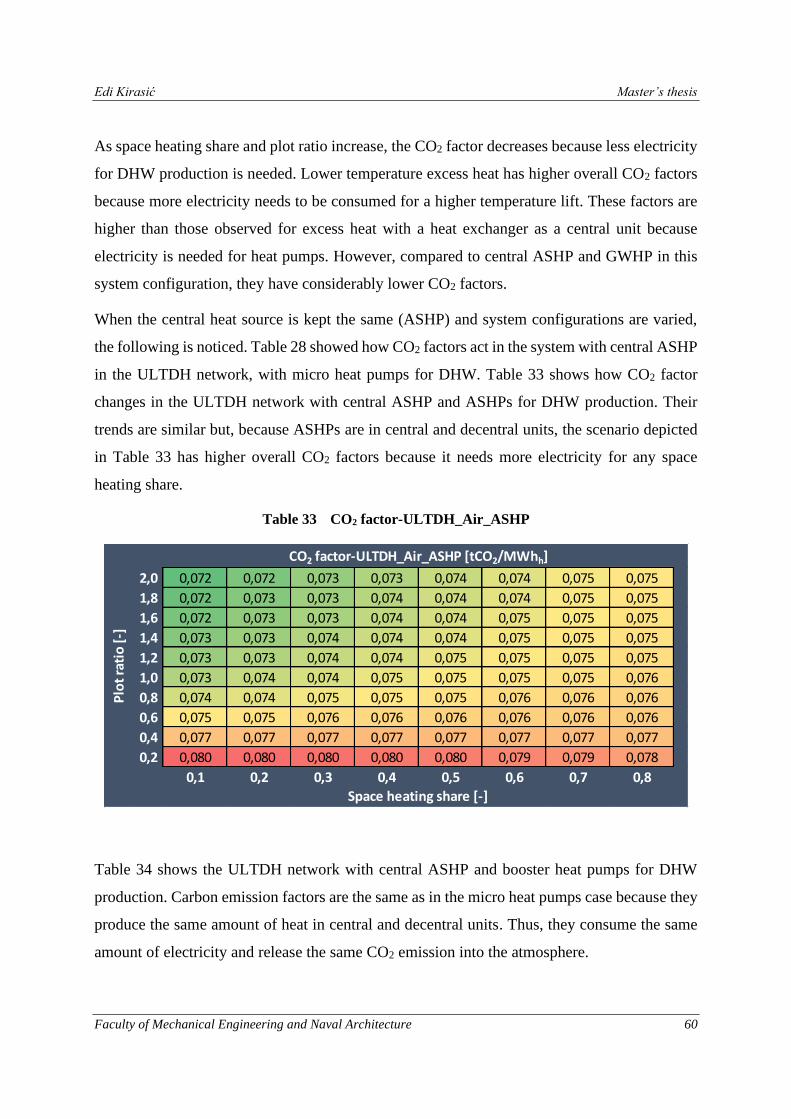
Edi Kirasić Master’s thesis
Faculty of Mechanical Engineering and Naval Architecture 60
As space heating share and plot ratio increase, the CO2 factor decreases because less electricity
for DHW production is needed. Lower temperature excess heat has higher overall CO2 factors
because more electricity needs to be consumed for a higher temperature lift. These factors are
higher than those observed for excess heat with a heat exchanger as a central unit because
electricity is needed for heat pumps. However, compared to central ASHP and GWHP in this
system configuration, they have considerably lower CO2 factors.
When the central heat source is kept the same (ASHP) and system configurations are varied,
the following is noticed. Table 28 showed how CO2 factors act in the system with central ASHP
in the ULTDH network, with micro heat pumps for DHW. Table 33 shows how CO2 factor
changes in the ULTDH network with central ASHP and ASHPs for DHW production. Their
trends are similar but, because ASHPs are in central and decentral units, the scenario depicted
in Table 33 has higher overall CO2 factors because it needs more electricity for any space
heating share.
Table 33 CO2 factor-ULTDH_Air_ASHP
Table 34 shows the ULTDH network with central ASHP and booster heat pumps for DHW
production. Carbon emission factors are the same as in the micro heat pumps case because they
produce the same amount of heat in central and decentral units. Thus, they consume the same
amount of electricity and release the same CO2 emission into the atmosphere.
2,0 0,072 0,072 0,073 0,073 0,074 0,074 0,075 0,075
1,8 0,072 0,073 0,073 0,074 0,074 0,074 0,075 0,075
1,6 0,072 0,073 0,073 0,074 0,074 0,075 0,075 0,075
1,4 0,073 0,073 0,074 0,074 0,074 0,075 0,075 0,075
1,2 0,073 0,073 0,074 0,074 0,075 0,075 0,075 0,075
1,0 0,073 0,074 0,074 0,075 0,075 0,075 0,075 0,076
0,8 0,074 0,074 0,075 0,075 0,075 0,076 0,076 0,076
0,6 0,075 0,075 0,076 0,076 0,076 0,076 0,076 0,076
0,4 0,077 0,077 0,077 0,077 0,077 0,077 0,077 0,077
0,2 0,080 0,080 0,080 0,080 0,080 0,079 0,079 0,078
0,1 0,2 0,3 0,4 0,5 0,6 0,7 0,8
Space heating share [-]
CO2 factor-ULTDH_Air_ASHP [tCO2/MWhh]
Plo
t ra
tio
[-]
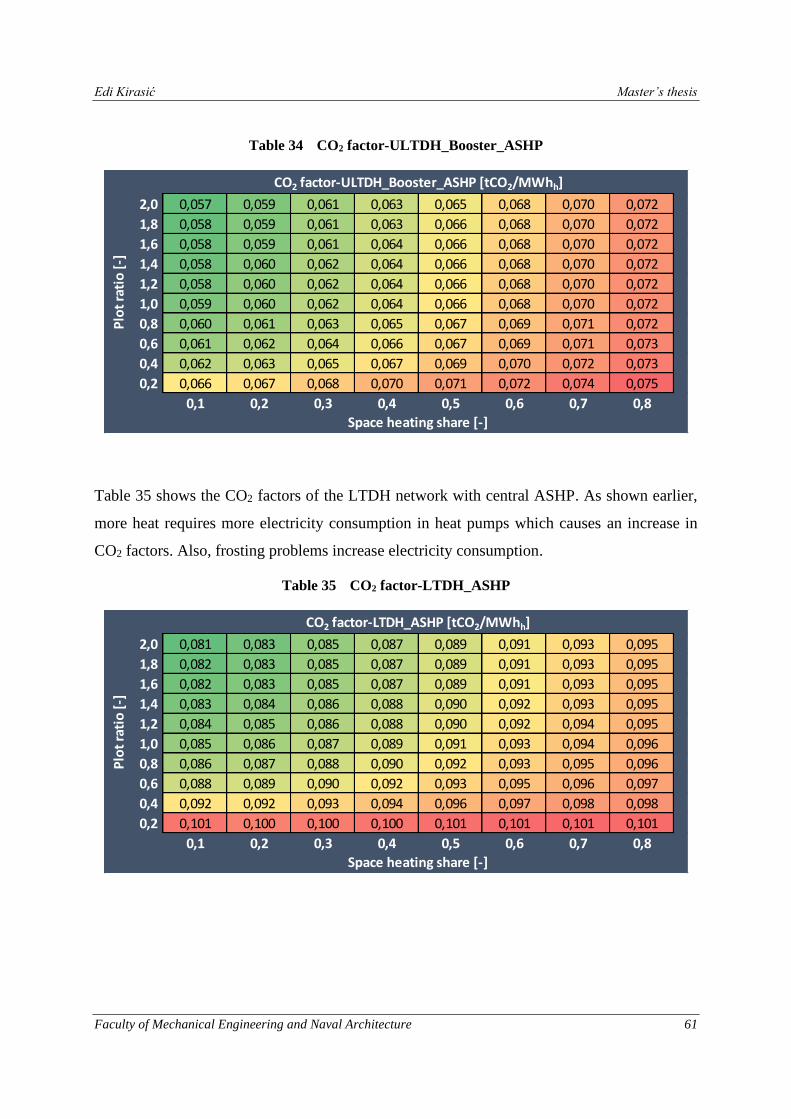
Edi Kirasić Master’s thesis
Faculty of Mechanical Engineering and Naval Architecture 61
Table 34 CO2 factor-ULTDH_Booster_ASHP
Table 35 shows the CO2 factors of the LTDH network with central ASHP. As shown earlier,
more heat requires more electricity consumption in heat pumps which causes an increase in
CO2 factors. Also, frosting problems increase electricity consumption.
Table 35 CO2 factor-LTDH_ASHP
2,0 0,057 0,059 0,061 0,063 0,065 0,068 0,070 0,072
1,8 0,058 0,059 0,061 0,063 0,066 0,068 0,070 0,072
1,6 0,058 0,059 0,061 0,064 0,066 0,068 0,070 0,072
1,4 0,058 0,060 0,062 0,064 0,066 0,068 0,070 0,072
1,2 0,058 0,060 0,062 0,064 0,066 0,068 0,070 0,072
1,0 0,059 0,060 0,062 0,064 0,066 0,068 0,070 0,072
0,8 0,060 0,061 0,063 0,065 0,067 0,069 0,071 0,072
0,6 0,061 0,062 0,064 0,066 0,067 0,069 0,071 0,073
0,4 0,062 0,063 0,065 0,067 0,069 0,070 0,072 0,073
0,2 0,066 0,067 0,068 0,070 0,071 0,072 0,074 0,075
0,1 0,2 0,3 0,4 0,5 0,6 0,7 0,8
Space heating share [-]
Plo
t ra
tio
[-]
CO2 factor-ULTDH_Booster_ASHP [tCO2/MWhh]
2,0 0,081 0,083 0,085 0,087 0,089 0,091 0,093 0,095
1,8 0,082 0,083 0,085 0,087 0,089 0,091 0,093 0,095
1,6 0,082 0,083 0,085 0,087 0,089 0,091 0,093 0,095
1,4 0,083 0,084 0,086 0,088 0,090 0,092 0,093 0,095
1,2 0,084 0,085 0,086 0,088 0,090 0,092 0,094 0,095
1,0 0,085 0,086 0,087 0,089 0,091 0,093 0,094 0,096
0,8 0,086 0,087 0,088 0,090 0,092 0,093 0,095 0,096
0,6 0,088 0,089 0,090 0,092 0,093 0,095 0,096 0,097
0,4 0,092 0,092 0,093 0,094 0,096 0,097 0,098 0,098
0,2 0,101 0,100 0,100 0,100 0,101 0,101 0,101 0,101
0,1 0,2 0,3 0,4 0,5 0,6 0,7 0,8
Plo
t ra
tio
[-]
Space heating share [-]
CO2 factor-LTDH_ASHP [tCO2/MWhh]

Edi Kirasić Master’s thesis
Faculty of Mechanical Engineering and Naval Architecture 62
All cases have lower CO2 factors compared to individual natural gas boiler heating CO2 factor
of 0,242. The lowest CO2 factors are observed for ULTDH networks with a booster and micro
heat pumps at consumer substations, as shown in Table 36. They consume less electricity than
other cases. Less electricity consumption is caused by less needed heat production in the central
unit and lower temperature lift at the decentral units.
Table 36 The lowest carbon emission factor
2,0 Booster/Micro Booster/Micro Booster/Micro Booster/Micro Booster/Micro Booster/Micro Booster/Micro Booster/Micro
1,8 Booster/Micro Booster/Micro Booster/Micro Booster/Micro Booster/Micro Booster/Micro Booster/Micro Booster/Micro
1,6 Booster/Micro Booster/Micro Booster/Micro Booster/Micro Booster/Micro Booster/Micro Booster/Micro Booster/Micro
1,4 Booster/Micro Booster/Micro Booster/Micro Booster/Micro Booster/Micro Booster/Micro Booster/Micro Booster/Micro
1,2 Booster/Micro Booster/Micro Booster/Micro Booster/Micro Booster/Micro Booster/Micro Booster/Micro Booster/Micro
1,0 Booster/Micro Booster/Micro Booster/Micro Booster/Micro Booster/Micro Booster/Micro Booster/Micro Booster/Micro
0,8 Booster/Micro Booster/Micro Booster/Micro Booster/Micro Booster/Micro Booster/Micro Booster/Micro Booster/Micro
0,6 Booster/Micro Booster/Micro Booster/Micro Booster/Micro Booster/Micro Booster/Micro Booster/Micro Booster/Micro
0,4 Booster/Micro Booster/Micro Booster/Micro Booster/Micro Booster/Micro Booster/Micro Booster/Micro Booster/Micro
0,2 Booster/Micro Booster/Micro Booster/Micro Booster/Micro Booster/Micro Booster/Micro Booster/Micro Booster/Micro
0,1 0,2 0,3 0,4 0,5 0,6 0,7 0,8
The Lowest CO2 factor [tCO2/MWhh]
Plo
t ra
tio
[-]
Space heating share [-]
Edi Kirasić Master’s thesis
Faculty of Mechanical Engineering and Naval Architecture 63
6. CONCLUSION
After conduction of cost and benefit analysis of low and ultra-low temperature district heating
systems following was observed. Low plot ratios and space heating shares make these new
networks infeasible compared to individual natural gas boiler heating. However, if technology
advancements continue at the current pace, the cost of this system could be significantly
reduced and more competitive in those areas. It has been shown that network investment
accounts only for a fraction of total cost and that the most significant portion of investment cost
comes from central and decentral heat pumps. Also, in cases where heat pumps are in each
apartment, operation and maintenance costs and electricity cost increase significantly, affecting
the profitability of these systems. At higher plot ratios (urban, densely populated area), these
systems are profitable if domestic hot water demand is low compared to space heating demand.
That also supports the fact that decentral heat pumps are the main expenditure in these networks.
All that means that currently, reduction of network losses and reduction of fuel cost in these
networks cannot cover the costs of extra equipment and electricity in any district. LTDH
networks perform slightly better because they do not need decentral heat pumps, and heat losses
are low enough still low enough despite higher temperatures than in ULTDH systems.
However, these systems are still not cost-competitive to individual heating solutions in rural
areas with highly efficient buildings whose space heating need is only a fraction of their
domestic hot water need. The lowest LCOH cost has been noticed in cases where district heating
systems are supplied with excess heat. Nevertheless, excess heat is not available at any location,
and ASHPs and GWHPs must be used, affecting profitability.
The primary energy factor and CO2 factor showed that these systems help reduce energy
consumption and CO2 emissions compared to fossil fuel heating. All ULTDH and LTDH
variants examined in this thesis showed better factors value than individual gas boiler heating.
The lowest values are observed for ULTDH cases where the network acts as a source for
decentral heat pumps.
Overall, these systems are great for energy conservation and CO2 reduction, but they are still
not feasible as other heating sources. To boost ULTDH and LTDH systems, heat pumps and
electricity cost must drop.

Edi Kirasić Master’s thesis
Faculty of Mechanical Engineering and Naval Architecture 64
ACKNOWLEDGEMENT
This Master’s thesis was developed as the part of REWARDHeat project (Grant Agreement
number 857811) financed through Horizon2020 Programme.

Edi Kirasić Master’s thesis
Faculty of Mechanical Engineering and Naval Architecture 65
LITERATURE
[1] H. Lund et al., “4th Generation District Heating (4GDH). Integrating smart thermal grids
into future sustainable energy systems.,” Energy, vol. 68, pp. 1–11, 2014.
[2] S. Buffa, M. Cozzini, M. D’Antoni, M. Baratieri, and R. Fedrizzi, “5th generation district
heating and cooling systems: A review of existing cases in Europe,” Renewable and
Sustainable Energy Reviews. 2019.
[3] T. Ommen, J. E. Thorsen, W. B. Markussen, and B. Elmegaard, “Performance of ultra
low temperature district heating systems with utility plant and booster heat pumps,”
Energy, vol. 137, pp. 544–555, 2017.
[4] H. Li et al., “Annex X Final report Toward 4 th Generation District Heating : Experience
and Potential of Low-Temperature District Heating,” IEA Annex X, p. 205, 2014.
[5] N. L. Shrestha et al., “Implementation of large solar thermal system into district heating
network in Chemnitz (Germany),” ISES Sol. World Congr. 2017 - IEA SHC Int. Conf.
Sol. Heat. Cool. Build. Ind. 2017, Proc., pp. 322–332, 2017.
[6] H. Fang, J. Xia, K. Zhu, Y. Su, and Y. Jiang, “Industrial waste heat utilisation for low
temperature district heating,” Energy Policy, vol. 62, pp. 236–246, 2013.
[7] D. Schmidt and A. Kallert, International Energy Agency Technology Collaboration
Programme on District Heating and Cooling including Combined Heat and Power
Annex TS1 Low Temperature District Heating for Future Energy Systems FUTURE
LOW TEMPERATURE DISTRICT HEATING DESIGN GUIDEBOOK. .
[8] A. Volkova et al., “Energy cascade connection of a low-temperature district heating
network to the return line of a high-temperature district heating network,” Energy, vol.
198, 2020.
[9] D. Trier, L. Laurberg Jensen, F. Bava, I. Ben Hassine, and X. Jobard, “Large Storage
Systems for DHC Networks,” p. 106, 2019.
[10] M. Cozzini et al., “FLEXYNETS Guide Book on Fifth generation, low temperature, high
exergy district heating and cooling networks,” no. December, 2018.
[11] D. Schmidt et al., “Low Temperature District Heating for Future Energy Systems,” in
Energy Procedia, 2017.
[12] S. Chicherin, V. Mašatin, A. Siirde, and A. Volkova, “Method for assessing heat loss in

Edi Kirasić Master’s thesis
Faculty of Mechanical Engineering and Naval Architecture 66
a district heating network with a focus on the state of insulation and actual demand for
useful energy,” Energies, vol. 13, no. 17, 2020.
[13] O. Ruhnau, L. Hirth, and A. Praktiknjo, “Time series of heat demand and heat pump
efficiency for energy system modeling,” Sci. Data, vol. 6, no. 1, pp. 1–10, 2019.
[14] M. Therm, M. Caramaschi, M. Therm, K. Bryder, and L. Buhl, “Interconnection schemes
for consumer installations,” no. 768567, pp. 1–62, 2019.
[15] W. Meesenburg, T. Ommen, J. E. Thorsen, and B. Elmegaard, “Economic feasibility of
ultra-low temperature district heating systems in newly built areas supplied by renewable
energy,” Energy, vol. 191, p. 116496, 2020.
[16] U. Persson and S. Werner, “Heat distribution and the future competitiveness of district
heating,” Appl. Energy, vol. 88, no. 3, pp. 568–576, 2011.
[17] U. Persson and S. Werner, “Effective width - The relative demand for district heating
pipe lengths in city areas,” 12th Int. Symp. Dist. Heat. Cool., pp. 128–131, 2010.
[18] “Danish District Heating Statistics 2017.” [Online]. Available:
https://www.danskfjernvarme.dk/viden/statistik-subsection/aarsstatistik/statistik-2017.
[Accessed: 29-Apr-2021].
[19] Euroheat & power, “Guidelines for District Heating Substations,” Euroheat & Power, p.
68, 2008.
[20] I. Sarbu and E. S. Valea, “Energy savings potential for pumping water in district heating
stations,” Sustain., vol. 7, no. 5, pp. 5705–5719, 2015.
[21] J. K. Jensen, T. Ommen, L. Reinholdt, W. B. Markussen, and B. Elmegaard, “Heat pump
COP, part 2: Generalised COP estimation of heat pump processes,” Refrig. Sci. Technol.,
vol. 2018-June, pp. 1255–1264, 2018.
[22] G. Mader, Economic analysis of air-water heat pump technologies with a screening
method. 2015.
[23] S. Papavinasam, Management. 2014.
[24] “Odluka o kamatnim stopama, diskontnoj (eskontnoj) stopi i naknadama Hrvatske
narodne banke - HNB.” [Online]. Available: https://www.hnb.hr/-/odluka-o-kamatnim-
stopama-diskontnoj-eskontnoj-stopi-i-naknadama-hrvatske-narodne-banke. [Accessed:
30-Apr-2021].
[25] A. Pavlova, J. Hansen, H. Obermeyer, and I. Pavlova, “Geothermal heat in a heat pump
Edi Kirasić Master’s thesis
Faculty of Mechanical Engineering and Naval Architecture 67
use,” IOP Conf. Ser. Earth Environ. Sci., vol. 43, no. 1, 2016.
[26] “Data Platform – Open Power System Data.” [Online]. Available: https://data.open-
power-system-data.org/weather_data/2020-09-16. [Accessed: 29-Apr-2021].
[27] T. J. de Boer, “Optimisation of a District Heating Network with the Focus on Heat Loss,”
p. 1, 2018.
[28] J. C. Flores, O. Le Corre, B. Lacarrière, and V. Martin, “Study of a District Heating
Substation Using the Return Water of the Main System To Service a Low-Temperature
Secondary,” Svenskfjarrvarme.Se, no. September, 2014.
[29] J. E. Thorsen and T. Ommen, “Field experience with ULTDH substation for multifamily
building,” Energy Procedia, vol. 149, pp. 197–205, 2018.
[30] R. Segers, “Equivalent full load hours for heating of reversible air-air heat pumps,” pp.
1–12, 2015.
[31] C. Transition, “Stimulation of Sustainable Energy Production and Climate Transition,”
no. December, 2020.
[32] D. Korn and J. Walczyk, “Exactly What Is a Full Load Cooling Hour and Does Size
Really Matter?,” pp. 1–12, 2016.
[33] H. Pieper, T. Ommen, F. Buhler, B. Lava Paaske, B. Elmegaard, and W. Brix Markussen,
“Allocation of investment costs for large-scale heat pumps supplying district heating,”
Energy Procedia, vol. 147, no. June 2019, pp. 358–367, 2018.
[34] Danish Energy Agency, “Technology Data,” no. 36, pp. 5–6, 2020.
[35] I. Page, T. Data, and H. Installations, “Technology Data for Heating Installations.”
[36] DEA, “District Heating Assessment Tool,” 2017.
[37] M. Adolfsson and S. Rashid, “Life Cycle Assessment and Life Cycle Cost of Heat
Exchangers A Case for Inter Terminals Sweden AB Located in Port of Gothenburg,”
2016.
[38] J. Kim and I. Weidlich, “Identification of Individual District Heating Network
Conditions using Equivalent Full Load Cycles,” Energy Procedia, vol. 116, pp. 343–
350, 2017.
[39] C. H. Hansen, O. Gudmundsson, and N. Detlefsen, “Cost efficiency of district heating
for low energy buildings of the future,” Energy, vol. 177, pp. 77–86, 2019.
[40] “Electricity price statistics - Statistics Explained.” [Online]. Available:

Edi Kirasić Master’s thesis
Faculty of Mechanical Engineering and Naval Architecture 68
https://ec.europa.eu/eurostat/statistics-
explained/index.php/Electricity_price_statistics#Electricity_prices_for_household_con
sumers. [Accessed: 30-Apr-2021].
[41] “Natural gas price statistics - Statistics Explained.” [Online]. Available:
https://ec.europa.eu/eurostat/statistics-
explained/index.php/Natural_gas_price_statistics. [Accessed: 30-Apr-2021].
[42] Ministarstvo graditeljstva i prostornog uređenja, “Faktori primarne energije i emisija CO
2,” p. 2014, 2014.

Edi Kirasić Master’s thesis
Faculty of Mechanical Engineering and Naval Architecture 69
ANNEX
I. LCOH tables
II. Primary energy factor tables
III. CO2 factor tables
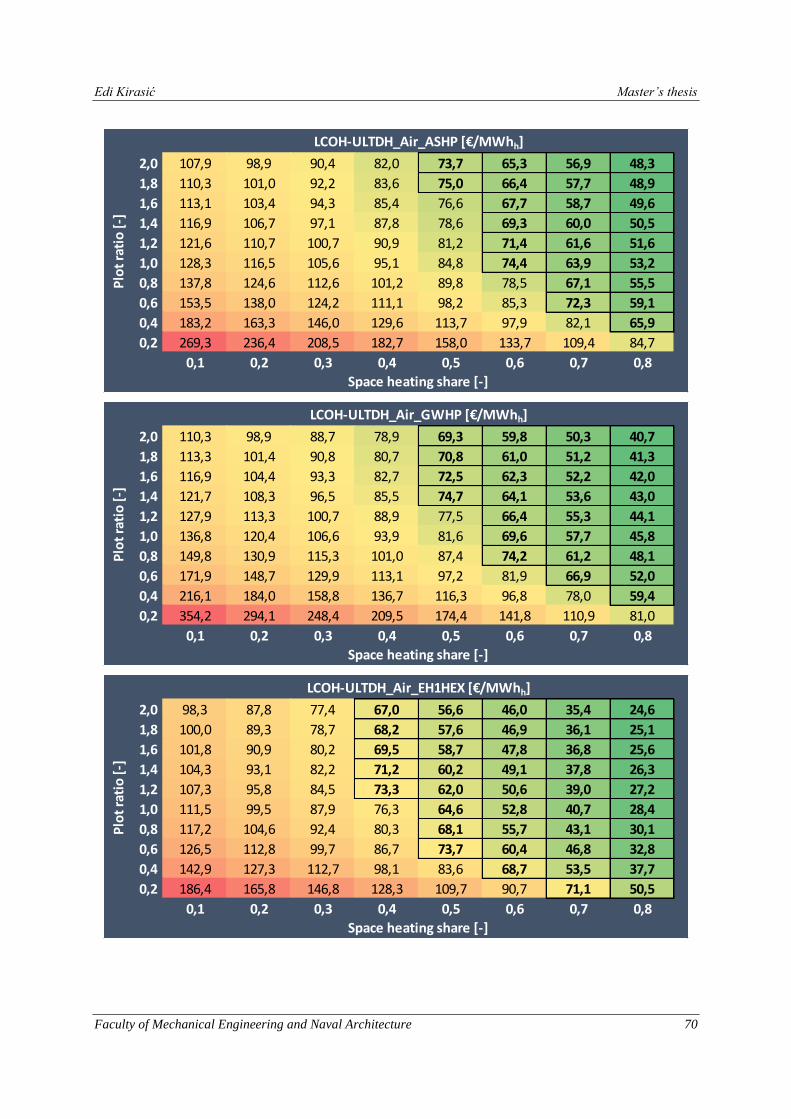
Edi Kirasić Master’s thesis
Faculty of Mechanical Engineering and Naval Architecture 70
2,0 107,9 98,9 90,4 82,0 73,7 65,3 56,9 48,3
1,8 110,3 101,0 92,2 83,6 75,0 66,4 57,7 48,9
1,6 113,1 103,4 94,3 85,4 76,6 67,7 58,7 49,6
1,4 116,9 106,7 97,1 87,8 78,6 69,3 60,0 50,5
1,2 121,6 110,7 100,7 90,9 81,2 71,4 61,6 51,6
1,0 128,3 116,5 105,6 95,1 84,8 74,4 63,9 53,2
0,8 137,8 124,6 112,6 101,2 89,8 78,5 67,1 55,5
0,6 153,5 138,0 124,2 111,1 98,2 85,3 72,3 59,1
0,4 183,2 163,3 146,0 129,6 113,7 97,9 82,1 65,9
0,2 269,3 236,4 208,5 182,7 158,0 133,7 109,4 84,7
0,1 0,2 0,3 0,4 0,5 0,6 0,7 0,8
LCOH-ULTDH_Air_ASHP [€/MWhh]
Space heating share [-]
Plo
t ra
tio
[-]
2,0 110,3 98,9 88,7 78,9 69,3 59,8 50,3 40,7
1,8 113,3 101,4 90,8 80,7 70,8 61,0 51,2 41,3
1,6 116,9 104,4 93,3 82,7 72,5 62,3 52,2 42,0
1,4 121,7 108,3 96,5 85,5 74,7 64,1 53,6 43,0
1,2 127,9 113,3 100,7 88,9 77,5 66,4 55,3 44,1
1,0 136,8 120,4 106,6 93,9 81,6 69,6 57,7 45,8
0,8 149,8 130,9 115,3 101,0 87,4 74,2 61,2 48,1
0,6 171,9 148,7 129,9 113,1 97,2 81,9 66,9 52,0
0,4 216,1 184,0 158,8 136,7 116,3 96,8 78,0 59,4
0,2 354,2 294,1 248,4 209,5 174,4 141,8 110,9 81,0
0,1 0,2 0,3 0,4 0,5 0,6 0,7 0,8
LCOH-ULTDH_Air_GWHP [€/MWhh]
Plo
t ra
tio
[-]
Space heating share [-]
2,0 98,3 87,8 77,4 67,0 56,6 46,0 35,4 24,6
1,8 100,0 89,3 78,7 68,2 57,6 46,9 36,1 25,1
1,6 101,8 90,9 80,2 69,5 58,7 47,8 36,8 25,6
1,4 104,3 93,1 82,2 71,2 60,2 49,1 37,8 26,3
1,2 107,3 95,8 84,5 73,3 62,0 50,6 39,0 27,2
1,0 111,5 99,5 87,9 76,3 64,6 52,8 40,7 28,4
0,8 117,2 104,6 92,4 80,3 68,1 55,7 43,1 30,1
0,6 126,5 112,8 99,7 86,7 73,7 60,4 46,8 32,8
0,4 142,9 127,3 112,7 98,1 83,6 68,7 53,5 37,7
0,2 186,4 165,8 146,8 128,3 109,7 90,7 71,1 50,5
0,1 0,2 0,3 0,4 0,5 0,6 0,7 0,8
LCOH-ULTDH_Air_EH1HEX [€/MWhh]
Plo
t ra
tio
[-]
Space heating share [-]
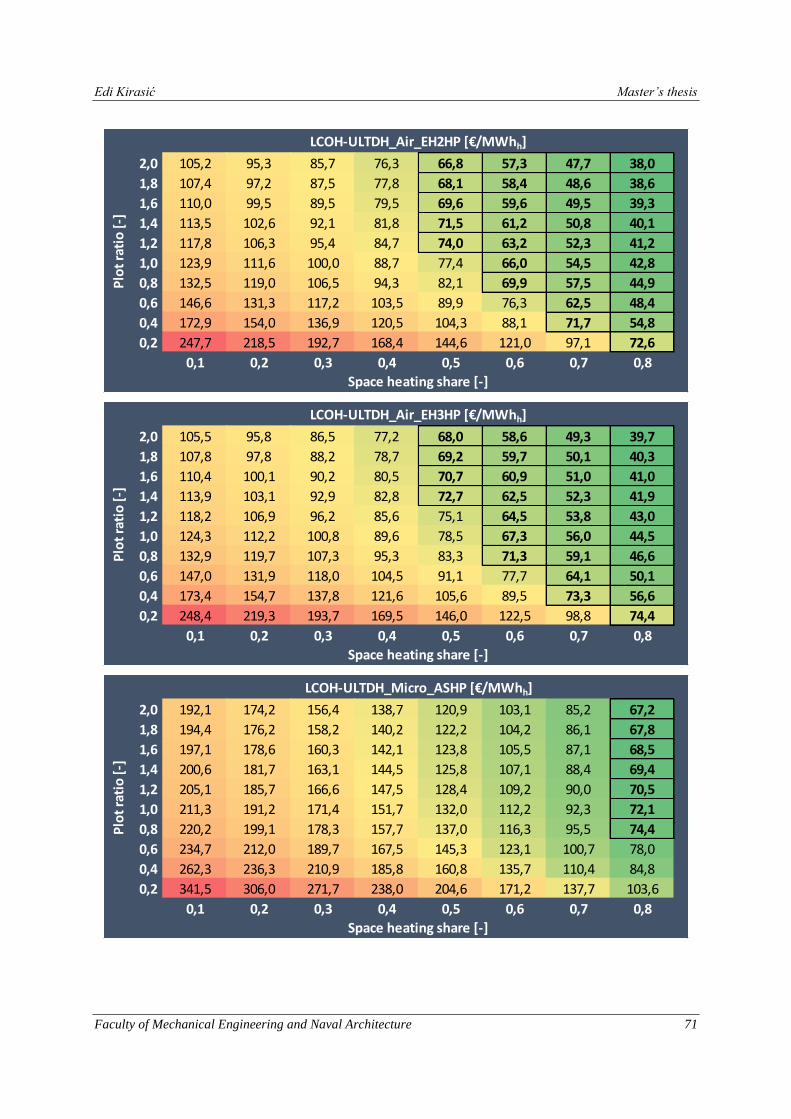
Edi Kirasić Master’s thesis
Faculty of Mechanical Engineering and Naval Architecture 71
2,0 105,2 95,3 85,7 76,3 66,8 57,3 47,7 38,0
1,8 107,4 97,2 87,5 77,8 68,1 58,4 48,6 38,6
1,6 110,0 99,5 89,5 79,5 69,6 59,6 49,5 39,3
1,4 113,5 102,6 92,1 81,8 71,5 61,2 50,8 40,1
1,2 117,8 106,3 95,4 84,7 74,0 63,2 52,3 41,2
1,0 123,9 111,6 100,0 88,7 77,4 66,0 54,5 42,8
0,8 132,5 119,0 106,5 94,3 82,1 69,9 57,5 44,9
0,6 146,6 131,3 117,2 103,5 89,9 76,3 62,5 48,4
0,4 172,9 154,0 136,9 120,5 104,3 88,1 71,7 54,8
0,2 247,7 218,5 192,7 168,4 144,6 121,0 97,1 72,6
0,1 0,2 0,3 0,4 0,5 0,6 0,7 0,8
LCOH-ULTDH_Air_EH2HP [€/MWhh]
Plo
t ra
tio
[-]
Space heating share [-]
2,0 105,5 95,8 86,5 77,2 68,0 58,6 49,3 39,7
1,8 107,8 97,8 88,2 78,7 69,2 59,7 50,1 40,3
1,6 110,4 100,1 90,2 80,5 70,7 60,9 51,0 41,0
1,4 113,9 103,1 92,9 82,8 72,7 62,5 52,3 41,9
1,2 118,2 106,9 96,2 85,6 75,1 64,5 53,8 43,0
1,0 124,3 112,2 100,8 89,6 78,5 67,3 56,0 44,5
0,8 132,9 119,7 107,3 95,3 83,3 71,3 59,1 46,6
0,6 147,0 131,9 118,0 104,5 91,1 77,7 64,1 50,1
0,4 173,4 154,7 137,8 121,6 105,6 89,5 73,3 56,6
0,2 248,4 219,3 193,7 169,5 146,0 122,5 98,8 74,4
0,1 0,2 0,3 0,4 0,5 0,6 0,7 0,8
LCOH-ULTDH_Air_EH3HP [€/MWhh]
Plo
t ra
tio
[-]
Space heating share [-]
2,0 192,1 174,2 156,4 138,7 120,9 103,1 85,2 67,2
1,8 194,4 176,2 158,2 140,2 122,2 104,2 86,1 67,8
1,6 197,1 178,6 160,3 142,1 123,8 105,5 87,1 68,5
1,4 200,6 181,7 163,1 144,5 125,8 107,1 88,4 69,4
1,2 205,1 185,7 166,6 147,5 128,4 109,2 90,0 70,5
1,0 211,3 191,2 171,4 151,7 132,0 112,2 92,3 72,1
0,8 220,2 199,1 178,3 157,7 137,0 116,3 95,5 74,4
0,6 234,7 212,0 189,7 167,5 145,3 123,1 100,7 78,0
0,4 262,3 236,3 210,9 185,8 160,8 135,7 110,4 84,8
0,2 341,5 306,0 271,7 238,0 204,6 171,2 137,7 103,6
0,1 0,2 0,3 0,4 0,5 0,6 0,7 0,8
LCOH-ULTDH_Micro_ASHP [€/MWhh]
Plo
t ra
tio
[-]
Space heating share [-]
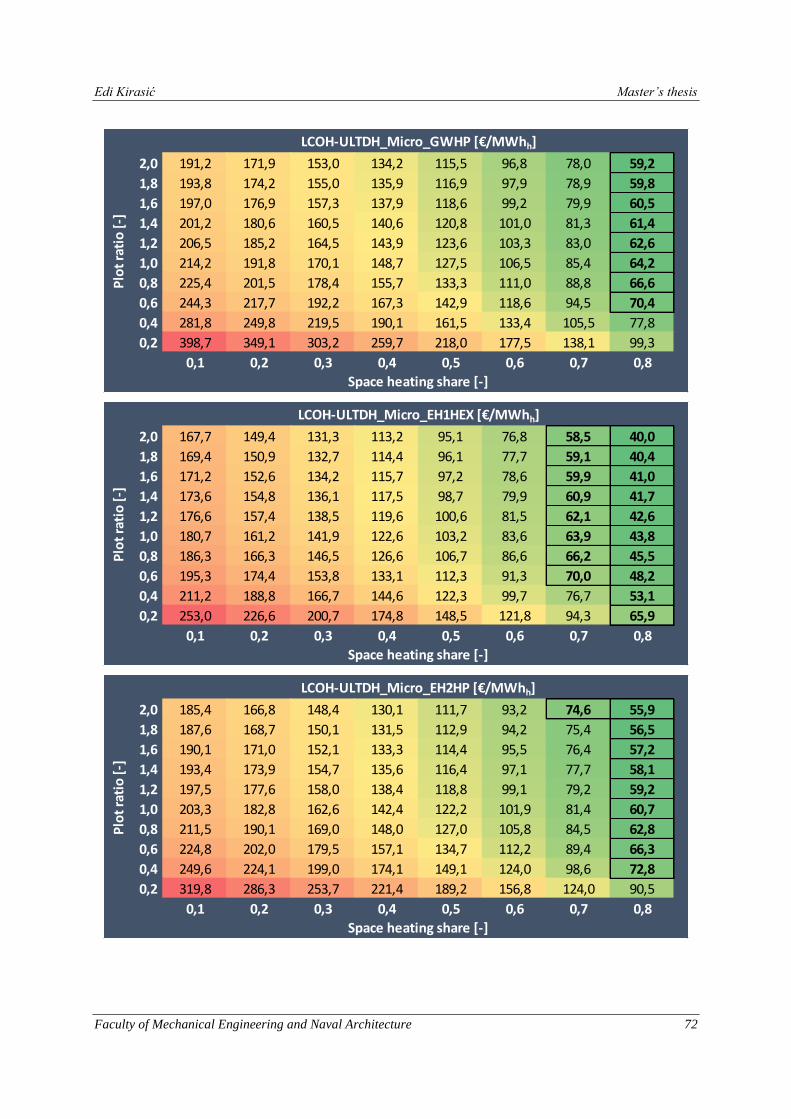
Edi Kirasić Master’s thesis
Faculty of Mechanical Engineering and Naval Architecture 72
2,0 191,2 171,9 153,0 134,2 115,5 96,8 78,0 59,2
1,8 193,8 174,2 155,0 135,9 116,9 97,9 78,9 59,8
1,6 197,0 176,9 157,3 137,9 118,6 99,2 79,9 60,5
1,4 201,2 180,6 160,5 140,6 120,8 101,0 81,3 61,4
1,2 206,5 185,2 164,5 143,9 123,6 103,3 83,0 62,6
1,0 214,2 191,8 170,1 148,7 127,5 106,5 85,4 64,2
0,8 225,4 201,5 178,4 155,7 133,3 111,0 88,8 66,6
0,6 244,3 217,7 192,2 167,3 142,9 118,6 94,5 70,4
0,4 281,8 249,8 219,5 190,1 161,5 133,4 105,5 77,8
0,2 398,7 349,1 303,2 259,7 218,0 177,5 138,1 99,3
0,1 0,2 0,3 0,4 0,5 0,6 0,7 0,8
Space heating share [-]
LCOH-ULTDH_Micro_GWHP [€/MWhh]
Plo
t ra
tio
[-]
2,0 167,7 149,4 131,3 113,2 95,1 76,8 58,5 40,0
1,8 169,4 150,9 132,7 114,4 96,1 77,7 59,1 40,4
1,6 171,2 152,6 134,2 115,7 97,2 78,6 59,9 41,0
1,4 173,6 154,8 136,1 117,5 98,7 79,9 60,9 41,7
1,2 176,6 157,4 138,5 119,6 100,6 81,5 62,1 42,6
1,0 180,7 161,2 141,9 122,6 103,2 83,6 63,9 43,8
0,8 186,3 166,3 146,5 126,6 106,7 86,6 66,2 45,5
0,6 195,3 174,4 153,8 133,1 112,3 91,3 70,0 48,2
0,4 211,2 188,8 166,7 144,6 122,3 99,7 76,7 53,1
0,2 253,0 226,6 200,7 174,8 148,5 121,8 94,3 65,9
0,1 0,2 0,3 0,4 0,5 0,6 0,7 0,8
Space heating share [-]
LCOH-ULTDH_Micro_EH1HEX [€/MWhh]
Plo
t ra
tio
[-]
2,0 185,4 166,8 148,4 130,1 111,7 93,2 74,6 55,9
1,8 187,6 168,7 150,1 131,5 112,9 94,2 75,4 56,5
1,6 190,1 171,0 152,1 133,3 114,4 95,5 76,4 57,2
1,4 193,4 173,9 154,7 135,6 116,4 97,1 77,7 58,1
1,2 197,5 177,6 158,0 138,4 118,8 99,1 79,2 59,2
1,0 203,3 182,8 162,6 142,4 122,2 101,9 81,4 60,7
0,8 211,5 190,1 169,0 148,0 127,0 105,8 84,5 62,8
0,6 224,8 202,0 179,5 157,1 134,7 112,2 89,4 66,3
0,4 249,6 224,1 199,0 174,1 149,1 124,0 98,6 72,8
0,2 319,8 286,3 253,7 221,4 189,2 156,8 124,0 90,5
0,1 0,2 0,3 0,4 0,5 0,6 0,7 0,8
Plo
t ra
tio
[-]
Space heating share [-]
LCOH-ULTDH_Micro_EH2HP [€/MWhh]
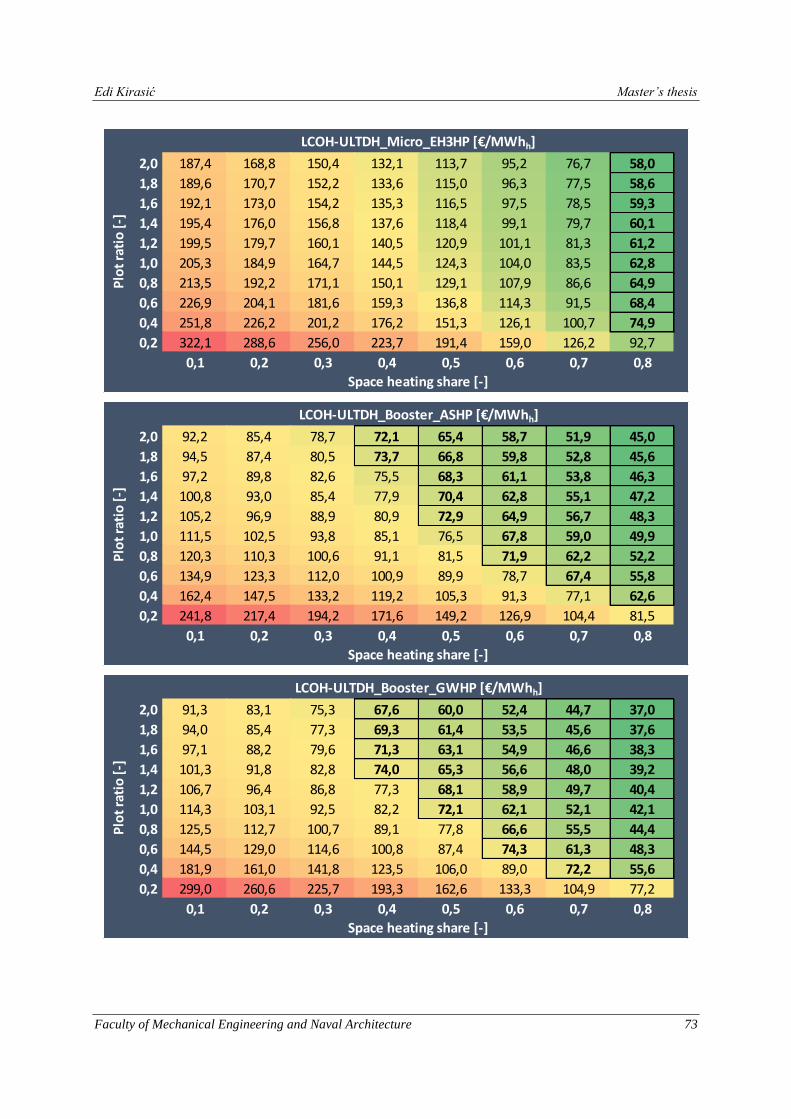
Edi Kirasić Master’s thesis
Faculty of Mechanical Engineering and Naval Architecture 73
2,0 187,4 168,8 150,4 132,1 113,7 95,2 76,7 58,0
1,8 189,6 170,7 152,2 133,6 115,0 96,3 77,5 58,6
1,6 192,1 173,0 154,2 135,3 116,5 97,5 78,5 59,3
1,4 195,4 176,0 156,8 137,6 118,4 99,1 79,7 60,1
1,2 199,5 179,7 160,1 140,5 120,9 101,1 81,3 61,2
1,0 205,3 184,9 164,7 144,5 124,3 104,0 83,5 62,8
0,8 213,5 192,2 171,1 150,1 129,1 107,9 86,6 64,9
0,6 226,9 204,1 181,6 159,3 136,8 114,3 91,5 68,4
0,4 251,8 226,2 201,2 176,2 151,3 126,1 100,7 74,9
0,2 322,1 288,6 256,0 223,7 191,4 159,0 126,2 92,7
0,1 0,2 0,3 0,4 0,5 0,6 0,7 0,8
Space heating share [-]
Plo
t ra
tio
[-]
LCOH-ULTDH_Micro_EH3HP [€/MWhh]
2,0 92,2 85,4 78,7 72,1 65,4 58,7 51,9 45,0
1,8 94,5 87,4 80,5 73,7 66,8 59,8 52,8 45,6
1,6 97,2 89,8 82,6 75,5 68,3 61,1 53,8 46,3
1,4 100,8 93,0 85,4 77,9 70,4 62,8 55,1 47,2
1,2 105,2 96,9 88,9 80,9 72,9 64,9 56,7 48,3
1,0 111,5 102,5 93,8 85,1 76,5 67,8 59,0 49,9
0,8 120,3 110,3 100,6 91,1 81,5 71,9 62,2 52,2
0,6 134,9 123,3 112,0 100,9 89,9 78,7 67,4 55,8
0,4 162,4 147,5 133,2 119,2 105,3 91,3 77,1 62,6
0,2 241,8 217,4 194,2 171,6 149,2 126,9 104,4 81,5
0,1 0,2 0,3 0,4 0,5 0,6 0,7 0,8
Space heating share [-]
LCOH-ULTDH_Booster_ASHP [€/MWhh]
Plo
t ra
tio
[-]
2,0 91,3 83,1 75,3 67,6 60,0 52,4 44,7 37,0
1,8 94,0 85,4 77,3 69,3 61,4 53,5 45,6 37,6
1,6 97,1 88,2 79,6 71,3 63,1 54,9 46,6 38,3
1,4 101,3 91,8 82,8 74,0 65,3 56,6 48,0 39,2
1,2 106,7 96,4 86,8 77,3 68,1 58,9 49,7 40,4
1,0 114,3 103,1 92,5 82,2 72,1 62,1 52,1 42,1
0,8 125,5 112,7 100,7 89,1 77,8 66,6 55,5 44,4
0,6 144,5 129,0 114,6 100,8 87,4 74,3 61,3 48,3
0,4 181,9 161,0 141,8 123,5 106,0 89,0 72,2 55,6
0,2 299,0 260,6 225,7 193,3 162,6 133,3 104,9 77,2
0,1 0,2 0,3 0,4 0,5 0,6 0,7 0,8
Space heating share [-]
LCOH-ULTDH_Booster_GWHP [€/MWhh]
Plo
t ra
tio
[-]
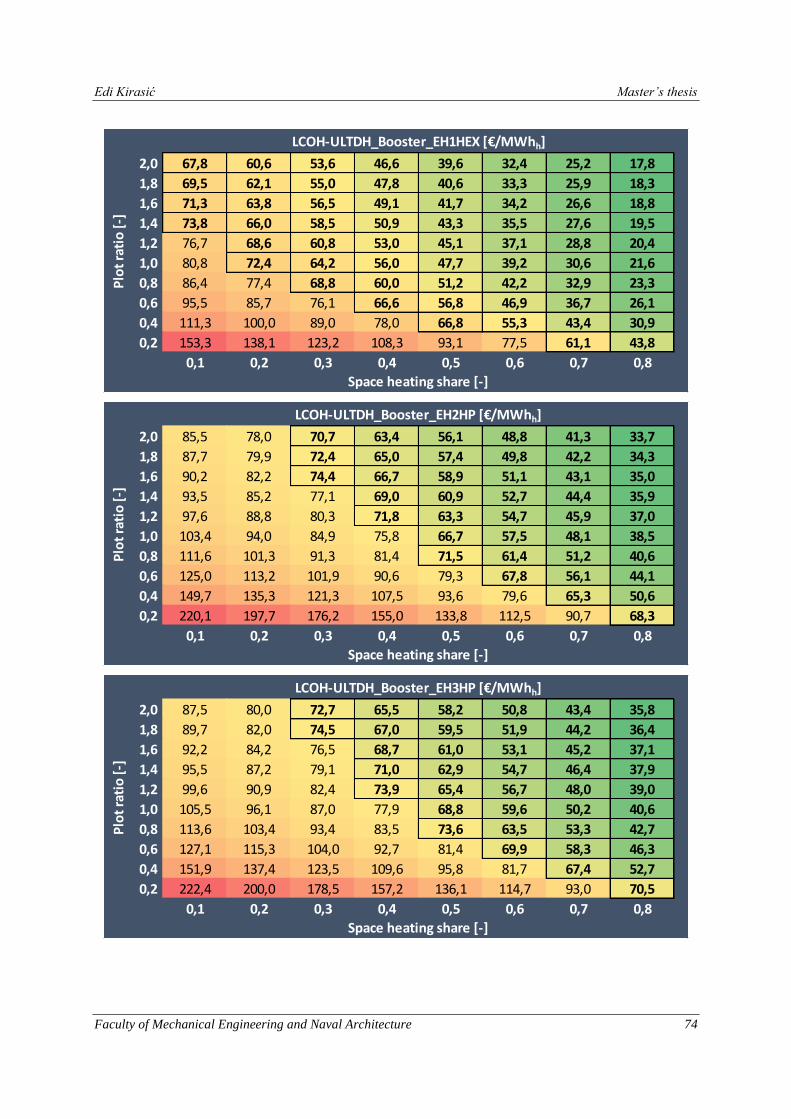
Edi Kirasić Master’s thesis
Faculty of Mechanical Engineering and Naval Architecture 74
2,0 67,8 60,6 53,6 46,6 39,6 32,4 25,2 17,8
1,8 69,5 62,1 55,0 47,8 40,6 33,3 25,9 18,3
1,6 71,3 63,8 56,5 49,1 41,7 34,2 26,6 18,8
1,4 73,8 66,0 58,5 50,9 43,3 35,5 27,6 19,5
1,2 76,7 68,6 60,8 53,0 45,1 37,1 28,8 20,4
1,0 80,8 72,4 64,2 56,0 47,7 39,2 30,6 21,6
0,8 86,4 77,4 68,8 60,0 51,2 42,2 32,9 23,3
0,6 95,5 85,7 76,1 66,6 56,8 46,9 36,7 26,1
0,4 111,3 100,0 89,0 78,0 66,8 55,3 43,4 30,9
0,2 153,3 138,1 123,2 108,3 93,1 77,5 61,1 43,8
0,1 0,2 0,3 0,4 0,5 0,6 0,7 0,8
Space heating share [-]
LCOH-ULTDH_Booster_EH1HEX [€/MWhh]
Plo
t ra
tio
[-]
2,0 85,5 78,0 70,7 63,4 56,1 48,8 41,3 33,7
1,8 87,7 79,9 72,4 65,0 57,4 49,8 42,2 34,3
1,6 90,2 82,2 74,4 66,7 58,9 51,1 43,1 35,0
1,4 93,5 85,2 77,1 69,0 60,9 52,7 44,4 35,9
1,2 97,6 88,8 80,3 71,8 63,3 54,7 45,9 37,0
1,0 103,4 94,0 84,9 75,8 66,7 57,5 48,1 38,5
0,8 111,6 101,3 91,3 81,4 71,5 61,4 51,2 40,6
0,6 125,0 113,2 101,9 90,6 79,3 67,8 56,1 44,1
0,4 149,7 135,3 121,3 107,5 93,6 79,6 65,3 50,6
0,2 220,1 197,7 176,2 155,0 133,8 112,5 90,7 68,3
0,1 0,2 0,3 0,4 0,5 0,6 0,7 0,8
Plo
t ra
tio
[-]
Space heating share [-]
LCOH-ULTDH_Booster_EH2HP [€/MWhh]
2,0 87,5 80,0 72,7 65,5 58,2 50,8 43,4 35,8
1,8 89,7 82,0 74,5 67,0 59,5 51,9 44,2 36,4
1,6 92,2 84,2 76,5 68,7 61,0 53,1 45,2 37,1
1,4 95,5 87,2 79,1 71,0 62,9 54,7 46,4 37,9
1,2 99,6 90,9 82,4 73,9 65,4 56,7 48,0 39,0
1,0 105,5 96,1 87,0 77,9 68,8 59,6 50,2 40,6
0,8 113,6 103,4 93,4 83,5 73,6 63,5 53,3 42,7
0,6 127,1 115,3 104,0 92,7 81,4 69,9 58,3 46,3
0,4 151,9 137,4 123,5 109,6 95,8 81,7 67,4 52,7
0,2 222,4 200,0 178,5 157,2 136,1 114,7 93,0 70,5
0,1 0,2 0,3 0,4 0,5 0,6 0,7 0,8
Plo
t ra
tio
[-]
Space heating share [-]
LCOH-ULTDH_Booster_EH3HP [€/MWhh]
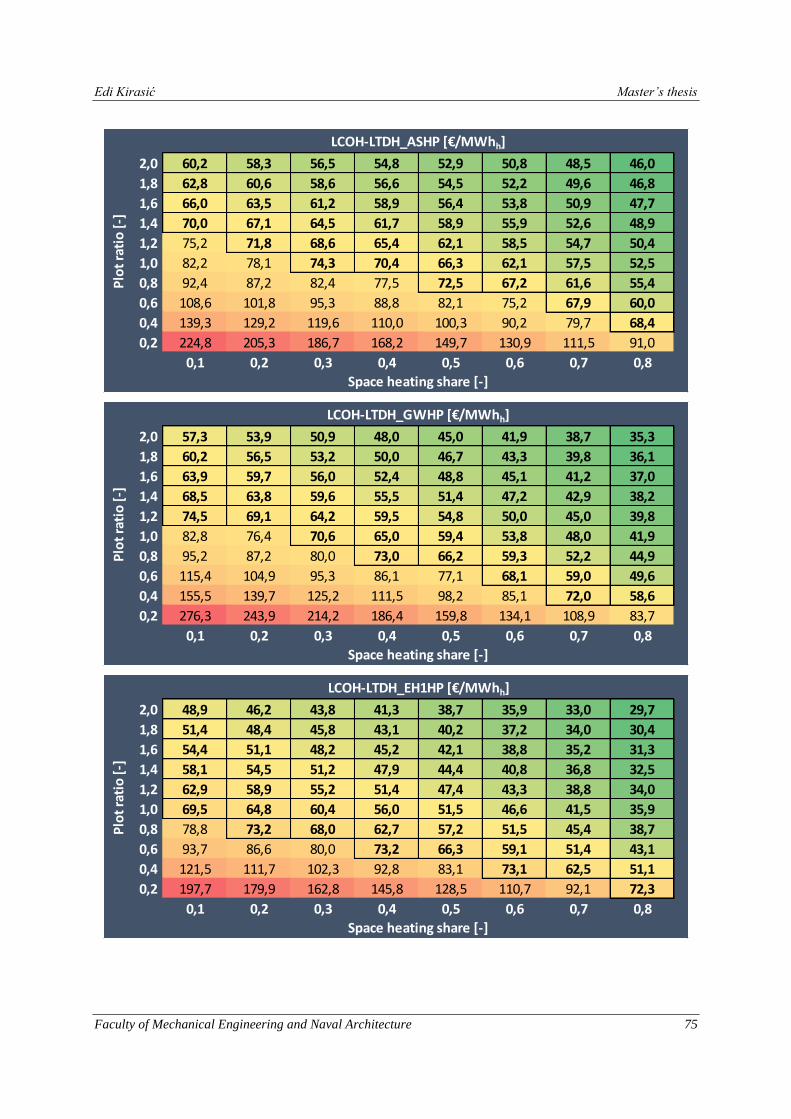
Edi Kirasić Master’s thesis
Faculty of Mechanical Engineering and Naval Architecture 75
2,0 60,2 58,3 56,5 54,8 52,9 50,8 48,5 46,0
1,8 62,8 60,6 58,6 56,6 54,5 52,2 49,6 46,8
1,6 66,0 63,5 61,2 58,9 56,4 53,8 50,9 47,7
1,4 70,0 67,1 64,5 61,7 58,9 55,9 52,6 48,9
1,2 75,2 71,8 68,6 65,4 62,1 58,5 54,7 50,4
1,0 82,2 78,1 74,3 70,4 66,3 62,1 57,5 52,5
0,8 92,4 87,2 82,4 77,5 72,5 67,2 61,6 55,4
0,6 108,6 101,8 95,3 88,8 82,1 75,2 67,9 60,0
0,4 139,3 129,2 119,6 110,0 100,3 90,2 79,7 68,4
0,2 224,8 205,3 186,7 168,2 149,7 130,9 111,5 91,0
0,1 0,2 0,3 0,4 0,5 0,6 0,7 0,8
Space heating share [-]
Plo
t ra
tio
[-]
LCOH-LTDH_ASHP [€/MWhh]
2,0 57,3 53,9 50,9 48,0 45,0 41,9 38,7 35,3
1,8 60,2 56,5 53,2 50,0 46,7 43,3 39,8 36,1
1,6 63,9 59,7 56,0 52,4 48,8 45,1 41,2 37,0
1,4 68,5 63,8 59,6 55,5 51,4 47,2 42,9 38,2
1,2 74,5 69,1 64,2 59,5 54,8 50,0 45,0 39,8
1,0 82,8 76,4 70,6 65,0 59,4 53,8 48,0 41,9
0,8 95,2 87,2 80,0 73,0 66,2 59,3 52,2 44,9
0,6 115,4 104,9 95,3 86,1 77,1 68,1 59,0 49,6
0,4 155,5 139,7 125,2 111,5 98,2 85,1 72,0 58,6
0,2 276,3 243,9 214,2 186,4 159,8 134,1 108,9 83,7
0,1 0,2 0,3 0,4 0,5 0,6 0,7 0,8
Space heating share [-]
Plo
t ra
tio
[-]
LCOH-LTDH_GWHP [€/MWhh]
2,0 48,9 46,2 43,8 41,3 38,7 35,9 33,0 29,7
1,8 51,4 48,4 45,8 43,1 40,2 37,2 34,0 30,4
1,6 54,4 51,1 48,2 45,2 42,1 38,8 35,2 31,3
1,4 58,1 54,5 51,2 47,9 44,4 40,8 36,8 32,5
1,2 62,9 58,9 55,2 51,4 47,4 43,3 38,8 34,0
1,0 69,5 64,8 60,4 56,0 51,5 46,6 41,5 35,9
0,8 78,8 73,2 68,0 62,7 57,2 51,5 45,4 38,7
0,6 93,7 86,6 80,0 73,2 66,3 59,1 51,4 43,1
0,4 121,5 111,7 102,3 92,8 83,1 73,1 62,5 51,1
0,2 197,7 179,9 162,8 145,8 128,5 110,7 92,1 72,3
0,1 0,2 0,3 0,4 0,5 0,6 0,7 0,8
Space heating share [-]
Plo
t ra
tio
[-]
LCOH-LTDH_EH1HP [€/MWhh]
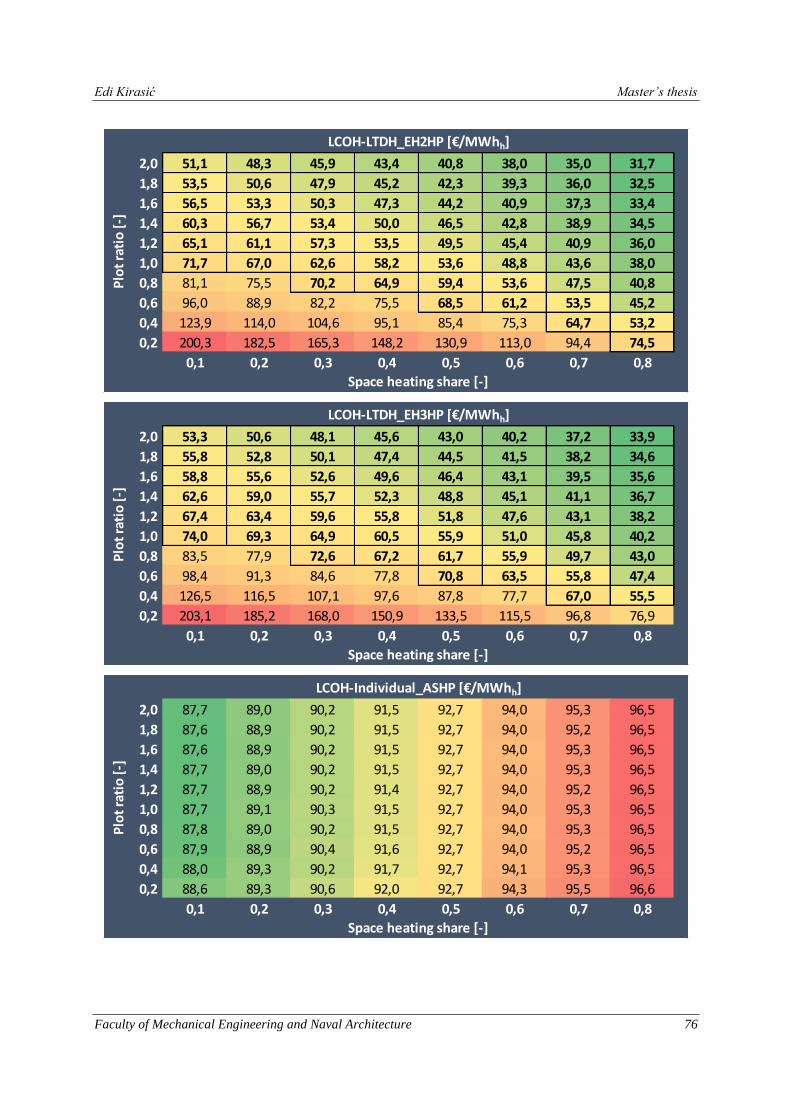
Edi Kirasić Master’s thesis
Faculty of Mechanical Engineering and Naval Architecture 76
2,0 51,1 48,3 45,9 43,4 40,8 38,0 35,0 31,7
1,8 53,5 50,6 47,9 45,2 42,3 39,3 36,0 32,5
1,6 56,5 53,3 50,3 47,3 44,2 40,9 37,3 33,4
1,4 60,3 56,7 53,4 50,0 46,5 42,8 38,9 34,5
1,2 65,1 61,1 57,3 53,5 49,5 45,4 40,9 36,0
1,0 71,7 67,0 62,6 58,2 53,6 48,8 43,6 38,0
0,8 81,1 75,5 70,2 64,9 59,4 53,6 47,5 40,8
0,6 96,0 88,9 82,2 75,5 68,5 61,2 53,5 45,2
0,4 123,9 114,0 104,6 95,1 85,4 75,3 64,7 53,2
0,2 200,3 182,5 165,3 148,2 130,9 113,0 94,4 74,5
0,1 0,2 0,3 0,4 0,5 0,6 0,7 0,8
Space heating share [-]
Plo
t ra
tio
[-]
LCOH-LTDH_EH2HP [€/MWhh]
2,0 53,3 50,6 48,1 45,6 43,0 40,2 37,2 33,9
1,8 55,8 52,8 50,1 47,4 44,5 41,5 38,2 34,6
1,6 58,8 55,6 52,6 49,6 46,4 43,1 39,5 35,6
1,4 62,6 59,0 55,7 52,3 48,8 45,1 41,1 36,7
1,2 67,4 63,4 59,6 55,8 51,8 47,6 43,1 38,2
1,0 74,0 69,3 64,9 60,5 55,9 51,0 45,8 40,2
0,8 83,5 77,9 72,6 67,2 61,7 55,9 49,7 43,0
0,6 98,4 91,3 84,6 77,8 70,8 63,5 55,8 47,4
0,4 126,5 116,5 107,1 97,6 87,8 77,7 67,0 55,5
0,2 203,1 185,2 168,0 150,9 133,5 115,5 96,8 76,9
0,1 0,2 0,3 0,4 0,5 0,6 0,7 0,8
Space heating share [-]
Plo
t ra
tio
[-]
LCOH-LTDH_EH3HP [€/MWhh]
2,0 87,7 89,0 90,2 91,5 92,7 94,0 95,3 96,5
1,8 87,6 88,9 90,2 91,5 92,7 94,0 95,2 96,5
1,6 87,6 88,9 90,2 91,5 92,7 94,0 95,3 96,5
1,4 87,7 89,0 90,2 91,5 92,7 94,0 95,3 96,5
1,2 87,7 88,9 90,2 91,4 92,7 94,0 95,2 96,5
1,0 87,7 89,1 90,3 91,5 92,7 94,0 95,3 96,5
0,8 87,8 89,0 90,2 91,5 92,7 94,0 95,3 96,5
0,6 87,9 88,9 90,4 91,6 92,7 94,0 95,2 96,5
0,4 88,0 89,3 90,2 91,7 92,7 94,1 95,3 96,5
0,2 88,6 89,3 90,6 92,0 92,7 94,3 95,5 96,6
0,1 0,2 0,3 0,4 0,5 0,6 0,7 0,8
LCOH-Individual_ASHP [€/MWhh]
Plo
t ra
tio
[-]
Space heating share [-]
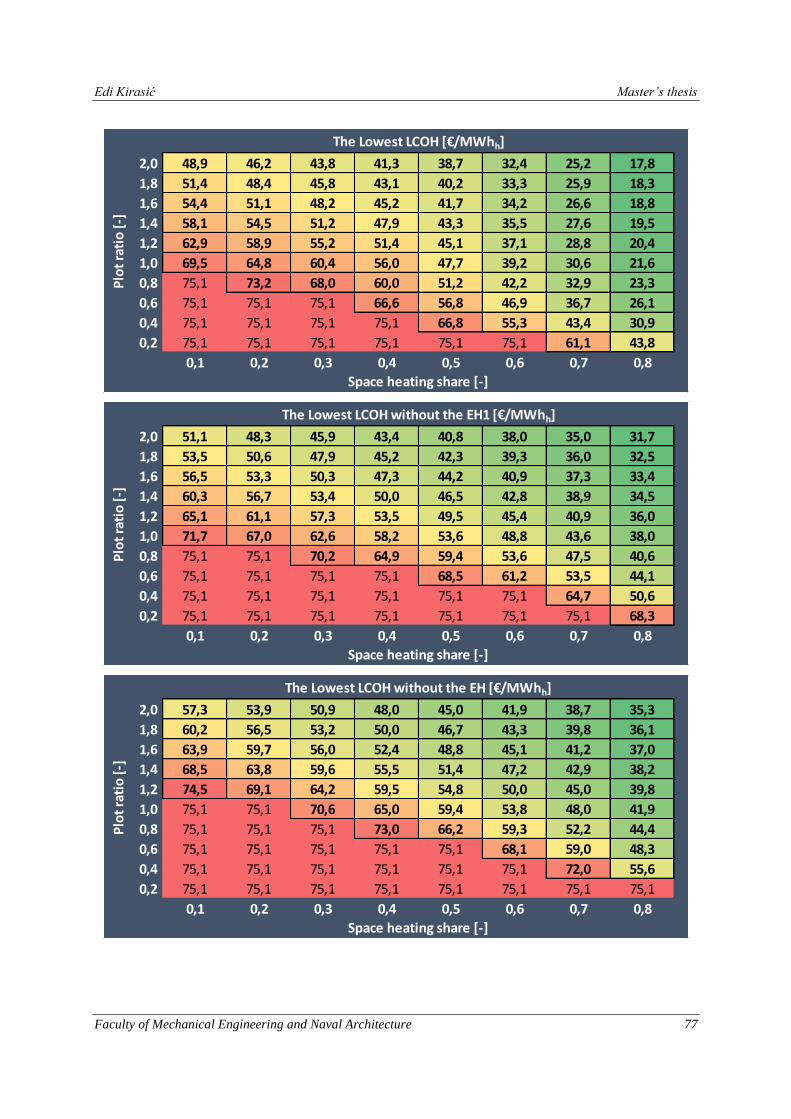
Edi Kirasić Master’s thesis
Faculty of Mechanical Engineering and Naval Architecture 77
2,0 48,9 46,2 43,8 41,3 38,7 32,4 25,2 17,8
1,8 51,4 48,4 45,8 43,1 40,2 33,3 25,9 18,3
1,6 54,4 51,1 48,2 45,2 41,7 34,2 26,6 18,8
1,4 58,1 54,5 51,2 47,9 43,3 35,5 27,6 19,5
1,2 62,9 58,9 55,2 51,4 45,1 37,1 28,8 20,4
1,0 69,5 64,8 60,4 56,0 47,7 39,2 30,6 21,6
0,8 75,1 73,2 68,0 60,0 51,2 42,2 32,9 23,3
0,6 75,1 75,1 75,1 66,6 56,8 46,9 36,7 26,1
0,4 75,1 75,1 75,1 75,1 66,8 55,3 43,4 30,9
0,2 75,1 75,1 75,1 75,1 75,1 75,1 61,1 43,8
0,1 0,2 0,3 0,4 0,5 0,6 0,7 0,8
Space heating share [-]
Plo
t ra
tio
[-]
The Lowest LCOH [€/MWhh]
2,0 51,1 48,3 45,9 43,4 40,8 38,0 35,0 31,7
1,8 53,5 50,6 47,9 45,2 42,3 39,3 36,0 32,5
1,6 56,5 53,3 50,3 47,3 44,2 40,9 37,3 33,4
1,4 60,3 56,7 53,4 50,0 46,5 42,8 38,9 34,5
1,2 65,1 61,1 57,3 53,5 49,5 45,4 40,9 36,0
1,0 71,7 67,0 62,6 58,2 53,6 48,8 43,6 38,0
0,8 75,1 75,1 70,2 64,9 59,4 53,6 47,5 40,6
0,6 75,1 75,1 75,1 75,1 68,5 61,2 53,5 44,1
0,4 75,1 75,1 75,1 75,1 75,1 75,1 64,7 50,6
0,2 75,1 75,1 75,1 75,1 75,1 75,1 75,1 68,3
0,1 0,2 0,3 0,4 0,5 0,6 0,7 0,8
The Lowest LCOH without the EH1 [€/MWhh]
Plo
t ra
tio
[-]
Space heating share [-]
2,0 57,3 53,9 50,9 48,0 45,0 41,9 38,7 35,3
1,8 60,2 56,5 53,2 50,0 46,7 43,3 39,8 36,1
1,6 63,9 59,7 56,0 52,4 48,8 45,1 41,2 37,0
1,4 68,5 63,8 59,6 55,5 51,4 47,2 42,9 38,2
1,2 74,5 69,1 64,2 59,5 54,8 50,0 45,0 39,8
1,0 75,1 75,1 70,6 65,0 59,4 53,8 48,0 41,9
0,8 75,1 75,1 75,1 73,0 66,2 59,3 52,2 44,4
0,6 75,1 75,1 75,1 75,1 75,1 68,1 59,0 48,3
0,4 75,1 75,1 75,1 75,1 75,1 75,1 72,0 55,6
0,2 75,1 75,1 75,1 75,1 75,1 75,1 75,1 75,1
0,1 0,2 0,3 0,4 0,5 0,6 0,7 0,8
Plo
t ra
tio
[-]
Space heating share [-]
The Lowest LCOH without the EH [€/MWhh]

Edi Kirasić Master’s thesis
Faculty of Mechanical Engineering and Naval Architecture 78
2,0 0,495 0,498 0,502 0,505 0,508 0,511 0,514 0,517
1,8 0,496 0,499 0,503 0,506 0,509 0,512 0,515 0,517
1,6 0,498 0,501 0,504 0,507 0,510 0,513 0,515 0,517
1,4 0,500 0,503 0,506 0,509 0,511 0,514 0,516 0,518
1,2 0,502 0,505 0,508 0,510 0,513 0,515 0,517 0,519
1,0 0,505 0,508 0,510 0,513 0,515 0,517 0,519 0,520
0,8 0,509 0,512 0,514 0,516 0,518 0,519 0,521 0,521
0,6 0,516 0,518 0,519 0,521 0,522 0,523 0,524 0,524
0,4 0,527 0,528 0,529 0,529 0,529 0,529 0,529 0,528
0,2 0,553 0,552 0,551 0,549 0,547 0,544 0,541 0,537
0,1 0,2 0,3 0,4 0,5 0,6 0,7 0,8
Space heating share [-]
Primary energy factor-ULTDH_Air_ASHP [MWh/MWhh]
Plo
t ra
tio
[-]
2,0 0,473 0,458 0,443 0,428 0,413 0,398 0,382 0,367
1,8 0,474 0,459 0,444 0,429 0,414 0,398 0,383 0,367
1,6 0,475 0,460 0,445 0,430 0,414 0,399 0,383 0,367
1,4 0,477 0,462 0,446 0,431 0,416 0,400 0,384 0,368
1,2 0,479 0,463 0,448 0,432 0,417 0,401 0,385 0,369
1,0 0,481 0,466 0,450 0,434 0,419 0,402 0,386 0,369
0,8 0,485 0,469 0,453 0,437 0,421 0,405 0,388 0,371
0,6 0,491 0,474 0,458 0,441 0,425 0,408 0,390 0,372
0,4 0,500 0,483 0,466 0,448 0,431 0,413 0,395 0,376
0,2 0,522 0,503 0,484 0,465 0,446 0,426 0,405 0,384
0,1 0,2 0,3 0,4 0,5 0,6 0,7 0,8
Space heating share [-]
Primary energy factor-ULTDH_Air_GWHP [MWh/MWhh]
Plo
t ra
tio
[-]
2,0 0,422 0,376 0,331 0,285 0,239 0,194 0,148 0,103
1,8 0,422 0,376 0,330 0,285 0,239 0,194 0,148 0,103
1,6 0,421 0,376 0,330 0,285 0,239 0,194 0,148 0,103
1,4 0,421 0,376 0,330 0,285 0,239 0,194 0,148 0,103
1,2 0,421 0,376 0,330 0,285 0,239 0,194 0,148 0,102
1,0 0,421 0,376 0,330 0,285 0,239 0,193 0,148 0,102
0,8 0,421 0,376 0,330 0,284 0,239 0,193 0,148 0,102
0,6 0,421 0,376 0,330 0,284 0,239 0,193 0,148 0,102
0,4 0,421 0,375 0,330 0,284 0,239 0,193 0,147 0,102
0,2 0,421 0,376 0,330 0,284 0,238 0,193 0,147 0,101
0,1 0,2 0,3 0,4 0,5 0,6 0,7 0,8
Space heating share [-]
Primary energy factor-ULTDH_Air_EH1HEX [MWh/MWhh]
Plo
t ra
tio
[-]
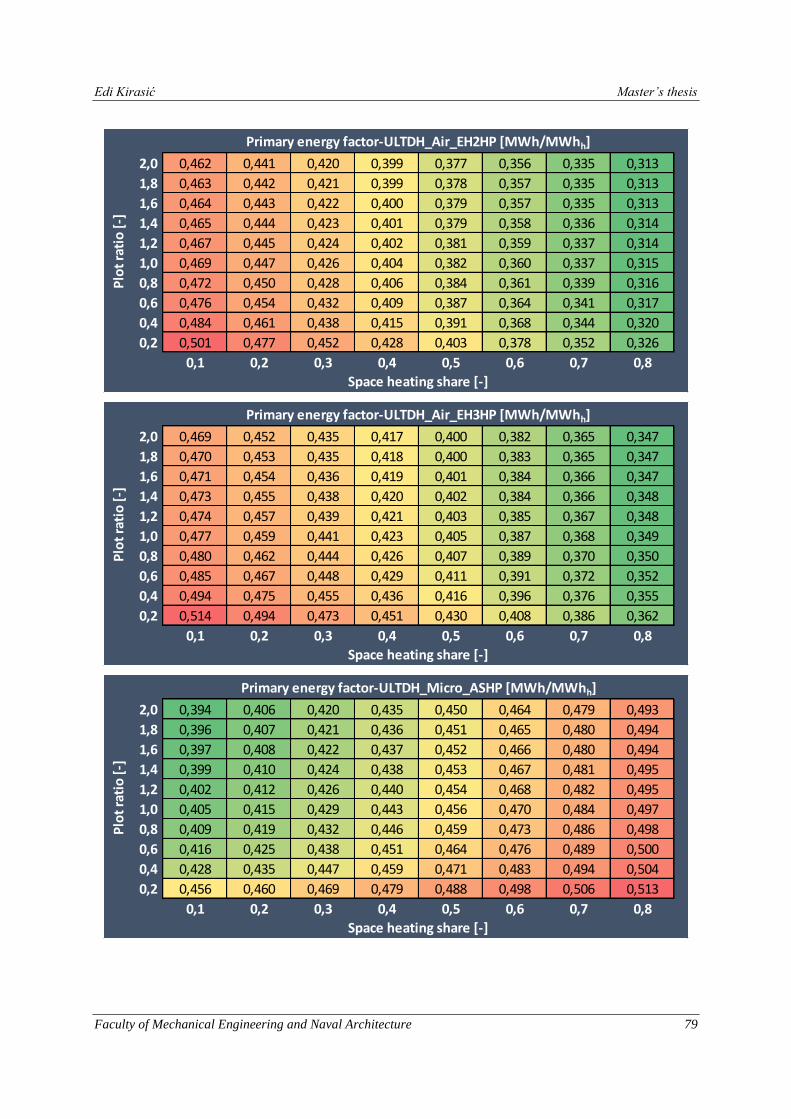
Edi Kirasić Master’s thesis
Faculty of Mechanical Engineering and Naval Architecture 79
2,0 0,462 0,441 0,420 0,399 0,377 0,356 0,335 0,313
1,8 0,463 0,442 0,421 0,399 0,378 0,357 0,335 0,313
1,6 0,464 0,443 0,422 0,400 0,379 0,357 0,335 0,313
1,4 0,465 0,444 0,423 0,401 0,379 0,358 0,336 0,314
1,2 0,467 0,445 0,424 0,402 0,381 0,359 0,337 0,314
1,0 0,469 0,447 0,426 0,404 0,382 0,360 0,337 0,315
0,8 0,472 0,450 0,428 0,406 0,384 0,361 0,339 0,316
0,6 0,476 0,454 0,432 0,409 0,387 0,364 0,341 0,317
0,4 0,484 0,461 0,438 0,415 0,391 0,368 0,344 0,320
0,2 0,501 0,477 0,452 0,428 0,403 0,378 0,352 0,326
0,1 0,2 0,3 0,4 0,5 0,6 0,7 0,8
Space heating share [-]
Primary energy factor-ULTDH_Air_EH2HP [MWh/MWhh]
Plo
t ra
tio
[-]
2,0 0,469 0,452 0,435 0,417 0,400 0,382 0,365 0,347
1,8 0,470 0,453 0,435 0,418 0,400 0,383 0,365 0,347
1,6 0,471 0,454 0,436 0,419 0,401 0,384 0,366 0,347
1,4 0,473 0,455 0,438 0,420 0,402 0,384 0,366 0,348
1,2 0,474 0,457 0,439 0,421 0,403 0,385 0,367 0,348
1,0 0,477 0,459 0,441 0,423 0,405 0,387 0,368 0,349
0,8 0,480 0,462 0,444 0,426 0,407 0,389 0,370 0,350
0,6 0,485 0,467 0,448 0,429 0,411 0,391 0,372 0,352
0,4 0,494 0,475 0,455 0,436 0,416 0,396 0,376 0,355
0,2 0,514 0,494 0,473 0,451 0,430 0,408 0,386 0,362
0,1 0,2 0,3 0,4 0,5 0,6 0,7 0,8
Space heating share [-]
Primary energy factor-ULTDH_Air_EH3HP [MWh/MWhh]
Plo
t ra
tio
[-]
2,0 0,394 0,406 0,420 0,435 0,450 0,464 0,479 0,493
1,8 0,396 0,407 0,421 0,436 0,451 0,465 0,480 0,494
1,6 0,397 0,408 0,422 0,437 0,452 0,466 0,480 0,494
1,4 0,399 0,410 0,424 0,438 0,453 0,467 0,481 0,495
1,2 0,402 0,412 0,426 0,440 0,454 0,468 0,482 0,495
1,0 0,405 0,415 0,429 0,443 0,456 0,470 0,484 0,497
0,8 0,409 0,419 0,432 0,446 0,459 0,473 0,486 0,498
0,6 0,416 0,425 0,438 0,451 0,464 0,476 0,489 0,500
0,4 0,428 0,435 0,447 0,459 0,471 0,483 0,494 0,504
0,2 0,456 0,460 0,469 0,479 0,488 0,498 0,506 0,513
0,1 0,2 0,3 0,4 0,5 0,6 0,7 0,8
Space heating share [-]
Plo
t ra
tio
[-]
Primary energy factor-ULTDH_Micro_ASHP [MWh/MWhh]

Edi Kirasić Master’s thesis
Faculty of Mechanical Engineering and Naval Architecture 80
2,0 0,337 0,334 0,334 0,334 0,335 0,335 0,335 0,335
1,8 0,339 0,335 0,334 0,335 0,335 0,336 0,336 0,336
1,6 0,340 0,336 0,336 0,336 0,336 0,336 0,336 0,336
1,4 0,342 0,337 0,337 0,337 0,337 0,337 0,337 0,337
1,2 0,344 0,339 0,339 0,338 0,338 0,338 0,338 0,337
1,0 0,347 0,342 0,341 0,340 0,340 0,340 0,339 0,338
0,8 0,351 0,345 0,344 0,343 0,343 0,342 0,341 0,339
0,6 0,356 0,350 0,348 0,347 0,346 0,345 0,343 0,341
0,4 0,367 0,359 0,356 0,354 0,352 0,350 0,348 0,344
0,2 0,391 0,380 0,375 0,371 0,367 0,363 0,358 0,352
0,1 0,2 0,3 0,4 0,5 0,6 0,7 0,8
Space heating share [-]
Plo
t ra
tio
[-]
Primary energy factor-ULTDH_Micro_GWHP [MWh/MWhh]
2,0 0,041 0,032 0,029 0,026 0,024 0,021 0,019 0,017
1,8 0,041 0,032 0,029 0,026 0,024 0,021 0,019 0,017
1,6 0,041 0,032 0,029 0,026 0,024 0,021 0,019 0,016
1,4 0,041 0,032 0,029 0,026 0,024 0,021 0,019 0,016
1,2 0,041 0,032 0,029 0,026 0,024 0,021 0,019 0,016
1,0 0,041 0,032 0,029 0,026 0,023 0,021 0,018 0,016
0,8 0,041 0,032 0,029 0,026 0,023 0,021 0,018 0,016
0,6 0,042 0,032 0,028 0,026 0,023 0,021 0,018 0,016
0,4 0,043 0,032 0,028 0,026 0,023 0,020 0,018 0,015
0,2 0,045 0,033 0,028 0,026 0,023 0,020 0,018 0,015
0,1 0,2 0,3 0,4 0,5 0,6 0,7 0,8
Space heating share [-]
Plo
t ra
tio
[-]
Primary energy factor-ULTDH_Micro_EH1HEX [MWh/MWhh]
2,0 0,275 0,270 0,270 0,270 0,270 0,270 0,270 0,270
1,8 0,276 0,271 0,271 0,271 0,271 0,271 0,271 0,270
1,6 0,277 0,272 0,272 0,271 0,271 0,271 0,271 0,270
1,4 0,278 0,273 0,273 0,272 0,272 0,272 0,271 0,271
1,2 0,280 0,275 0,274 0,274 0,273 0,273 0,272 0,271
1,0 0,282 0,277 0,276 0,275 0,275 0,274 0,273 0,272
0,8 0,286 0,279 0,278 0,277 0,276 0,275 0,274 0,273
0,6 0,290 0,283 0,282 0,280 0,279 0,278 0,276 0,274
0,4 0,298 0,290 0,288 0,286 0,284 0,282 0,280 0,277
0,2 0,318 0,307 0,303 0,299 0,296 0,292 0,288 0,283
0,1 0,2 0,3 0,4 0,5 0,6 0,7 0,8
Space heating share [-]
Plo
t ra
tio
[-]
Primary energy factor-ULTDH_Micro_EH2HP [MWh/MWhh]

Edi Kirasić Master’s thesis
Faculty of Mechanical Engineering and Naval Architecture 81
2,0 0,315 0,310 0,310 0,311 0,311 0,311 0,311 0,311
1,8 0,316 0,311 0,311 0,311 0,312 0,312 0,312 0,311
1,6 0,317 0,312 0,312 0,312 0,312 0,312 0,312 0,312
1,4 0,319 0,314 0,313 0,313 0,313 0,313 0,313 0,312
1,2 0,321 0,316 0,315 0,315 0,314 0,314 0,314 0,313
1,0 0,323 0,318 0,317 0,316 0,316 0,315 0,315 0,314
0,8 0,327 0,321 0,320 0,319 0,318 0,317 0,316 0,315
0,6 0,332 0,326 0,324 0,323 0,322 0,320 0,319 0,316
0,4 0,342 0,334 0,331 0,329 0,327 0,325 0,323 0,319
0,2 0,364 0,353 0,348 0,345 0,341 0,337 0,332 0,327
0,1 0,2 0,3 0,4 0,5 0,6 0,7 0,8
Space heating share [-]
Plo
t ra
tio
[-]
Primary energy factor-ULTDH_Micro_EH3HP [MWh/MWhh]
2,0 0,394 0,406 0,420 0,435 0,450 0,464 0,479 0,493
1,8 0,396 0,407 0,421 0,436 0,451 0,465 0,480 0,494
1,6 0,397 0,408 0,422 0,437 0,452 0,466 0,480 0,494
1,4 0,399 0,410 0,424 0,438 0,453 0,467 0,481 0,495
1,2 0,402 0,412 0,426 0,440 0,454 0,468 0,482 0,495
1,0 0,405 0,415 0,429 0,443 0,456 0,470 0,484 0,497
0,8 0,409 0,419 0,432 0,446 0,459 0,473 0,486 0,498
0,6 0,416 0,425 0,438 0,451 0,464 0,476 0,489 0,500
0,4 0,428 0,435 0,447 0,459 0,471 0,483 0,494 0,504
0,2 0,456 0,460 0,469 0,479 0,488 0,498 0,506 0,513
0,1 0,2 0,3 0,4 0,5 0,6 0,7 0,8
Space heating share [-]
Plo
t ra
tio
[-]
Primary energy factor-ULTDH_Booster_ASHP [MWh/MWhh]
2,0 0,337 0,334 0,334 0,334 0,335 0,335 0,335 0,335
1,8 0,339 0,335 0,334 0,335 0,335 0,336 0,336 0,336
1,6 0,340 0,336 0,336 0,336 0,336 0,336 0,336 0,336
1,4 0,342 0,337 0,337 0,337 0,337 0,337 0,337 0,337
1,2 0,344 0,339 0,339 0,338 0,338 0,338 0,338 0,337
1,0 0,347 0,342 0,341 0,340 0,340 0,340 0,339 0,338
0,8 0,351 0,345 0,344 0,343 0,343 0,342 0,341 0,339
0,6 0,356 0,350 0,348 0,347 0,346 0,345 0,343 0,341
0,4 0,367 0,359 0,356 0,354 0,352 0,350 0,348 0,344
0,2 0,391 0,380 0,375 0,371 0,367 0,363 0,358 0,352
0,1 0,2 0,3 0,4 0,5 0,6 0,7 0,8
Space heating share [-]
Plo
t ra
tio
[-]
Primary energy factor-ULTDH_Booster_GWHP [MWh/MWhh]

Edi Kirasić Master’s thesis
Faculty of Mechanical Engineering and Naval Architecture 82
2,0 0,041 0,032 0,029 0,026 0,024 0,021 0,019 0,017
1,8 0,041 0,032 0,029 0,026 0,024 0,021 0,019 0,017
1,6 0,041 0,032 0,029 0,026 0,024 0,021 0,019 0,016
1,4 0,041 0,032 0,029 0,026 0,024 0,021 0,019 0,016
1,2 0,041 0,032 0,029 0,026 0,024 0,021 0,019 0,016
1,0 0,041 0,032 0,029 0,026 0,023 0,021 0,018 0,016
0,8 0,041 0,032 0,029 0,026 0,023 0,021 0,018 0,016
0,6 0,042 0,032 0,028 0,026 0,023 0,021 0,018 0,016
0,4 0,043 0,032 0,028 0,026 0,023 0,020 0,018 0,015
0,2 0,045 0,033 0,028 0,026 0,023 0,020 0,018 0,015
0,1 0,2 0,3 0,4 0,5 0,6 0,7 0,8
Space heating share [-]
Plo
t ra
tio
[-]
Primary energy factor-ULTDH_Booster_EH1HEX [MWh/MWhh]
2,0 0,275 0,270 0,270 0,270 0,270 0,270 0,270 0,270
1,8 0,276 0,271 0,271 0,271 0,271 0,271 0,271 0,270
1,6 0,277 0,272 0,272 0,271 0,271 0,271 0,271 0,270
1,4 0,278 0,273 0,273 0,272 0,272 0,272 0,271 0,271
1,2 0,280 0,275 0,274 0,274 0,273 0,273 0,272 0,271
1,0 0,282 0,277 0,276 0,275 0,275 0,274 0,273 0,272
0,8 0,286 0,279 0,278 0,277 0,276 0,275 0,274 0,273
0,6 0,290 0,283 0,282 0,280 0,279 0,278 0,276 0,274
0,4 0,298 0,290 0,288 0,286 0,284 0,282 0,280 0,277
0,2 0,318 0,307 0,303 0,299 0,296 0,292 0,288 0,283
0,1 0,2 0,3 0,4 0,5 0,6 0,7 0,8
Space heating share [-]
Plo
t ra
tio
[-]
Primary energy factor-ULTDH_Booster_EH2HP [MWh/MWhh]
2,0 0,315 0,310 0,310 0,311 0,311 0,311 0,311 0,311
1,8 0,316 0,311 0,311 0,311 0,312 0,312 0,312 0,311
1,6 0,317 0,312 0,312 0,312 0,312 0,312 0,312 0,312
1,4 0,319 0,314 0,313 0,313 0,313 0,313 0,313 0,312
1,2 0,321 0,316 0,315 0,315 0,314 0,314 0,314 0,313
1,0 0,323 0,318 0,317 0,316 0,316 0,315 0,315 0,314
0,8 0,327 0,321 0,320 0,319 0,318 0,317 0,316 0,315
0,6 0,332 0,326 0,324 0,323 0,322 0,320 0,319 0,316
0,4 0,342 0,334 0,331 0,329 0,327 0,325 0,323 0,319
0,2 0,364 0,353 0,348 0,345 0,341 0,337 0,332 0,327
0,1 0,2 0,3 0,4 0,5 0,6 0,7 0,8
Space heating share [-]
Plo
t ra
tio
[-]
Primary energy factor-ULTDH_Booster_EH3HP [MWh/MWhh]

Edi Kirasić Master’s thesis
Faculty of Mechanical Engineering and Naval Architecture 83
2,0 0,559 0,568 0,581 0,596 0,610 0,624 0,637 0,650
1,8 0,562 0,570 0,584 0,598 0,612 0,625 0,639 0,651
1,6 0,565 0,573 0,587 0,600 0,614 0,627 0,640 0,653
1,4 0,570 0,577 0,590 0,604 0,617 0,630 0,642 0,654
1,2 0,575 0,582 0,594 0,607 0,620 0,633 0,645 0,656
1,0 0,582 0,589 0,600 0,613 0,625 0,637 0,648 0,658
0,8 0,592 0,597 0,608 0,620 0,631 0,642 0,653 0,662
0,6 0,607 0,610 0,620 0,630 0,641 0,650 0,659 0,667
0,4 0,632 0,632 0,640 0,648 0,657 0,664 0,671 0,676
0,2 0,691 0,685 0,687 0,691 0,694 0,696 0,697 0,696
0,1 0,2 0,3 0,4 0,5 0,6 0,7 0,8
Plo
t ra
tio
[-]
Space heating share [-]
Primary energy factor-LTDH_ASHP [MWh/MWhh]
2,0 0,465 0,455 0,452 0,449 0,447 0,445 0,442 0,438
1,8 0,468 0,457 0,454 0,451 0,449 0,446 0,443 0,439
1,6 0,471 0,460 0,456 0,453 0,451 0,448 0,444 0,440
1,4 0,475 0,463 0,459 0,456 0,453 0,450 0,446 0,442
1,2 0,479 0,467 0,463 0,459 0,456 0,452 0,448 0,443
1,0 0,485 0,473 0,467 0,464 0,460 0,455 0,451 0,445
0,8 0,494 0,480 0,474 0,469 0,465 0,460 0,454 0,448
0,6 0,506 0,491 0,484 0,478 0,473 0,466 0,460 0,452
0,4 0,528 0,509 0,500 0,493 0,486 0,478 0,469 0,459
0,2 0,579 0,553 0,539 0,528 0,517 0,505 0,491 0,476
0,1 0,2 0,3 0,4 0,5 0,6 0,7 0,8
Plo
t ra
tio
[-]
Space heating share [-]
Primary energy factor-LTDH_GWHP [MWh/MWhh]
2,0 0,349 0,339 0,336 0,334 0,333 0,331 0,329 0,327
1,8 0,351 0,341 0,338 0,336 0,334 0,332 0,330 0,327
1,6 0,353 0,343 0,339 0,337 0,335 0,333 0,331 0,328
1,4 0,356 0,345 0,341 0,339 0,337 0,335 0,332 0,329
1,2 0,360 0,348 0,344 0,342 0,339 0,337 0,334 0,330
1,0 0,365 0,352 0,348 0,345 0,342 0,339 0,336 0,332
0,8 0,371 0,358 0,352 0,349 0,346 0,342 0,338 0,334
0,6 0,381 0,366 0,360 0,356 0,352 0,347 0,342 0,337
0,4 0,397 0,380 0,372 0,367 0,361 0,356 0,349 0,342
0,2 0,437 0,413 0,401 0,393 0,384 0,375 0,366 0,355
0,1 0,2 0,3 0,4 0,5 0,6 0,7 0,8
Plo
t ra
tio
[-]
Space heating share [-]
Primary energy factor-LTDH_EH1HP [MWh/MWhh]
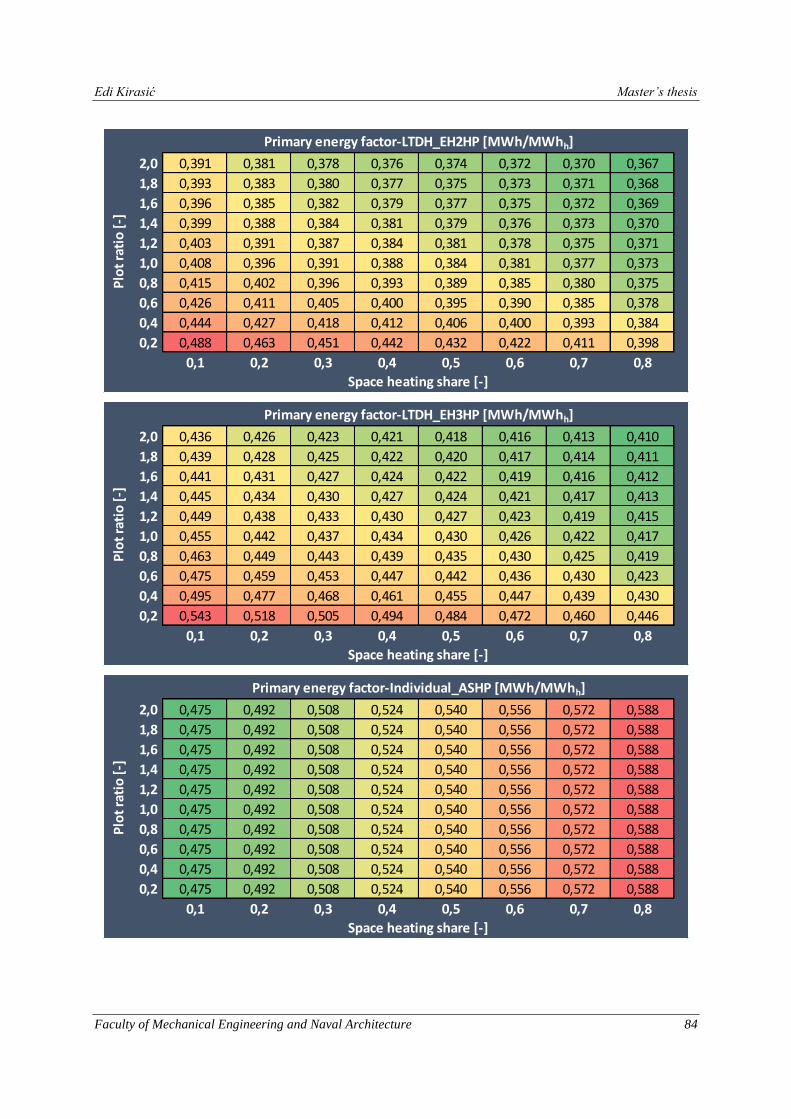
Edi Kirasić Master’s thesis
Faculty of Mechanical Engineering and Naval Architecture 84
2,0 0,391 0,381 0,378 0,376 0,374 0,372 0,370 0,367
1,8 0,393 0,383 0,380 0,377 0,375 0,373 0,371 0,368
1,6 0,396 0,385 0,382 0,379 0,377 0,375 0,372 0,369
1,4 0,399 0,388 0,384 0,381 0,379 0,376 0,373 0,370
1,2 0,403 0,391 0,387 0,384 0,381 0,378 0,375 0,371
1,0 0,408 0,396 0,391 0,388 0,384 0,381 0,377 0,373
0,8 0,415 0,402 0,396 0,393 0,389 0,385 0,380 0,375
0,6 0,426 0,411 0,405 0,400 0,395 0,390 0,385 0,378
0,4 0,444 0,427 0,418 0,412 0,406 0,400 0,393 0,384
0,2 0,488 0,463 0,451 0,442 0,432 0,422 0,411 0,398
0,1 0,2 0,3 0,4 0,5 0,6 0,7 0,8
Plo
t ra
tio
[-]
Space heating share [-]
Primary energy factor-LTDH_EH2HP [MWh/MWhh]
2,0 0,436 0,426 0,423 0,421 0,418 0,416 0,413 0,410
1,8 0,439 0,428 0,425 0,422 0,420 0,417 0,414 0,411
1,6 0,441 0,431 0,427 0,424 0,422 0,419 0,416 0,412
1,4 0,445 0,434 0,430 0,427 0,424 0,421 0,417 0,413
1,2 0,449 0,438 0,433 0,430 0,427 0,423 0,419 0,415
1,0 0,455 0,442 0,437 0,434 0,430 0,426 0,422 0,417
0,8 0,463 0,449 0,443 0,439 0,435 0,430 0,425 0,419
0,6 0,475 0,459 0,453 0,447 0,442 0,436 0,430 0,423
0,4 0,495 0,477 0,468 0,461 0,455 0,447 0,439 0,430
0,2 0,543 0,518 0,505 0,494 0,484 0,472 0,460 0,446
0,1 0,2 0,3 0,4 0,5 0,6 0,7 0,8
Space heating share [-]
Plo
t ra
tio
[-]
Primary energy factor-LTDH_EH3HP [MWh/MWhh]
2,0 0,475 0,492 0,508 0,524 0,540 0,556 0,572 0,588
1,8 0,475 0,492 0,508 0,524 0,540 0,556 0,572 0,588
1,6 0,475 0,492 0,508 0,524 0,540 0,556 0,572 0,588
1,4 0,475 0,492 0,508 0,524 0,540 0,556 0,572 0,588
1,2 0,475 0,492 0,508 0,524 0,540 0,556 0,572 0,588
1,0 0,475 0,492 0,508 0,524 0,540 0,556 0,572 0,588
0,8 0,475 0,492 0,508 0,524 0,540 0,556 0,572 0,588
0,6 0,475 0,492 0,508 0,524 0,540 0,556 0,572 0,588
0,4 0,475 0,492 0,508 0,524 0,540 0,556 0,572 0,588
0,2 0,475 0,492 0,508 0,524 0,540 0,556 0,572 0,588
0,1 0,2 0,3 0,4 0,5 0,6 0,7 0,8
Primary energy factor-Individual_ASHP [MWh/MWhh]
Plo
t ra
tio
[-]
Space heating share [-]

Edi Kirasić Master’s thesis
Faculty of Mechanical Engineering and Naval Architecture 85
2,0 0,041 0,032 0,029 0,026 0,024 0,021 0,019 0,017
1,8 0,041 0,032 0,029 0,026 0,024 0,021 0,019 0,017
1,6 0,041 0,032 0,029 0,026 0,024 0,021 0,019 0,016
1,4 0,041 0,032 0,029 0,026 0,024 0,021 0,019 0,016
1,2 0,041 0,032 0,029 0,026 0,024 0,021 0,019 0,016
1,0 0,041 0,032 0,029 0,026 0,023 0,021 0,018 0,016
0,8 0,041 0,032 0,029 0,026 0,023 0,021 0,018 0,016
0,6 0,042 0,032 0,028 0,026 0,023 0,021 0,018 0,016
0,4 0,043 0,032 0,028 0,026 0,023 0,020 0,018 0,015
0,2 0,045 0,033 0,028 0,026 0,023 0,020 0,018 0,015
0,1 0,2 0,3 0,4 0,5 0,6 0,7 0,8
Space heating share [-]
The Lowest Primary energy factor [MWh/MWhh]
Plo
t ra
tio
[-]
2,0 0,275 0,270 0,270 0,270 0,270 0,270 0,270 0,270
1,8 0,276 0,271 0,271 0,271 0,271 0,271 0,271 0,270
1,6 0,277 0,272 0,272 0,271 0,271 0,271 0,271 0,270
1,4 0,278 0,273 0,273 0,272 0,272 0,272 0,271 0,271
1,2 0,280 0,275 0,274 0,274 0,273 0,273 0,272 0,271
1,0 0,282 0,277 0,276 0,275 0,275 0,274 0,273 0,272
0,8 0,286 0,279 0,278 0,277 0,276 0,275 0,274 0,273
0,6 0,290 0,283 0,282 0,280 0,279 0,278 0,276 0,274
0,4 0,298 0,290 0,288 0,286 0,284 0,282 0,280 0,277
0,2 0,318 0,307 0,303 0,299 0,296 0,292 0,288 0,283
0,1 0,2 0,3 0,4 0,5 0,6 0,7 0,8
Space heating share [-]
The Lowest Primary energy factor without the EH1 [MWh/MWhh]
Plo
t ra
tio
[-]
2,0 0,337 0,334 0,334 0,334 0,335 0,335 0,335 0,335
1,8 0,339 0,335 0,334 0,335 0,335 0,336 0,336 0,336
1,6 0,340 0,336 0,336 0,336 0,336 0,336 0,336 0,336
1,4 0,342 0,337 0,337 0,337 0,337 0,337 0,337 0,337
1,2 0,344 0,339 0,339 0,338 0,338 0,338 0,338 0,337
1,0 0,347 0,342 0,341 0,340 0,340 0,340 0,339 0,338
0,8 0,351 0,345 0,344 0,343 0,343 0,342 0,341 0,339
0,6 0,356 0,350 0,348 0,347 0,346 0,345 0,343 0,341
0,4 0,367 0,359 0,356 0,354 0,352 0,350 0,348 0,344
0,2 0,391 0,380 0,375 0,371 0,367 0,363 0,358 0,352
0,1 0,2 0,3 0,4 0,5 0,6 0,7 0,8
Space heating share [-]
The Lowest Primary energy factor without the EH [MWh/MWhh]
Plo
t ra
tio
[-]
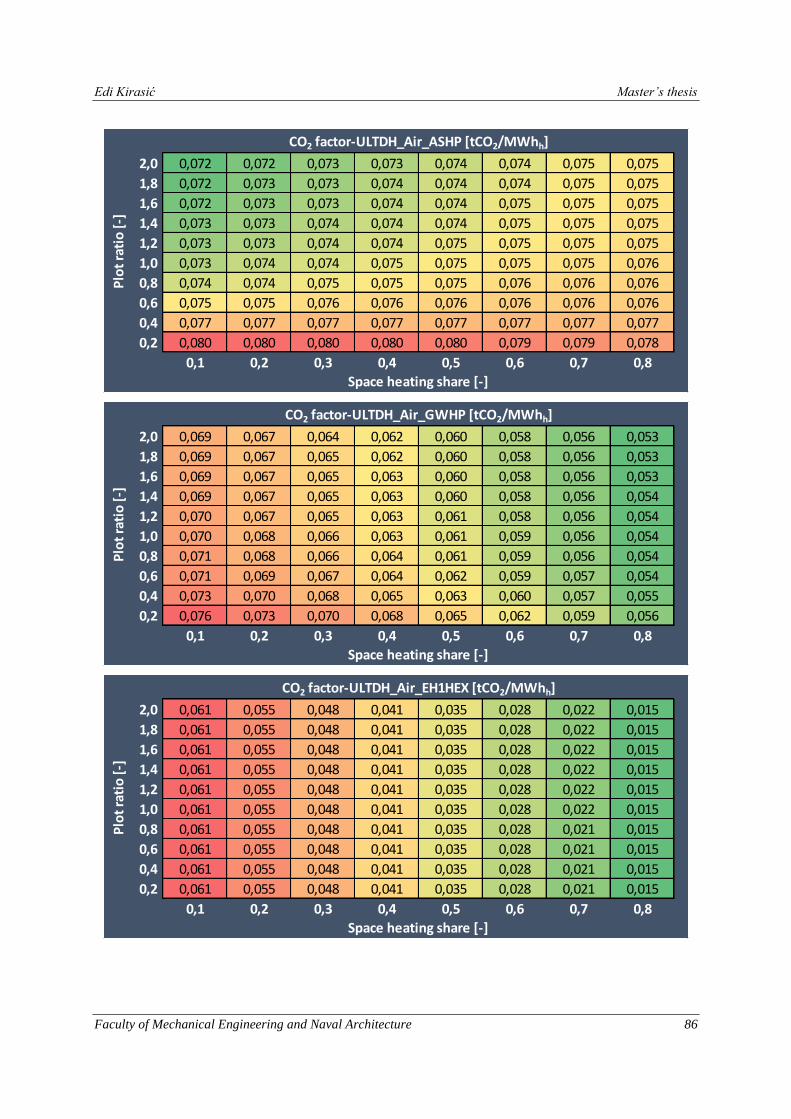
Edi Kirasić Master’s thesis
Faculty of Mechanical Engineering and Naval Architecture 86
2,0 0,072 0,072 0,073 0,073 0,074 0,074 0,075 0,075
1,8 0,072 0,073 0,073 0,074 0,074 0,074 0,075 0,075
1,6 0,072 0,073 0,073 0,074 0,074 0,075 0,075 0,075
1,4 0,073 0,073 0,074 0,074 0,074 0,075 0,075 0,075
1,2 0,073 0,073 0,074 0,074 0,075 0,075 0,075 0,075
1,0 0,073 0,074 0,074 0,075 0,075 0,075 0,075 0,076
0,8 0,074 0,074 0,075 0,075 0,075 0,076 0,076 0,076
0,6 0,075 0,075 0,076 0,076 0,076 0,076 0,076 0,076
0,4 0,077 0,077 0,077 0,077 0,077 0,077 0,077 0,077
0,2 0,080 0,080 0,080 0,080 0,080 0,079 0,079 0,078
0,1 0,2 0,3 0,4 0,5 0,6 0,7 0,8
Space heating share [-]
CO2 factor-ULTDH_Air_ASHP [tCO2/MWhh]
Plo
t ra
tio
[-]
2,0 0,069 0,067 0,064 0,062 0,060 0,058 0,056 0,053
1,8 0,069 0,067 0,065 0,062 0,060 0,058 0,056 0,053
1,6 0,069 0,067 0,065 0,063 0,060 0,058 0,056 0,053
1,4 0,069 0,067 0,065 0,063 0,060 0,058 0,056 0,054
1,2 0,070 0,067 0,065 0,063 0,061 0,058 0,056 0,054
1,0 0,070 0,068 0,066 0,063 0,061 0,059 0,056 0,054
0,8 0,071 0,068 0,066 0,064 0,061 0,059 0,056 0,054
0,6 0,071 0,069 0,067 0,064 0,062 0,059 0,057 0,054
0,4 0,073 0,070 0,068 0,065 0,063 0,060 0,057 0,055
0,2 0,076 0,073 0,070 0,068 0,065 0,062 0,059 0,056
0,1 0,2 0,3 0,4 0,5 0,6 0,7 0,8
Space heating share [-]
CO2 factor-ULTDH_Air_GWHP [tCO2/MWhh]
Plo
t ra
tio
[-]
2,0 0,061 0,055 0,048 0,041 0,035 0,028 0,022 0,015
1,8 0,061 0,055 0,048 0,041 0,035 0,028 0,022 0,015
1,6 0,061 0,055 0,048 0,041 0,035 0,028 0,022 0,015
1,4 0,061 0,055 0,048 0,041 0,035 0,028 0,022 0,015
1,2 0,061 0,055 0,048 0,041 0,035 0,028 0,022 0,015
1,0 0,061 0,055 0,048 0,041 0,035 0,028 0,022 0,015
0,8 0,061 0,055 0,048 0,041 0,035 0,028 0,021 0,015
0,6 0,061 0,055 0,048 0,041 0,035 0,028 0,021 0,015
0,4 0,061 0,055 0,048 0,041 0,035 0,028 0,021 0,015
0,2 0,061 0,055 0,048 0,041 0,035 0,028 0,021 0,015
0,1 0,2 0,3 0,4 0,5 0,6 0,7 0,8
Space heating share [-]
CO2 factor-ULTDH_Air_EH1HEX [tCO2/MWhh]
Plo
t ra
tio
[-]

Edi Kirasić Master’s thesis
Faculty of Mechanical Engineering and Naval Architecture 87
2,0 0,067 0,064 0,061 0,058 0,055 0,052 0,049 0,046
1,8 0,067 0,064 0,061 0,058 0,055 0,052 0,049 0,046
1,6 0,068 0,064 0,061 0,058 0,055 0,052 0,049 0,046
1,4 0,068 0,065 0,061 0,058 0,055 0,052 0,049 0,046
1,2 0,068 0,065 0,062 0,059 0,055 0,052 0,049 0,046
1,0 0,068 0,065 0,062 0,059 0,056 0,052 0,049 0,046
0,8 0,069 0,065 0,062 0,059 0,056 0,053 0,049 0,046
0,6 0,069 0,066 0,063 0,060 0,056 0,053 0,050 0,046
0,4 0,070 0,067 0,064 0,060 0,057 0,054 0,050 0,047
0,2 0,073 0,069 0,066 0,062 0,059 0,055 0,051 0,047
0,1 0,2 0,3 0,4 0,5 0,6 0,7 0,8
Space heating share [-]
CO2 factor-ULTDH_Air_EH2HP [tCO2/MWhh]
Plo
t ra
tio
[-]
2,0 0,068 0,066 0,063 0,061 0,058 0,056 0,053 0,050
1,8 0,068 0,066 0,063 0,061 0,058 0,056 0,053 0,050
1,6 0,069 0,066 0,063 0,061 0,058 0,056 0,053 0,051
1,4 0,069 0,066 0,064 0,061 0,059 0,056 0,053 0,051
1,2 0,069 0,066 0,064 0,061 0,059 0,056 0,053 0,051
1,0 0,069 0,067 0,064 0,062 0,059 0,056 0,054 0,051
0,8 0,070 0,067 0,065 0,062 0,059 0,057 0,054 0,051
0,6 0,071 0,068 0,065 0,062 0,060 0,057 0,054 0,051
0,4 0,072 0,069 0,066 0,063 0,061 0,058 0,055 0,052
0,2 0,075 0,072 0,069 0,066 0,063 0,059 0,056 0,053
0,1 0,2 0,3 0,4 0,5 0,6 0,7 0,8
Space heating share [-]
CO2 factor-ULTDH_Air_EH3HP [tCO2/MWhh]
Plo
t ra
tio
[-]
2,0 0,057 0,059 0,061 0,063 0,065 0,068 0,070 0,072
1,8 0,058 0,059 0,061 0,063 0,066 0,068 0,070 0,072
1,6 0,058 0,059 0,061 0,064 0,066 0,068 0,070 0,072
1,4 0,058 0,060 0,062 0,064 0,066 0,068 0,070 0,072
1,2 0,058 0,060 0,062 0,064 0,066 0,068 0,070 0,072
1,0 0,059 0,060 0,062 0,064 0,066 0,068 0,070 0,072
0,8 0,060 0,061 0,063 0,065 0,067 0,069 0,071 0,072
0,6 0,061 0,062 0,064 0,066 0,067 0,069 0,071 0,073
0,4 0,062 0,063 0,065 0,067 0,069 0,070 0,072 0,073
0,2 0,066 0,067 0,068 0,070 0,071 0,072 0,074 0,075
0,1 0,2 0,3 0,4 0,5 0,6 0,7 0,8
Space heating share [-]
Plo
t ra
tio
[-]
CO2 factor-ULTDH_Micro_ASHP [tCO2/MWhh]
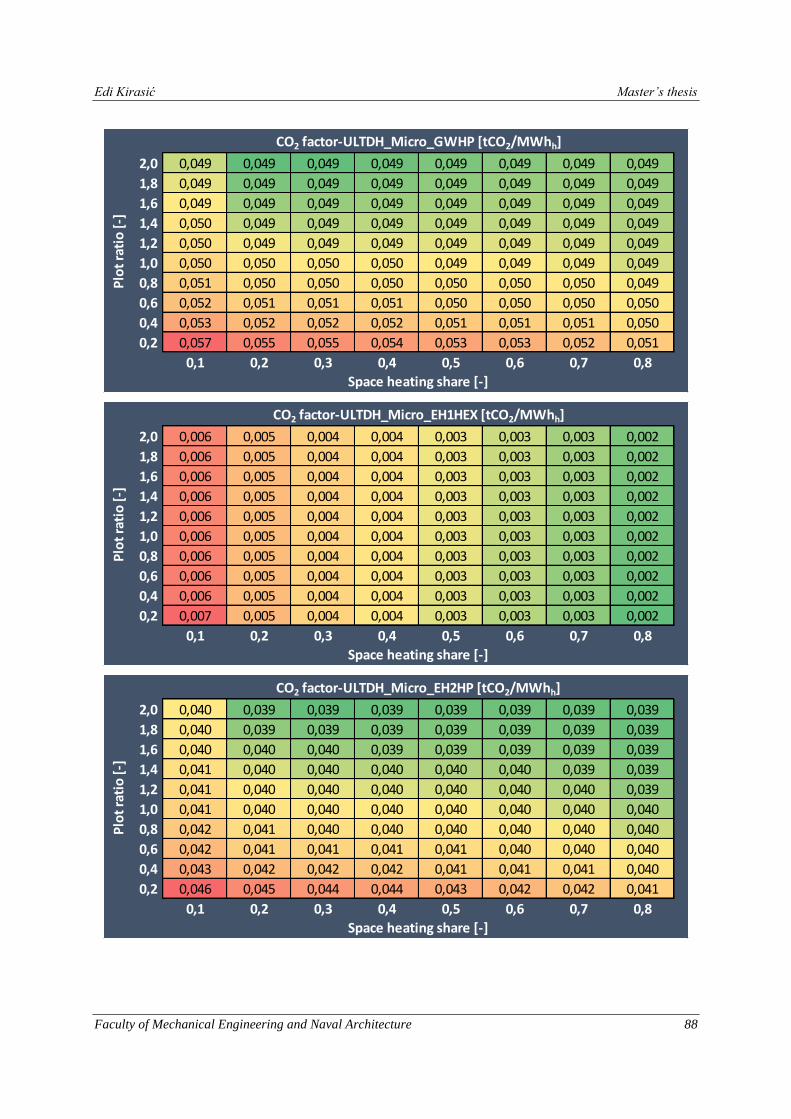
Edi Kirasić Master’s thesis
Faculty of Mechanical Engineering and Naval Architecture 88
2,0 0,049 0,049 0,049 0,049 0,049 0,049 0,049 0,049
1,8 0,049 0,049 0,049 0,049 0,049 0,049 0,049 0,049
1,6 0,049 0,049 0,049 0,049 0,049 0,049 0,049 0,049
1,4 0,050 0,049 0,049 0,049 0,049 0,049 0,049 0,049
1,2 0,050 0,049 0,049 0,049 0,049 0,049 0,049 0,049
1,0 0,050 0,050 0,050 0,050 0,049 0,049 0,049 0,049
0,8 0,051 0,050 0,050 0,050 0,050 0,050 0,050 0,049
0,6 0,052 0,051 0,051 0,051 0,050 0,050 0,050 0,050
0,4 0,053 0,052 0,052 0,052 0,051 0,051 0,051 0,050
0,2 0,057 0,055 0,055 0,054 0,053 0,053 0,052 0,051
0,1 0,2 0,3 0,4 0,5 0,6 0,7 0,8
Space heating share [-]
Plo
t ra
tio
[-]
CO2 factor-ULTDH_Micro_GWHP [tCO2/MWhh]
2,0 0,006 0,005 0,004 0,004 0,003 0,003 0,003 0,002
1,8 0,006 0,005 0,004 0,004 0,003 0,003 0,003 0,002
1,6 0,006 0,005 0,004 0,004 0,003 0,003 0,003 0,002
1,4 0,006 0,005 0,004 0,004 0,003 0,003 0,003 0,002
1,2 0,006 0,005 0,004 0,004 0,003 0,003 0,003 0,002
1,0 0,006 0,005 0,004 0,004 0,003 0,003 0,003 0,002
0,8 0,006 0,005 0,004 0,004 0,003 0,003 0,003 0,002
0,6 0,006 0,005 0,004 0,004 0,003 0,003 0,003 0,002
0,4 0,006 0,005 0,004 0,004 0,003 0,003 0,003 0,002
0,2 0,007 0,005 0,004 0,004 0,003 0,003 0,003 0,002
0,1 0,2 0,3 0,4 0,5 0,6 0,7 0,8
Space heating share [-]
Plo
t ra
tio
[-]
CO2 factor-ULTDH_Micro_EH1HEX [tCO2/MWhh]
2,0 0,040 0,039 0,039 0,039 0,039 0,039 0,039 0,039
1,8 0,040 0,039 0,039 0,039 0,039 0,039 0,039 0,039
1,6 0,040 0,040 0,040 0,039 0,039 0,039 0,039 0,039
1,4 0,041 0,040 0,040 0,040 0,040 0,040 0,039 0,039
1,2 0,041 0,040 0,040 0,040 0,040 0,040 0,040 0,039
1,0 0,041 0,040 0,040 0,040 0,040 0,040 0,040 0,040
0,8 0,042 0,041 0,040 0,040 0,040 0,040 0,040 0,040
0,6 0,042 0,041 0,041 0,041 0,041 0,040 0,040 0,040
0,4 0,043 0,042 0,042 0,042 0,041 0,041 0,041 0,040
0,2 0,046 0,045 0,044 0,044 0,043 0,042 0,042 0,041
0,1 0,2 0,3 0,4 0,5 0,6 0,7 0,8
Space heating share [-]
Plo
t ra
tio
[-]
CO2 factor-ULTDH_Micro_EH2HP [tCO2/MWhh]
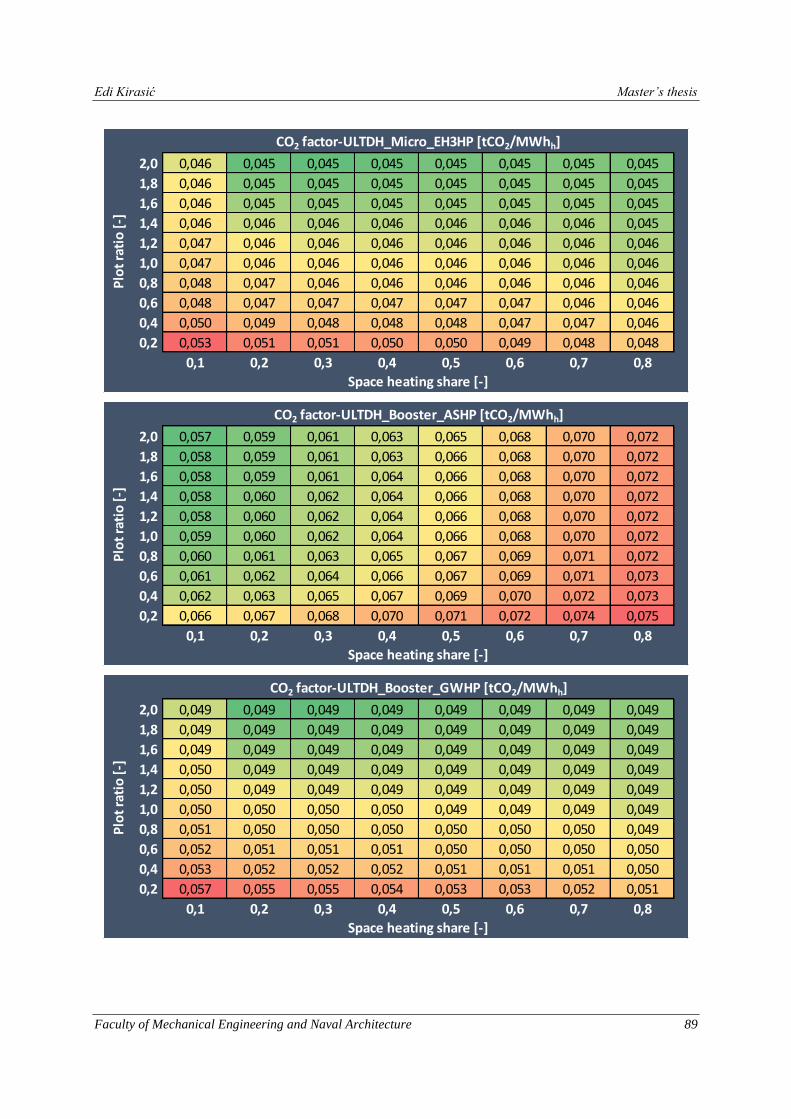
Edi Kirasić Master’s thesis
Faculty of Mechanical Engineering and Naval Architecture 89
2,0 0,046 0,045 0,045 0,045 0,045 0,045 0,045 0,045
1,8 0,046 0,045 0,045 0,045 0,045 0,045 0,045 0,045
1,6 0,046 0,045 0,045 0,045 0,045 0,045 0,045 0,045
1,4 0,046 0,046 0,046 0,046 0,046 0,046 0,046 0,045
1,2 0,047 0,046 0,046 0,046 0,046 0,046 0,046 0,046
1,0 0,047 0,046 0,046 0,046 0,046 0,046 0,046 0,046
0,8 0,048 0,047 0,046 0,046 0,046 0,046 0,046 0,046
0,6 0,048 0,047 0,047 0,047 0,047 0,047 0,046 0,046
0,4 0,050 0,049 0,048 0,048 0,048 0,047 0,047 0,046
0,2 0,053 0,051 0,051 0,050 0,050 0,049 0,048 0,048
0,1 0,2 0,3 0,4 0,5 0,6 0,7 0,8
Space heating share [-]
Plo
t ra
tio
[-]
CO2 factor-ULTDH_Micro_EH3HP [tCO2/MWhh]
2,0 0,057 0,059 0,061 0,063 0,065 0,068 0,070 0,072
1,8 0,058 0,059 0,061 0,063 0,066 0,068 0,070 0,072
1,6 0,058 0,059 0,061 0,064 0,066 0,068 0,070 0,072
1,4 0,058 0,060 0,062 0,064 0,066 0,068 0,070 0,072
1,2 0,058 0,060 0,062 0,064 0,066 0,068 0,070 0,072
1,0 0,059 0,060 0,062 0,064 0,066 0,068 0,070 0,072
0,8 0,060 0,061 0,063 0,065 0,067 0,069 0,071 0,072
0,6 0,061 0,062 0,064 0,066 0,067 0,069 0,071 0,073
0,4 0,062 0,063 0,065 0,067 0,069 0,070 0,072 0,073
0,2 0,066 0,067 0,068 0,070 0,071 0,072 0,074 0,075
0,1 0,2 0,3 0,4 0,5 0,6 0,7 0,8
Space heating share [-]
Plo
t ra
tio
[-]
CO2 factor-ULTDH_Booster_ASHP [tCO2/MWhh]
2,0 0,049 0,049 0,049 0,049 0,049 0,049 0,049 0,049
1,8 0,049 0,049 0,049 0,049 0,049 0,049 0,049 0,049
1,6 0,049 0,049 0,049 0,049 0,049 0,049 0,049 0,049
1,4 0,050 0,049 0,049 0,049 0,049 0,049 0,049 0,049
1,2 0,050 0,049 0,049 0,049 0,049 0,049 0,049 0,049
1,0 0,050 0,050 0,050 0,050 0,049 0,049 0,049 0,049
0,8 0,051 0,050 0,050 0,050 0,050 0,050 0,050 0,049
0,6 0,052 0,051 0,051 0,051 0,050 0,050 0,050 0,050
0,4 0,053 0,052 0,052 0,052 0,051 0,051 0,051 0,050
0,2 0,057 0,055 0,055 0,054 0,053 0,053 0,052 0,051
0,1 0,2 0,3 0,4 0,5 0,6 0,7 0,8
Space heating share [-]
Plo
t ra
tio
[-]
CO2 factor-ULTDH_Booster_GWHP [tCO2/MWhh]
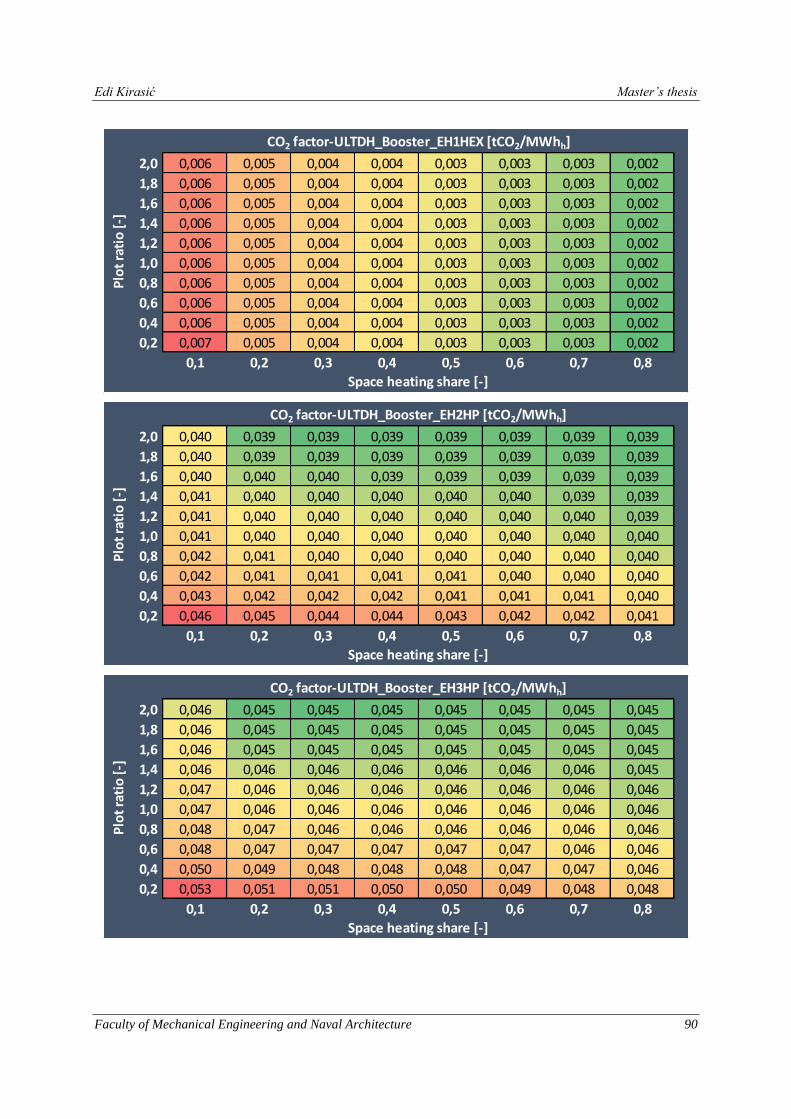
Edi Kirasić Master’s thesis
Faculty of Mechanical Engineering and Naval Architecture 90
2,0 0,006 0,005 0,004 0,004 0,003 0,003 0,003 0,002
1,8 0,006 0,005 0,004 0,004 0,003 0,003 0,003 0,002
1,6 0,006 0,005 0,004 0,004 0,003 0,003 0,003 0,002
1,4 0,006 0,005 0,004 0,004 0,003 0,003 0,003 0,002
1,2 0,006 0,005 0,004 0,004 0,003 0,003 0,003 0,002
1,0 0,006 0,005 0,004 0,004 0,003 0,003 0,003 0,002
0,8 0,006 0,005 0,004 0,004 0,003 0,003 0,003 0,002
0,6 0,006 0,005 0,004 0,004 0,003 0,003 0,003 0,002
0,4 0,006 0,005 0,004 0,004 0,003 0,003 0,003 0,002
0,2 0,007 0,005 0,004 0,004 0,003 0,003 0,003 0,002
0,1 0,2 0,3 0,4 0,5 0,6 0,7 0,8
Space heating share [-]
Plo
t ra
tio
[-]
CO2 factor-ULTDH_Booster_EH1HEX [tCO2/MWhh]
2,0 0,040 0,039 0,039 0,039 0,039 0,039 0,039 0,039
1,8 0,040 0,039 0,039 0,039 0,039 0,039 0,039 0,039
1,6 0,040 0,040 0,040 0,039 0,039 0,039 0,039 0,039
1,4 0,041 0,040 0,040 0,040 0,040 0,040 0,039 0,039
1,2 0,041 0,040 0,040 0,040 0,040 0,040 0,040 0,039
1,0 0,041 0,040 0,040 0,040 0,040 0,040 0,040 0,040
0,8 0,042 0,041 0,040 0,040 0,040 0,040 0,040 0,040
0,6 0,042 0,041 0,041 0,041 0,041 0,040 0,040 0,040
0,4 0,043 0,042 0,042 0,042 0,041 0,041 0,041 0,040
0,2 0,046 0,045 0,044 0,044 0,043 0,042 0,042 0,041
0,1 0,2 0,3 0,4 0,5 0,6 0,7 0,8
Space heating share [-]
Plo
t ra
tio
[-]
CO2 factor-ULTDH_Booster_EH2HP [tCO2/MWhh]
2,0 0,046 0,045 0,045 0,045 0,045 0,045 0,045 0,045
1,8 0,046 0,045 0,045 0,045 0,045 0,045 0,045 0,045
1,6 0,046 0,045 0,045 0,045 0,045 0,045 0,045 0,045
1,4 0,046 0,046 0,046 0,046 0,046 0,046 0,046 0,045
1,2 0,047 0,046 0,046 0,046 0,046 0,046 0,046 0,046
1,0 0,047 0,046 0,046 0,046 0,046 0,046 0,046 0,046
0,8 0,048 0,047 0,046 0,046 0,046 0,046 0,046 0,046
0,6 0,048 0,047 0,047 0,047 0,047 0,047 0,046 0,046
0,4 0,050 0,049 0,048 0,048 0,048 0,047 0,047 0,046
0,2 0,053 0,051 0,051 0,050 0,050 0,049 0,048 0,048
0,1 0,2 0,3 0,4 0,5 0,6 0,7 0,8
Space heating share [-]
Plo
t ra
tio
[-]
CO2 factor-ULTDH_Booster_EH3HP [tCO2/MWhh]
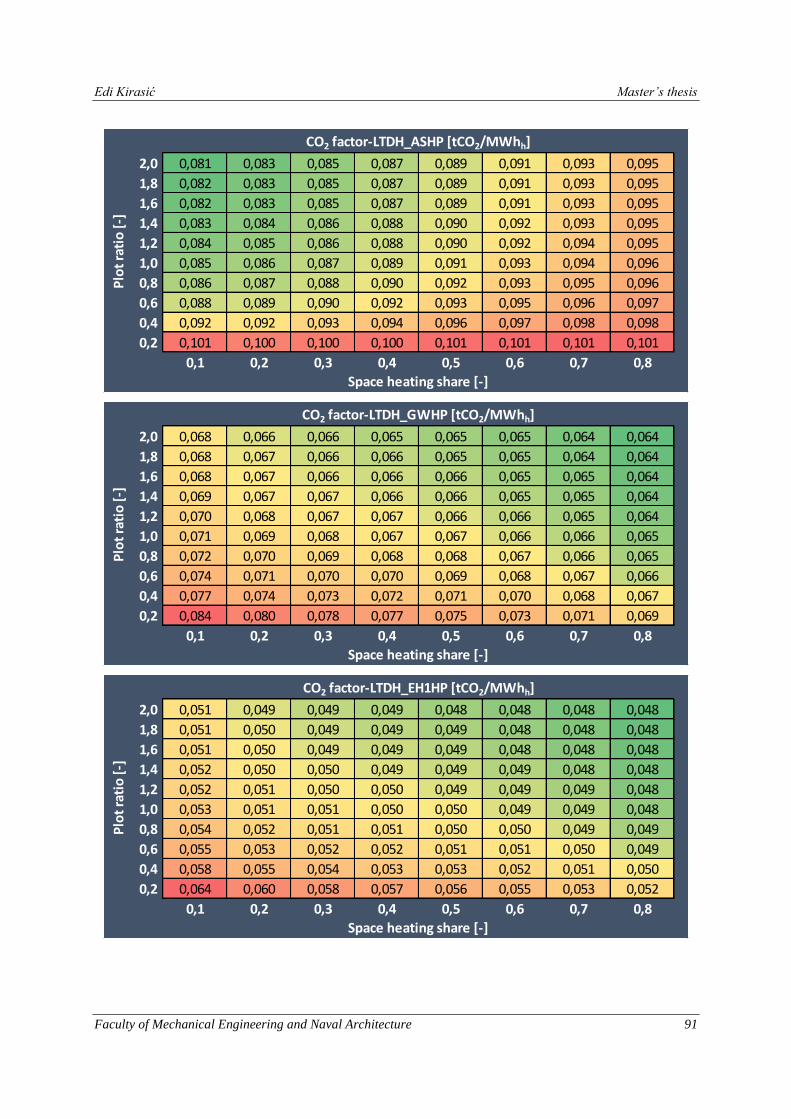
Edi Kirasić Master’s thesis
Faculty of Mechanical Engineering and Naval Architecture 91
2,0 0,081 0,083 0,085 0,087 0,089 0,091 0,093 0,095
1,8 0,082 0,083 0,085 0,087 0,089 0,091 0,093 0,095
1,6 0,082 0,083 0,085 0,087 0,089 0,091 0,093 0,095
1,4 0,083 0,084 0,086 0,088 0,090 0,092 0,093 0,095
1,2 0,084 0,085 0,086 0,088 0,090 0,092 0,094 0,095
1,0 0,085 0,086 0,087 0,089 0,091 0,093 0,094 0,096
0,8 0,086 0,087 0,088 0,090 0,092 0,093 0,095 0,096
0,6 0,088 0,089 0,090 0,092 0,093 0,095 0,096 0,097
0,4 0,092 0,092 0,093 0,094 0,096 0,097 0,098 0,098
0,2 0,101 0,100 0,100 0,100 0,101 0,101 0,101 0,101
0,1 0,2 0,3 0,4 0,5 0,6 0,7 0,8
Plo
t ra
tio
[-]
Space heating share [-]
CO2 factor-LTDH_ASHP [tCO2/MWhh]
2,0 0,068 0,066 0,066 0,065 0,065 0,065 0,064 0,064
1,8 0,068 0,067 0,066 0,066 0,065 0,065 0,064 0,064
1,6 0,068 0,067 0,066 0,066 0,066 0,065 0,065 0,064
1,4 0,069 0,067 0,067 0,066 0,066 0,065 0,065 0,064
1,2 0,070 0,068 0,067 0,067 0,066 0,066 0,065 0,064
1,0 0,071 0,069 0,068 0,067 0,067 0,066 0,066 0,065
0,8 0,072 0,070 0,069 0,068 0,068 0,067 0,066 0,065
0,6 0,074 0,071 0,070 0,070 0,069 0,068 0,067 0,066
0,4 0,077 0,074 0,073 0,072 0,071 0,070 0,068 0,067
0,2 0,084 0,080 0,078 0,077 0,075 0,073 0,071 0,069
0,1 0,2 0,3 0,4 0,5 0,6 0,7 0,8
Plo
t ra
tio
[-]
Space heating share [-]
CO2 factor-LTDH_GWHP [tCO2/MWhh]
2,0 0,051 0,049 0,049 0,049 0,048 0,048 0,048 0,048
1,8 0,051 0,050 0,049 0,049 0,049 0,048 0,048 0,048
1,6 0,051 0,050 0,049 0,049 0,049 0,048 0,048 0,048
1,4 0,052 0,050 0,050 0,049 0,049 0,049 0,048 0,048
1,2 0,052 0,051 0,050 0,050 0,049 0,049 0,049 0,048
1,0 0,053 0,051 0,051 0,050 0,050 0,049 0,049 0,048
0,8 0,054 0,052 0,051 0,051 0,050 0,050 0,049 0,049
0,6 0,055 0,053 0,052 0,052 0,051 0,051 0,050 0,049
0,4 0,058 0,055 0,054 0,053 0,053 0,052 0,051 0,050
0,2 0,064 0,060 0,058 0,057 0,056 0,055 0,053 0,052
0,1 0,2 0,3 0,4 0,5 0,6 0,7 0,8
Plo
t ra
tio
[-]
Space heating share [-]
CO2 factor-LTDH_EH1HP [tCO2/MWhh]
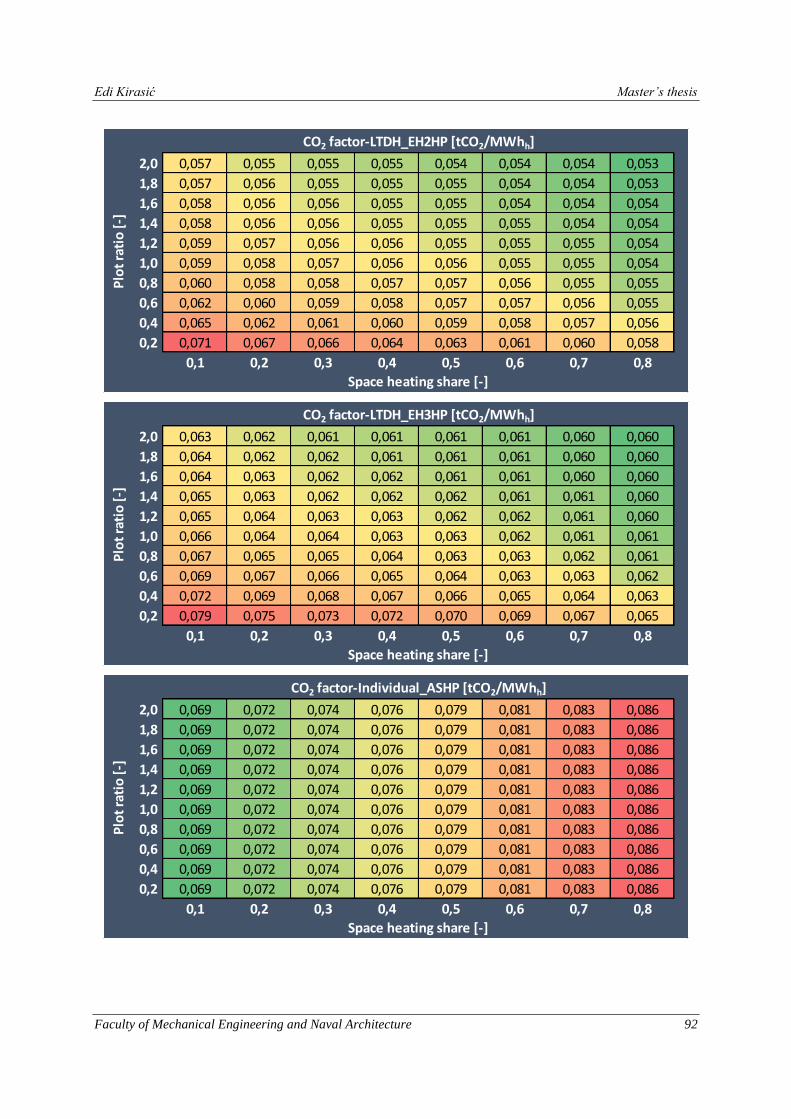
Edi Kirasić Master’s thesis
Faculty of Mechanical Engineering and Naval Architecture 92
2,0 0,057 0,055 0,055 0,055 0,054 0,054 0,054 0,053
1,8 0,057 0,056 0,055 0,055 0,055 0,054 0,054 0,053
1,6 0,058 0,056 0,056 0,055 0,055 0,054 0,054 0,054
1,4 0,058 0,056 0,056 0,055 0,055 0,055 0,054 0,054
1,2 0,059 0,057 0,056 0,056 0,055 0,055 0,055 0,054
1,0 0,059 0,058 0,057 0,056 0,056 0,055 0,055 0,054
0,8 0,060 0,058 0,058 0,057 0,057 0,056 0,055 0,055
0,6 0,062 0,060 0,059 0,058 0,057 0,057 0,056 0,055
0,4 0,065 0,062 0,061 0,060 0,059 0,058 0,057 0,056
0,2 0,071 0,067 0,066 0,064 0,063 0,061 0,060 0,058
0,1 0,2 0,3 0,4 0,5 0,6 0,7 0,8
Plo
t ra
tio
[-]
Space heating share [-]
CO2 factor-LTDH_EH2HP [tCO2/MWhh]
2,0 0,063 0,062 0,061 0,061 0,061 0,061 0,060 0,060
1,8 0,064 0,062 0,062 0,061 0,061 0,061 0,060 0,060
1,6 0,064 0,063 0,062 0,062 0,061 0,061 0,060 0,060
1,4 0,065 0,063 0,062 0,062 0,062 0,061 0,061 0,060
1,2 0,065 0,064 0,063 0,063 0,062 0,062 0,061 0,060
1,0 0,066 0,064 0,064 0,063 0,063 0,062 0,061 0,061
0,8 0,067 0,065 0,065 0,064 0,063 0,063 0,062 0,061
0,6 0,069 0,067 0,066 0,065 0,064 0,063 0,063 0,062
0,4 0,072 0,069 0,068 0,067 0,066 0,065 0,064 0,063
0,2 0,079 0,075 0,073 0,072 0,070 0,069 0,067 0,065
0,1 0,2 0,3 0,4 0,5 0,6 0,7 0,8
Space heating share [-]
Plo
t ra
tio
[-]
CO2 factor-LTDH_EH3HP [tCO2/MWhh]
2,0 0,069 0,072 0,074 0,076 0,079 0,081 0,083 0,086
1,8 0,069 0,072 0,074 0,076 0,079 0,081 0,083 0,086
1,6 0,069 0,072 0,074 0,076 0,079 0,081 0,083 0,086
1,4 0,069 0,072 0,074 0,076 0,079 0,081 0,083 0,086
1,2 0,069 0,072 0,074 0,076 0,079 0,081 0,083 0,086
1,0 0,069 0,072 0,074 0,076 0,079 0,081 0,083 0,086
0,8 0,069 0,072 0,074 0,076 0,079 0,081 0,083 0,086
0,6 0,069 0,072 0,074 0,076 0,079 0,081 0,083 0,086
0,4 0,069 0,072 0,074 0,076 0,079 0,081 0,083 0,086
0,2 0,069 0,072 0,074 0,076 0,079 0,081 0,083 0,086
0,1 0,2 0,3 0,4 0,5 0,6 0,7 0,8
CO2 factor-Individual_ASHP [tCO2/MWhh]
Plo
t ra
tio
[-]
Space heating share [-]
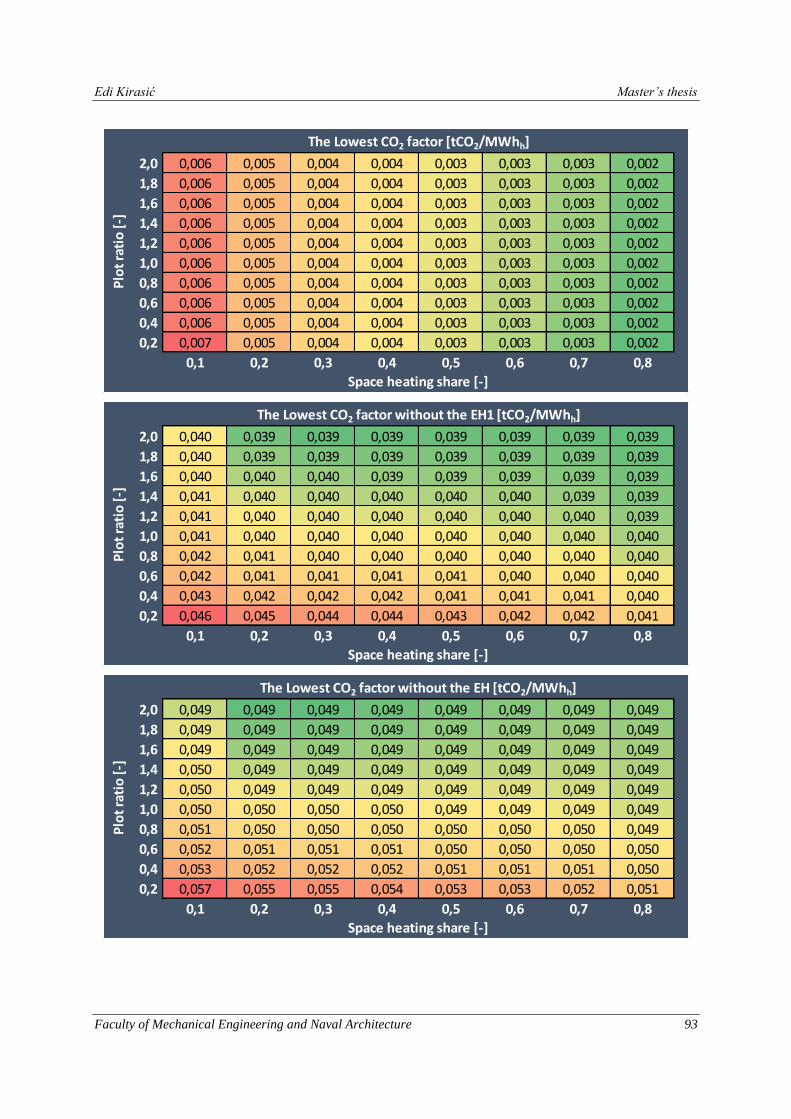
Edi Kirasić Master’s thesis
Faculty of Mechanical Engineering and Naval Architecture 93
2,0 0,006 0,005 0,004 0,004 0,003 0,003 0,003 0,002
1,8 0,006 0,005 0,004 0,004 0,003 0,003 0,003 0,002
1,6 0,006 0,005 0,004 0,004 0,003 0,003 0,003 0,002
1,4 0,006 0,005 0,004 0,004 0,003 0,003 0,003 0,002
1,2 0,006 0,005 0,004 0,004 0,003 0,003 0,003 0,002
1,0 0,006 0,005 0,004 0,004 0,003 0,003 0,003 0,002
0,8 0,006 0,005 0,004 0,004 0,003 0,003 0,003 0,002
0,6 0,006 0,005 0,004 0,004 0,003 0,003 0,003 0,002
0,4 0,006 0,005 0,004 0,004 0,003 0,003 0,003 0,002
0,2 0,007 0,005 0,004 0,004 0,003 0,003 0,003 0,002
0,1 0,2 0,3 0,4 0,5 0,6 0,7 0,8
Space heating share [-]
The Lowest CO2 factor [tCO2/MWhh]
Plo
t ra
tio
[-]
2,0 0,040 0,039 0,039 0,039 0,039 0,039 0,039 0,039
1,8 0,040 0,039 0,039 0,039 0,039 0,039 0,039 0,039
1,6 0,040 0,040 0,040 0,039 0,039 0,039 0,039 0,039
1,4 0,041 0,040 0,040 0,040 0,040 0,040 0,039 0,039
1,2 0,041 0,040 0,040 0,040 0,040 0,040 0,040 0,039
1,0 0,041 0,040 0,040 0,040 0,040 0,040 0,040 0,040
0,8 0,042 0,041 0,040 0,040 0,040 0,040 0,040 0,040
0,6 0,042 0,041 0,041 0,041 0,041 0,040 0,040 0,040
0,4 0,043 0,042 0,042 0,042 0,041 0,041 0,041 0,040
0,2 0,046 0,045 0,044 0,044 0,043 0,042 0,042 0,041
0,1 0,2 0,3 0,4 0,5 0,6 0,7 0,8
Space heating share [-]
The Lowest CO2 factor without the EH1 [tCO2/MWhh]
Plo
t ra
tio
[-]
2,0 0,049 0,049 0,049 0,049 0,049 0,049 0,049 0,049
1,8 0,049 0,049 0,049 0,049 0,049 0,049 0,049 0,049
1,6 0,049 0,049 0,049 0,049 0,049 0,049 0,049 0,049
1,4 0,050 0,049 0,049 0,049 0,049 0,049 0,049 0,049
1,2 0,050 0,049 0,049 0,049 0,049 0,049 0,049 0,049
1,0 0,050 0,050 0,050 0,050 0,049 0,049 0,049 0,049
0,8 0,051 0,050 0,050 0,050 0,050 0,050 0,050 0,049
0,6 0,052 0,051 0,051 0,051 0,050 0,050 0,050 0,050
0,4 0,053 0,052 0,052 0,052 0,051 0,051 0,051 0,050
0,2 0,057 0,055 0,055 0,054 0,053 0,053 0,052 0,051
0,1 0,2 0,3 0,4 0,5 0,6 0,7 0,8
Space heating share [-]
The Lowest CO2 factor without the EH [tCO2/MWhh]
Plo
t ra
tio
[-]