employment, livelihoods and social protection sector (elsp) · 2016-07-29 · human capital,...
TRANSCRIPT

Prepared for the Post Disaster Needs Assessment for Resilient Recovery Workshop, Bangkok, 28 – 31 July 2015
Employment, Livelihoods and Social Protection Sector (ELSP)

Content
Define ELSP
Introduce ELSP assessment process
Indicate options for ELSP recovery
1
2
3

Employment and Livelihoods: Key Concepts

Understanding the concept of livelihoods
Livelihoods depend on the employment of labour, the use of assets and, in some cases, on income transfers.
Livelihoods usually lead to flows of income and consumption, the outcome of which are expressed in the household’s standards of living.
Livelihoods consist of the capabilities, assets and activities from which individuals and households make their living.
KEY CONCEPT: LIVELIHOODS

Understanding the concept of livelihoods
Livelihoods usually lead to flows of incomeand consumption, the outcome of which are expressed in the household’s standards of living.
Livelihoods consist of the capabilities, assets and activities from which individuals and households make their living.
Livelihood outcomes
The ultimate outcome is to achieve the preservation of the householdand to rear the next generation with a desirable quality of life.
This can be related to the capacity of households to satisfy their elementary human needs, such as nutrition, water, health care, shelter, clothing, sanitation, and others.
KEY CONCEPT: LIVELIHOODS
Livelihoods depend on the employment of labour, the use of assets and, in some cases, on income transfers.

Understanding the concept of livelihoods
Employment of labour
Family labour may be employed to obtain income, or devoted to housework.
Use of assets
Assets can be represented by the following categories:
Human capital, natural capital, social capital, physical capital and financial capital
Income transfers
Transfers include social security (old age and disability pensions, family allowances, food assistance, etc.), and remittances.
Livelihoods depend on the employment of labour, the use of assets and, in some cases, on income transfers.
Livelihoods usually lead to flows of income and consumption, the outcome of which are expressed in the household’s standards of living.
Livelihoods consist of the capabilities, assets and activities from which individuals and households make their living.
KEY CONCEPT: LIVELIHOODS

Assessment of Livelihoods within the PDNA
MAIN OBJECTIVE
Assess the impact of the flood on livelihoods and identify opportunities and capacities for economic recovery at household, community and local economy level
CONSEQUENCES OF A DISASTER
Damages The destruction of assets
(human, natural, physical, social and financial) such as workshops, factories, market stalls, tools, crop fields, livestock, etc.
Losses The loss of employment
(whether temporary or permanent)
The reduction of income flows (whether related to labour or not)
Needs Immediate income generating
opportunities for vulnerable households whose livelihoods were affected
Mid/long term employment recovery, i.e. support to SMEs, COOP, SKILLS development LER/LED

Locating ELSP within the PDNA
The effects of the disaster on the capabilities, assets and activities of households are a result of the effect on all the PDNA sectors (social, productive and infrastructure).
Social sectorsCulture
Education Health
Housing
Productive sectorsAgriculture
IndustryCommerce
Tourism
Infrastructure sectors Transport
CommunicationsEnergy
Water and Sanitation
PDNA
CROSS-CUTTING SECTORS
• Employment, Livelihoods and Social Protection
• Gender• Environment• DRR• Etc...

The ELSP Assessment Process

The Assessment Process
HAZARD
Step 1 collection of pre-disaster information:
- Constructing the baseline through desk research
Step 2 collection of post disaster information:- secondary data from PDNA sectors- primary data through field visits
Steps 5 identification of recovery needs and formulation of recovery strategy:- quantitative- qualitative
RECOVERY
Steps 4 analysis of the disaster impact:- qualitative
Steps 3 estimation of the disaster effect:- quantitiative

Key Outputs
Employment,
Livelihoods and
Social Protection
Chapter
PDNA REPORT
Standard outline:
1) Pre-disaster situation
2) Disaster effect (two tables)
3) Disaster impact
4) Recovery strategy (one table)

BASELINECollection of pre-disaster information through desk research
STEP ONE

STEP ONE: BASELINE
What’s the number of…
• wage workers
• self-employed
• employers
• unemployed
Gender differences, i.e. female
labour force participation rate,
employment status
?What are the
average work days
per year?
What are the
mean/average
earnings?
What are the key
livelihood sources
for individuals and
households?
How do individuals and
households generate
income?
Gender differences,
i.e. typical activities
What’s the extent
of the informal
economy?
Who are the vulnerable groups in a
community/society?
Child and bonded workers, female
headed households, elderly, people
living with HIV/AIDS, ethnic/religious
minorities

STEP ONE: BASELINE
ETYPOLOGIES Wage-work households
Employer households
Farm self-employment households
Non-farm self-employment households
No employment households (various sources of sustenance: rental income, pensions, social security transfers, remittances, helps from relatives, money interest, etc.)
Unemployed households
Households without information
The baseline provides a good picture of the pre-disaster situation
The baseline provides:
a robust quantitative framework to estimate the disaster effect on ELSP
provides a qualitative basis to analyse the disaster impact on ELSP

STEP ONE: BASELINE
Typical baseline data sources
Areas of coverage
Updating baseline
information
Focused on individuals/households:
Population census
Household and labour force surveys
Social security records
Social assistance programmes
Qualitative livelihood studies (zones, types)
Focused on units of economic activity:
Agricultural censuses and surveys
Economic censuses and surveys
Business registers
National accounts
Assembling the data collected

STEP ONE: BASELINE
Census data:
Universal coverage
Provide small area resolution (villages, districts, sub districts)
Survey data:
Sample
Usually provide wide area resolution only (regions, provinces)
Disasters frequently hit specific areas, not entire regions or provinces:
Census data are needed to quantify features of the specific disaster area
Typical baseline data sources for livelihoods
Areas of coverage
Updating baseline
information
Assembling the data collected

STEP ONE: BASELINE
Update population numbers and composition:
Consider differences between urban and rural population growth
Consider displaced population movement since last census
Typical baseline data sources for livelihoods
Areas of coverage
Updating baseline
information
Assembling the data collected

STEP ONE: BASELINE
Assembling the data:
The various pieces of information collected for the baseline should be assembled with the goal of qualitative and quantitatively characterizing Employment and Livelihoods.
Also:
There is no general recipe to do this, since the socio-economic realities and data availability vary widely.
Indications and examples:
This presentation conveys only some general indications and examples and needs to be adapted to particular situations.
Typical baseline data sources for livelihoods
Areas of coverage
Updating baseline
information
Assembling the data collected

EXAMPLE: Baseline data sheet for Tourism Sector
Whenever possible, data should aggregated by sex
Prepare a table for each productive sectorthat details employment and livelihoods information at district level.
Disaster
affected
districts
Contribution
to GDP
# of workersMean work
days per
year/per
worker
Mean daily
wageTotal male female
District 1… … … …
District 2
…
District X
Total … … … …

EXAMPLE: Setting-up an inventory with the
documents collected
1
2
3
4
1
2
3
4
TYPE: The type of document refers to the
specific format (e.g. Excel, Word, PDF, Power
Point, Photo, DAT, etc.)
DESCRIPTION: It usually refers to the type of
information that can be extracted from the
document (e.g. labour participation rates, GDP
composition, consumer price index, etc.)
LOCATION: Detailing the location of the file is
very useful especially when the number of
documents collected is high. In general, using
hyperlinks is the best and easiest way to do
this.
NOTES: It is also important to mention the type
of use given to the document. For instance,
inform if the information contained in the
document was used to estimate the number of
workers in a specific sector.
POST-DISASTER INFORMATION Collection of secondary data from PDNA sectors
and primary data through field visitsSTEP TWO

STEP TWO: POST-DISASTER INFORMATION
Pay attention to inter-linkages with other sectors!
Look for relevant pieces of information from other PDNA sectors:
Transport sector: destroyed/damagedroads – lack of access to markets
Energy sector: Disruption of power supply – production loss
Housing sector: destroyed/damageddwellings – workplaces affected
Agriculture sector: lost harvest – smallholder households/agricultural workersaffected
… every assessment is different and there is no universal receipe.

STEP TWO: POST-DISASTER INFORMATION
are required for ground-truth working hypotheses derived from initial livelihoods impact data (secondary data)
provide a first hand understanding of livelihood impact and recovery priorities
consist of selective meetings with district level authorities, communitylevel key informants and individual households in the affected area
Field visits

EXAMPLE: Interviews with key informants at
provincial / district headquarters
What are the main ways in which people
make a living in this area?
Which are the most vulnerable groups,
where are they located and what is their
relationship to those making a living?
Which groups have been most affected
and why?
What has been the general impact of the
disaster on how people make a living in
the area?
Elements to keep in mind:
proportion of shops or businesses
closed or collapsed, proportion of
farms or crops flooded or otherwise
damaged, roads closed, communal
marketplaces, etc.
What are people doing to cope? What are
they likely to do?
Elements to keep in mind: internal
displacement, overexploitation of natural
resources, selling assets, taking loans,
reduction of food intake, etc.
What are the immediate priorities to support?
What can be expected from governmental
and non-governmental agencies operating in
the area?
What changes are required for longer term
recovery of affected populations and reducing
vulnerability to similar events in the future?
Checklist (example):
1
3
4
5
6
7
8
2

STEP TWO: POST-DISASTER INFORMATION
Secondary data and key informants (national and district level)
Market traders /shopkeepers
Community level key
informants
Wealth groups and
households
What the different assessment levels should be telling you:
Nature, extent and magnitude of shock/crisis
Geographical areas affected
Groups of people affected (livelihood types; vulnerable pop)
Current situation on disruption to livelihood activities (including market disruption)
Impact of the disaster on key organizations and enterprises (public, private, int. organizations, etc.)
General impact of the disaster on the people in the area
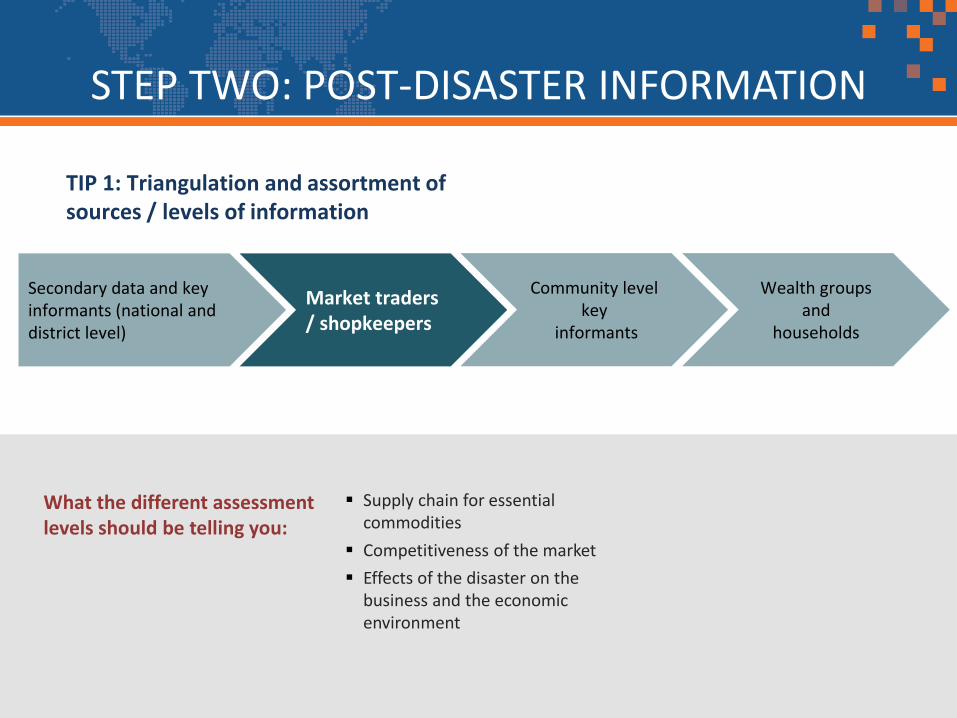
TIP 1: Triangulation and assortment of sources / levels of information
STEP TWO: POST-DISASTER INFORMATION
Secondary data and key informants (national and district level)
Market traders / shopkeepers
Community level key
informants
Wealth groups and
households
What the different assessment levels should be telling you:
Supply chain for essential commodities
Competitiveness of the market
Effects of the disaster on the business and the economic environment
TIP 1: Triangulation and assortment of sources / levels of information

STEP TWO: POST-DISASTER INFORMATION
Secondary data and key informants (national and district level)
Market traders /shopkeepers
Community level keyinformants
Wealth groups and
households
What the different assessment levels should be telling you:
The most important livelihood activities in the community (and when these take place in the year)
The overall impact of the disaster on livelihood activities in the community and current responses
The potential role of community groups in livelihood recovery
High priority needs
Identification of different wealth / vulnerable groups
TIP 1: Triangulation and assortment of sources / levels of information

STEP TWO: POST-DISASTER INFORMATION
Secondary data and key informants (national and district level)
Market traders /shopkeepers
Community level key
informants
Wealth groups and households
What the different assessment levels should be telling you:
The most important sources of employment, income and expenditure for the wealth group / household before the disaster
The impact of the disaster on the assets and activities of the wealth group / household
Coping strategies
The main short and longer-term priorities and needs, with particular attention on vulnerable groups
TIP 1: Triangulation and assortment of sources / levels of information

THE DISASTER EFFECT
and primary data through field visits
STEP THREE

The estimation of the disaster effect on Employment and Livelihood
is a quantitative analysis.
The units used are:
Work days lost per productive sector and per district
Personal income lost per productive sector and per district
STEP THREE: THE DISASTER EFFECT
Different methods are used depending on the available information
(baseline data and post-disaster secondary data)
based on change in flows of sectoral output
based on physical damage to workplaces/dwellings
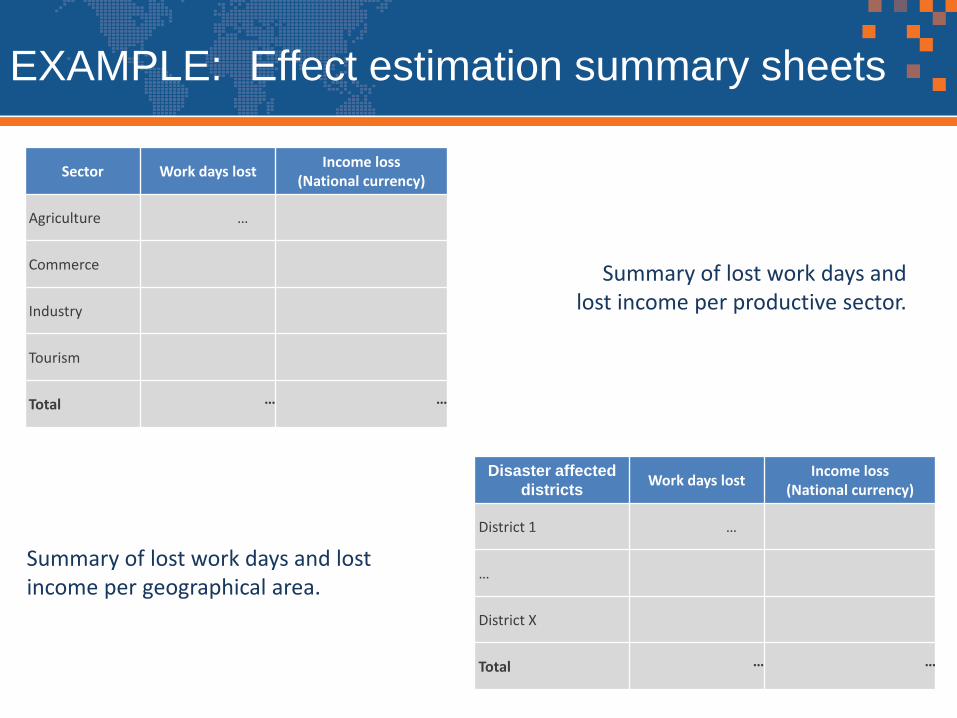
Sector Work days lostIncome loss
(National currency)
Agriculture …
Commerce
Industry
Tourism
Total … …
Summary of lost work days and lost income per productive sector.
Disaster affected
districtsWork days lost
Income loss (National currency)
District 1 …
…
District X
Total … …
Summary of lost work days and lostincome per geographical area.
EXAMPLE: Effect estimation summary sheets

Every PDNA report includes a
summary table that captures the
Damages and Losses per Sector.
The lost personal income should
be included in a seperate column
to:
reflect the cross-cutting
nature of the ELSP Sector
avoid double counting of
losses.
EXAMPLE: Lost personal income in final summary table

STEP THREE: THE DISASTER EFFECT
The assessment of work days lost may be based on the reduction of sectoral GDP estimated by other PDNA sectors (e.g., agriculture or construction).
TYPE OF CALCULATION
Work Days lost:
For sector X and area A:
[ Estimated number of work days lost in the year following the disaster= Estimated number of workers employed in a certain sector (as per updated baseline)× Estimated hours (or days) of work per year× Estimated percent decrease in the sector’s output (from sectoral damage report) ]
Method one: change in flows of sectoral output
As GDP losses are usually expressedin terms of the annual GDP, this estimate refers to the workdays or work income lost in the year of the disaster, and does not distinguish between jobs completely lost, jobs temporarily suspended or jobs with reduced income.

Pre - disaster Post - disaster
FY 2012/13 FY 2014/15
Diasteraffected districts
contribution to GDP
# of workers# of mean
work days per year/worker
mean daily
income
sectoral output loss
% of reduction in sector output
# of work days lost
Income loss
District 1
District 2 5,000,000,000 76,000 120 115 460,000,000 9.2% 1,270 146,004
…
…
…
…
District X
Total … … … … … … … …
EXAMPLE: Calculation sheet for method one
1 2 3
% of reduction in sector output = sectoral output loss/contribution to GDP
# of work days lost = # of workers x # of mean work days per year x
% of reduction in sector output
Income loss = # of work days lost x mean daily income

STEP THREE: THE DISASTER EFFECT
Direct proxy: Workplaces Proxy for jobs
For sector X and area A:
[ # of jobs lost = baseline jobs x % of workplaces destroyed ]
Indirect proxy: Dwellings Proxy for workplaces Proxy for jobs
For sector X and area A:
[ # of jobs lost = baseline jobs x % of dwellings destroyed ]
The assessment of employment and livelihood losses
may be based on the information on workplaces and
productive assets destroyed by the disaster.
Direct estimation: field work listing the number (or
the proportion) of workplaces destroyed
Indirect estimation: estimated from other proxies
(e.g. percentage destruction of dwellings)
Method two: physical damage to workplaces/dwellings

EXAMPLE: Calculation sheet for method two
Pre - disaster FY 2012/13
Post – disasterFY 2014/15
Disaster affected districts
Total HH enterprises
Mean daily income
% of destroyed dwellings
% of damaged dwellings
# of destroyed
HH enterprises
# of damaged
HH enterprises
# of days needed to
reconstruct
# of days needed to
repair
# of work days lost
Income lost
District 1
District 2 6,000 30 3% 3% 158 191 28,843 19,910 48,753 1,462,605
…
…
…
…
District X
Total … … … … … … … … … …
1 2 23 3
# of destroyed HH enterprises = Total HH enterprises x % of destroyed dwellings
# of work days lost = # of days needed to reconstruct + # of days needed to repair
Income loss = # of work days lost x mean daily income

THE DISASTER IMPACT
and primary data through field visits
STEP FOUR

STEP FOUR: THE DISASTER IMPACT
The analysis of the disaster impact on Employment and Livelihood
is a qualitative exercise.
It contextualizes the quantitative findings of the disaster effect and
provides a short, medium and long term analysis.

STEP FOUR: THE DISASTER IMPACT
The socio-economic characteristics of orphans, children living in precarious conditions, people with disabilities, people with HIV/Aids, female-headed households, elderly, informal workers and unemployed people, etc.
The possible deterioration of living conditions of people affected by the disaster (access to services and rights).
The breakdown of existing social protection mechanisms (interruption of service provision and income transfers, impact of service infrastructure and quality, lack of human resources).
The decapitalization of social security institutions and social assistance programs.
The upsurge of unemployment, informality and child labour.
When assessing the impact of a disaster on vulnerable groups, experts need to consider several elements:
Note:
Attention must be paid to linkages between sectors: health, education, agriculture, gender, governance, WASH, etc.

STEP FOUR: THE DISASTER IMPACT
% of households who lost sole income earner, by sex of head of household
% of households who lost primary income earner, by sex of household
% of women involved in livelihood, employment and social protection programmes in the area(s) affected by the disaster.
Skills and skill levels of men and women in the area(s) affected by the disaster.
Challenges faced by female-headed households in terms of livelihoods and employment.
Women’s rights and ownership over economic assets, including land rights.
Important considerations on gender-sensitive Employment and Livelihoods:
Note:
Women and men have different resources available to them in crisis situation, and will turn to different strategies for survival.

THE RECOVERY NEEDSIdentification of recovery needs and
formulation of recovery strategySTEP FIVE

STEP FIVE: THE RECOVERY NEEDS
TIME FRAME
PROPOSED ACTIVITYINDICATIVE COST (Local currency)
Short term 20XX
Activity 1 … … …
… …
Total …
Medium term 20XX
Activity X … … …
Total …
Long term 20XX
Activity X …
Total …
Every PDNA chapter includes:
spelled-out recovery strategy
(1-2 pages)
table that details the proposed
recovery needs
The recovery needs are defined
either by:
short, medium and long-term,
or
financial years
The recovery needs include
an indicative cost analysis
In the case of ELSP there is no
standard formula:
cost are estimated based upon
previous experience
in consultation with other PDNA
sectors and key stakeholders
Recovery Strategy
SHORT TERM
…
MEDIUM TERM
…
LONG TERM
…
The identification of the recovery needs is
a crucial component of the PDNA.
The sum of the recovery needs informs the prospective resource
mobilisation of the government and development partners.

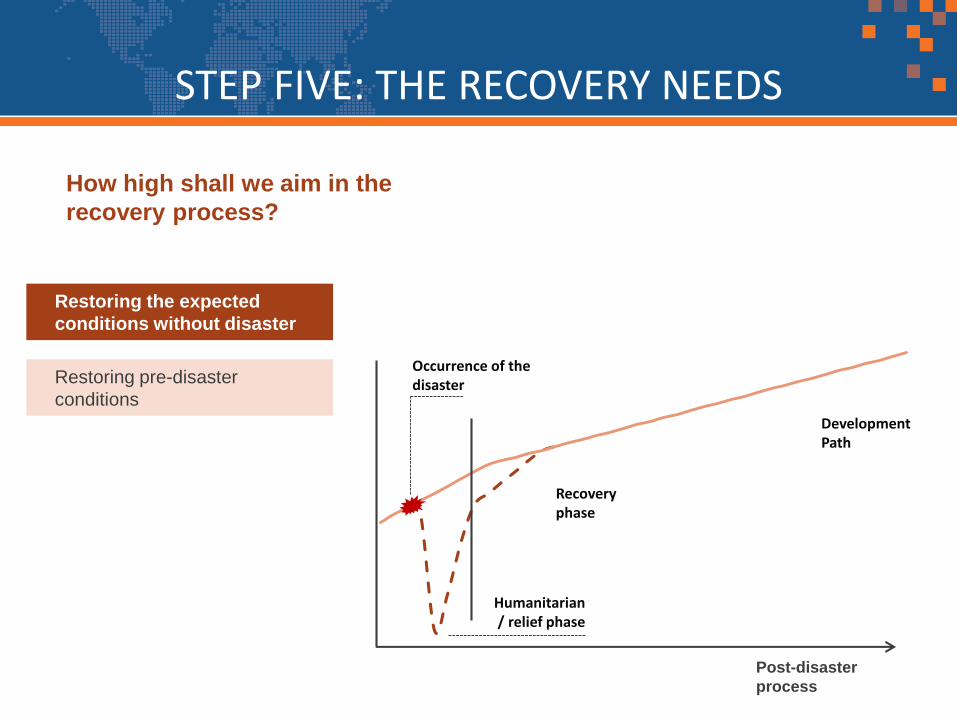
STEP FIVE: THE RECOVERY NEEDS
How high shall we aim in the
recovery process?
Natural hazard
Humanitarian / relief phase
Recovery phase
Tim
e
Restoring pre-disaster
conditions
Development Path
STEP FIVE: THE RECOVERY NEEDS
Restoring pre-disaster
conditions
Recovery phase
Humanitarian / relief phase
Restoring the expected
conditions without disaster
Development Path
Post-disaster
process
How high shall we aim in the
recovery process?
Occurrence of the disaster

STEP FIVE: THE RECOVERY NEEDS
Restoring the expected
conditions without disaster
Build Back Better (BBB)
Recovery phase
Humanitarian / relief phase
Restoring pre-disaster
conditions
Development Path
Post-disaster
process
How high shall we aim in the
recovery process?
Occurrence of the disaster

STEP FIVE: THE RECOVERY NEEDS
The role of disaster risk reduction strategies and
preparedness programmes on the recovery
process
Occurrence of the disaster
Post-disaster
process
Original development path
Relief – Early recovery – Recovery
and reconstruction
Three-tracks
approach:
Damage and losses with a mitigation strategy and a social protection system in place
Impact mitigation measures
Reduction in social stress and suffrance + Resilience
Preparedness
Resilience
Response
Recovery
Prevention and mitigation

STEP FIVE: THE RECOVERY NEEDS
Income security /
access to basic
social services
Reconstruction /
recovery process
Track C
Track B
Track A
Track A aims at stabilizing income generation
and creating emergency employment and
cash-transfer programmes for high-risk groups
and groups with urgent needs.
Track B aims at promoting employment
opportunities where recovery takes place. The
scope of participating actors is wider, and
capacity and institution building becomes
central.
Track C involves support to policies and
institutional capacity development at the
national level. The ultimate goal is to promote a
long-term development framework that
sustains productive employment, decent work
and ensures the fundamental right to social
protection.
The three-track approach: from immediate income generation to medium and long
term employment recovery
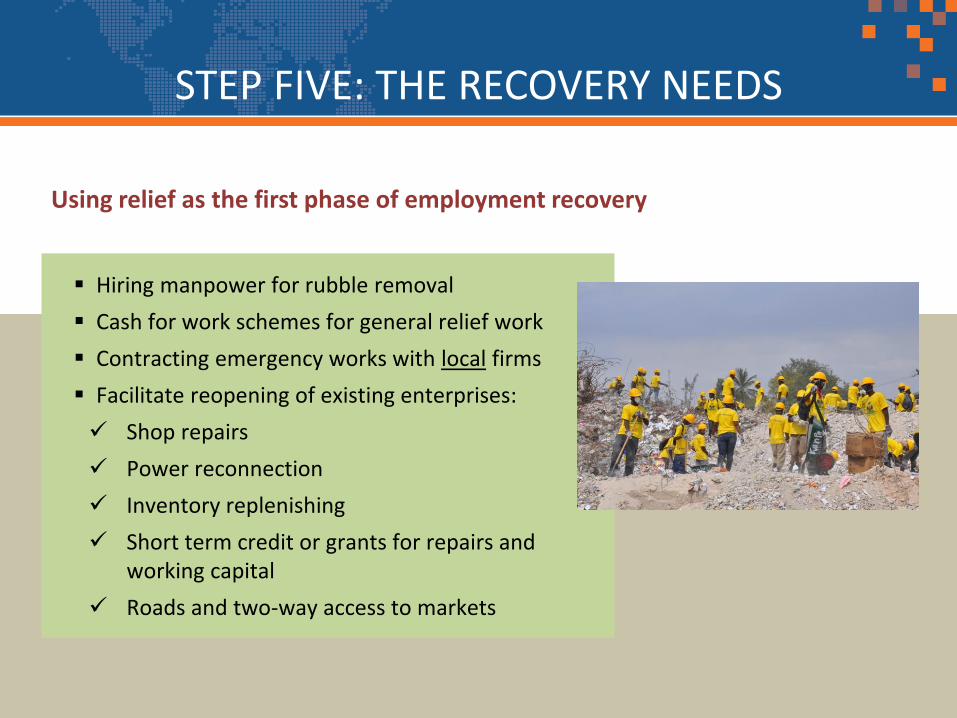
STEP FIVE: THE RECOVERY NEEDS
Hiring manpower for rubble removal
Cash for work schemes for general relief work
Contracting emergency works with local firms
Facilitate reopening of existing enterprises:
Shop repairs
Power reconnection
Inventory replenishing
Short term credit or grants for repairs and working capital
Roads and two-way access to markets
Using relief as the first phase of employment recovery

STEP FIVE: THE RECOVERY NEEDS
Reactivation of the demand side
Cash transfers
Labour intensive employment projects
Public demand for goods and services during relief and reconstruction
Reactivation of the supply side
Reconstruction of productive equipment and infrastructure (industry and commerce)
Reconnection of power lines and transport infrastructure
Short-term credit for repairs, working capital, hiring staff and rebuild inventories
Two-sided approach: recovery centered on economic reactivation of the demand and supply of goods and services

STEP FIVE: THE RECOVERY NEEDS
Policies for accelerated job creation
• Emphasis in labour intensive activities
• Public works using local labour and local firms
• Reactivation of self employment (via support to farms and microenterprises)
• Support of wage employment recovery via reactivation of local private enterprises (especially small and medium firms)
• Support to reactivation of markets for goods and services (roads, power lines, credit)
STEP FIVE: THE RECOVERY NEEDS
Post disaster employment requires new skills, new skills require
training
Post disaster employment may require training in new and
scarce skills:
Skills demanded for recovery itself
Examples: carpenters, electricians, builders
Skills for new jobs when the old job is not
recoverable
Example: Farmland covered by avalanche
farmers relocated to urban jobs
training needs in various trades
Skills in new techniques required for BBB
Example: New skills for earthquake-resistant housing
construction

EXAMPLE: Nepal PDNA 2015
ELSP Recovery Needs Table
Recovery needs
defined per
Financial Year…

Recovery needs
defined by
Short, Medium and
Long-term…
EXAMPLE: Vanuatu PDNA 2015
ELSP Recovery Needs Table

For further information please contact:
Fragile States and Disaster Response (FSDR)
Development and Investment Branch / Employment Policy Department
International Labour Organization
Julian Schweitzer, Junior Technical Officer ([email protected])
Federico Negro, Specialist ([email protected])
Donato Kiniger, Coordinator ([email protected])
Terje Tessem, Director ([email protected])
Discussion
Questions?
?
?