environmental predictors of cyanobacteria biovolumes … · environmental predictors of...
TRANSCRIPT
ENVIRONMENTAL PREDICTORS OF CYANOBACTERIA BIOVOLUMES AND ALGAL
DOMINANCE IN LIBERTY LAKE, WA
By
SANDRA SUZANNE MEAD
A thesis submitted in partial fulfillment of
the requirements for the degree of
MASTER OF SCIENCE IN NATURAL RESOURCE SCIENCE
WASHINGTON STATE UNIVERSITY
Department of Natural Resource Sciences
MAY 2011

ii
To the Faculty of Washington State University:
The members of the Committee appointed to examine the thesis of
SANDRA SUZANNE MEAD find it satisfactory and recommend that it be accepted.
___________________________________
Barry C. Moore, Ph.D., Chair
___________________________________
Marc Beutel, Ph.D.
___________________________________
Cailin Huyck-Orr, Ph.D.

iii
ACKNOWLEDGEMENT
I would like to thank Dr. Barry Moore for serving as my advisor, and his advice while I prepared
this document. I would also like to thank Dr. Cailin Huyck-Orr and Dr. Marc Beutel for serving
as committee members. I extend appreciation to BiJay Adams with the Liberty Lake Sewer and
Water District for significantly aiding my data compilation.

iv
ENVIRONMENTAL PREDICTORS OF CYANOBACTERIA BIOVOLUMES AND ALGAL
DOMINANCE IN LIBERTY LAKE, WA
Abstract
By Sandra Suzanne Mead, M.S.
Washington State University
May 2011
Chair: Barry C. Moore
Cyanobacteria blooms occurred in Liberty Lake in 1970s due to cultural eutrophication. Grass
root efforts prompted water quality monitoring and restoration as algal blooms intensified.
Internal and external nutrient loading reduction strategies have decreased cyanobacteria blooms
to rare events. As restoration science and cyanobacteria knowledge was developing, the
phosphorus paradigm guided restoration projects. Liberty was one of the earliest restoration
projects based on the paradigm. The paradigm has been debated among scientists due to
advances in lake ecology understanding. Analyzing projects based on the paradigm is important
to validate effects on cyanobacteria blooms. The long term dataset collected for Liberty enabled
analysis of environmental variability and potential factors that influence cyanobacteria blooms.
Cyanobacteria biovolumes and algal dominance related primarily to phosphorus. Phosphorus
reduction strategies appear to have been effective in reducing cyanobacteria blooms in Liberty
Lake as decreasing trends in cyanobacteria biovolumes and dominance of the phytoplankton
were observed since the restoration. Our findings reinforce traditional limnology science
concerning cyanobacteria and nutrient requirements. This study is an important asset to
restoration science because it incorporates multiple years of data from one of the first restoration
projects in the country.

v
TABLE OF CONTENTS
ACKNOWLEDGEMENT ........................................................................................................... iii
ABSTRACT .................................................................................................................................. iv
LIST OF TABLES ...................................................................................................................... vii
LIST OF FIGURES ................................................................................................................... viii
CHAPTER 1: INTRODUCTION ................................................................................................ 1
Description of Study Area .......................................................................................................... 3
Historical Degradation and Restoration ...................................................................................... 5
GOALS AND OBJECTIVES ...................................................................................................... 7
CHAPTER 2: METHODS ........................................................................................................... 8
Sample and Data Collection........................................................................................................ 8
Data Analysis .............................................................................................................................. 9
Physical Parameters ................................................................................................................ 9
Chemical Parameters ............................................................................................................ 10
Biological Parameters ........................................................................................................... 10
Statistical Analysis .................................................................................................................... 11
CHAPTER 3: RESULTS ........................................................................................................... 14
Overview of Data ...................................................................................................................... 14
Predictors to Cyanobacteria Biovolumes .................................................................................. 18
Predictors to Cyanobacteria Blooms ......................................................................................... 20
Predictors to Non-Bloom Conditions........................................................................................ 22
Environmental Predictors to Cyanobacteria Dominance .......................................................... 25
CHAPTER 4: DISCUSSION ..................................................................................................... 29
vi
Water Column Stability ............................................................................................................ 29
Temperature and Precipitation .................................................................................................. 29
pH and Specific Conductivity ................................................................................................... 30
Phosphorus and Nitrogen .......................................................................................................... 31
Biological Interactions .............................................................................................................. 33
CHAPTER 5: CONCLUSIONS ................................................................................................ 35
REFERENCES ............................................................................................................................ 38
APPENDIX .................................................................................................................................. 42
Appendix A. Physical Parameter Data ......................................................................................... 43
Appendix B. Chemical Parameter Data ........................................................................................ 50
Appendix C. Biological Parameter Data ....................................................................................... 57
Appendix D. Boxplots of Yearly Physical, Chemical and Biological Data ................................. 70
Appendix E. Scatterplots with Regression Line ........................................................................... 79

vii
LIST OF TABLES
1. Table 1. Environmental parameters collected for data analysis. ........................................ 9
2. Table 2. Stepwise regression analysis for all cyanobacteria biovolumes. ........................ 19
3. Table 3.Multiple linear regression analysis for all cyanobacteria biovolumes ................. 19
4. Table 4. Stepwise regression analysis for high cyanobacteria biovolumes ...................... 21
5. Table 5. Multiple linear regression analysis for high cyanobacteria biovolumes. ............ 21
6. Table 6. Stepwise regression analysis for low cyanobacteria biovolumes ....................... 23
7. Table 7. Multiple linear regression analysis for low cyanobacteria biovolume ............... 23
8. Table 8. Stepwise regression analysis for cyanobacteria percent ..................................... 26
9. Table 9. Multiple linear regression analysis for cyanobacteria percent. ........................... 27
10. Table 10 Summary of findings from all analyses. ............................................................ 28

viii
LIST OF FIGURES
1. Figure 1. Liberty Lake study site. ..................................................................................... 13
2. Figure 2. Yearly mean and maximum cyanobacteria and phytoplankton biovolumes. .... 15
3. Figure 3 Monthly mean and maximum cyanobacteria and phytoplankton biovolumes. .. 16
4. Figure 4. Frequency of cyanobacteria biovolumes ........................................................... 17
5. Figure 5. Yearly cyanobacteria dominance. ..................................................................... 17
6. Figure 6. Frequency of sampling dates per month from years with dominanting
cyanobacteria biovolumes ................................................................................................. 16
7. Figure 7. Pie charts of bloom and non-bloom years showing yearly percent proportion of
data within dataset............................................................................................................. 24
8. Figure 8. Months with bloom and non-bloom conditions. ................................................ 25

ix
Dedication
I am dedicating my efforts in preparing this document to my husband, and all my years of
schooling to my mother. They have helped me tremendously in life by providing emotional and
financial support. Their encouraging wisdom has allowed me to accomplish my educational
goals and preparation for life.
1
CHAPTER 1
INTRODUCTION
Cyanobacteria are different from ordinary algae comprising the phytoplankton population in
lakes; they are referred to as blue green algae, but taxonomically are classified as bacteria.
Cyanobacteria are aerobic photoautotrophs with photosynthesis providing energy metabolism
(Mur, Skulberg and Utkilen 1999) and are capable of producing toxins (Chorus and Bartram
1999). Photosynthesizing ability, along with similar nutrient and environmental requirements
justifies cyanobacteria’s incorporation into the phytoplankton population.
Phytoplankton sink in stable water conditions because their distribution in the water column is
governed by water currents. Cyanobacteria can move vertically in the water column via
buoyancy regulation, alleviating stable water constraints. Changing cell density, collapsing gas
vacuoles and reducing gas vesicle synthesis are mechanisms used to regulate buoyancy (Oliver
and Ganf 2000). Buoyancy allows advantages including floatation towards the photic zone for
light and access to nutrient supplies available at depth (Oliver and Ganf 2000). Phosphorus is
crucial limiting factor for primary productivity in aquatic systems. The Redfield ratio describes
phytoplankton as requiring nitrogen and phosphorus in the ratio of 16: 1. With high phosphorus
loading environments, nitrogen may become limiting. This favors cyanobacteria, which can fix
atmospheric nitrogen in specialized heterocyst cells as sources of nitrogen are depleted.
Buoyancy regulation coupled with nitrogen fixation capabilities enhance cyanobacteria’s ability
to compete with true algae in stable conditions and high phosphorus affected systems (Paerl
1995).
Cyanobacteria proliferation and dominance within the phytoplankton community alters

2
ecosystems. Ecosystem structure becomes controlled by nutrient supply and primary producers.
Cyanobacteria blooms increase light attenuation in the photic zone, shading out macrophytes and
other algal species. Proliferation creates green water, surface scums and odiferous decaying mats
of algae and plant matter. Microbial decomposition of mats depletes dissolved oxygen, leading to
fish kills and reduced biodiversity. Toxins produced by cyanobacteria present concerns for lake
users. To protect public health from toxins, lakes and beaches close with cyanobacteria blooms
above threshold values (Chorus and Bartram 1999). Closures due to cyanobacteria blooms
damage revenue for surrounding economies striving on tourism.
The unappealing aesthetics of cyanobacteria blooms diminishes perceived water body value,
negatively affecting local economies. Algae blooms reduce home sales, accounting for almost
$2.2 billion in annual economic losses in the United States (Dodds et al. 2009). Anthropogenic
activities accelerate algae blooms and increase economic losses. Cyanobacteria blooms are
closely associated with human activities. Excess phosphorus and nitrogen entering waterways
stimulate algae and creates optimal conditions for cyanobacteria. Blooms constitute a common
global environmental problem and serious threat to quality and sustainability of aquatic
ecosystems. Frequency and intensity of blooms are increasing worldwide, with changing climate
conditions encouraging earlier and longer lasting blooms (Erdner et al. 2008, Moore et al. 2008).
Cyanobacteria prevalence in water bodies is a major concern due to threats to aquatic
ecosystems, economic revenue, biological integrity and human health.
Scientific research is striving to identify environmental parameters and interactions promoting
cyanobacteria growth and dominance. Phosphorus enrichment has long been recognized to
stimulate cyanobacteria and algae, producing a paradigm among the scientific community
(Schindler 1977, Sterner 2008). The phosphorus paradigm guided early restoration projects as
3
restoration science and cyanobacteria knowledge was developing. The paradigm has been
debated among scientists due to advances in lake ecology understanding (Sterner 2008, Lewis
and Wurtsbaugh 2008). Analyzing early projects based on the paradigm is important to assess
whether cyanobacteria blooms have been affected by phosphorus reductions. This Liberty Lake
study is an important asset to the limnology field because it incorporates multiple years of data
from one of the first restoration projects in the country.
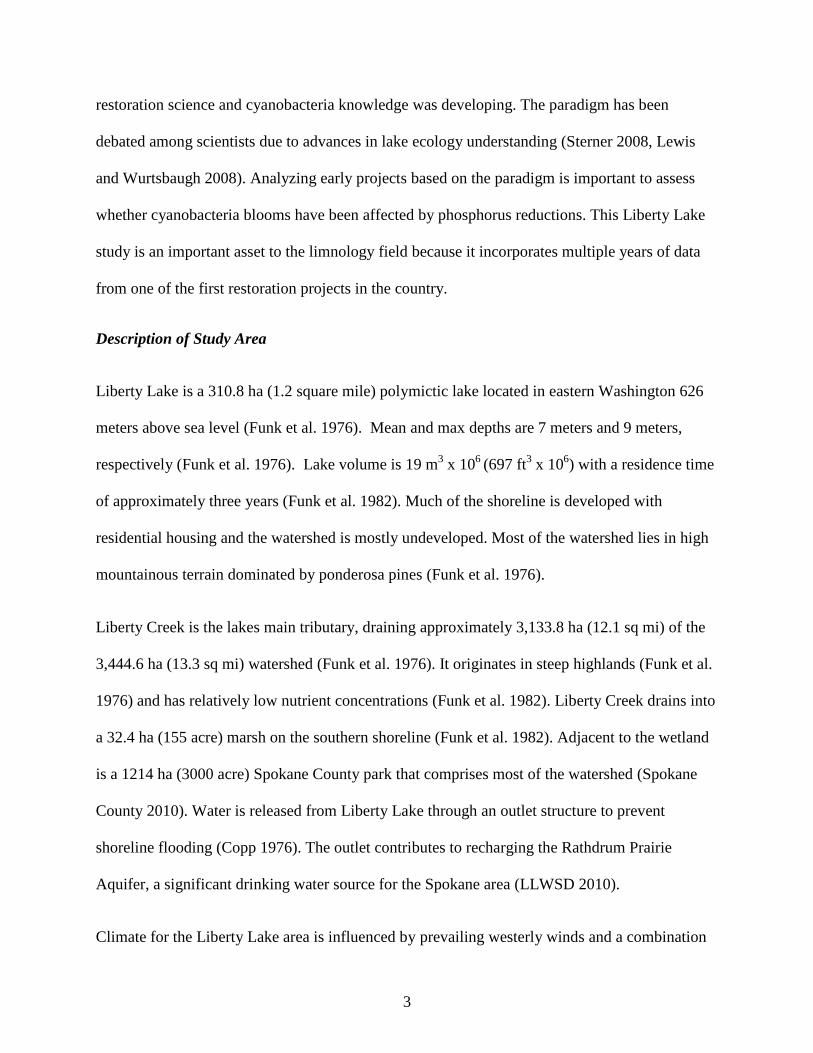
Description of Study Area
Liberty Lake is a 310.8 ha (1.2 square mile) polymictic lake located in eastern Washington 626
meters above sea level (Funk et al. 1976). Mean and max depths are 7 meters and 9 meters,
respectively (Funk et al. 1976). Lake volume is 19 m3 x 10
6 (697 ft
3 x 10
6) with a residence time
of approximately three years (Funk et al. 1982). Much of the shoreline is developed with
residential housing and the watershed is mostly undeveloped. Most of the watershed lies in high
mountainous terrain dominated by ponderosa pines (Funk et al. 1976).
Liberty Creek is the lakes main tributary, draining approximately 3,133.8 ha (12.1 sq mi) of the
3,444.6 ha (13.3 sq mi) watershed (Funk et al. 1976). It originates in steep highlands (Funk et al.
1976) and has relatively low nutrient concentrations (Funk et al. 1982). Liberty Creek drains into
a 32.4 ha (155 acre) marsh on the southern shoreline (Funk et al. 1982). Adjacent to the wetland
is a 1214 ha (3000 acre) Spokane County park that comprises most of the watershed (Spokane
County 2010). Water is released from Liberty Lake through an outlet structure to prevent
shoreline flooding (Copp 1976). The outlet contributes to recharging the Rathdrum Prairie
Aquifer, a significant drinking water source for the Spokane area (LLWSD 2010).
Climate for the Liberty Lake area is influenced by prevailing westerly winds and a combination

4
of continental and marine weather patterns. The area is separated from the Pacific Ocean by the
Cascade Mountain Range and 328.8 km (200 miles) of semi-arid land (Funk et al 1976). Liberty
Lake warms gradually from spring to fall and cools into winter (Moore et al. 2010). Shallow
bathymetry and small size allows multiple thermal mixing events throughout the growing season.
Extended periods of low wind speeds and high air temperatures produce vertical layers.
Stratification is weak and short lived in Liberty Lake, occurring intermittently during summer
months (Moore et al. 2010). Layers significantly contribute to chemical cycling from bottom
sediments (Moore et al. 2010).
Liberty Lake is important for recreational fishing. Public is allowed access through the
county park and a public boat launch owned and operated by the Washington Department of
Fish and Wildlife (Phillips, Divens and Donley 1999). Natural fish populations residing in
the lake included largemouth bass (Micropterus salmoides Lacepède 1802), smallmouth
bass (Micropterus dolomieui Lacepède 1802), black crappie (Pomoxis nigromaculatus
Lesueur 1829), yellow perch (Perca flavescens Mitchill 1814), yellow bullhead (Ictalurus
natalis Lesueur 1819), brown bullhead (Ameiurus nebulosus Lesueur 1819), pumpkinseed
sunfish (Lepomis gibbosus Linnaeus 1758) and bluegill sunfish (Lepomis macrochirus
Rafinesque 1819) (Phillips, Divens and Donley 1999). Rainbow trout (Oncorhynchus mykiss
Walbaum 1792) and brown trout (Salmo trutta Kessler, 1874) were stocked from 1980s to
1990s to improve fishery quality (Phillips, Divens and Donley 1999). Walleye (Stizostedion
vitreum Mitchell 1818) was stocked in 1990s to enhance fishing opportunities and diversity
(Phillips, Divens and Donley 1999). Liberty has become managed as a mixed-species
fishery with rainbow trout, brown trout and walleye stocked annually (Phillips, Divens and
Donley 1999).

5
Historical Degradation and Restoration
Liberty Lake has been a popular vacation and recreation area since the 1900s (LLSWD 2010).
Popularity and close proximity to larger cities led to rapid urbanization in the area. Development
along shorelines brought excess nutrients to the lake, resulting in cultural eutrophication. Septic
tank seepage from residential housing significantly contributed to nutrient loading (Funk et
al.1976). Highly permeable soils around the lake allowed for substantial leaching of nitrogen and
phosphorus (Funk et al. 1976).
The marsh would flood during high flow events in Liberty Creek when the lake outlet was
clogged. As water receded and drained from the wetland, nutrients flushed into the lake. Marsh
flushing and septic tank seepage were the main contributors to Liberty Lake nutrient enrichment
(Funk et al. 1976). Phosphorus was identified as the key element controlling primary
productivity (Funk et al. 1976).
Liberty Lake water quality started deteriorating after area urbanization. Dense algal blooms were
evident in 1960s and became common in late summer and early fall (Funk et al. 1976, Funk et al.
1982). Algae blooms intensified each year as cyanobacteria started dominating the
phytoplankton community. Cyanobacteria optimized resources and light in the photic zone with
competitive advantages and shaded out phytoplankton and macrophytes. Algae and macrophyte
decomposition increased microbial respiration, producing anoxic conditions that further released
nutrients from sediments (Funk et al. 1982). Dense odiferous scum mats accumulated at the
surface and became common along shorelines.
Cyanobacteria blooms ruined the valued aesthetics of Liberty Lake. After noticing drastic water
quality changes, residents wanted to enact restoration. Large algal blooms in 1968 and 1969

6
encouraged public decisions to improve water quality, prompting a series of restorative efforts
(Funk et al. 1982). Six phases of projects targeted external and internal nutrient loading
reductions. External nutrient loading was minimized by reducing wetland flooding, septic tank
usage and urban runoff. Liberty Creek was diverted around the wetland and separated with a dike
to prevent annual inundation. Outlet updates prevented clogging, and a wetland-lake dike
reduced nutrient flushing (Funk et al. 1982). Expansion and improvements to the wastewater
treatment plant and collection system extended services to nearly every home in the watershed
and reduced septic tank usage (Funk et al. 1975). An urban runoff management program was
developed to decrease nutrient runoff from developed areas (Funk et al. 1982).
Internal nutrient loading was reduced through application of dredging and alum treatments.
Phosphorus laden sediments were removed by hydraulic dredge in 1980s, followed with an alum
treatment (Funk et al. 1982, LLSWD 2010). Sediment removal reduced the phosphorus supply
available for recycling. Dredging was not as successful as anticipated due to inconsistent dredge
patterns in peat material, resulting in greater phosphorus availability from sediments (Moore,
Funk and Lafer 1988). The aluminum sulfate treatment reduced turbidity generated from
dredging by binding and removing phosphorus from the water column (Funk et al. 1982).
Macrophytes accelerated algal blooms by supplying a significant amount of phosphorus (Funk et
al. 1982). Phosphorus translocated from sediments to water through macrophyte senescence and
leakage (Moore 1981, Moore et al. 1984). To minimize further internal loading by macrophytes,
plant biomass was removed in the amount perceived to negatively impact water quality (Funk et
al. 1982).

7
GOALS AND OBJECTIVES
Cyanobacteria blooms are an increasing concern worldwide for reasons relating to public health
threats and ecosystem degradation. Blooms are the focus of many legislative activities in the
United States. Cyanobacteria are indicative to lake ecology and water quality health. Long term
studies of this nature are valuable assets to the scientific community. Findings will advance
knowledge of cyanobacteria bloom dynamics. Understanding environmental factors multifaceted
influence on cyanobacteria is crucial to prevention and prediction of blooms.
The main goal of this thesis was determining the most significant environmental predictors to
cyanobacteria in Liberty Lake. Physical, chemical and biological parameters were analyzed to
determine whether significantly related to cyanobacteria biovolumes. Another objective was
determining environmental parameter relationships to cyanobacteria bloom and non-bloom
conditions. The final objective was determining environmental parameters related to
cyanobacteria proportions in the phytoplankton population leading to algal dominance.

8
CHAPTER 2
METHODS
Sample and Data Collection
Lake water quality monitoring from pre-restoration to present has been conducted by
Washington State University (WSU), providing the long term dataset for this thesis. Field
sampling methods have remained consistent through the years, taking lake samples from boat
biweekly from spring to fall at stations designated as Northwest (NW) and Southeast (SE). The
NW station located towards the center of the lake with depth of 8 to 9 meters, while the SE
station is shallower, approximately 5 meter depth. Nutrient and phytoplankton samples were
collected at top, middle and bottom depths with profiles of temperature, pH, dissolved oxygen
(DO) and specific conductivity taken at meter depth intervals for stations on each sampling
event.
Data for 13 environmental parameters were compiled from April through October from years
1978 to 2010. No data was available for years 1979 to 1984, 1986, 1987, 1989, 1998 or 1999.
Specific weather data for Liberty Lake was not available throughout the whole dataset period.
The weather is considered similar to the Spokane area (Funk et al. 1976) which long term data
records were available. Wind velocity and precipitation data was collected from the National
Oceanic and Atmospheric Association [NOAA] archived local climatological database for the
Spokane, WA airport (NOAA 2010). Fish stocking data was obtained from the State of
Washington Department of Fish and Wildlife (Chris Donley, personal communication). All other
lake data was compiled in part from the Liberty Lake Sewer and Water District (BiJay Adams,
personal communication) and from historical data obtained from published and unpublished

9
records held at WSU. A list of physical, chemical and biological parameters collected for use in
this thesis are found in Table 1.
Table 1. Environmental parameters collected from years 1978 to 2010 for analysis of
cyanobacteria biovolumes and algal dominance.
Physical Parameters Chemical Parameters Biological Parameters
Wind Velocity (mph) Orthophosphorus (mg/L) Zooplankton Density (animals/m3)
Precipitation (inches) Total Phosphorus (mg/L) Fish Biomass (lbs)
Water Temperature (C) Dissolved Inorganic
Nitrogen (DIN) mg/L
Phytoplankton Biovolume (um3/ml)
Bottom Water Dissolved
Oxygen (mg/L)
DIN:DIP Ratio Cyanobacteria Biovolume (um3/ml)
Conductivity (uS/cm) pH
Data Analysis
To provide a whole lake estimate for each sampling date, certain parameters were volume
weighted for depth and station providing volume weighted averages. Other parameters were
averaged using daily data from preceding seven days not including the sampling date.
Physical Parameters
Averages for wind velocities were recorded in miles per hour (mph) for each sampling date.
Total precipitation was calculated by addition of precipitation inches (rainfall and snowfall) from
preceding seven days not including the sampling date and recorded in inches. Volume weighted
averages calculated for lake water temperatures were recorded in Celsius (C) for each sampling
date. Values recorded at the NW station bottom depth for dissolved oxygen (DO) were used for
the parameter bottom DO in mg/L. Conductivity data are average volume weighted values

10
recorded in uS/cm. See Appendix A for physical parameter data.
Chemical Parameters
Orthophosphorus and total phosphorus recorded in mg/L are average volume weighted values
along with pH. Dissolved inorganic nitrogen (DIN) is average volume weighted values recorded
in mg/L calculated from summing nitrate, nitrite and ammonia data. Ratio of DIN: DIP was
calculated by dividing average volume weighted values for DIN and orthophosphorus. Dissolved
N and P were used in analysis because total nitrogen data was not available, inhibiting traditional
TN: TP ratio calculations. Although dissolved inorganic concentrations do not quantify the total
available nitrogen or phosphorus, it serves as a useful approximation and surrogate. See
Appendix B for chemical parameter data.
Biological Parameters
Phytoplankton biovolumes (um3/ml) excluded cyanobacteria, and were volume weighted along
with zooplankton density (animals/m3) and cyanobacteria biovolumes (um
3/ml) for each date.
For thesis purposes, bloom conditions are referred to as cyanobacteria biovolumes greater than
100,000 um3/ml. This threshold bloom value involves the public health departments with posting
signage. Non-bloom conditions refer to cyanobacteria biovolumes less than 100,000 um3/ml.
Cyanobacteria percent was calculated for each date by dividing cyanobacteria biovolumes by
total phytoplankton biovolumes, and then multiplied by 100 obtaining a percent value. Total fish
biomass was calculated throughout the season for each year by summing biomass added each
stocking event and recorded in pounds (lbs). Fish data used in this way does not account for fish
lost to mortality throughout the season. Stocking data does not accurately represent true fish
populations, but does provide an approximation of top down predation. Zooplankton,
phytoplankton, cyanobacteria and fish biomass data was normalized with log transformations.

11
See Appendix C for biological parameter data.
Statistical Analysis
Minitab 16 statistical software was used to conduct statistical analysis (Minitab Inc. 2010). A
total of 215 sampling dates were compiled, with a variable number of sampling dates per year.
To standardize the data so that each date could be analyzed equally without missing values, only
sampling dates with completed values across each parameter were statistically examined. A total
of 89 dates out of 215 had complete data for all parameters. Environmental relationships to
cyanobacteria biovolumes and percent were analyzed from the full dataset. Bloom and non-
bloom conditions were analyzed by dividing the dataset into high and low cyanobacteria
biovolumes.
Regression analysis was used to investigate and model relationships between cyanobacteria and
environmental predictors. Forward-selecting stepwise regression using least square estimation
methods automatically built steps to identify predictor variables for cyanobacteria. Most
significant predictor variables were systematically added to each step, building a series of
models. The Minitab default 0.15 alpha limit determined inclusion and exclusion of variables. A
Mallow Cp value produced in each step aided in choosing a relatively precise and unbiased
model. An ideal Mallow Cp value represents the number of predictors chosen in stepwise
regression plus a constant. Best models were chosen based on closest values to the ideal.
Predictor variables selected by stepwise regression were analyzed with multiple linear regression
(MLR), determining significance and directed relationship with cyanobacteria using a
significance value of 0.05. Relationship directions were determined by either positive or negative
coefficients. In MLR, the variance inflation factor (VIF) determined the extent of

12
multicollinearity among environmental variables. A VIF of one indicates no correlation to other
predictors, one to five moderate correlation and greater than five high correlations.

13
Figure 1. Liberty Lake study site showing sampling stations Northwest (NW) and Southwest
(SW) and meter depth contours (Funk et al. 1982).
14
CHAPTER 3
RESULTS
Overview of Data
The compiled dataset included several years undergoing significant changes in nutrient regime
from restoration efforts; drastically changing water quality dynamics. Altered environmental
relationships provided a source of data variability over years. Variances in environmental
parameter data produced weak linear relationships to cyanobacteria biovolumes and dominance
(Figure 1 and 2 Appendix E).
Average and maximum phytoplankton biovolumes displayed an oscillating trend from years
1978 to 2010, while cyanobacteria biovolumes exhibited a generally decreasing trend (Figure 2).
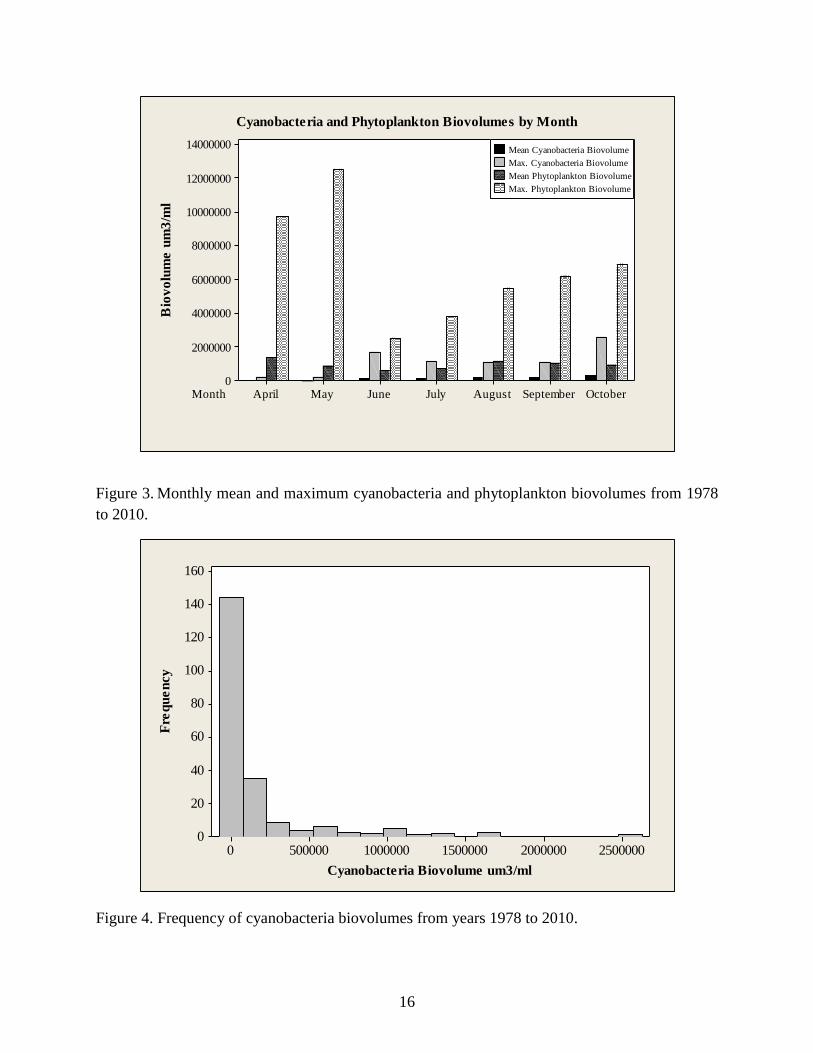
Phytoplankton biovolumes were highest in early season months (April and May), declining in
June as cyanobacteria biovolumes reached summer peak until October (Figure 3). Cyanobacteria
biovolumes were most frequently found less than 500,000 um3/ml from 1978 to 2010 (Figure 4).
Cyanobacteria dominated phytoplankton when biovolumes represented greater than 50% of total
phytoplankton biovolume. A decreasing trend was observed from 1978 to 2010 for percentage of
cyanobacteria within the phytoplankton population (Figure 5). Cyanobacteria dominance,
frequent in early years (pre-1995), has become rare in recent years. Dates with cyanobacteria
dominating phytoplankton were found in years 1978, 1985, 1990, 1991, 1993, 1994, 2000 and
2003. Cyanobacteria were dominant from June to October in these years and most frequent in
July and October (Figure 6).

15
Year20
1020
0920
0820
0720
0620
0520
0420
0320
0220
0120
0019
9719
9619
9519
9419
9319
9219
9119
9019
8819
8519
78
3000000
2500000
2000000
1500000
1000000
500000
0
Bio
vo
lum
es u
m3
/ml
Mean Cyanobacteria Biovolume
Mean Phytoplankton Biovolume
Mean Yearly Cyanobacteria and Phytoplankton Biovolumes
Year20
1020
0920
0820
0720
0620
0520
0420
0320
0220
0120
0019
9719
9619
9519
9419
9319
9219
9119
9019
8819
8519
78
14000000
12000000
10000000
8000000
6000000
4000000
2000000
0
Bio
vo
lum
e u
m3
/ml
Max. Cyanobacteria Biovolume
Max. Phytoplankton Biovolume
Maximum Yearly Cyanobacteria and Phytoplankton Biovolumes
Figure 2. Yearly mean (top) and maximum (bottom) cyanobacteria and phytoplankton
biovolumes from years 1978 to 2010
16
Month OctoberSeptemberAugustJulyJuneMayApril
14000000
12000000
10000000
8000000
6000000
4000000
2000000
0
Bio
vo
lum
e u
m3
/ml
Mean Cyanobacteria Biovolume
Max. Cyanobacteria Biovolume
Mean Phytoplankton Biovolume
Max. Phytoplankton Biovolume
Cyanobacteria and Phytoplankton Biovolumes by Month
Figure 3. Monthly mean and maximum cyanobacteria and phytoplankton biovolumes from 1978
to 2010.
25000002000000150000010000005000000
160
140
120
100
80
60
40
20
0
Cyanobacteria Biovolume um3/ml
Fre
qu
en
cy
Figure 4. Frequency of cyanobacteria biovolumes from years 1978 to 2010.

17
2010
2009
2008
2007
2006
2005
2004
2003
2002
2001
2000
1997
1996
1995
1994
1993
1992
1991
1990
1988
1985
1978
100
80
60
40
20
0
Year
Cyan
ob
acte
ria %
50
Boxplot of Percentage of Cyanobacteria
Figure 5. Yearly percentage of cyanobacteria in phytoplankton biovolumes from years 1978 to
2010 indicating dominating biovolumes above reference line at 50%.
OctoberSeptemberAugustJulyJune
5
4
3
2
1
0
Month
Nu
mb
er
of
Sam
pli
ng
Date
s
Cyanobacteria Dominant Months
Figure 6. Frequency of sampling dates per month from years with dominating cyanobacteria
biovolumes.

18
Predictors to Cyanobacteria Biovolumes
Stepwise regression was performed on all data from 1978 to 2010, using 13 environmental
variables (refer to Table 1) with the response variable as log cyanobacteria biovolume. The
dataset contained 215 dates, which 89 were analyzed as complete observation sets. Stepwise
regression produced six models, identifying six significant predictor variables to cyanobacteria
biovolumes. In order of significance, parameters selected were log phytoplankton biovolume,
pH, log fish biomass, orthophosphorus, DIN: DIP and bottom DO (Table 2).
Six predictors plus a constant gives an ideal Mallows Cp of 7.0. The model in step five was
determined as the best, based on the Mallows Cp value of 4.7. This value was closest to the ideal
between the six steps. The predictors log phytoplankton biovolume, pH, log fish biomass,
orthophosphorus and DIN:DIP were included in model five, and bottom DO was not. All
predictor variables were significant (p<0.05) in this model, and had significant relationships with
cyanobacteria biovolumes based on multiple linear regression (MLR) (Table 3). Bottom DO did
not significantly relate (p=0.446) with cyanobacteria biovolumes in MLR. Log phytoplankton
biovolume, pH and log fish biomass had positively directed relationships with log cyanobacteria
biovolumes, while relationships with orthophosphorus, DIN: DIP and bottom DO were negative
(Table 3). Variance inflation factor (VIF) values in MLR were less than 1.6 indicating little
correlation between predictors. See Figure 1 Appendix E for scatterplot data and linear
regression lines.

19
Table 2. Stepwise regression analysis using data from 1978 to 2010 with the response variable
log cyanobacteria biovolumes and 13 environmental variables as predictors. Results are given for
six models with the coefficient (top value) and p-value (bottom value) displayed for each
predictor. Each model displays square root of MSE (S), coefficient of determination (R2) and
Mallows Cp. N=89 dates
Step 1 2 3 4 5 6
Log Phyto. Biovolume 0.91
0.000
0.62
0.001
0.43
0.031
0.39
0.043
0.43
0.020
0.47
0.011
pH 0.45
0.002
0.46
0.001
0.41
0.003
0.58
0.000
0.47
0.002
Log Fish Biomass 0.191
0.017
0.192
0.014
0.219
0.004
0.240
0.001
Orthophosphorus -88
0.017
-125
0.001
-135
0.000
DIN:DIP -0.003
0.002
-0.003
0.003
Bottom Water DO -0.061
0.040
S
R2
Mallows Cp
0.877
24.42
32.5
0.834
32.47
22.0
0.811
36.86
17.2
0.788
41.05
12.6
0.749
47.42
4.7
0.734
50.08
2.6
Table 3.Multiple linear regression analysis for log cyanobacteria biovolume and environmental
parameters selected from stepwise regression. Displays coefficient, standard error of coefficient,
p-value and variance inflation factor for each predictor. Square root of MSE (S) and coefficient
of determination (R2) shown for regression model. N=112 dates
Predictor Variables Coefficient SE Coefficient p-value VIF
Log Phyto. Biovolume 0.642 0.166 0.000 1.505
pH 0.448 0.132 0.001 1.592
Log Fish Biomass 0.185 0.069 0.009 1.271
Orthophosphorus -104.53 32.41 0.002 1.178
DIN:DIP -0.003 0.001 0.004 1.484
Bottom Water DO -0.018 0.024 0.446 1.181
S=0.7906 R2=43.1%

20
Predictors to Cyanobacteria Blooms
Cyanobacteria blooms occurred in 14 out of 22 years. Year 1978 represented 25.6% of the data
within the dataset and had the most blooms. This was followed by years 2000 and 2001 each
representing 11.3% of the data within the dataset (Figure 7). Blooms were found in months April
through October, and most frequently found in August and September (Figure 8).
Stepwise regression produced seven models with log cyanobacteria biovolume as the response
and all 13 environmental parameters as predictor variables. The dataset contained 61 dates, of
which 15 were analyzed as complete observation sets. In order of significance, parameters
selected were dissolved inorganic nitrogen (DIN), log fish biomass, water temperature, log
zooplankton density, conductivity, wind velocity and total precipitation (Table 4).
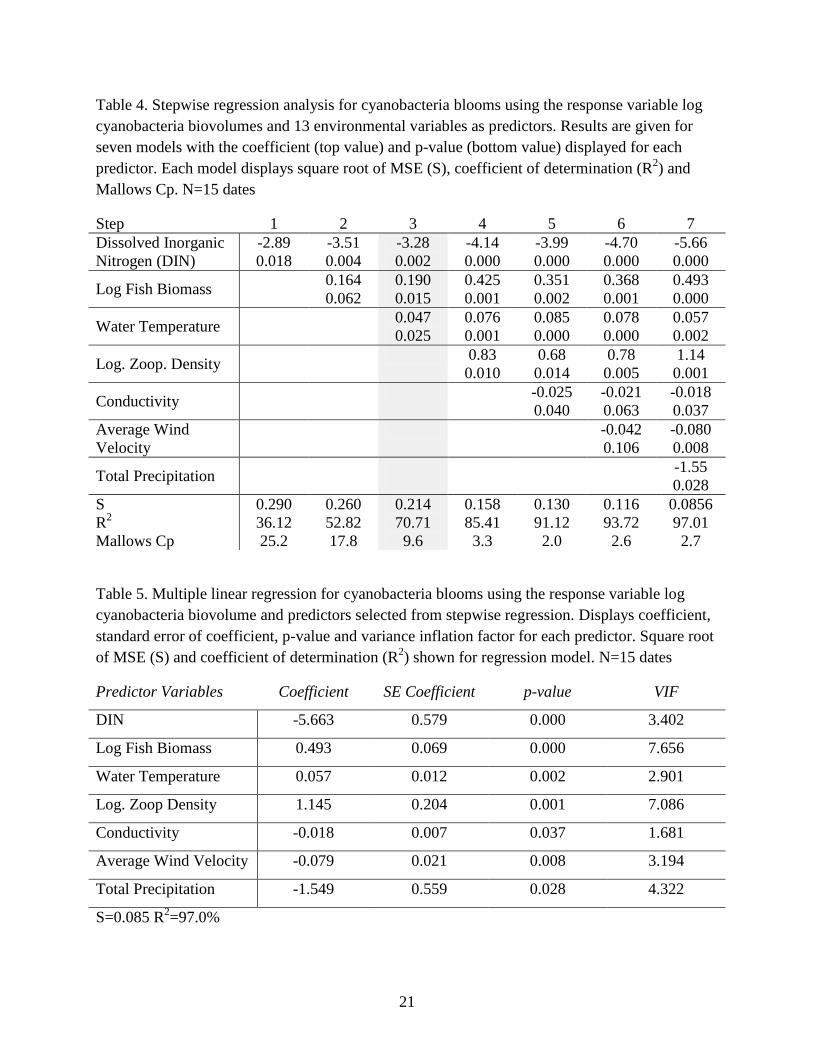
Seven predictor variables plus a constant gives an ideal Mallows Cp of 8.0. The model in step
three was determined as the best, based on the Mallows Cp value of 9.6. This value was closest
to the ideal between the seven models. Predictor variables DIN, log fish biomass and water
temperature were included in step three, and were significant (p<0.05) in this model. All seven
predictor variables selected from stepwise regression were significantly related with
cyanobacteria based on MLR (Table 5). Parameters log fish biomass, water temperature and log
zooplankton density had positively directed relationships with cyanobacteria blooms, while
relationships with DIN, conductivity, wind velocity and total precipitation were negative (Table
5). The variance inflation factors in MLR found moderate to high correlations between predictor
variables that ranged from 1.681 to 7.656 (Table 5). See Figure 3 of Appendix E for scatterplot
data and linear regression lines.
21
Table 4. Stepwise regression analysis for cyanobacteria blooms using the response variable log
cyanobacteria biovolumes and 13 environmental variables as predictors. Results are given for
seven models with the coefficient (top value) and p-value (bottom value) displayed for each
predictor. Each model displays square root of MSE (S), coefficient of determination (R2) and
Mallows Cp. N=15 dates
Step 1 2 3 4 5 6 7
Dissolved Inorganic
Nitrogen (DIN)
-2.89
0.018
-3.51
0.004
-3.28
0.002
-4.14
0.000
-3.99
0.000
-4.70
0.000
-5.66
0.000
Log Fish Biomass 0.164
0.062
0.190
0.015
0.425
0.001
0.351
0.002
0.368
0.001
0.493
0.000
Water Temperature 0.047
0.025
0.076
0.001
0.085
0.000
0.078
0.000
0.057
0.002
Log. Zoop. Density 0.83
0.010
0.68
0.014
0.78
0.005
1.14
0.001
Conductivity -0.025
0.040
-0.021
0.063
-0.018
0.037
Average Wind
Velocity
-0.042
0.106
-0.080
0.008
Total Precipitation
-1.55
0.028
S
R2
Mallows Cp
0.290
36.12
25.2
0.260
52.82
17.8
0.214
70.71
9.6
0.158
85.41
3.3
0.130
91.12
2.0
0.116
93.72
2.6
0.0856
97.01
2.7
Table 5. Multiple linear regression for cyanobacteria blooms using the response variable log
cyanobacteria biovolume and predictors selected from stepwise regression. Displays coefficient,
standard error of coefficient, p-value and variance inflation factor for each predictor. Square root
of MSE (S) and coefficient of determination (R2) shown for regression model. N=15 dates
Predictor Variables Coefficient SE Coefficient p-value VIF
DIN -5.663 0.579 0.000 3.402
Log Fish Biomass 0.493 0.069 0.000 7.656
Water Temperature 0.057 0.012 0.002 2.901
Log. Zoop Density 1.145 0.204 0.001 7.086
Conductivity -0.018 0.007 0.037 1.681
Average Wind Velocity -0.079 0.021 0.008 3.194
Total Precipitation -1.549 0.559 0.028 4.322
S=0.085 R2=97.0%

22
Predictors to Non-Bloom Conditions
Each year contained low cyanobacteria biovolumes except years 1988, 1990 and 1993. These
years had four or less sampling dates, all occurring in late season months. Each year represented
a fairly even percentage of data within the dataset (Figure 7). Low biovolumes were found in
months April through September, and most frequently found in May and June (Figure 8).
Stepwise regression produced six models with log cyanobacteria biovolume as the response and
13 environmental parameters as predictor variables. The dataset contained a total of 156 dates,
which 74 were analyzed as complete observation sets. In order of significance, parameters
selected were log phytoplankton biovolume, bottom DO, orthophosphorus, log fish biomass, log
zooplankton density and wind velocity (Table 6).
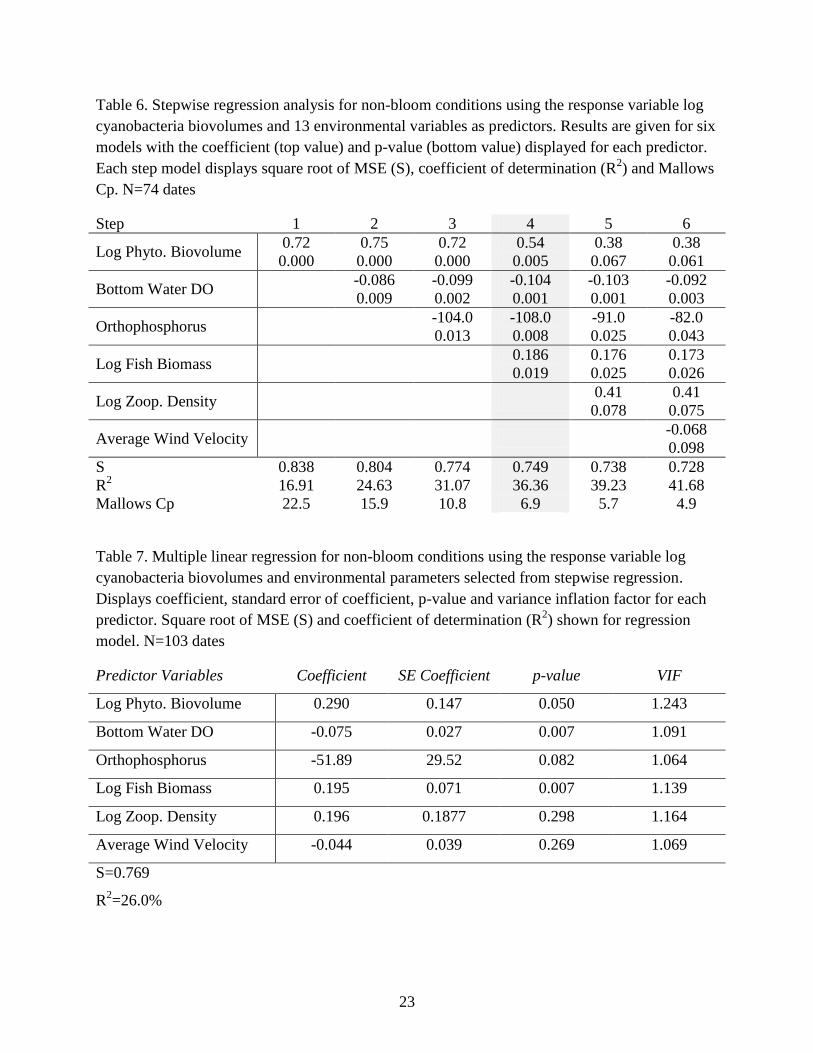
Six predictors plus a constant gives an ideal Mallows Cp of 7.0. The model in step four was
determined as the best, based on the Mallows Cp value of 6.9. This value was closest to the ideal
between the six steps. Model four included log phytoplankton biovolume, bottom DO,
orthophosphorus and log fish biomass. Log phytoplankton biovolume, bottom DO and log fish
biomass significantly related with log cyanobacteria biovolumes based on MLR (Table 7). The
parameters log phytoplankton biovolume, log fish biomass and log zooplankton density had
positively directed relationships with cyanobacteria, while relationships with bottom DO,
orthophosphorus and wind velocity were negative. The variance inflation factor in MLR ranged
from 1.064 to 1.243, indicating little multicolinearity between predictor variables (Table 7). See
Figure 4 of Appendix E for scatterplot data and linear regression lines.
23
Table 6. Stepwise regression analysis for non-bloom conditions using the response variable log
cyanobacteria biovolumes and 13 environmental variables as predictors. Results are given for six
models with the coefficient (top value) and p-value (bottom value) displayed for each predictor.
Each step model displays square root of MSE (S), coefficient of determination (R2) and Mallows
Cp. N=74 dates
Step 1 2 3 4 5 6
Log Phyto. Biovolume 0.72
0.000
0.75
0.000
0.72
0.000
0.54
0.005
0.38
0.067
0.38
0.061
Bottom Water DO -0.086
0.009
-0.099
0.002
-0.104
0.001
-0.103
0.001
-0.092
0.003
Orthophosphorus -104.0
0.013
-108.0
0.008
-91.0
0.025
-82.0
0.043
Log Fish Biomass 0.186
0.019
0.176
0.025
0.173
0.026
Log Zoop. Density 0.41
0.078
0.41
0.075
Average Wind Velocity -0.068
0.098
S 0.838 0.804 0.774 0.749 0.738 0.728
R2 16.91 24.63 31.07 36.36 39.23 41.68
Mallows Cp 22.5 15.9 10.8 6.9 5.7 4.9
Table 7. Multiple linear regression for non-bloom conditions using the response variable log
cyanobacteria biovolumes and environmental parameters selected from stepwise regression.
Displays coefficient, standard error of coefficient, p-value and variance inflation factor for each
predictor. Square root of MSE (S) and coefficient of determination (R2) shown for regression
model. N=103 dates
Predictor Variables Coefficient SE Coefficient p-value VIF
Log Phyto. Biovolume 0.290 0.147 0.050 1.243
Bottom Water DO -0.075 0.027 0.007 1.091
Orthophosphorus -51.89 29.52 0.082 1.064
Log Fish Biomass 0.195 0.071 0.007 1.139
Log Zoop. Density 0.196 0.1877 0.298 1.164
Average Wind Velocity -0.044 0.039 0.269 1.069
S=0.769
R2=26.0%

24
19785.0%1985
3.8%
19910.6%
19921.3%
19940.6%
19953.8%
19963.2%
19976.4%
20001.9%
20014.5%
20028.9%
20037.6% 2004
8.3%
20058.3%
20066.4%
20078.3%
20087.0%
20097.0%
20107.0%
Years with Cyanobacteria Biovolumes less than 100,000 um3/ml
197825.6%
19854.8%
19886.4%
19906.4%
19918.1%
19923.2%
19934.8%
19946.5%
19961.6%
200011.3%
200111.3%
20033.2%
20043.2%
20063.3%
Years with Cyanobacteria Biovolumes Greater than 100,000 um3/ml
Figure 7. Pie chart representation of non-bloom years (top) and bloom years (bottom) showing
yearly percent proportion of data within the dataset.

25
OctoberSeptemberAugustJulyJuneMayApril
30
20
10
0
Month
Fre
qu
en
cy
OctoberSeptemberAugustJulyJuneMayApril
30
20
10
0
Month
Fre
qu
en
cy
Months with Cyanobacteria Biovolumes less than 100,000 um3/ml
Months with Cyanobacteria Biovolumes Greater than 100,000 um3/ml
Figure 8. Frequency of dates from months with non-bloom conditions (top) and bloom
conditions (bottom) from years 1978 to 2010.
Environmental Predictors to Cyanobacteria Dominance
Stepwise regression was performed on all data from 1978 to 2010, using 13 environmental
predictor variables and cyanobacteria percent as the response. The dataset contained 215 dates,
of which 93 were analyzed as complete observation sets. Stepwise regression produced seven
steps, identifying six significant predictor variables to cyanobacteria percent. In order of
significance, parameters selected were pH, log phytoplankton biovolume, log fish biomass, DIN,
orthophosphorus and DIN:DIP (Table 8).
Six predictors plus a constant gives an ideal Mallows Cp of 7.0.The model in step six was
determined as the best, based on the Mallows Cp of 5.6. This value was closest to the ideal

26
between the six steps. All predictor variables were included in model six, and significant in the
model except DIN. All parameters were significantly related with cyanobacteria percent, except
DIN based on MLR (Table 9). The parameters pH and log fish biomass had positively directed
relationships with cyanobacteria, while relationships with log phytoplankton biovolumes, DIN,
orthophosphorus and DIN:DIP were negative (Table 9). The variance inflation factor in MLR
ranged from 1.320 to 2.415, indicating little multicolinearity between predictor variables. See
Figure 4 of Appendix E for scatterplot data and linear regression lines.
Table 8. Stepwise regression analysis for cyanobacteria dominance using the response variable
cyanobacteria percent and 13 environmental variables as predictors. Results are given for seven
models with the coefficient (top value) and p-value (bottom value) displayed for each predictor.
Each step model displays square root of MSE (S), coefficient of determination (R2) and Mallows
Cp. N=93 dates
Step 1 2 3 4 5 6 7
pH 4.4
0.022
7.1
0.001
7.4
0.000
8.5
0.000
8.1
0.000
9.7
0.000
9.8
0.000
Log. Phyto. Biovolume -7.4
0.009
-10.6
0.000
-11.6
0.000
-12.0
0.000
-11.0
0.000
-10.7
0.000
Log Fish Biomass 3.3
0.006
3.8
0.001
3.8
0.001
3.9
0.000
3.9
0.001
DIN -44
0.004
-44
0.004
-9
0.650
Orthophosphorus -1021
0.051
-1731
0.003
-1814
0.001
DIN:DIP -0.061
0.009
-0.068
0.000
S 13.1 12.7 12.3 11.8 11.6 11.2 11.1
R2 5.64 12.65 19.72 26.82 29.96 35.33 35.18
Mallows Cp 34.4 27.2 20.0 12.7 10.6 5.6 3.8

27
Table 9. Multiple linear regression for percent cyanobacteria and environmental parameters
selected from stepwise regression. Displays coefficient, standard error of coefficient, p-value and
variance inflation factor for each predictor. Square root of MSE (S) and coefficient of
determination (R2) shown for regression model. N=114
Predictor Variables Coefficient SE Coefficient p-value VIF
pH 8.589 1.981 0.000 1.396
Log Phyto. Biovolume -7.713 2.616 0.004 1.542
Log Fish Biomass 2.978 1.099 0.008 1.320
DIN -9.05 16.13 0.576 1.736
Orthophosphorus -1807.8 573.5 0.002 1.372
DIN:DIP -0.058 0.022 0.011 2.415
S=12.0668 R2=25.0%

28
Table 10 Summary of statistical findings from stepwise and multiple linear regression of whole
dataset, high biovolumes, low biovolumes and cyanobacteria percent. Shows selected predictor
variables included in best models and directed relationship to cyanobacteria.
Whole Dataset
Analysis
High Biovolume
Analysis
Low Biovolume
Analysis
Cyanobacteria
Percent Analysis
Parameter N=89 N=15 N=74 N=93
Average Wind
Velocity * *
Total Precipitation *
Water Temperature +X
Bottom Water DO * -X
Conductivity *
Orthophosphorus
-X -X -X
Total Phosphorus
DIN
-X *
DIN:DIP ratio
-X -X
pH
+X +X
Zooplankton
Density * *
Fish Biomass
+X +X +X +X
Phytoplankton
Biovolume +X +X +X
(X) Included in best stepwise model
(*) Selected as predictor by stepwise regression but not included in best model
(+/-) Indicates positive or negative relationship to cyanobacteria

29
CHAPTER 4
DISCUSSION
Water Column Stability
Wind velocity and bottom DO were used to indicate water column stability. Physical stability is
considered a prerequisite for cyanobacteria bloom development and dominance (Reynolds and
Walsby 1975, Paerl 1988). During periods of low wind velocity in summer months, water
temperature differences from top to bottom produce density layering. Oxygen becomes depleted
in the bottom layer from biological demand. Hypoxic and anoxic conditions at the sediment-
water interface influences nutrient recycling to overlaying water. Released nutrients become
available and stimulate algae growth.
Stratification is weak and intermittent in Liberty, not always eliciting anoxic conditions. Low
wind velocities in conjunction with warm weather producing stratification likely have a lag
effect to cyanobacteria, underlining why it was not included in best models. Bottom DO selected
as a predictor to low biovolumes with a negative relationship indicates cyanobacteria growth
with declining DO concentrations. It did not predict whole dataset cyanobacteria biovolumes,
bloom conditions or algal dominance. Significance to low biovolumes may be due to anoxic
conditions being short lived, only briefly stimulating cyanobacteria growth with released
phosphorus. Phosphorus released resultant of stratification and anoxia likely associates to bloom
conditions with a lag effect not measured in this study.
Temperature and Precipitation
Phytoplankton species composition shifts to cyanobacteria towards progression of warm summer
months. Cyanobacteria proliferate and dominate best in warm water temperatures (Paerl 1988,
30
Paerl 1995) due to water temperature optima above 20 C (Robarts and Zohary 1987). Increased
water temperatures associated to bloom conditions in Liberty Lake. Cyanobacteria biovolumes
increased over months as seasons progressed with warmer temperatures (Figure 8). Blooms were
most frequent in August and September, coinciding with the warmest lake water temperatures.
Temperature alone does not predict cyanobacteria blooms, likely associating more with
stratification increasing nutrient recycling and algal growth.
Precipitation events that generate overland surface flow from watersheds affect aquatic
ecosystems by depositing nutrients into receiving water. Most of the Liberty Lake basin drains
into Liberty Creek, which has great water quality low in nutrient concentrations. It unlikely
contributes a significant amount of nutrients to the lake by watershed runoff. This is likely the
reason precipitation was not associated with cyanobacteria biovolumes or dominance in Liberty
Lake.
pH and Specific Conductivity
Measure of pH indicates how acidic or basic water is, with the range 6 to 9 most suitable for
aquatic organisms (Horne and Goldman 1994). Increased photosynthetic activity and carbon
dioxide uptake shifts the carbonate equilibrium and resultant pH of water (Wetzel 2001).
Turbulent wind mixing in Liberty supplies an ample amount of inorganic carbon, maintaining a
suitable pH range. Although pH was selected as a predictor to cyanobacteria biovolumes and
dominance, it likely results more from increased photosynthetic activities throughout the season
increasing pH.
Specific conductivity indirectly measures dissolved materials in water (Wetzel 2001). It is a
standard water quality measurement giving indication of waters ability to conduct electrical
31
currents. Conductivity was not selected as a predictor to cyanobacteria biovolumes or
dominance, and may not influence cyanobacteria.
Phosphorus and Nitrogen
Many research studies focus on nutrient influences to cyanobacteria and phytoplankton growth.
Nitrogen and phosphorus availability influences phytoplankton growth and community structure
(Paerl 1995). Multiple cases have regarded nitrogen and phosphorus as responsible for
cyanobacteria bloom formation. Phosphorus and nitrogen are macronutrients needed for
biological processes in the ratio 16N:1P, known as the Redfield ratio. Phosphorus is considered
the limiting element to algal growth in freshwater lakes due to high biological demand and
limited supply (Schindler 1977, Correll 1998, Wetzel 2001). Nitrogen has received attention as
an alternative to phosphorus as a limiting nutrient. Schindler (1977) enforced the important role
of phosphorus by analyzing the control of nitrogen to phytoplankton growth in several whole
lake studies. He concluded that nitrogen control will favor cyanobacteria while phosphorus
control will shift species composition from cyanobacteria to more desirable phytoplankton
species. General consensus among the scientific community drove lake restoration projects to
target phosphorus more than nitrogen. Long term studies emphasize the need to control
phosphorus more than nitrogen for lake recovery (Jeppesen 2005, Welch 2009)
Phosphorus is naturally found in the environment and supplied to aquatic systems through
external and internal sources. It readily binds to sediments and precipitates out of the water
column building up a supply in benthic sediments. Phosphorus is typically held in particulate
form contained in sediments and biologically unavailable (Horne and Goldman 1994). It
becomes available through biological decomposition and chemical recycling in the form of
orthophosphorus. Orthophosphorus is the dissolved form directly assimilated by algae (Horne

32
and Goldman 1994). Chemical cycling in polluted lakes supplies a significant amount of
nutrients from bottom sediments. In shallow polymictic lakes, internal cycling significantly
contributes to the phosphorus supply available to phytoplankton.
Orthophosphorus was selected as a significant predictor to cyanobacteria biovolumes, non-bloom
conditions and cyanobacteria dominance. Total phosphorus was a measure of all phosphorus
forms, and did not associate to cyanobacteria biovolumes or dominance. It has been suggested by
Schindler (1977) that lakes receiving large phosphorus inputs will not show correlations between
total phosphorus and phytoplankton. Restoration efforts reducing phosphorus in Liberty Lake
followed with decreased cyanobacteria biovolumes and algal dominance, reflecting
cyanobacteria dependence on phosphorus pool in ecosystem.
Certain cyanobacteria species are capable of fixing atmospheric nitrogen. The enzyme
nitrogenase facilitating N2 fixation is inhibited by molecular oxygen (Paerl 1995). Some
cyanobacteria hold enzymes in oxygen devoid cells called heterocysts to enable fixation in oxic
environments (Paerl 1995). Buoyancy control is especially advantageous to species with
heterocysts by allowing movement towards air-water interface to fix nitrogen.
Phytoplankton requires nitrogen in larger quantities than phosphorus leading to nitrogen
depletion in high phosphorus environments. Phytoplankton growth is limited in nitrogen depleted
conditions if unable to fix nitrogen. Cyanobacteria outcompete phytoplankton because their
growth is not limited by nitrogen. Nitrogen fixation restores N:P ratios to the Redfield level
required by phytoplankton (Hutchinson 1970). It provides cyanobacteria with nitrogen
unavailable to other phytoplankton, allowing them to dominate the algal community when
phosphorus is abundant (Havens et al. 2003, Paerl 1988). Cyanobacteria bloom conditions in

33
Liberty Lake associated with decreasing concentrations of dissolved inorganic nitrogen (DIN).
Most bloom years were early in dataset coinciding with excess phosphorus conditions. This
finding implies cyanobacteria utilization of competitive advantages to capture nitrogen.
Increased competing abilities enable cyanobacteria growth in low N: P environments compared
to other algae (Smith 1983). Low N:P ratios result from excess phosphorus, leading to nitrogen
limited environments favoring cyanobacteria (Schindler et al. 2008). Variable dissolved
inorganic N: P ratios between top and bottom water allow migrating cyanobacteria to meet
nutrient requirements without utilizing nitrogen fixation (Paerl 1988). The specific ratio
enhancing cyanobacteria is debatable, but generally agreed that lower ratios are more favorable.
Cyanobacteria biovolumes and algal dominance associated with decreased DIN: DIP ratios. This
finding supports cyanobacteria ability to successfully outcompete algae in environments with
abundant phosphorus.
Biological Interactions
Phytoplankton change species composition based on tolerable conditions. Specific species best
adapted for environmental conditions will flourish, allowing phytoplankton to remain present
throughout the seasonal cycle (Horne and Goldman 1994). Shifting species over the growing
season allows phytoplankton to compete with cyanobacteria for similar resources. Competition is
strongest in late summer when environmental conditions become favorable for cyanobacteria
(Paerl 1988). Phytoplankton association with biovolumes and dominance reflects similar
resource requirements, and not a predictor to cyanobacteria.
Cyanobacteria filaments and colonies are hard for zooplankton to filter and digest (DeMott et al.
1991). Zooplankton select against cyanobacteria due to unpalatable taste (Paerl 1988).
34
Undesirable food reduces survivorship (de Bernardi and Giussani 1990), leading to selective
grazing on other phytoplankton species (Paerl 1988). Zooplankton density did not predict
cyanobacteria biovolumes or algal dominance, probably due to grazing preference for
phytoplankton species.
Fish populations cascade effects through food webs, altering phytoplankton community
structure, biomass and productivity (Carpenter et al. 1987). Planktivorous fish influence
zooplankton size and species composition (Brooks and Dodson 1965), ultimately governing
predation pressure on phytoplankton species (Carpenter 1989). Fish biomass increased over
seasons, coinciding with increased cyanobacteria biovolumes and dominance. As mortality was
not accounted for, fish biomass continually increased as the lake was being stocked. Even though
fish biomass associated with cyanobacteria biovolumes and algal dominance, it is likely not a
predictor and the relationship is more coincidence.

35
CHAPTER 5
CONCLUSIONS
Restoration science is a relatively new field, and was developing as Liberty Lake projects were
underway. Phosphorus was considered the limiting element to phytoplankton growth in
freshwater lake systems (Schindler 1977). Multiple case studies supporting the important role of
phosphorus guided early restoration projects to reduce phosphorus. Multi-annual time scales
relate productivity with phosphorus limitation, while smaller scales relate with multiple resource
limitations (Sterner 2008). Liberty Lake data is important because long term datasets from early
restoration projects are rare. It incorporates many years through restoration changes, showing
long term trends in cyanobacteria that would not be evident at smaller annual scales.
Experimentation and observational studies along with deductive reasoning from biogeochemical
principles have qualified phosphorus as a paradigm (Sterner 2008). Through advances in
limnology, it is debated whether phosphorus continues to drive productivity in freshwater lakes
(Lewis and Wurtsbaugh 2008, Sterner 2008). Nitrogen has received increased attention as an
alternative to phosphorus as a limiting nutrient. Controlling nitrogen may adversely impact water
quality by causing low N: P ratio to favor cyanobacteria (Schindler 1977, Nurnberg 2007).
Reduced nitrogen studies in experimental lakes concludes eutrophication cannot be controlled by
nitrogen reduction, and phosphorus removal is required (Schindler et al 2008). Schindler and
Hecky (2009) believe there is insufficient data to prove nitrogen removal reduces eutrophication.
Combined information from multiple lake studies has supported phosphorus as the single most
important limiting element in lakes (Jeppesen et al. 2005, Sterner 2008). Phosphorus is the
ultimate controlling variable because deficiencies do not become balanced over time from

36
atmospheric sources like nitrogen (Schindler 1978). Support for the phosphorus paradigm has
increased, and is now presented with greater certainty in limnology textbooks and review papers
(Sterner 2008).
The phosphorus paradigm addresses a trend that should be observed over multi-annual time
scales. Thesis analysis confirms this trend with phosphorus reductions in Liberty Lake
accompanying declines in cyanobacteria biovolumes and algal dominance. Cyanobacteria
associated most with phosphorus, reinforcing its important role to lake productivity and
cyanobacteria dynamics.
Excess phosphorus inputs relative to nitrogen in Liberty enabled nitrogen fixing cyanobacteria to
proliferate and dominate the phytoplankton population. Algae and plant senescence further
stimulated proliferation by releasing phosphorus and producing anaerobic conditions (Funk et al.
1982). Phosphorus precipitated out of water as particulate matter and dead algae, building a layer
of organic matter on the lake bottom. This layer released phosphorus during anoxic conditions
and fueled internal nutrient cycling processes. Due to multiple mixing regimes and weak
stratification, phosphorus cycling patterns are not apparent in Liberty (Funk et al. 1982).
Phosphorus concentrations rapidly change as it is readily used for biological processes and
recycled within the environment. Monitoring concentrations of total phosphorus and
orthophosphorus at a given time in water does not quantify true amounts of phosphorus in the
system. Most phosphorus in Liberty was bound to benthic sediments and within macrophytes and
algae, with lower concentrations in water. Reducing the overall pool of phosphorus in the
ecosystem influences extent of phosphorus released from cycling.
Phytoplankton growth is known to be proportional to phosphorus concentrations, and agreed that

37
standing algae crops will reduce as phosphorus is managed. Nutrient management targeting
phosphorus loading was adopted as the primary goal for Liberty Lake. Restoration efforts
managing external loading and removing sediment and macrophytes reduced the overall pool of
phosphorus available for recycling. Reducing the buildup of phosphorus in benthic sediments
returns the system back to a phosphorus limited environment.
Implementation of phosphorus reduction strategies changed water quality dynamics of Liberty
Lake over the years. Intense cyanobacteria blooms that were common in early years became rare
occurrences. This is strong evidence that early restoration and management efforts based on the
phosphorus paradigm have successfully decreased cyanobacteria blooms and algal dominance.
Findings support traditional limnology perspectives concerning phosphorus as the limiting
nutrient to productivity.
Environmental components are interrelated within all ecosystems, requiring a holistic approach
to identify driving forces to biological communities. Defining biological responses is
complicated, and involves relationships to multiple parameters. Analysis of multiple
environmental variables determined cyanobacteria to relate most with abundant phosphorus and
nitrogen limited conditions. This emphasizes control of phosphorus rather than nitrogen to
reduce eutrophication. Phosphorus is an important contributor to cyanobacteria blooms and algal
dominance. It should be continually monitored and controlled in aquatic ecosystems to protect
local economies, biological integrity and human health.

38
REFERENCES
Anderson, D.M., Glibert, P.M. and J.M. Burkholder. 2002. Harmful algal blooms and
eutrophication: nutrient sources, composition and consequences. Estuaries 25:704-726.
Brooks, J.L. and S. I. Dodson. 1965. Predation, body size and composition of plankton. Science
150: 28-35.
Carpenter, S.R. 1989. Temporal variance in lake communities: blue green algae and the trophic
cascade. Landscape Ecology 3:175-184.
Carpenter, S.R., Kitchell, J.F., Hodgson, J.R., Cochran, P.A., Elser, J.J., Elser, M.M., Lodge,
D.M., Kretchmer, D., He, X. and C.N. Ende. 1987. Regulation of lake primary
productivity by food web structure. Ecology 68:1863-1876.
Chorus I., Bartram J. (eds) (1999). Toxic cyanobacteria in water: A guide to their public health
consequences, monitoring and management. E&FN Spon, London, United Kingdom.
Copp, H.D. 1976. Investigation to determine extent and nature of non-point source enrichment
and hydrology of several recreational lakes of eastern Washington. Part I: Hydrologic
characteristics of the lake basins. State of Washington Water Research Center Report
No.26.
Correll, D.L. 1998. The role of phosphorus in the eutrophication of receiving waters: a review.
Journal of Environmental Quality 27:261-266.
De Bernardi, R. and G. Giussani. 1990. Are blue-green algae a suitable food for zooplankton?
Hydrobiologia 200:29-41.
DeMott, W.R., Zhang, Q.X. and W.W. Carmichael. 1991. Effects of toxic cyanobacteria and
purified toxins on the survival and feeding of a copepod and three species of Daphnia.
Limnology and Oceanography 36:1346-1357.
Dodds, W.K., Bouska, W.W., Eitzmann, J.L., Pilger, T.J., Pitts, K.L., Riley, A.J., Schloesser,
J.T. and D.J. Thornbrugh. 2009. Eutrophication of U.S. freshwaters: analysis of potential
economic damages. Environmental Science and Technology 43:12-19.
Erdner, D.L., Dyble, J., Parsons, M.L., Stevens, R.C., Hubbard, K.A., Wrabel, M.L., Moore,
S.K., Lefebvre, K.A., Anderson, D.M., Bienfang, P., Bidigare, R.R., Parker, M.S.,
Moeller, P., Brand, L.E. and V.L. Trainer. 2008. Proceedings from the centers for oceans
and human health: a united approach to the challenge of harmful algal blooms.
Environmental Health 7:S2.
Funk, W.H., Gibbons, H.L., Morency, D.A., Bennett, P.J., Marcley, R. and G.C. Bailey. 1976.
Investigation to determine extent and nature of nonpoint source enrichment and
hydrology of several recreational lakes of eastern Washington. Part II Water quality
study. State of Washington Water Research Center Report No.26.

39
Funk, W.H., Gibbons, H.L., Bailey, G.C., Moore, B.C., Woodwick, F., Mawson, S., Gibbons,
M., Nelson, R., Bennett, P., Breithaupt, S., Bulson, P., LeCain, G., Lamb, D. and J.Hein.
1982. Preliminary assessment of multiphase restoration efforts at Liberty Lake,
Washington. State of Washington Water Research Center Report No.43.
Havens, K.E., James, R.T., East, T.L., and V.H. Smith. 2003. N:P ratios, light limitation, and
cyanobacterial dominance in a subtropical lake impacted by non-point source nutrient
pollution. Environment Pollution 122:379-390.
Horne, A.J. and C.R. Goldman. 1994. Limnology. Second edition, McGraw Hill, Inc.
Hutchinson, G.E. 1970. The Biosphere. Scientific American 223:44-53.
Jeppesen, E., Sondergaard, M., Jense, J.P., Havens, K.E., Anneville, O., Carvalho, L., Coveey,
M.F., Deneke, R., Dokulil, M.T., Foy, B., Gerdeauz, D., Hampton, S.E., Hilt, S., Kangur,
K., Kohler, J., Lammens, E.H., Lauridsen, T.L., Manca, M., Miracle, M.R., Moss, B.,
Noges, P., Persson, G., Phillips, G., Portielje, R., Romo,S., Schelske, C.L., Straile, D.,
Tatrai, I., Willen, E., Winder, M. 2005. Lake responses to reduced nutrient loading – an
analysis of contemporary long-term data from 35 case studies. Freshwater Biology 50:
1747-1771.
King, D. 1970. The role of carbon in eutrophication. Journal Water Pollution Control Federation
40: 2035-250.
Lewis, W.M. Jr. and W.A. Wurtsbaugh. 2008. Control of lacustrine phytoplankton by nutrients:
Erosion of the phosphorus paradigm. Int. Rev. Hydrobiol. 93: 446-465.
Liberty Lake Sewer and Water District. 2010. http://www.libertylake.org. Accessed 19
September 2010.
Minitab. 2010. Statistical software. Version 16. Minitab Inc. USA
Moore, B.C. 1981. Release of sediment phosphorus by Elodea canadensis. M.S. Thesis.
Washington State University, Pullman, WA 99164-6410.
Moore, B.C., Gibbons, H.L., Funk, W.H., McKarns, T., Nyznyk, J. and M.V. Gibbons. 1984.
Enhancement of internal cycling of phosphorus by aquatic macrophytes, with
implications for lake management. Proceedings from the third annual North American
Lake Management Society conference. Lake and Reservoir Management. EPA 440/5/84-
001.
Moore, B.C., Mead, S.S., Preece, E.P., Martin, A.A., Lanouette, B.P., and B.K. Cross. 2010.
Liberty Lake Water Quality Monitoring Report. Report to the Liberty Lake Sewer and
Water District.
Moore, S.K., Trainer, V.L., Mantua, N.J., Parker, M.S., Laws, E.A., Backer, L.C. and L.E.
Fleming. 2008. Impacts of climate variability and future climate change on harmful algal
blooms and human health. Environmental Health 7:S4.

40
Mur, L.R., Skulberg, O.M. and H. Utkilen. 1999. Cyanobacteria in the environment. Chapter 2 in
I. Chorus and J. Bartram, editors. Toxic cyanobacteria in water: a guide to their public
health consequences, monitoring and management. E&FN Spon, London, United
Kingdom.
National Oceanic and Atmospheric Association. 2010. Archived local climatological database
for Spokane, WA airport. http:// www.noaa.gov. Accessed 10 October 2010.
Nurnberg, G.K. 2007. Low-nitrate days (LND), a potential indicator of cyanobacteria blooms in
a eutrophic hardwater reservoir. Water Quality Research Journal Canada 42: 269-283.
Oliver, R.L. and G.G. Ganf. 2000. Freshwater Blooms. Chapter 6 in B. Whitton and M. Potts,
editors. The ecology of cyanobacteria: their diversity in time and space. Kluwer,
Dordrecht, The Netherlands.
Paerl H.W. 1988. Nuisance phytoplankton blooms in coastal, estuarine, and inland waters.
Limnology and Oceanography 33:823-847.
Paerl, H.W. and C.S. Tucker.1995. Ecology of blue-green algae in aquaculture ponds. Journal of
the World Aquaculture Society 26:109-131.
Phillips, L., Divens, M. and C. Donley. 1999. 1998 Warmwater fisheries survey of Liberty Lake,
Warmwater enhancement program. Washington Department of Fish and Wildlife,
Olympia, WA.
Reynolds, C.S. and A.E. Walsby. 1975. Water blooms. Biological Reviews 50:437-481.
Robarts, R.D., and T. Zohary. 1987. Temperature effects on photosynthetic capacity, respiration,
and growth rates of bloom-forming cyanobacteria. New Zealand Journal Marine
Freshwater Research 21:391-399.
Schindler, D.W. 1977. Evolution of phosphorus limitation in lakes. Science 195: 260-262.
Schindler, D.W. 1978. Factors regulating phytoplankton production and standing crop in the
world freshwaters. Limnology and Oceanography 23:478-486.
Schindler, D.W., Hecky, R.E., Findlay, D.L., Stainton, M.P., Parker, B.R., Paterson, M.J., Beaty,
K.G., Lyng, M. and S.E. Kasian. 2008. Eutrophication of lakes cannot be controlled by
reducing nitrogen input: Results of a 37-year whole-ecosystem experiment. Proceedings
of the National Academy of Sciences 105:11254-11258.
Schindler, D.W. and Hecky, R.E. 2009. Eutrophication: more nitrogen data needed. Science
324:721-722.
Smith, V.H. 1983. Low nitrogen to phosphorus ratio favor dominance by blue-green algae in
lake phytoplankton. Science 221: 669-671.
Spokane County, Washington. 2010. http://www.spokanecounty.org. Accessed 5 July 2010
Sterner, R.W. 2008. On the phosphorus limitation paradigm for lakes. International Review of
Hydrobiology 93:433-445.

41
Welch, E.B. 2009. Should nitrogen be reduced to manage eutrophication if it is growth limiting?
Evidence from Moses Lake. Lake and Reservoir Management 25:401-409.
Wetzel, R.G. 2001. Limnology: lake and river ecosystems, 3rd
edition. Academic Press, San
Diego, California.

APPENDIX

Appendix A. Physical Parameter Data

44
Sampling
Date Year
Average
Wind
Velocity
(mph)
Total
Precipitation
(inches)
Water
Temperature
(C)
Bottom
DO (mg/L)
Conductuctivity
(uS/cm)
22-Apr 2010 7.5 0.06 11.1 50.3
5-May 2010 15.2 0.26 11.1 9.0 49.2
20-May 2010 7.5 0.27 15.5 7.4 50.0
3-Jun 2010 10.3 2.05 15.2 8.4 47.2
23-Jun 2010 7.4 0.91 17.9 3.9 50.4
14-Jul 2010 9.3 0.00 21.4 8.6 52.2
28-Jul 2010 6.1 0.00 24.4 8.1 53.4
18-Aug 2010 7.2 0.02 23.5 6.4 56.2
2-Sep 2010 8.9 0.16 19.5 7.3 55.4
23-Sep 2010 8.3 0.60 16.3 8.1 54.3
6-Oct 2010 5.6 0.12 16.4 8.9 54.3
6-May 2009 11.8 0.35 11.3 7.0 47.4
14-May 2009 11.4 0.21 12.4 9.5 47.1
5-Jun 2009 9.4 0.00 19.5 3.1 48.5
27-Jun 2009 10.0 0.11 20.1 0.4 51.2
10-Jul 2009 8.1 0.16 21.9 5.6 51.8
21-Jul 2009 6.0 0.00 23.6 0.0 54.6
5-Aug 2009 8.2 0.02 24.6 0.4 55.1
21-Aug 2009 6.1 0.18 22.7 3.6 57.0
11-Sep 2009 8.0 0.10 19.5 7.4 55.4
25-Sep 2009 6.8 0.01
24-Oct 2009 5.8 0.70 9.8 8.2 52.7
7-May 2008 6.7 0.52 12.3 6.6 47.8
22-May 2008 9.0 0.58 15.0 2.9 47.9
5-Jun 2008 8.8 0.36
19-Jun 2008 9.3 0.00 18.2 5.3 46.3
2-Jul 2008 7.3 0.09 22.9 3.0 46.7
17-Jul 2008 8.5 0.19 23.2 0.9 49.0
4-Aug 2008 9.9 0.00 22.0 0.4 50.3
11-Aug 2008 7.1 0.00 21.4 1.0 50.5
9-Sep 2008 8.0 0.04 19.2 8.3 54.6
25-Sep 2008 8.7 0.48 17.0 8.3 55.0
22-Oct 2008 6.8 0.01 11.2 4.0 51.9
6-Apr 2007 9.1 0.02 8.2 9.2 44.1
20-Apr 2007 9.7 0.18 10.3 10.1 44.1
3-May 2007 8.6 0.24 12.8 5.8 44.4

45
Sampling
Date
Year Average
Wind
Velocity
(mph)
Total
Precipitation
(inches)
Water
Temperature
(C)
Bottom
DO (mg/L)
Conductivity
(uS/cm)
17-May 2007 7.2 0.00 17.3 7.5 44.1
31-May 2007 8.7 0.13 17.8 6.9 45.2
12-Jun 2007 11.6 0.44 17.4 7.8 45.6
28-Jun 2007 9.8 0.00 20.6 5.8 46.8
20-Jul 2007 7.2 0.39 24.8 1.7 48.8
31-Jul 2007 8.1 0.00 25.0 4.2 49.6
18-Aug 2007 6.7 0.00 22.7 4.2 50.8
7-Sep 2007 7.6 0.17 21.6 7.5 50.7
21-Sep 2007 8.3 0.01 17.6 8.0 51.1
9-Oct 2007 10.0 0.60 13.7 8.5 50.7
12-May 2006 20.3 0.01 12.9 6.4 43.3
25-May 2006 9.1 0.72 18.5 4.8 44.0
8-Jun 2006 7.4 1.13 19.1 1.3 44.6
22-Jun 2006 10.2 0.00 19.5 0.4 45.2
6-Jul 2006 6.7 0.08 24.4 0.5 46.2
21-Jul 2006 8.7 0.00 23.5 1.1 49.3
3-Aug 2006 11.1 0.00 22.4 1.1 48.4
15-Aug 2006 8.3 0.01 22.2 0.8 49.3
31-Aug 2006 8.1 0.24 20.6 7.1 49.9
11-Sep 2006 6.1 0.00 20.4 7.2 51.2
28-Sep 2006 5.0 0.05 17.2 6.9 53.7
12-Oct 2006 5.9 0.00 13.9 8.7 52.6
15-Apr 2005 9.7 0.10 8.7 9.6 44.2
29-Apr 2005 9.2 0.03 12.7 8.7 44.7
12-May 2005 6.6 1.29 15.5 6.7 45.1
26-May 2005 8.3 1.09 16.6 6.3 45.9
10-Jun 2005 8.8 0.31
28-Jun 2005 8.0 0.31 20.2 2.8 47.6
14-Jul 2005 8.9 0.93 22.1 1.3 49.1
28-Jul 2005 7.2 0.01 23.9 2.5 50.5
11-Aug 2005 7.9 0.00 24.3 0.3 57.9
26-Aug 2005 6.6 0.00 22.1 5.6 52.4
23-Sep 2005 8.2 0.00 16.9 8.3 53.2
7-Oct 2005 7.0 0.95 13.7 8.4 52.2
20-Oct 2005 10.8 0.14 13.0 8.2 52.0
8-Apr 2004 7.5 0.02 10.6 44.8
23-Apr 2004 8.6 0.46 12.3 3.6 43.1
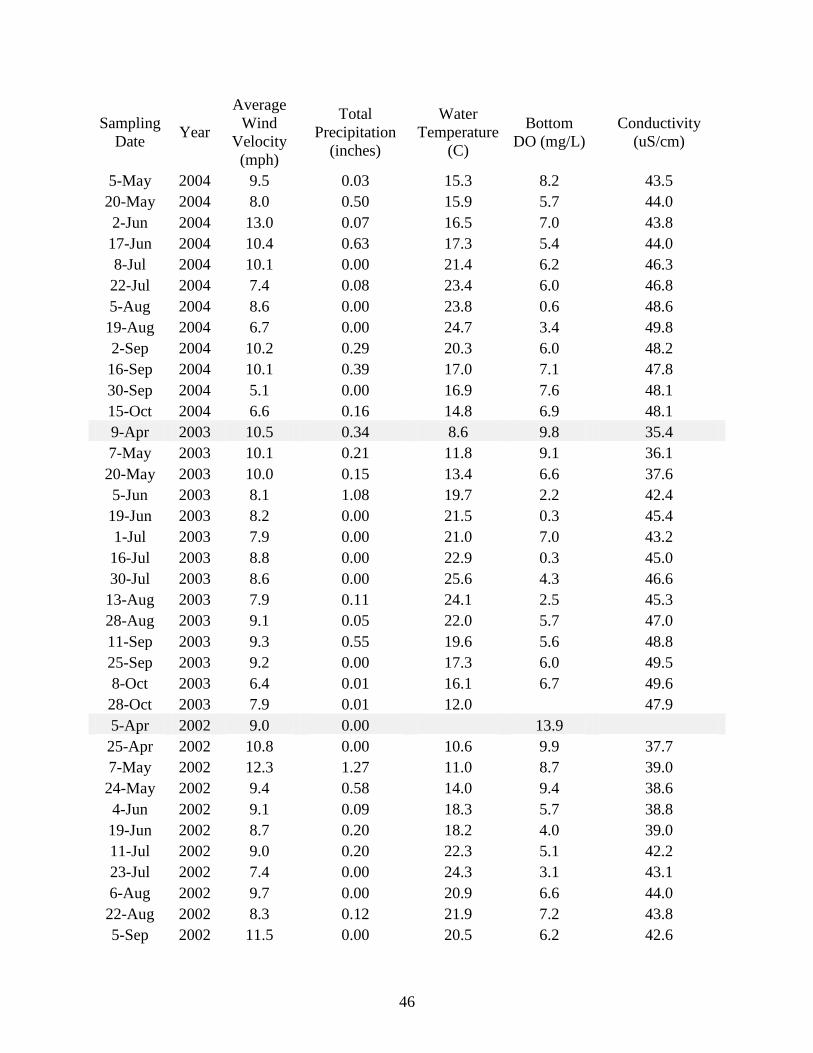
46
Sampling
Date Year
Average
Wind
Velocity
(mph)
Total
Precipitation
(inches)
Water
Temperature
(C)
Bottom
DO (mg/L)
Conductivity
(uS/cm)
5-May 2004 9.5 0.03 15.3 8.2 43.5
20-May 2004 8.0 0.50 15.9 5.7 44.0
2-Jun 2004 13.0 0.07 16.5 7.0 43.8
17-Jun 2004 10.4 0.63 17.3 5.4 44.0
8-Jul 2004 10.1 0.00 21.4 6.2 46.3
22-Jul 2004 7.4 0.08 23.4 6.0 46.8
5-Aug 2004 8.6 0.00 23.8 0.6 48.6
19-Aug 2004 6.7 0.00 24.7 3.4 49.8
2-Sep 2004 10.2 0.29 20.3 6.0 48.2
16-Sep 2004 10.1 0.39 17.0 7.1 47.8
30-Sep 2004 5.1 0.00 16.9 7.6 48.1
15-Oct 2004 6.6 0.16 14.8 6.9 48.1
9-Apr 2003 10.5 0.34 8.6 9.8 35.4
7-May 2003 10.1 0.21 11.8 9.1 36.1
20-May 2003 10.0 0.15 13.4 6.6 37.6
5-Jun 2003 8.1 1.08 19.7 2.2 42.4
19-Jun 2003 8.2 0.00 21.5 0.3 45.4
1-Jul 2003 7.9 0.00 21.0 7.0 43.2
16-Jul 2003 8.8 0.00 22.9 0.3 45.0
30-Jul 2003 8.6 0.00 25.6 4.3 46.6
13-Aug 2003 7.9 0.11 24.1 2.5 45.3
28-Aug 2003 9.1 0.05 22.0 5.7 47.0
11-Sep 2003 9.3 0.55 19.6 5.6 48.8
25-Sep 2003 9.2 0.00 17.3 6.0 49.5
8-Oct 2003 6.4 0.01 16.1 6.7 49.6
28-Oct 2003 7.9 0.01 12.0
47.9
5-Apr 2002 9.0 0.00 13.9
25-Apr 2002 10.8 0.00 10.6 9.9 37.7
7-May 2002 12.3 1.27 11.0 8.7 39.0
24-May 2002 9.4 0.58 14.0 9.4 38.6
4-Jun 2002 9.1 0.09 18.3 5.7 38.8
19-Jun 2002 8.7 0.20 18.2 4.0 39.0
11-Jul 2002 9.0 0.20 22.3 5.1 42.2
23-Jul 2002 7.4 0.00 24.3 3.1 43.1
6-Aug 2002 9.7 0.00 20.9 6.6 44.0
22-Aug 2002 8.3 0.12 21.9 7.2 43.8
5-Sep 2002 11.5 0.00 20.5 6.2 42.6

47
Sampling
Date Year
Average
Wind
Velocity
(mph)
Total
Precipitation
(inches)
Water
Temperature
(C)
Bottom
DO (mg/L)
Conductivity
(uS/cm)
19-Sep 2002 8.5 0.42 18.5 7.4 41.4
1-Oct 2002 7.8 0.09 15.5 6.9 41.0
18-Oct 2002 4.2 0.00 12.5 7.7 41.0
20-Apr 2001 9.1 0.12 8.7 10.2 38.6
4-May 2001 13.2 0.90 12.0 8.9 38.4
17-May 2001 10.3 0.78 14.1 8.1 39.0
30-May 2001 9.2 0.02 17.9 8.3 40.0
13-Jun 2001 9.8 0.10 16.7
40.0
27-Jun 2001 8.9 0.02 18.9 4.1 42.0
18-Jul 2001 9.7 0.17 21.0 4.1 42.7
1-Aug 2001 9.6 0.09 21.1 7.6 44.0
15-Aug 2001 5.8 0.02 24.1 2.2 45.2
30-Aug 2001 6.4 0.14 22.3 2.4 46.3
13-Sep 2001 7.6 0.00 19.4 6.8 46.2
28-Sep 2001 8.3 0.17 17.7 7.8 47.1
12-Oct 2001 9.6 0.19 12.8 7.8 46.0
18-May 2000 8.1 0.10 15.1 6.9 39.9
8-Jun 2000 8.2 0.00 18.1 5.8 40.2
19-Jun 2000 11.7 0.44 18.3 0.7 40.6
6-Jul 2000 8.5 0.20 19.6 6.6 40.0
26-Jul 2000 8.4 0.00 23.7 3.7 41.4
3-Aug 2000 7.8 0.00 24.9 7.0 41.0
17-Aug 2000 8.6 0.00 23.1 6.5 41.8
31-Aug 2000 8.8 0.00 21.1 6.2 41.0
28-Sep 2000 6.4 0.22 15.1 6.8 39.7
9-May 1997 8.8 0.22 12.2 15.0 16.3
30-May 1997 5.9 1.52 17.3 2.8 15.5
11-Jun 1997 7.1 0.19 18.1 2.6 16.2
24-Jun 1997 12.2 0.04 17.0 13.3 16.6
11-Jul 1997 11.3 0.55 18.3 14.0 17.6
22-Jul 1997 5.7 0.11
16.8
6-Aug 1997 7.7 0.01 23.9 14.6 18.8
21-Aug 1997 9.6 0.02 21.9 5.8 17.5
10-Sep 1997 6.0 0.12 19.9 6.7 17.2
17-Oct 1997 7.5 0.03 11.0 12.7 16.3
5-Apr 1996 9.4 0.62 6.9 15.0 18.0
25-Apr 1996 12.7 1.41 7.7 12.6 18.3

48
Sampling
Date Year
Average
Wind
Velocity
(mph)
Total
Precipitation
(inches)
Water
Temperature
(C)
Bottom
DO (mg/L)
Conductivity
(uS/cm)
23-May 1996 11.3 0.89 10.4 5.0 17.8
26-Jun 1996 6.9 0.70 14.6 1.4
22-Aug 1996 8.9 0.00 15.0 4.2 19.4
4-Oct 1996 6.8 0.00 12.1 3.8
14-Apr 1995 10.5 0.69 8.0 11.2
6-May 1995 9.6 0.94 14.5 10.5
29-Jul 1995 12.6 0.02
23-Aug 1995 9.5 0.17 20.0 7.2
29-Sep 1995 6.7 0.71 16.3 12.8 19.4
10-Apr 1994 10.4 0.90 8.7 10.9 47.1
12-Jul 1994 9.9 0.00 22.4 7.4 47.9
2-Aug 1994 8.5 0.00 26.7 10.2 55.0
2-Sep 1994 9.0 0.03 20.3 3.9 50.1
7-Oct 1994 10.0 0.00 15.2 8.8 45.5
12-Aug 1993 8.1 0.00 21.7 6.7 17.1
19-Sep 1993 8.6 0.15 16.0 10.9 18.3
15-Oct 1993 7.3 0.01 13.1 11.2 18.3
24-Apr 1992 11.9 0.18
27-May 1992 8.3 0.28 14.9 11.0 16.7
24-Jun 1992 7.3 0.14 19.2 15.0 17.2
16-Oct 1992 8.5 0.03 3.7 12.8 19.1
13-Apr 1991 11.9 0.61 8.8 9.6 46.5
20-May 1991 9.9 0.88 14.1 12.8 45.4
30-May 1991 10.4 0.20 14.5 11.2 47.9
25-Jun 1991 7.5 0.16 17.2 7.6 46.5
10-Jul 1991 8.9 0.00 21.5 10.2 47.1
15-Oct 1991 5.9 0.00 15.4 8.8 54.0
23-Aug 1990 7.9 1.01 21.7 8.0 51.5
5-Sep 1990 8.6 0.00 21.9 6.6 43.3
22-Sep 1990 7.0 0.00 19.6 8.4 44.4
19-Oct 1990 11.6 1.63 11.0 11.2 42.6
13-Jun 1988 9.3 0.34 18.1 8.2 32.3
11-Jul 1988 9.5 0.11 20.6 0.4 36.4
8-Aug 1988 12.2 0.00 21.1 1.0 36.4
12-Sep 1988 10.8 0.32 19.4 7.2 39.7
6-Apr 1985 13.4 0.13 7.0 11.4 42.0
3-May 1985 11.7 0.00 11.5 8.5 44.3

49
Sampling
Date Year
Average
Wind
Velocity
(mph)
Total
Precipitation
(inches)
Water
Temperature
(C)
Bottom
DO (mg/L)
Conductivity
(uS/cm)
17-May 1985 11.8 0.26 14.6 9.2 42.4
3-Jun 1985 9.7 0.18 17.5 7.2 42.6
25-Jul 1985 10.3 0.00 25.7 7.7 48.3
23-Aug 1985 9.6 0.05 20.9 8.4 47.1
4-Sep 1985 9.1 0.08 19.0 8.0 48.3
10-Oct 1985 10.1 0.12 11.0 9.8 43.7
24-Oct 1985 14.4 0.32 9.7 10.3 29.9
6-Apr 1978 10.6 1.19
20-Apr 1978 10.0 0.27
4-May 1978 9.9 0.91
11-May 1978 9.9 0.64
16-May 1978 11.9 1.81
1-Jun 1978 10.6 0.65
8-Jun 1978 8.6 0.00
14-Jun 1978 11.9 0.71
21-Jun 1978 9.0 0.71
28-Jun 1978 9.4 0.15
6-Jul 1978 7.5 1.68
12-Jul 1978 7.8 0.39
19-Jul 1978 7.9 0.43
26-Jul 1978 7.3 0.02
2-Aug 1978 6.6 0.01
9-Aug 1978 7.1 0.00
16-Aug 1978 10.3 0.91
1-Sep 1978 6.6 0.54
6-Sep 1978 8.1 0.71
14-Sep 1978 8.8 0.68
20-Sep 1978 8.0 0.00
27-Sep 1978 8.3 0.08
11-Oct 1978 7.5 0.00
25-Oct 1978 7.4 0.00

Appendix B. Chemical Parameter Data

51
Sampling
Date Year
Orthophosphorus
(mg/L)
Total Phosphorus
(mg/L)
DIN
(mg/L)
DIN:DIP
(ratio) pH
22-Apr 2010 0.004 0.012 0.016 15 7.7
5-May 2010 0.004 0.019 0.023 13 6.8
20-May 2010 0.001 0.016 0.018 21 7.4
3-Jun 2010 0.002 0.017 0.019 13 7.1
23-Jun 2010 0.002 0.019 0.021 103 7.6
14-Jul 2010 0.001 0.015 0.016 79 7.8
28-Jul 2010 0.003 0.022 0.026 20 7.7
18-Aug 2010 0.002 0.024 0.026 39 7.9
2-Sep 2010 0.006 0.014 0.021 8 7.4
23-Sep 2010 0.002 0.012 0.015 26 7.4
6-Oct 2010 0.002 0.010 0.012 12 7.6
6-May 2009 0.006 0.030 0.036 12 7.6
14-May 2009 0.006 0.031 0.037 5 7.5
5-Jun 2009 0.006 0.034 0.040 16 7.8
27-Jun 2009 0.006 0.027 0.032 7 7.6
10-Jul 2009 0.006 0.028 0.034 6 7.8
21-Jul 2009 0.005 0.032 0.038 10 8.1
5-Aug 2009 0.002 0.023 0.025 17 7.8
21-Aug 2009 0.002 0.018 0.020 22 7.7
11-Sep 2009 0.006 0.038 0.044 7 7.9
25-Sep 2009 0.006 0.022 0.028 6
24-Oct 2009 0.005 0.036 0.041 9 7.2
7-May 2008 0.003 0.022 0.025 12 7.1
22-May 2008 0.004 0.022 0.026 8 7.4
5-Jun 2008 0.004 0.022 0.026 9
19-Jun 2008 0.004 0.023 0.027 9 6.9
2-Jul 2008 0.004 0.019 0.023 9 7.1
17-Jul 2008 0.004 0.021 0.024 10 7.8
4-Aug 2008 0.005 0.024 0.029 8 7.9
11-Aug 2008 0.004 0.026 0.029 13 7.7
9-Sep 2008 0.004 0.023 0.027 14 7.1
25-Sep 2008 0.004 0.028 0.032 13 7.8
22-Oct 2008 0.005 0.022 0.027 28 7.5
6-Apr 2007 0.001 0.022 0.023 19 6.9
20-Apr 2007 0.001 0.020 0.021 26 7.1
3-May 2007 0.002 0.017 0.019 15 7.3
17-May 2007 0.001 0.011 0.012 12 7.5

52
Sampling
Date
Year Orthophosphorus
(mg/L)
Total Phosphorus
(mg/L)
DIN
(mg/L)
DIN:DIP
(ratio)
pH
31-May 2007 0.002 0.013 0.015 12 7.4
12-Jun 2007 0.001 0.010 0.011 16 7.1
28-Jun 2007 0.005 0.011 0.016 2 7.4
20-Jul 2007 0.009 0.008 0.017 1 7.7
31-Jul 2007 0.009 0.015 0.024 2 8.2
18-Aug 2007 0.002 0.018 0.020 12 7.2
7-Sep 2007
0.015 0.015 6.8
21-Sep 2007 0.001 0.024 0.025 20 7.0
9-Oct 2007 0.011 0.023
6.8
12-May 2006 0.004 0.016 0.020 7 6.9
25-May 2006 0.004 0.016 0.020 6 7.8
8-Jun 2006 0.005 0.016 0.021 6 8.4
22-Jun 2006 0.005 0.011 0.016 4 8.2
6-Jul 2006 0.004 0.012 0.016 6 8.7
21-Jul 2006 0.003 0.012 0.014 6 8.9
3-Aug 2006 0.001 0.010 0.011 10 8.8
15-Aug 2006 0.002 0.008 0.009 6 7.9
31-Aug 2006 0.001 0.012 0.013 13 7.7
11-Sep 2006 0.002 0.011 0.013 6 8.0
28-Sep 2006 0.002 0.009 0.011 5 7.4
12-Oct 2006 0.003 0.008 0.010 4 7.5
15-Apr 2005 0.002 0.022 0.024 7 7.3
29-Apr 2005 0.003 0.026 0.029 5 7.2
12-May 2005 0.003 0.026 0.029 8 7.4
26-May 2005 0.003 0.017
7.2
10-Jun 2005 0.006 0.012
28-Jun 2005 0.003 0.011 0.014 6 7.3
14-Jul 2005 0.003 0.009 0.012 7 7.8
28-Jul 2005 0.003 0.010 0.012 6 8.3
11-Aug 2005 0.002 0.009 0.011 7 8.4
26-Aug 2005 0.003 0.009 0.012 4 7.6
23-Sep 2005 0.005 0.010 0.014 2 8.3
7-Oct 2005 0.003 0.005 0.008 3 7.8
20-Oct 2005 0.002 0.004
7.5
8-Apr 2004 0.002 0.031 0.033 51 7.2
23-Apr 2004 0.007 0.016 0.023 15 7.3
5-May 2004 0.002 0.045 0.046 36 7.4
20-May 2004 0.002 0.027 0.028 51 7.6
2-Jun 2004 0.009 0.057 0.065 11 7.2

53
Sampling
Date Year
Orthophosphorus
(mg/L)
Total Phosphorus
(mg/L)
DIN
(mg/L)
DIN:DIP
(ratio) pH
17-Jun 2004 0.012 0.040
7.2
8-Jul 2004 0.012 0.074
7.7
22-Jul 2004 0.003 0.004
7.7
5-Aug 2004 0.012 0.034
7.6
19-Aug 2004 0.007 0.010
8.5
2-Sep 2004 0.008 0.013
7.4
16-Sep 2004 0.007 0.012
7.3
30-Sep 2004 0.010 0.013
7.7
15-Oct 2004 0.006 0.010
7.6
9-Apr 2003 0.004 0.009 7.0
7-May 2003 0.003 0.006
7.8
20-May 2003 0.002 0.013
8.7
5-Jun 2003 0.002 0.016
9.4
19-Jun 2003 0.002 0.032
9.0
1-Jul 2003 0.004 0.028
7.8
16-Jul 2003 0.001 0.032
8.9
30-Jul 2003 0.003 0.030
8.5
13-Aug 2003 0.003 0.021
8.6
28-Aug 2003 0.002 0.018
8.5
11-Sep 2003 0.002 0.029
8.3
25-Sep 2003 0.004 0.023
8.9
8-Oct 2003 0.004 0.028
8.9
28-Oct 2003 0.006 0.024
8.5
5-Apr 2002 0.005 0.029 0.033 54
25-Apr 2002 0.004 0.028 0.032 16 7.2
7-May 2002 0.002 0.018
7.2
24-May 2002 0.002 0.017 0.019 60 7.1
4-Jun 2002 0.002 0.027
7.9
19-Jun 2002 0.006 0.026 0.032 24 7.9
11-Jul 2002 0.010 0.019 0.029 5 8.0
23-Jul 2002 0.002 0.041 0.043 32 8.4
6-Aug 2002 0.002 0.090 0.092 290 8.0
22-Aug 2002 0.001 0.025 0.026 26 8.6
5-Sep 2002 0.007 0.026 0.033 71 8.5
19-Sep 2002 0.002 0.042
8.8
1-Oct 2002 0.003 0.029
8.9
18-Oct 2002 0.002 0.081
9.0
20-Apr 2001 0.002 0.061 0.063 47 7.1
4-May 2001 0.001 0.070 0.071 197 7.4

54
Sampling
Date Year
Orthophosphorus
(mg/L)
Total Phosphorus
(mg/L)
DIN
(mg/L)
DIN:DIP
(ratio) pH
17-May 2001 0.001 0.067 0.068 198 7.6
30-May 2001 0.001 0.057 0.058 219 7.9
13-Jun 2001 0.006 0.005 0.011 93 8.3
27-Jun 2001 0.001 0.006 0.007 85 9.1
18-Jul 2001 0.001 0.054 0.055 63 9.1
1-Aug 2001 0.007 0.054 0.061 5 9.6
15-Aug 2001 0.001 0.064 0.065 461 9.8
30-Aug 2001 0.001 0.029 0.030 422 9.7
13-Sep 2001 0.001 0.010 0.011 280 9.1
28-Sep 2001 0.001 0.022 0.022 70 9.8
12-Oct 2001 0.001 0.013 0.013 191 8.7
18-May 2000 0.005 0.007 7.7
8-Jun 2000 0.001 0.004
8.0
19-Jun 2000 0.001
8.2
6-Jul 2000 0.001 0.001 0.001 76 8.7
26-Jul 2000 0.001 0.000 0.001 15 9.0
3-Aug 2000 0.001 0.044 0.045 77 9.2
17-Aug 2000 0.005 0.042
8.9
31-Aug 2000 0.007 0.001 0.008 9 8.9
14-Sep 2000 0.005 8.9
28-Sep 2000 0.001 0.005 0.005 257 9.0
9-May 1997 0.001 0.017 0.018 130 7.3
30-May 1997 0.002 0.013 0.016 57 7.3
11-Jun 1997 0.001 0.012 0.013 47 7.3
24-Jun 1997
7.2
11-Jul 1997
0.028 0.028 7.2
22-Jul 1997 0.001 0.006
7.6
6-Aug 1997
7.6
21-Aug 1997
0.012 0.012 7.0
10-Sep 1997
0.018
7.4
17-Oct 1997 0.004
7.4
5-Apr 1996 0.003 0.024 7.6
25-Apr 1996 0.002 0.024
7.4
23-May 1996 0.005 0.023 0.028 36 7.0
26-Jun 1996 0.002 0.050 0.053 21
22-Aug 1996 0.002 0.019 0.020 19 7.5
4-Oct 1996 0.002 0.018 0.020 15 7.6
14-Apr 1995
6-May 1995 0.002
7.0

55
Sampling
Date Year
Orthophosphorus
(mg/L)
Total Phosphorus
(mg/L)
DIN
(mg/L)
DIN:DIP
(ratio) pH
29-Jul 1995 0.001 0.011 0.012 40
23-Aug 1995 0.001 0.020 0.021 27
29-Sep 1995 0.001 0.028
7.3
10-Apr 1994 0.010 0.021 0.031 1 7.4
12-Jul 1994 0.001 0.007 0.008 20 8.8
2-Aug 1994 0.001 0.011 0.012 20 8.3
2-Sep 1994 0.001 0.010 0.011 21 7.6
7-Oct 1994 0.005 0.038 0.043 4 7.6
12-Aug 1993 0.001 0.010 7.7
19-Sep 1993
0.011 0.011 7.4
15-Oct 1993 0.005 0.014
7.0
24-Apr 1992 0.001 0.008 0.009 60
27-May 1992 0.001 0.040 38 7.4
24-Jun 1992 0.005 0.020 4 7.7
16-Oct 1992 0.002 0.008 0.010 10 7.4
13-Apr 1991 0.001 0.019 0.020 30
20-May 1991 0.001 0.007 0.008 30 7.4
30-May 1991 0.001 0.022 0.022 16 7.8
25-Jun 1991 0.001 0.009 0.009 62 7.8
10-Jul 1991 0.001 0.015 0.015 120 8.6
12-Aug 1991 0.001 0.018 0.019 118 8.0
15-Oct 1991 0.002 0.009 0.010 33 7.3
23-Aug 1990 0.013 0.013 7.5
5-Sep 1990
0.011 0.011 7.7
22-Sep 1990
0.014 0.014 7.6
19-Oct 1990
0.013 0.013 7.4
13-Jun 1988 0.017 0.017
11-Jul 1988
0.019 0.019 8.0
8-Aug 1988
0.023 0.023
12-Sep 1988
0.023 0.023 6.7
6-Apr 1985 0.061 0.061 7.3
3-May 1985 0.001 0.017 0.017 26 7.3
17-May 1985 0.001 0.009 0.010 12 7.4
3-Jun 1985 0.001 0.007 0.008 30 7.4
25-Jul 1985 0.001 0.013 0.014 41 7.9
23-Aug 1985 0.001 0.012 0.013 39 7.7
4-Sep 1985 0.001 0.015 0.016 57 7.6
10-Oct 1985 0.001 0.012 0.013 41 7.4
24-Oct 1985 0.001 0.015 0.016 47 7.2

56
Sampling
Date Year
Orthophosphorus
(mg/L)
Total Phosphorus
(mg/L)
DIN
(mg/L)
DIN:DIP
(ratio) pH
6-Apr 1978 0.005 0.017 0.022 5
20-Apr 1978 0.001 0.018 0.019 19
4-May 1978 0.005 0.015 0.020 4
11-May 1978 0.004 0.019 0.023 5
16-May 1978 0.008 0.056 0.064 3
1-Jun 1978 0.005 0.017 0.022 4
8-Jun 1978 0.002 0.009 0.011 10
14-Jun 1978 0.001 0.013 0.014 20
21-Jun 1978 0.001 0.011 0.012 20
28-Jun 1978 0.001
6-Jul 1978 0.001 0.023 0.024 12
12-Jul 1978 0.001 0.026 0.027 20
19-Jul 1978 0.002 0.022 0.024 13
26-Jul 1978 0.001 0.021 0.022 20
2-Aug 1978 0.005 0.016 0.021 4
9-Aug 1978 0.005 0.016 0.021 7
16-Aug 1978 0.005 0.027 0.032 4
1-Sep 1978 0.005 0.022 0.027 4
6-Sep 1978 0.005 0.032 0.037 4
14-Sep 1978 0.005 0.023 0.028 4
20-Sep 1978 0.005 0.025 0.030 4
27-Sep 1978 0.005 0.023 0.028 4
11-Oct 1978 0.005 0.031 0.036 4
25-Oct 1978 0.005 0.026 0.031 4

Appendix C. Biological Parameter Data

58
Sampling
Date Year
Cyanobacteria
Biovolume
(um3/ml)
Log
Cyanobacteria
Biovolume
(um3/ml)
Phytoplankton
Biovolume
(um3/ml)
Log
Phytoplankton
Biovolume
(um3/ml)
Cyanobacteria
Percent (%)
22-Apr 2010 0 0 57,365 4.76 0
5-May 2010 8 0.88 43,069 4.63 0
20-May 2010 205 2.31 185,028 5.27 0
3-Jun 2010 850 2.93 342,040 5.53 0
23-Jun 2010 205 2.31 15,025 4.18 1
14-Jul 2010 11,403 4.06 45,835 4.66 20
28-Jul 2010 628 2.8 77,589 4.89 1
18-Aug 2010 5,917 3.77 43,135 4.63 12
2-Sep 2010 8,272 3.92 143,782 5.16 5
23-Sep 2010 10,646 4.03 70,205 4.85 13
6-Oct 2010 17,134 4.23 153,626 5.19 10
6-May 2009 86 1.93 90,778 4.96 0
14-May 2009 361 2.56 136,761 5.14 0
5-Jun 2009 105 2.02 102,159 5.01 0
27-Jun 2009 0 0 32,662 4.51 0
10-Jul 2009 937 2.97 88,733 4.95 1
21-Jul 2009 1,142 3.06 9,468 3.98 11
5-Aug 2009 3,094 3.49 163,353 5.21 2
21-Aug 2009 16,602 4.22 154,129 5.19 10
11-Sep 2009 5,457 3.74 595,108 5.77 1
25-Sep 2009 3,200 3.51 601,681 5.78 1
24-Oct 2009 20,179 4.3 34,280 4.54 37
7-May 2008 45,106 4.65 186,237 5.27 19
22-May 2008 25,424 4.41 209,963 5.32 11
5-Jun 2008 66,458 4.82 613,839 5.79 10
19-Jun 2008 30,148 4.48 390,366 5.59 7
2-Jul 2008 13,993 4.15 258,963 5.41 5
17-Jul 2008 18,594 4.27 673,839 5.83 3
4-Aug 2008 16,198 4.21 346,689 5.54 4
11-Aug 2008 7,992 3.9 308,904 5.49 3
9-Sep 2008 31,819 4.5 319,246 5.50 9
25-Sep 2008 19,055 4.28 325,750 5.51 6
22-Oct 2008 4,711 3.67 92,895 4.97 5
6-Apr 2007 19,767 4.3 84,874 4.93 19
20-Apr 2007 31,618 4.5 148,022 5.17 18
3-May 2007 58,594 4.77 333,722 5.52 15
17-May 2007 47,463 4.68 347,971 5.54 12

59
Sampling
Date
Year Cyanobacteria
Biovolume
(um3/ml)
Log
Cyanobacteria
Biovolume
(um3/ml)
Phytoplankton
Biovolume
(um3/ml)
Log
Phytoplankton
Biovolume
(um3/ml)
Cyanobacteria
Percent
(%)
31-May 2007 24,076 4.38 301,361 5.48 7
12-Jun 2007 34,923 4.54 464,605 5.67 7
28-Jun 2007 19,550 4.29 376,870 5.58 5
20-Jul 2007 27,277 4.44 495,379 5.69 5
31-Jul 2007 19,990 4.3 675,800 5.83 3
18-Aug 2007 33,690 4.53 465,124 5.67 7
7-Sep 2007 69,510 4.84 1,450,410 6.16 5
21-Sep 2007 36,704 4.56 3,784,588 6.58 1
9-Oct 2007 36,381 4.56 439,030 5.64 8
12-May 2006 17,352 4.24 479,262 5.68 3
25-May 2006 46,806 4.67 327,065 5.51 13
8-Jun 2006 52,850 4.72 335,494 5.53 14
22-Jun 2006 36,214 4.56 404,296 5.61 8
6-Jul 2006 99,153 5 619,826 5.79 14
21-Jul 2006 184,698 5.27 878,672 5.94 17
3-Aug 2006 202,888 5.31 737,813 5.87 22
15-Aug 2006 30,820 4.49 732,990 5.87 4
31-Aug 2006 23,940 4.38 1,128,867 6.05 2
11-Sep 2006 9,679 3.99 909,873 5.96 1
28-Sep 2006 12,630 4.1 1,313,274 6.12 1
12-Oct 2006 9,309 3.97 730,174 5.86 1
15-Apr 2005 18,204 4.26 129,057 5.11 12
29-Apr 2005 46,868 4.67 81,506 4.91 37
12-May 2005 67,928 4.83 234,892 5.37 22
26-May 2005 17,574 4.24 215,874 5.33 8
10-Jun 2005 68,441 4.84 97,191 4.99 41
28-Jun 2005 45,250 4.66 282,501 5.45 14
14-Jul 2005 53,456 4.73 568,938 5.76 9
28-Jul 2005 43,446 4.64 254,238 5.41 15
11-Aug 2005 23,178 4.37 354,989 5.55 6
26-Aug 2005 37,210 4.57 983,539 5.99 4
23-Sep 2005 10,698 4.03 6,194,532 6.79 0
7-Oct 2005 63,434 4.8 6,951,744 6.84 1
20-Oct 2005 53,197 4.73 2,962,307 6.47 2
8-Apr 2004 67,820 4.83 183,745 5.26 27
23-Apr 2004 81,658 4.91 176,867 5.25 32
5-May 2004 3,978 3.6 330,913 5.52 1
20-May 2004 16,342 4.21 248,800 5.40 6
2-Jun 2004 100,441 5 304,795 5.48 25

60
Sampling
Date Year
Cyanobacteria
Biovolume
(um3/ml)
Log
Cyanobacteria
Biovolume
(um3/ml)
Phytoplankton
Biovolume
(um3/ml)
Log
Phytoplankton
Biovolume
(um3/ml)
Cyanobacteria
Percent
(%)
17-Jun 2004 42,004 4.62 157,675 5.20 21
8-Jul 2004 9,333 3.97 113,659 5.06 8
22-Jul 2004 6,930 3.84 67,090 4.83 9
5-Aug 2004 1,345 3.13 35,762 4.55 4
19-Aug 2004 12,313 4.09 249,212 5.40 5
2-Sep 2004 10,246 4.01 244,224 5.39 4
16-Sep 2004 53,319 4.73 613,149 5.79 8
30-Sep 2004 0 0 62,376 4.80 0
15-Oct 2004 30,368 4.48 130,468 5.12 19
9-Apr 2003 5,673 3.75 54,407 4.74 9
7-May 2003 53,668 4.73 304,019 5.48 15
20-May 2003 22,487 4.35 28,302 4.45 44
5-Jun 2003 84,410 4.93 465,783 5.67 15
19-Jun 2003 50,494 4.7 4,170 3.62 92
1-Jul 2003 67 1.83 98,032 4.99 0
16-Jul 2003 22,165 4.35 2,803,767 6.45 1
30-Jul 2003 67,736 4.83 2,040,476 6.31 3
13-Aug 2003 137,817 5.14 3,566,988 6.55 4
28-Aug 2003 698,799 5.84 1,628,452 6.21 30
11-Sep 2003 19,399 4.29 415,797 5.62 4
25-Sep 2003 31,199 4.49 322,343 5.51 9
8-Oct 2003 53,153 4.73 128,902 5.11 29
28-Oct 2003 2,389 3.38 293,457 5.47 1
5-Apr 2002 6,719 3.83 2,360,350 6.37 0
25-Apr 2002 14,875 4.17 1,121,633 6.05 1
7-May 2002 0 0 344,892 5.54 0
24-May 2002 610 2.79 675,937 5.83 0
4-Jun 2002 290 2.46 178,241 5.25 0
19-Jun 2002 36,375 4.56 284,980 5.45 11
11-Jul 2002 20,661 4.32 1,199,862 6.08 2
23-Jul 2002 41,806 4.62 404,525 5.61 9
6-Aug 2002 36,915 4.57 963,373 5.98 4
22-Aug 2002 59,588 4.78 920,893 5.96 6
5-Sep 2002 15,160 4.18 509,918 5.71 3
19-Sep 2002 22,907 4.36 433,287 5.64 5
1-Oct 2002 9,224 3.96 989,821 6.00 1
18-Oct 2002 7,179 3.86 678,464 5.83 1
20-Apr 2001 0 0 624,723 5.80 0
4-May 2001 0 0 230,985 5.36 0
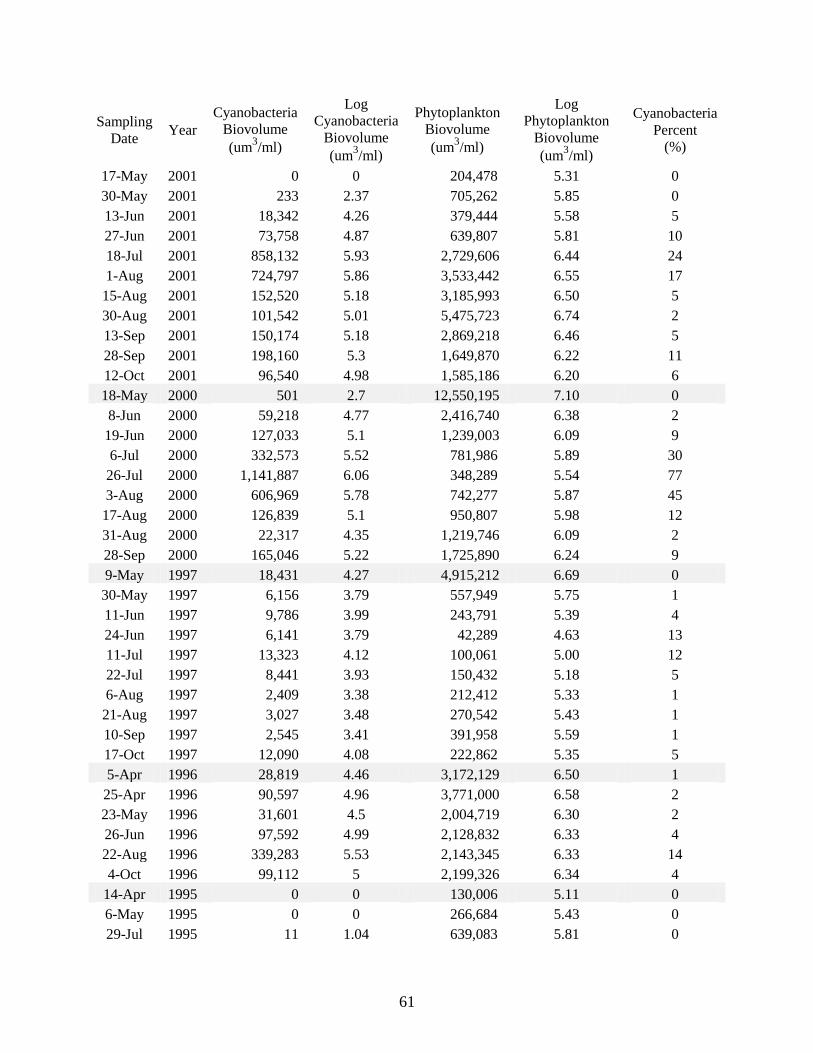
61
Sampling
Date Year
Cyanobacteria
Biovolume
(um3/ml)
Log
Cyanobacteria
Biovolume
(um3/ml)
Phytoplankton
Biovolume
(um3/ml)
Log
Phytoplankton
Biovolume
(um3/ml)
Cyanobacteria
Percent
(%)
17-May 2001 0 0 204,478 5.31 0
30-May 2001 233 2.37 705,262 5.85 0
13-Jun 2001 18,342 4.26 379,444 5.58 5
27-Jun 2001 73,758 4.87 639,807 5.81 10
18-Jul 2001 858,132 5.93 2,729,606 6.44 24
1-Aug 2001 724,797 5.86 3,533,442 6.55 17
15-Aug 2001 152,520 5.18 3,185,993 6.50 5
30-Aug 2001 101,542 5.01 5,475,723 6.74 2
13-Sep 2001 150,174 5.18 2,869,218 6.46 5
28-Sep 2001 198,160 5.3 1,649,870 6.22 11
12-Oct 2001 96,540 4.98 1,585,186 6.20 6
18-May 2000 501 2.7 12,550,195 7.10 0
8-Jun 2000 59,218 4.77 2,416,740 6.38 2
19-Jun 2000 127,033 5.1 1,239,003 6.09 9
6-Jul 2000 332,573 5.52 781,986 5.89 30
26-Jul 2000 1,141,887 6.06 348,289 5.54 77
3-Aug 2000 606,969 5.78 742,277 5.87 45
17-Aug 2000 126,839 5.1 950,807 5.98 12
31-Aug 2000 22,317 4.35 1,219,746 6.09 2
28-Sep 2000 165,046 5.22 1,725,890 6.24 9
9-May 1997 18,431 4.27 4,915,212 6.69 0
30-May 1997 6,156 3.79 557,949 5.75 1
11-Jun 1997 9,786 3.99 243,791 5.39 4
24-Jun 1997 6,141 3.79 42,289 4.63 13
11-Jul 1997 13,323 4.12 100,061 5.00 12
22-Jul 1997 8,441 3.93 150,432 5.18 5
6-Aug 1997 2,409 3.38 212,412 5.33 1
21-Aug 1997 3,027 3.48 270,542 5.43 1
10-Sep 1997 2,545 3.41 391,958 5.59 1
17-Oct 1997 12,090 4.08 222,862 5.35 5
5-Apr 1996 28,819 4.46 3,172,129 6.50 1
25-Apr 1996 90,597 4.96 3,771,000 6.58 2
23-May 1996 31,601 4.5 2,004,719 6.30 2
26-Jun 1996 97,592 4.99 2,128,832 6.33 4
22-Aug 1996 339,283 5.53 2,143,345 6.33 14
4-Oct 1996 99,112 5 2,199,326 6.34 4
14-Apr 1995 0 0 130,006 5.11 0
6-May 1995 0 0 266,684 5.43 0
29-Jul 1995 11 1.04 639,083 5.81 0
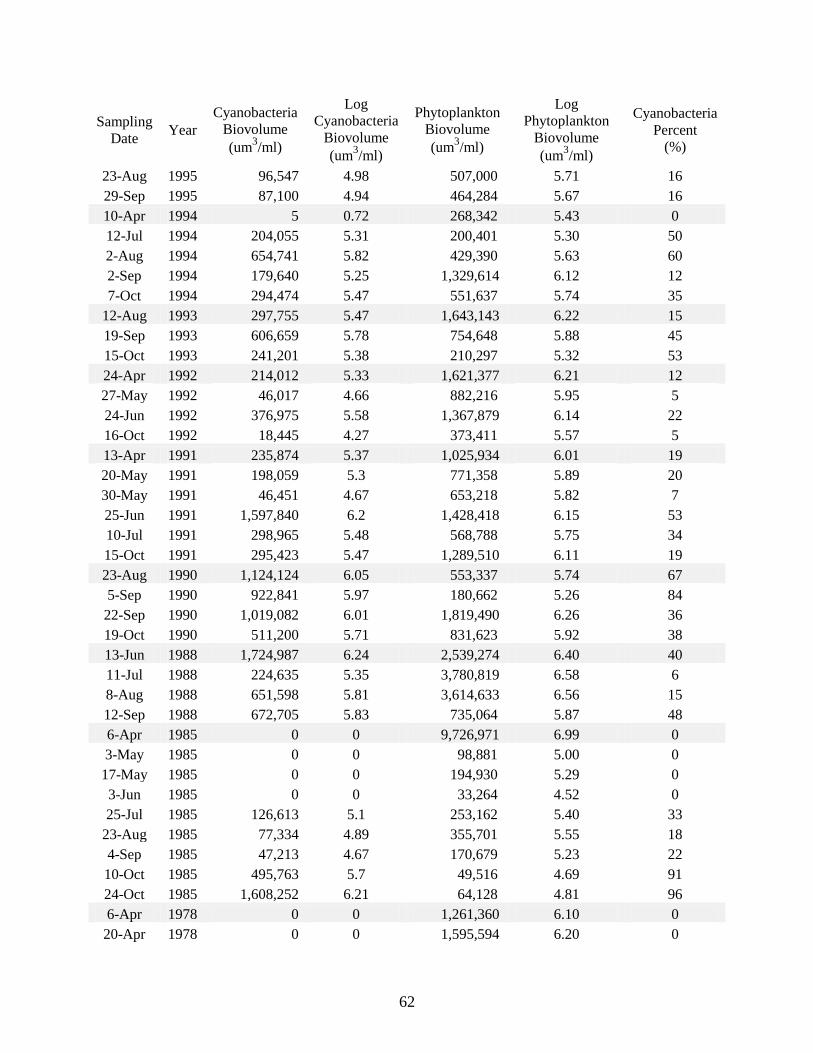
62
Sampling
Date Year
Cyanobacteria
Biovolume
(um3/ml)
Log
Cyanobacteria
Biovolume
(um3/ml)
Phytoplankton
Biovolume
(um3/ml)
Log
Phytoplankton
Biovolume
(um3/ml)
Cyanobacteria
Percent
(%)
23-Aug 1995 96,547 4.98 507,000 5.71 16
29-Sep 1995 87,100 4.94 464,284 5.67 16
10-Apr 1994 5 0.72 268,342 5.43 0
12-Jul 1994 204,055 5.31 200,401 5.30 50
2-Aug 1994 654,741 5.82 429,390 5.63 60
2-Sep 1994 179,640 5.25 1,329,614 6.12 12
7-Oct 1994 294,474 5.47 551,637 5.74 35
12-Aug 1993 297,755 5.47 1,643,143 6.22 15
19-Sep 1993 606,659 5.78 754,648 5.88 45
15-Oct 1993 241,201 5.38 210,297 5.32 53
24-Apr 1992 214,012 5.33 1,621,377 6.21 12
27-May 1992 46,017 4.66 882,216 5.95 5
24-Jun 1992 376,975 5.58 1,367,879 6.14 22
16-Oct 1992 18,445 4.27 373,411 5.57 5
13-Apr 1991 235,874 5.37 1,025,934 6.01 19
20-May 1991 198,059 5.3 771,358 5.89 20
30-May 1991 46,451 4.67 653,218 5.82 7
25-Jun 1991 1,597,840 6.2 1,428,418 6.15 53
10-Jul 1991 298,965 5.48 568,788 5.75 34
15-Oct 1991 295,423 5.47 1,289,510 6.11 19
23-Aug 1990 1,124,124 6.05 553,337 5.74 67
5-Sep 1990 922,841 5.97 180,662 5.26 84
22-Sep 1990 1,019,082 6.01 1,819,490 6.26 36
19-Oct 1990 511,200 5.71 831,623 5.92 38
13-Jun 1988 1,724,987 6.24 2,539,274 6.40 40
11-Jul 1988 224,635 5.35 3,780,819 6.58 6
8-Aug 1988 651,598 5.81 3,614,633 6.56 15
12-Sep 1988 672,705 5.83 735,064 5.87 48
6-Apr 1985 0 0 9,726,971 6.99 0
3-May 1985 0 0 98,881 5.00 0
17-May 1985 0 0 194,930 5.29 0
3-Jun 1985 0 0 33,264 4.52 0
25-Jul 1985 126,613 5.1 253,162 5.40 33
23-Aug 1985 77,334 4.89 355,701 5.55 18
4-Sep 1985 47,213 4.67 170,679 5.23 22
10-Oct 1985 495,763 5.7 49,516 4.69 91
24-Oct 1985 1,608,252 6.21 64,128 4.81 96
6-Apr 1978 0 0 1,261,360 6.10 0
20-Apr 1978 0 0 1,595,594 6.20 0

63
Sampling
Date Year
Cyanobacteria
Biovolume
(um3/ml)
Log
Cyanobacteria
Biovolume
(um3/ml)
Phytoplankton
Biovolume
(um3/ml)
Log
Phytoplankton
Biovolume
(um3/ml)
Cyanobacteria
Percent
(%)
4-May 1978 0 0 885,679 5.95 0
11-May 1978 0 0 645,706 5.81 0
16-May 1978 0 0 635,181 5.80 0
1-Jun 1978 0 0 330,949 5.52 0
8-Jun 1978 6,611 3.82 2,284,746 6.36 0
14-Jun 1978 30,539 4.48 523,956 5.72 6
21-Jun 1978 183,048 5.26 241,904 5.38 43
28-Jun 1978 126,900 5.1 801,033 5.90 14
6-Jul 1978 151,868 5.18 341,944 5.53 31
12-Jul 1978 1,017,272 6.01 635,442 5.80 62
19-Jul 1978 123,232 5.09 430,763 5.63 22
26-Jul 1978 1,045,308 6.02 385,368 5.59 73
2-Aug 1978 381,209 5.58 496,110 5.70 43
9-Aug 1978 192,353 5.28 569,897 5.76 25
16-Aug 1978 274,629 5.44 1,238,240 6.09 18
1-Sep 1978 168,886 5.23 676,918 5.83 20
6-Sep 1978 162,697 5.21 896,444 5.95 15
14-Sep 1978 602,198 5.78 1,147,265 6.06 34
20-Sep 1978 1,088,925 6.04 991,059 6.00 52
27-Sep 1978 821,776 5.91 889,364 5.95 48
11-Oct 1978 1,297,422 6.11 715,861 5.85 64
25-Oct 1978 2,583,483 6.41 661,627 5.82 80
Sampling
Date Year
Zooplankton
Density
(animals/m3)
Log Zooplankton
Density
(animals/m3)
Fish Biomass
(lbs)
Log Fish
Biomass (lbs)
22-Apr 2010 37,518 4.57 9.7 0.99
5-May 2010 30,558 4.49 9.7 0.99
20-May 2010 10,378 4.02 9.7 0.99
3-Jun 2010 51,005 4.71 9.7 0.99
23-Jun 2010 19,270 4.28 9.7 0.99
14-Jul 2010 53,367 4.73 9.7 0.99
28-Jul 2010 55,946 4.75 9.7 0.99
18-Aug 2010 27,327 4.44 9.7 0.99
2-Sep 2010 34,163 4.53 9.7 0.99
23-Sep 2010 31,012 4.49 9.7 0.99
6-Oct 2010 25,425 4.41 9.7 0.99

64
Sampling
Date Year
Zooplankton
Density
(animals/m3)
Log Zooplankton
Density
(animals/m3)
Fish Biomass
(lbs)
Log Fish
Biomass (lbs)
6-May 2009 10,651 4.03 17.3 1.24
14-May 2009 6,321 3.80 17.3 1.24
5-Jun 2009 8,168 3.91 17.3 1.24
27-Jun 2009 17,504 4.24 17.3 1.24
10-Jul 2009 19,964 4.30 17.3 1.24
21-Jul 2009 7,655 3.88 17.3 1.24
5-Aug 2009 5,598 3.75 17.3 1.24
21-Aug 2009
17.3 1.24
11-Sep 2009 9,071 3.96 17.3 1.24
25-Sep 2009 3,453 3.54 17.3 1.24
24-Oct 2009 4,134 3.62 136.1 2.13
7-May 2008 24,138 4.38 10.6 1.02
22-May 2008 34,301 4.54 10.6 1.02
5-Jun 2008 49,490 4.69 10.6 1.02
19-Jun 2008 29,341 4.47 756.6 2.88
2-Jul 2008 16,394 4.21 756.6 2.88
17-Jul 2008 23,395 4.37 756.6 2.88
4-Aug 2008 8,984 3.95 756.6 2.88
11-Aug 2008 13,098 4.12 756.6 2.88
9-Sep 2008 24,160 4.38 756.6 2.88
25-Sep 2008 8,496 3.93 1,253.0 3.10
22-Oct 2008 39,008 4.59 1,253.0 3.10
6-Apr 2007 113,895 5.06 3,711.9 3.57
20-Apr 2007 205,378 5.31 4,706.5 3.67
3-May 2007 228,725 5.36 4,706.5 3.67
17-May 2007 239,483 5.38 4,706.5 3.67
31-May 2007 102,216 5.01 5,122.5 3.71
12-Jun 2007 68,562 4.84 5,122.5 3.71
28-Jun 2007 68,743 4.84 5,122.5 3.71
20-Jul 2007 90,024 4.95 5,122.5 3.71
31-Jul 2007 122,002 5.09 5,122.5 3.71
18-Aug 2007 78,010 4.89 5,122.5 3.71
7-Sep 2007 184,162 5.27 5,122.5 3.71
21-Sep 2007 28,648 4.46 5,122.5 3.71
9-Oct 2007 31,678 4.50 6,958.4 3.84
12-May 2006 99,482 5.00 8.5 0.93
25-May 2006 137,518 5.14 8.5 0.93
8-Jun 2006 130,569 5.12 8.5 0.93
22-Jun 2006 65,154 4.81 8.5 0.93
6-Jul 2006 169,246 5.23 8.5 0.93

65
Sampling
Date Year
Zooplankton
Density
(animals/m3)
Log Zooplankton
Density
(animals/m3)
Fish Biomass
(lbs)
Log Fish
Biomass (lbs)
21-Jul 2006 145,927 5.16 8.5 0.93
3-Aug 2006 211,543 5.33 8.5 0.93
15-Aug 2006 116,167 5.07 8.5 0.93
31-Aug 2006 182,102 5.26 8.5 0.93
11-Sep 2006 206,501 5.31 8.5 0.93
28-Sep 2006 99,478 5.00 8.5 0.93
12-Oct 2006 82,393 4.92 28.1 1.45
15-Apr 2005 9,035 3.96 2,000.0 3.30
29-Apr 2005 34,567 4.54 6,000.0 3.78
12-May 2005 40,864 4.61 6,000.0 3.78
26-May 2005 90,842 4.96 6,000.0 3.78
10-Jun 2005 137,372 5.14 6,000.0 3.78
28-Jun 2005 79,446 4.90 6,000.0 3.78
14-Jul 2005 37,054 4.57 6,000.0 3.78
28-Jul 2005 60,566 4.78 6,000.0 3.78
11-Aug 2005 73,240 4.86 6,000.0 3.78
26-Aug 2005 244,047 5.39 6,000.0 3.78
23-Sep 2005 341,417 5.53 6,000.0 3.78
7-Oct 2005 66,147 4.82 6,079.6 3.78
20-Oct 2005 103,253 5.01 6,079.6 3.78
8-Apr 2004
5.3 0.72
23-Apr 2004 14,759 4.17 2,005.3 3.30
5-May 2004 35,751 4.55 2,051.3 3.31
20-May 2004
2,051.3 3.31
2-Jun 2004 84,785 4.93 2,051.3 3.31
17-Jun 2004 101,179 5.01 2,051.3 3.31
8-Jul 2004 45,262 4.66 2,051.3 3.31
22-Jul 2004 219,704 5.34 2,051.3 3.31
5-Aug 2004 74,223 4.87 2,051.3 3.31
19-Aug 2004 52,251 4.72 2,051.3 3.31
2-Sep 2004 50,212 4.70 2,051.3 3.31
16-Sep 2004 81,284 4.91 2,051.3 3.31
30-Sep 2004
2,051.3 3.31
15-Oct 2004 36,867 4.57 2,091.0 3.32
9-Apr 2003 9,212 3.96 2,057.0 3.31
7-May 2003 8,188 3.91 2,057.0 3.31
20-May 2003 4,240 3.63 2,057.0 3.31
5-Jun 2003 19,447 4.29 2,057.0 3.31
19-Jun 2003 151,812 5.18 2,057.0 3.31
1-Jul 2003 64,335 4.81 2,072.7 3.32

66
Sampling
Date Year
Zooplankton
Density
(animals/m3)
Log Zooplankton
Density
(animals/m3)
Fish Biomass
(lbs)
Log Fish
Biomass (lbs)
16-Jul 2003 85,907 4.93 2,072.7 3.32
30-Jul 2003 47,228 4.67 2,072.7 3.32
13-Aug 2003 111,052 5.05 2,072.7 3.32
28-Aug 2003 18,716 4.27 2,072.7 3.32
11-Sep 2003 38,455 4.58 2,072.7 3.32
25-Sep 2003 27,489 4.44 2,072.7 3.32
8-Oct 2003 19,008 4.28 4,854.7 3.69
28-Oct 2003 36,774 4.57 5,856.7 3.77
5-Apr 2002 22,088 4.34 4,632.0 3.67
25-Apr 2002 70,194 4.85 4,632.0 3.67
7-May 2002 208,417 5.32 4,632.0 3.67
24-May 2002 137,549 5.14 4,632.0 3.67
4-Jun 2002 247,642 5.39 4,632.0 3.67
19-Jun 2002 141,784 5.15 4,632.0 3.67
11-Jul 2002 31,872 4.50 4,632.0 3.67
23-Jul 2002 80,405 4.91 4,632.0 3.67
6-Aug 2002 73,091 4.86 4,632.0 3.67
22-Aug 2002 84,772 4.93 4,632.0 3.67
5-Sep 2002 35,740 4.55 4,632.0 3.67
19-Sep 2002 38,952 4.59 4,632.0 3.67
1-Oct 2002 15,060 4.18 15,086.5 4.18
18-Oct 2002 35,692 4.55 15,086.5 4.18
20-Apr 2001 35,449 4.55 3,070.3 3.49
4-May 2001 123,232 5.09 3,088.3 3.49
17-May 2001 96,717 4.99 3,088.3 3.49
30-May 2001 48,229 4.68 3,088.3 3.49
13-Jun 2001 18,239 4.26 3,088.3 3.49
27-Jun 2001 46,799 4.67 3,088.3 3.49
18-Jul 2001 110,702 5.04 3,088.3 3.49
1-Aug 2001 58,762 4.77 3,088.3 3.49
15-Aug 2001 51,312 4.71 3,088.3 3.49
30-Aug 2001 65,877 4.82 3,088.3 3.49
13-Sep 2001 37,978 4.58 3,088.3 3.49
28-Sep 2001 37,832 4.58 3,088.3 3.49
12-Oct 2001 51,644 4.71 4,068.3 3.61
18-May 2000 85,438 4.93 3,475.0 3.54
8-Jun 2000 45,643 4.66 3,483.8 3.54
19-Jun 2000 79,075 4.90 3,483.8 3.54
6-Jul 2000 35,622 4.55 3,483.8 3.54
26-Jul 2000 28,414 4.45 3,483.8 3.54
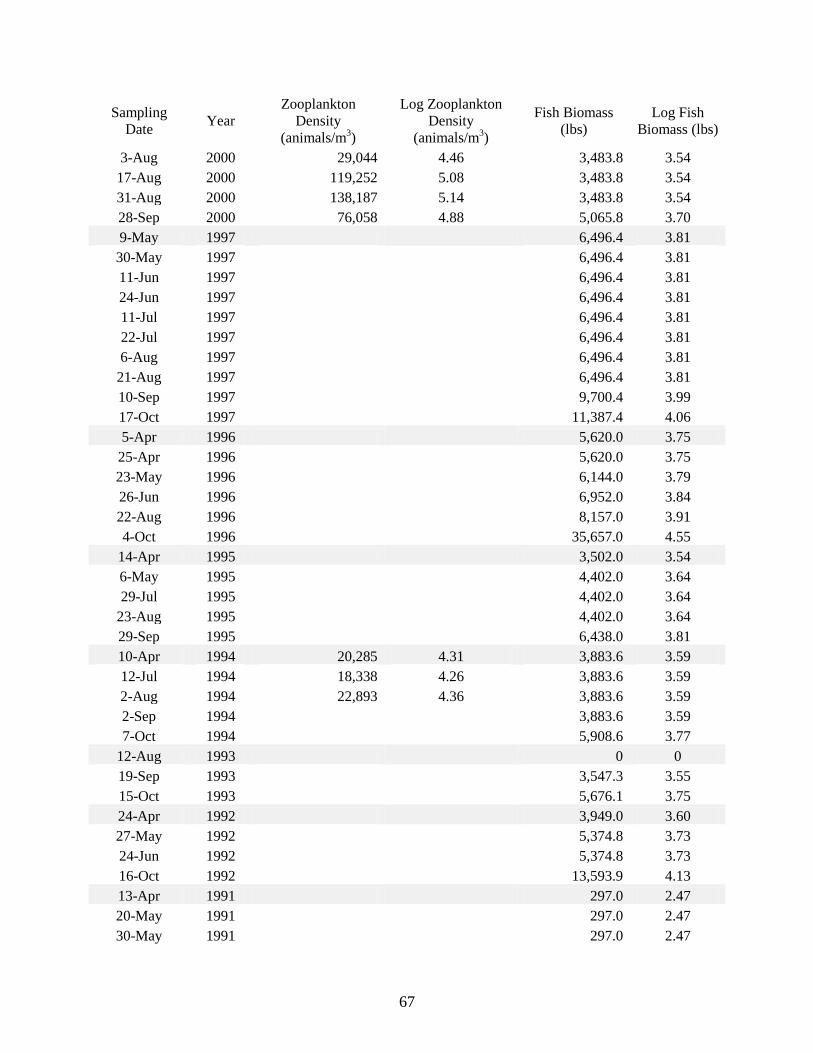
67
Sampling
Date Year
Zooplankton
Density
(animals/m3)
Log Zooplankton
Density
(animals/m3)
Fish Biomass
(lbs)
Log Fish
Biomass (lbs)
3-Aug 2000 29,044 4.46 3,483.8 3.54
17-Aug 2000 119,252 5.08 3,483.8 3.54
31-Aug 2000 138,187 5.14 3,483.8 3.54
28-Sep 2000 76,058 4.88 5,065.8 3.70
9-May 1997
6,496.4 3.81
30-May 1997
6,496.4 3.81
11-Jun 1997
6,496.4 3.81
24-Jun 1997
6,496.4 3.81
11-Jul 1997
6,496.4 3.81
22-Jul 1997
6,496.4 3.81
6-Aug 1997
6,496.4 3.81
21-Aug 1997
6,496.4 3.81
10-Sep 1997
9,700.4 3.99
17-Oct 1997
11,387.4 4.06
5-Apr 1996
5,620.0 3.75
25-Apr 1996
5,620.0 3.75
23-May 1996
6,144.0 3.79
26-Jun 1996
6,952.0 3.84
22-Aug 1996
8,157.0 3.91
4-Oct 1996
35,657.0 4.55
14-Apr 1995
3,502.0 3.54
6-May 1995
4,402.0 3.64
29-Jul 1995
4,402.0 3.64
23-Aug 1995
4,402.0 3.64
29-Sep 1995
6,438.0 3.81
10-Apr 1994 20,285 4.31 3,883.6 3.59
12-Jul 1994 18,338 4.26 3,883.6 3.59
2-Aug 1994 22,893 4.36 3,883.6 3.59
2-Sep 1994
3,883.6 3.59
7-Oct 1994
5,908.6 3.77
12-Aug 1993
0 0
19-Sep 1993
3,547.3 3.55
15-Oct 1993
5,676.1 3.75
24-Apr 1992
3,949.0 3.60
27-May 1992
5,374.8 3.73
24-Jun 1992
5,374.8 3.73
16-Oct 1992
13,593.9 4.13
13-Apr 1991
297.0 2.47
20-May 1991
297.0 2.47
30-May 1991
297.0 2.47

68
Sampling
Date Year
Zooplankton
Density
(animals/m3)
Log Zooplankton
Density
(animals/m3)
Fish Biomass
(lbs)
Log Fish
Biomass (lbs)
25-Jun 1991
297.0 2.47
10-Jul 1991
297.0 2.47
15-Oct 1991
297.0 2.47
23-Aug 1990
4,692.1 3.67
5-Sep 1990
4,692.1 3.67
22-Sep 1990
12,099.1 4.08
19-Oct 1990
12,099.1 4.08
13-Jun 1988
83.0 1.92
11-Jul 1988
83.0 1.92
8-Aug 1988
83.0 1.92
12-Sep 1988
83.0 1.92
6-Apr 1985 25,459 4.41
3-May 1985 181,256 5.26
17-May 1985 316,589 5.50
3-Jun 1985 118,350 5.07
25-Jul 1985 19,738 4.30
23-Aug 1985 77,342 4.89
4-Sep 1985 69,231 4.84
10-Oct 1985 107,790 5.03
24-Oct 1985 110,404 5.04
6-Apr 1978
20-Apr 1978
4-May 1978
39,083.0 4.59
11-May 1978
39,083.0 4.59
16-May 1978
39,083.0 4.59
1-Jun 1978
39,083.0 4.59
8-Jun 1978
39,083.0 4.59
14-Jun 1978
39,083.0 4.59
21-Jun 1978
39,083.0 4.59
28-Jun 1978
39,083.0 4.59
6-Jul 1978
39,083.0 4.59
12-Jul 1978
39,083.0 4.59
19-Jul 1978
39,083.0 4.59
26-Jul 1978
39,083.0 4.59
2-Aug 1978
39,083.0 4.59
9-Aug 1978
39,083.0 4.59
16-Aug 1978
39,083.0 4.59
1-Sep 1978
39,083.0 4.59
6-Sep 1978
39,083.0 4.59
14-Sep 1978
39,083.0 4.59
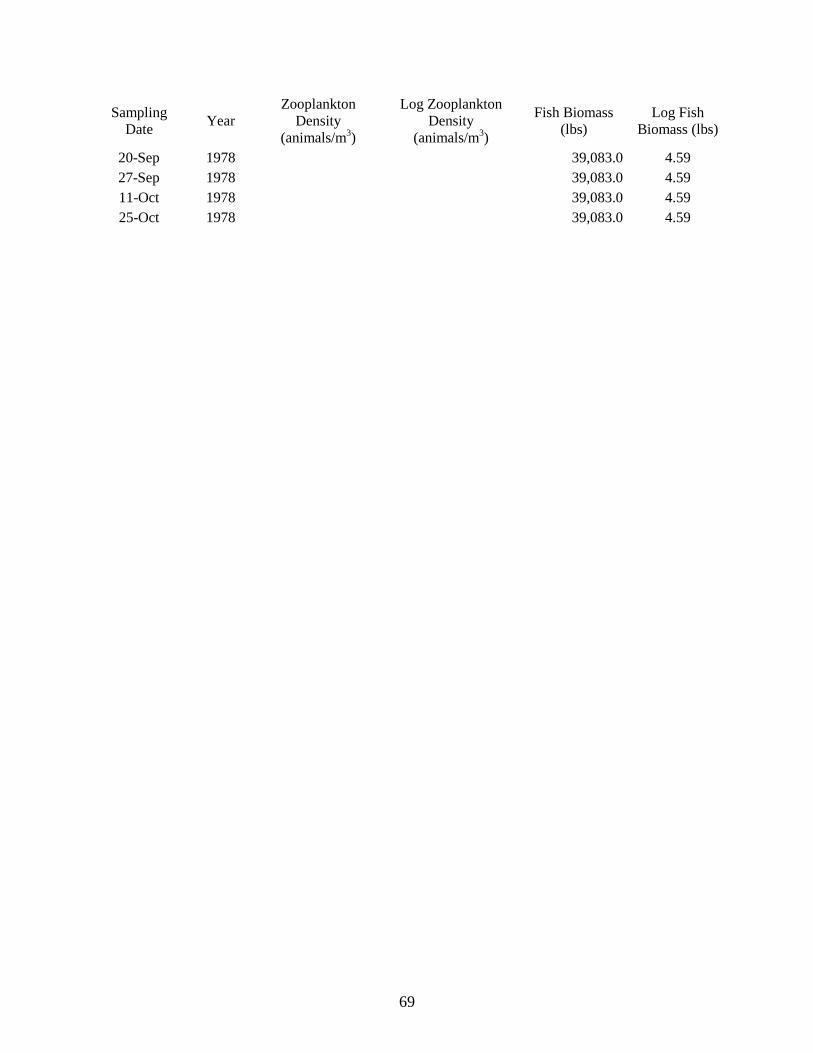
69
Sampling
Date Year
Zooplankton
Density
(animals/m3)
Log Zooplankton
Density
(animals/m3)
Fish Biomass
(lbs)
Log Fish
Biomass (lbs)
20-Sep 1978
39,083.0 4.59
27-Sep 1978
39,083.0 4.59
11-Oct 1978
39,083.0 4.59
25-Oct 1978
39,083.0 4.59

Appendix D. Boxplots of Yearly Physical, Chemical and Biological Data

71
2010
2009
2008
2007
2006
2005
2004
2003
2002
2001
2000
1997
1996
1995
1994
1993
1992
1991
1990
1988
1985
1978
20.0
17.5
15.0
12.5
10.0
7.5
5.0
Year
mil
es p
er
ho
ur
Yearly Average Wind Velocity (mph)
2010
2009
2008
2007
2006
2005
2004
2003
2002
2001
2000
1997
1996
1995
1994
1993
1992
1991
1990
1988
1985
1978
2.0
1.5
1.0
0.5
0.0
Year
Inch
es
Yearly Total Precipitation (in)

72
2010
2009
2008
2007
2006
2005
2004
2003
2002
2001
2000
1997
1996
1995
1994
1993
1992
1991
1990
1988
1985
1978
30
25
20
15
10
5
Year
De
gre
es C
Yearly Water Temperature (C)
2010
2009
2008
2007
2006
2005
2004
2003
2002
2001
2000
1997
1996
1995
1994
1993
1992
1991
1990
1988
1985
1978
16
14
12
10
8
6
4
2
0
Year
DO
(m
g/L
)
Yearly Bottom Dissolved Oxygen (mg/L)

73
2010
2009
2008
2007
2006
2005
2004
2003
2002
2001
2000
1997
1996
1995
1994
1993
1992
1991
1990
1988
1985
1978
60
50
40
30
20
10
Year
uS
/cm
Yearly Conductivity (uS/cm)
2010
2009
2008
2007
2006
2005
2004
2003
2002
2001
2000
1997
1996
1995
1994
1993
1992
1991
1990
1988
1985
1978
0.012
0.010
0.008
0.006
0.004
0.002
0.000
Year
mg
/L
Yearly Orthophosphorus (mg/L)

74
2010
2009
2008
2007
2006
2005
2004
2003
2002
2001
2000
1997
1996
1995
1994
1993
1992
1991
1990
1988
1985
1978
0.09
0.08
0.07
0.06
0.05
0.04
0.03
0.02
0.01
0.00
Year
mg
/LYearly Total Phosphorus (mg/L)
2010
2009
2008
2007
2006
2005
2004
2003
2002
2001
2000
1997
1996
1995
1994
1993
1992
1991
1990
1988
1985
1978
0.6
0.5
0.4
0.3
0.2
0.1
0.0
Year
mg
/L
Yearly Dissolved Inorganic Nitrogen (mg/L)
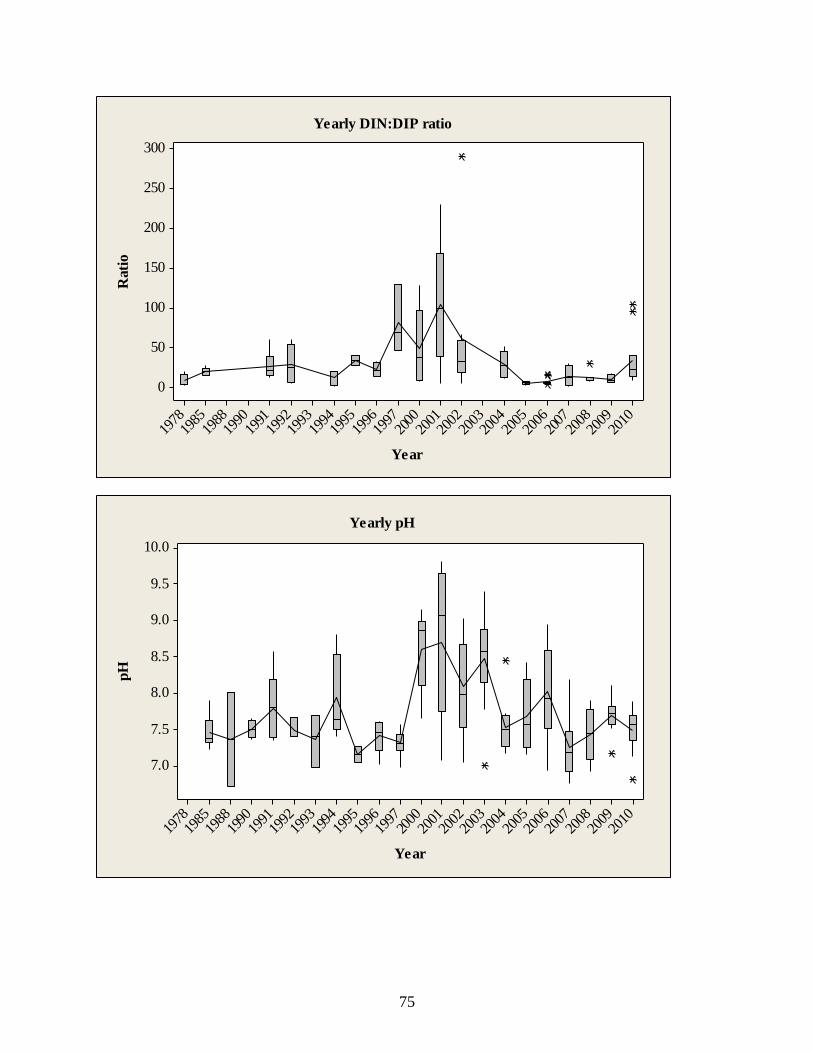
75
2010
2009
2008
2007
2006
2005
2004
2003
2002
2001
2000
1997
1996
1995
1994
1993
1992
1991
1990
1988
1985
1978
300
250
200
150
100
50
0
Year
Rati
oYearly DIN:DIP ratio
2010
2009
2008
2007
2006
2005
2004
2003
2002
2001
2000
1997
1996
1995
1994
1993
1992
1991
1990
1988
1985
1978
10.0
9.5
9.0
8.5
8.0
7.5
7.0
Year
pH
Yearly pH

76
2010
2009
2008
2007
2006
2005
2004
2003
2002
2001
2000
1997
1996
1995
1994
1993
1992
1991
1990
1988
1985
1978
350000
300000
250000
200000
150000
100000
50000
0
Year
an
imals
/ml3
Yearly Zooplankton Density
2010
2009
2008
2007
2006
2005
2004
2003
2002
2001
2000
1997
1996
1995
1994
1993
1992
1991
1990
1988
1985
1978
40000
30000
20000
10000
0
Year
Sto
ck
ed
Po
un
ds
Yearly Stocked Fish Biomass (lbs)

77
2010
2009
2008
2007
2006
2005
2004
2003
2002
2001
2000
1997
1996
1995
1994
1993
1992
1991
1990
1988
1985
1978
14000000
12000000
10000000
8000000
6000000
4000000
2000000
0
Year
Bio
vo
lum
e (
um
/ml3
)Yearly Phytoplankton Biovolume
2010
2009
2008
2007
2006
2005
2004
2003
2002
2001
2000
1997
1996
1995
1994
1993
1992
1991
1990
1988
1985
1978
2500000
2000000
1500000
1000000
500000
0
Year
Bio
vo
lum
e u
m/m
l3
Yearly Cyanobacteria Biovolumes
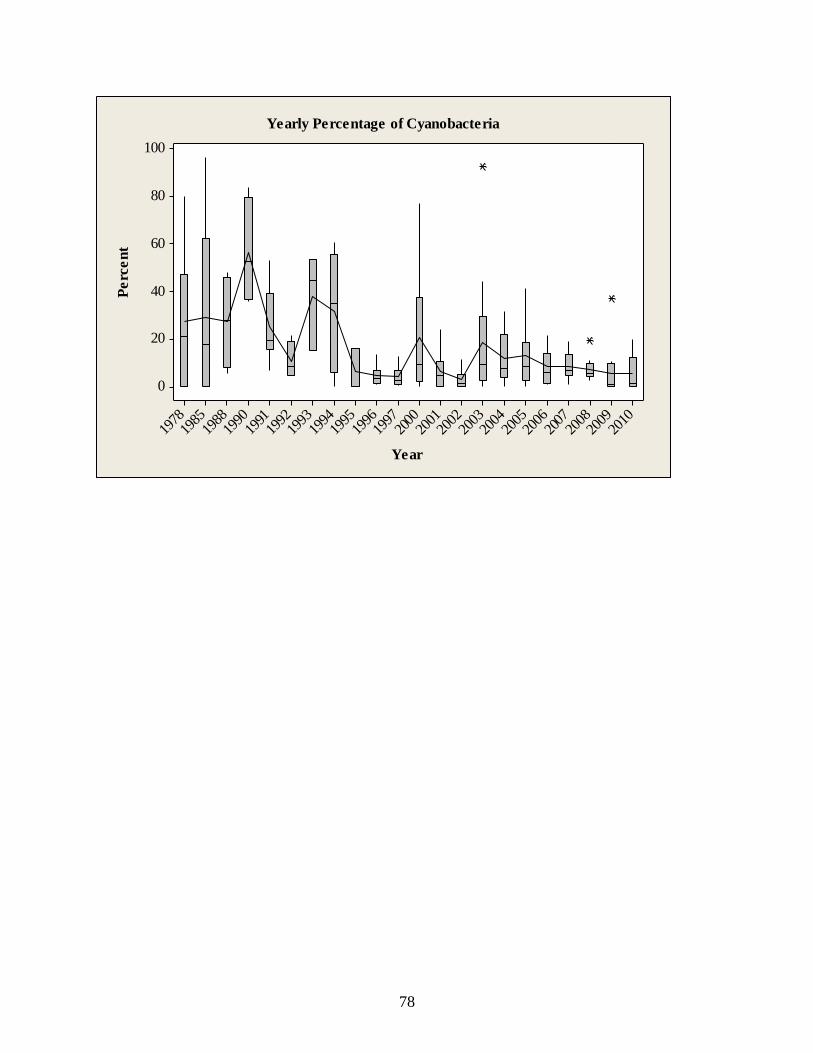
78
2010
2009
2008
2007
2006
2005
2004
2003
2002
2001
2000
1997
1996
1995
1994
1993
1992
1991
1990
1988
1985
1978
100
80
60
40
20
0
Year
Pe
rce
nt
Yearly Percentage of Cyanobacteria

Appendix E. Scatterplots with Regression Line

80
18126 210 302010 1680
5.0
2.5
0.0
604020
5.0
2.5
0.0
0.0100.0050.000 0.100.050.00 0.500.250.00
3001500 9.58.57.5 5.64.84.0 4.53.01.5
5.0
2.5
0.0
7.56.04.5
5.0
2.5
0.0
Average Wind Velocity (mph)
Lo
g C
yan
ob
acte
ria B
iov
olu
me
(u
m/m
l3)
Total Precipitation (in) Water Temperature (C) Bottom Water DO (mg/L)
Conductivity (uS/cm) Orthophosphorus (mg/L) Total Phosphorus (mg/L) DIN
DIN:DIP pH Log Zoop. Density (animals/m3) Log Fish Biomass (lbs)
Log Phy to. Biovolume (um/ml3)
Cyanobacteria Biovolumes and Environmental Parameters
Figure 1. Scatterplot of data for log cyanobacteria biovolumes and environmental parameters
from years 1978 to 2010.

81
18126 210 302010 1680
100
50
0
604020
100
50
0
0.0100.0050.000 0.100.050.00 0.500.250.00
3001500 9.58.57.5 5.64.84.0 4.53.01.5
100
50
0
7.56.04.5
100
50
0
Average Wind Velocity (mph)
Pe
rce
nt
of
Cyan
ob
acte
ria (
%)
Total Precipitation (in) Water Temperature (C) Bottom Water DO (mg/L)
Conductivity (uS/cm) Orthophosphorus (mg/L) Total Phosphorus (mg/L) DIN
DIN:DIP pH Log Zoop. Density (animals/m3) Log Fish Biomass (lbs)
Log Phy to. Biovolume (um/ml3)
Cyanobacteria Percent and Environmental Parameters
Figure 2. Scatterplot of data for percent of cyanobacteria in phytoplankton biovolumes and
environmental parameters from years 1978 to 2010.

82
18126 210 24168 1680
5
3
1
604020
5
3
1
0.0100.0050.000 0.100.050.00 0.500.250.00
3001500 987 5.64.84.0 4.53.01.5
5
3
1
7.56.04.5
5
3
1
Wind Velocity (mph)L
og
Cyan
ob
acte
ria B
iov
olu
me
(u
m/m
l3)
Total Precipitation (in) Water Temperature (C) Bottom Water DO (mg/L)
Conductivity Orthophosphorus (mg/L) Total Phosphorus (mg/L) DIN
DIN:DIP pH Log Zoop. Density (animals/m3) Log Fish Biomass (lbs)
Log Phy to. Biovolume (um/ml3)
Blooms and Environmental Parameters
Figure 3. Scatterplot of data for cyanobacteria biovolumes greater than 100,000 um3/ml and
environmental predictors from years 1978 to 2010.
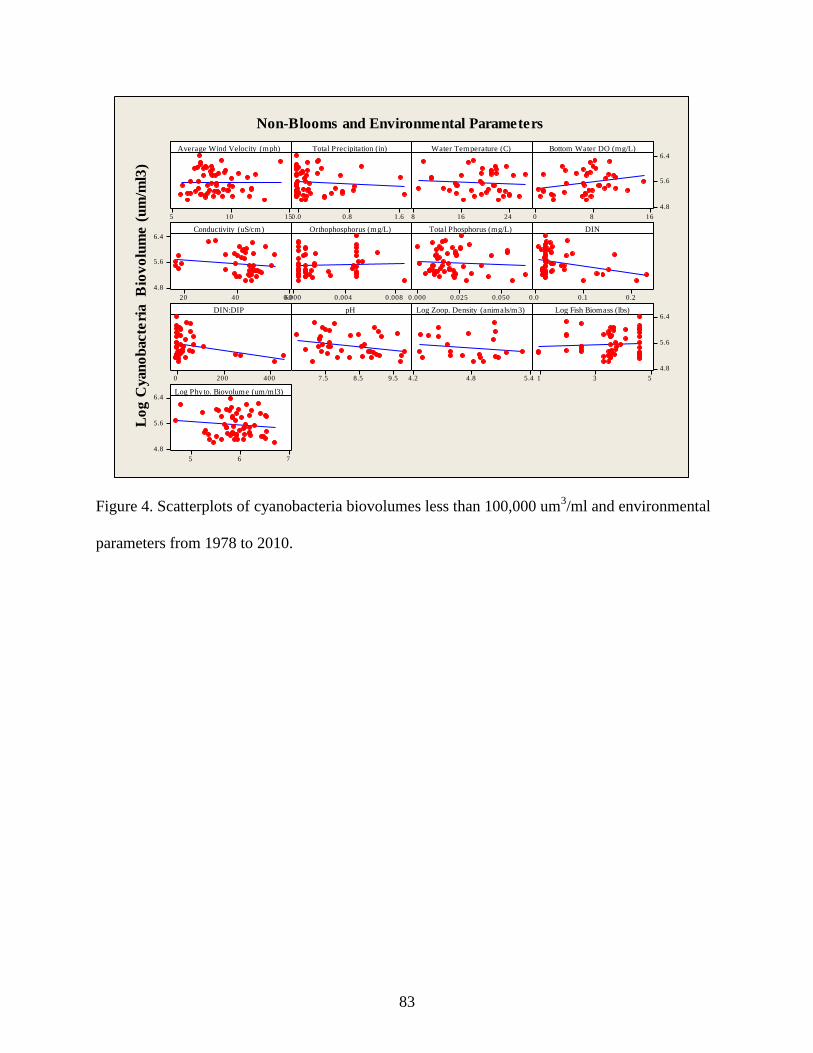
83
15105 1.60.80.0 24168 1680
6.4
5.6
4.8
604020
6.4
5.6
4.8
0.0080.0040.000 0.0500.0250.000 0.20.10.0
4002000 9.58.57.5 5.44.84.2 531
6.4
5.6
4.8
765
6.4
5.6
4.8
Average Wind Velocity (mph)L
og
Cyan
ob
acte
ria
Bio
vo
lum
e (
um
/ml3
)Total Precipitation (in) Water Temperature (C) Bottom Water DO (mg/L)
Conductivity (uS/cm) Orthophosphorus (mg/L) Total Phosphorus (mg/L) DIN
DIN:DIP pH Log Zoop. Density (animals/m3) Log Fish Biomass (lbs)
Log Phy to. Biovolume (um/ml3)
Non-Blooms and Environmental Parameters
Figure 4. Scatterplots of cyanobacteria biovolumes less than 100,000 um3/ml and environmental
parameters from 1978 to 2010.