enzyme-immobilized 3d-printed reactors for online
TRANSCRIPT
1
Supporting Information
Enzyme-Immobilized 3D-Printed Reactors for
Online Monitoring of Rat Brain Extracellular
Glucose and Lactate
Cheng-Kuan Su,*,† Shuo-Chih Yen,
‡ Tzu-Wen Li,
‡ and Yuh-Chang Sun
*,‡
†Department of Bioscience and Biotechnology, National Taiwan Ocean University, Keelung,
20224, Taiwan
‡Department of Biomedical Engineering and Environmental Sciences, National Tsing-Hua
University, Hsinchu, 30013, Taiwan.
*Corresponding Author:
*Fax: +886-3-5723883; Tel.: +886-3-5727309. E-mail: [email protected]
*Fax: +886-2-24622320; Tel.: +886-2-24622192 ext. 5571. E-mail:
2
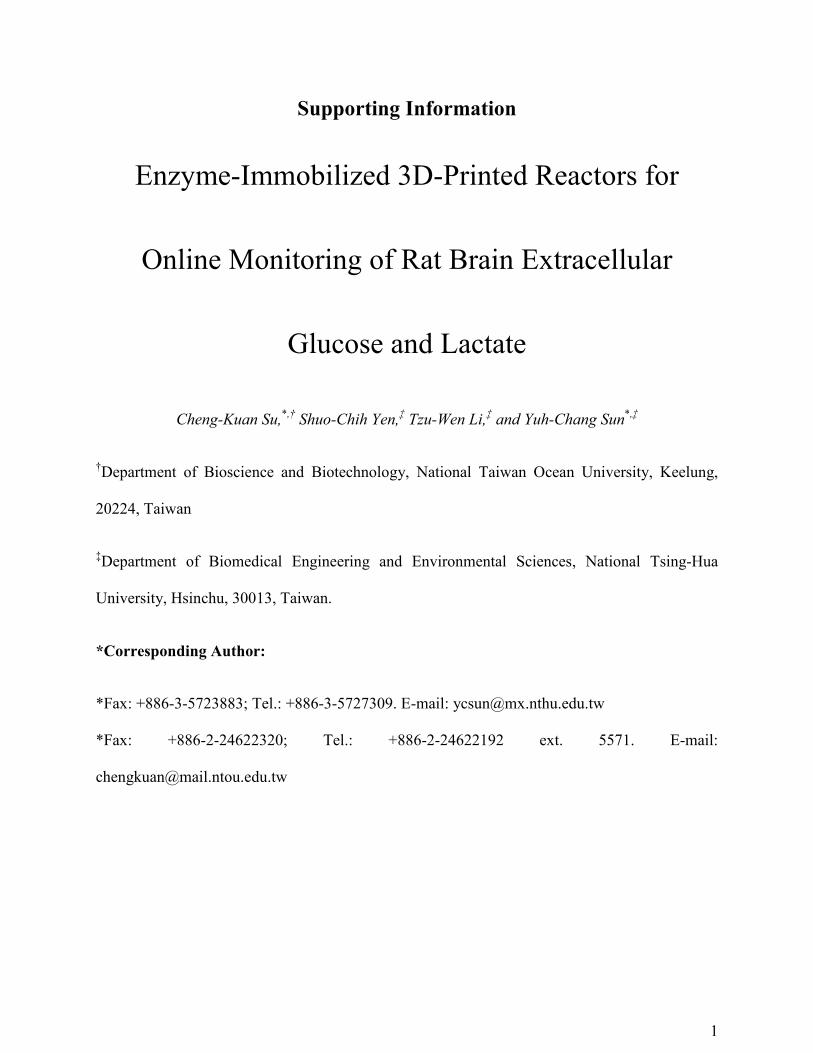
Figure S1. Detailed dimensions of the designed flow-through bioreactor. Units: mm.
3
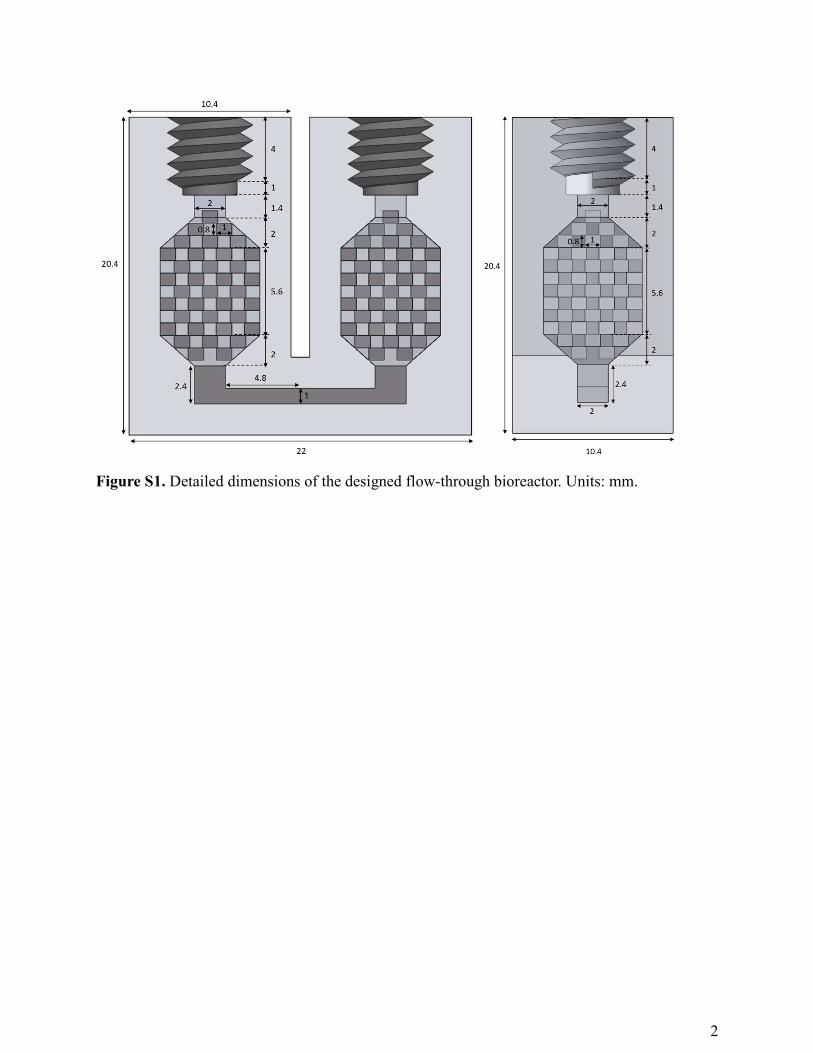
Figure S2. Photograph of printed ordered cuboids (four layers; 1 × 4 × 9 × 16 cuboids)
manufactured by the 3D printer (UP Plus 2). Their respective dimensions are marked.
4
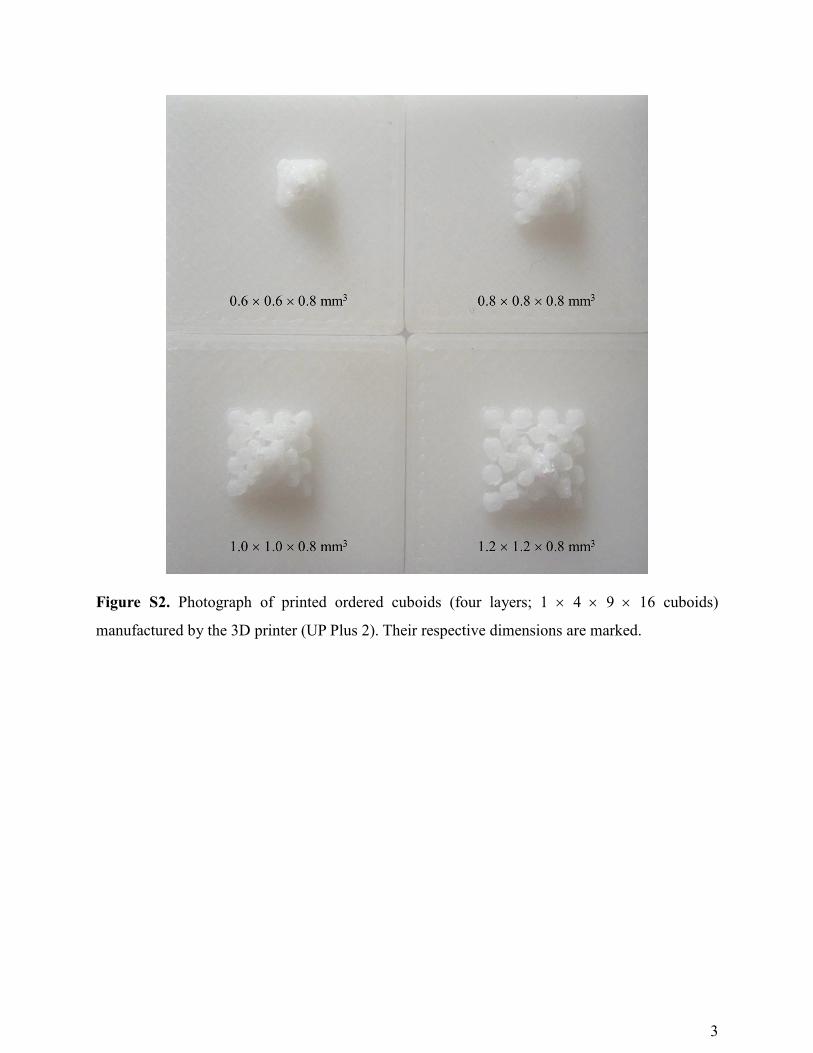
Figure S3. Effects of (A) washing time for removal of residual GA, (B) pH for GA activation,
(C) GA activation time, and (D) coating time for GOx/LOx on the resulting fluorescence
intensities in the proposed enzyme-immobilized derivatization method. Concentrations of
glucose and lactate: 1 mM. Each plotted signal intensity is the difference between those from the
sample containing the analyte and its respective blank sample; all data have been normalized to
their respective maxima for each parameter. Error bars represent standard deviations (n = 4 for
each parameter).
0
20
40
60
80
100
120
0 5 10 15 20
Relative fluorescence intensity, %
Washing time, min
Glucose
Lactate
0
20
40
60
80
100
120
8.5 9 9.5 10 10.5 11 11.5
Relative fluorescence intensity, %
Activation pH
Glucose
0
20
40
60
80
100
120
0 12 24 36
Relative fluoorescence intensity, %
Activation time, h
Glucose
0
20
40
60
80
100
120
0 12 24 36
Relative fluorescence intensity, %
Coating time, h
Glucose
Lactate
(A) (B)
(D) (C)
5
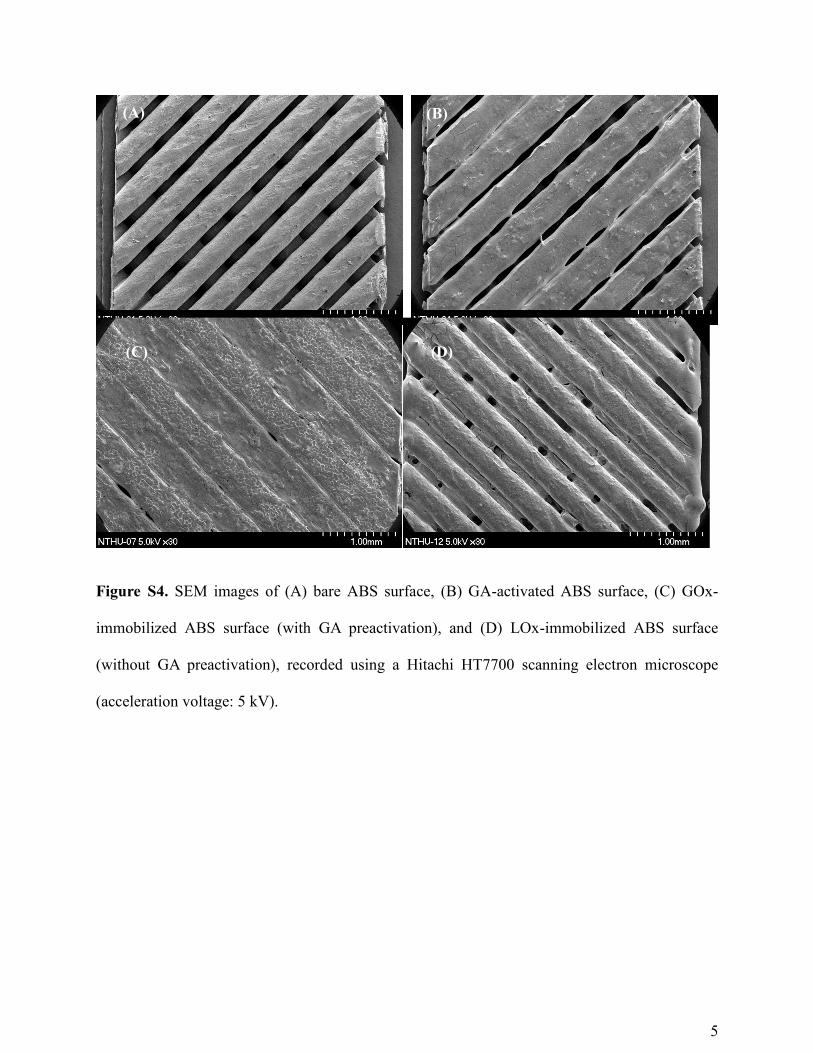
Figure S4. SEM images of (A) bare ABS surface, (B) GA-activated ABS surface, (C) GOx-
immobilized ABS surface (with GA preactivation), and (D) LOx-immobilized ABS surface
(without GA preactivation), recorded using a Hitachi HT7700 scanning electron microscope
(acceleration voltage: 5 kV).
(A) (B)
(C) (D)
6
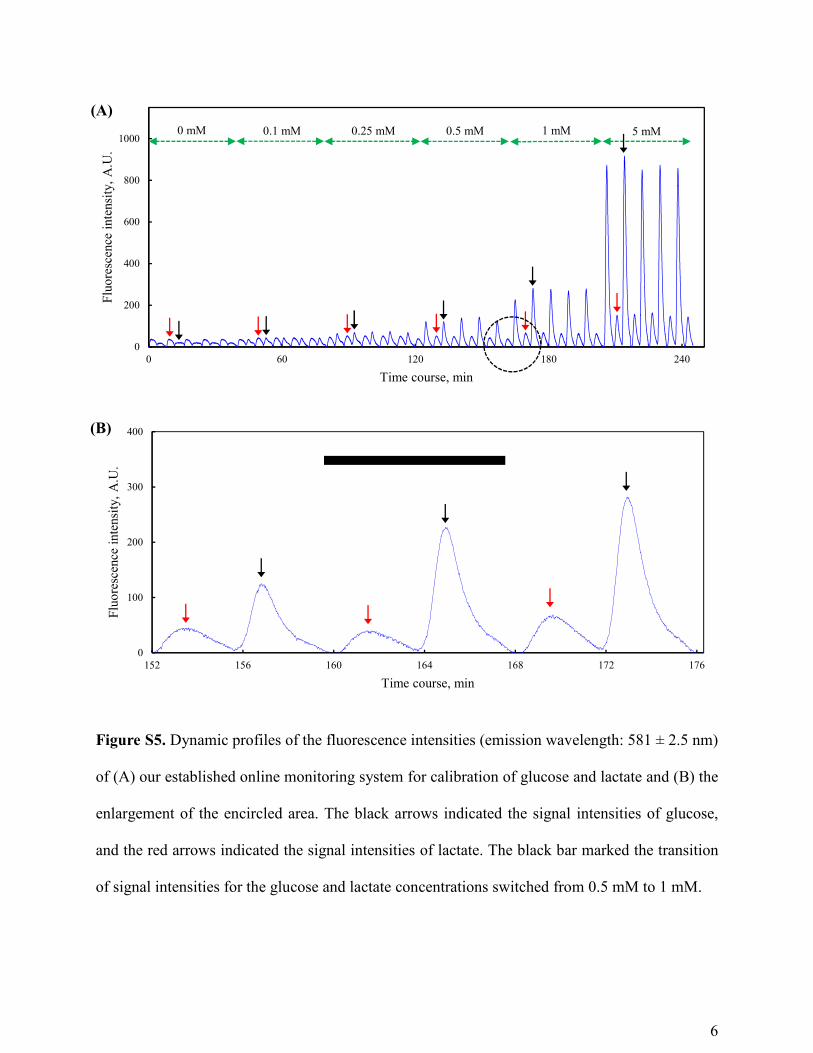
Figure S5. Dynamic profiles of the fluorescence intensities (emission wavelength: 581 ± 2.5 nm)
of (A) our established online monitoring system for calibration of glucose and lactate and (B) the
enlargement of the encircled area. The black arrows indicated the signal intensities of glucose,
and the red arrows indicated the signal intensities of lactate. The black bar marked the transition
of signal intensities for the glucose and lactate concentrations switched from 0.5 mM to 1 mM.
0
200
400
600
800
1000
0 60 120 180 240
Fluorescence intensity, A.U.
Time course, min
0
100
200
300
400
152 156 160 164 168 172 176
Fluorescence intensity, A.U.
Time course, min
0 mM 0.1 mM 0.25 mM 0.5 mM 1 mM 5 mM
(A)
(B)