on-line protein digestion by immobilized enzyme
TRANSCRIPT
On-line protein digestion by immobilized enzyme microreactor
capillary electrophoresis-mass spectrometry
Lorena Villegas*, Roger Pero-Gascon*, Fernando Benavente, José Barbosa, Victoria
Sanz-Nebot
Department of Chemical Engineering and Analytical Chemistry, Institute for Research
on Nutrition and Food Safety (INSA·UB), University of Barcelona, 1-11 Marti i
Franques street, 3rd floor, Barcelona 08028, Spain
Corresponding author: [email protected] (F. Benavente, PhD)
*Both authors contributed equally to this study.
Tel: (+34) 934039778, Fax: (+34) 934021233
KEYWORDS: bottom-up proteomics; capillary electrophoresis; immobilized enzyme;
mass spectrometry; microreactor; on-line digestion
2
ABSTRACT
In this study, we present the use of microreactors packed with immobilized trypsin
particles for the rapid and efficient bottom-up analysis of proteins by on-line
immobilized enzyme microreactor capillary electrophoresis mass spectrometry (IMER-
CE-MS). The results obtained digesting β-lactoglogulin (β-LG) off-line with free
trypsin in solution and with immobilized trypsin particles were taken as a reference for
the optimization of the on-line protein digestion. Under the optimized conditions, on-
line digestion, separation and characterization of the protein digests were possible in
less than 30 min. The limit of detection for complete sequence coverage was around 10
µg mL-1 (~500 µM) of β-LG, the repeatability was comparable to the off-line digestion
methods and the microreactor could be reused until thirty times. The good performance
of IMER-CE-MS was also demonstrated for several other proteins as α-casein (α-CSN),
β-casein (β-CSN), and κ-casein (κ-CSN), as well as for a complex protein mixture (an
Escherichia coli whole cell lysate).
3
1. Introduction
A huge number of studies have been developed to monitor the functions, interactions,
location, and regulation of proteins due to their essential role in most biological
processes and their relationship with many diseases [1]. In proteomics research, peptide
mapping is essential for characterization of the different proteoforms of a certain
protein, including their primary amino acid sequence and their co-translational and post-
translational modifications [2,3]. The bottom-up analysis of proteins by mass
spectrometry (MS) requires the enzymatic digestion of proteins into peptides. Trypsin is
the most typically used proteolytic enzyme due to its specificity, effectiveness, and low
price. This enzyme cleaves proteins at the C-terminal side of lysine and arginine
residues, resulting in peptides of small relative molecular mass (Mr) usually between
500 and 3000 [3]. These peptides are in general detected in MS as singly, doubly or
triply charged ions in positive electrospray ionization mode (ESI+) [4], which facilitates
the most sensitive detection, the fragmentation by MS/MS and the interpretation of the
mass spectra.
Traditionally, the enzymatic digestion with trypsin has been performed in a
homogeneous solution after mixing the free enzyme and the protein solutions. The pH,
the temperature, the enzyme-to-protein ratio and the reaction time can be optimized to
obtain the maximum digestion yield. However, in general, very long times (e.g. 18 h)
are recommended for an appropriate digestion, before separation and characterization
by liquid chromatography mass spectrometry (LC-MS) or capillary electrophoresis
mass spectrometry (CE-MS) [5]. Immobilized enzymes have been alternatively
explored to decrease the sample volume and the total digestion times, minimize the
4
sample handling, improve the digestion yields, as well as to stabilize the enzyme, avoid
its autoproteolysis, simplify its recovery and make it reusable [6]. The possibility of
using an immobilized enzyme microreactor (IMER) coupled on-line to LC-MS or CE-
MS has interesting advantages such as further reducing the sample handling and the
required sample volumes while increasing the analysis throughput [7–10]. Furthermore,
IMER-CE-MS has the additional advantage over the on-line approaches based on LC-
MS that does not require the use of complex instrumental set-ups with valves [9,10].
In the last 25 years, a limited number of scientific articles about the enzymatic digestion
of proteins by IMER-CE have been published, probably due to the instrumental and
methodological difficulties of the on-line coupling and the limited applicability of the
methods without on-line MS detection [7]. Most of the applications were based on open
tubular microreactors with immobilized trypsin on the inner capillary surface [11–19]
and only a few were reported with monolithic [20,21], particle packed [8,22,23] or sol-
gel [24,25] microreactors. Since the pioneering studies of Amankwa et al. [11–13], the
use of open tubular microreactors has been proposed by other research groups [14–19].
However, now is widely accepted that digestion yields with these microreactors are in
general low because of the scarce interaction between the protein and the immobilized
trypsin within the very short time of the on-line digestion [7,8]. Monolithic, sol-gel and
particle packed supports with immobilized trypsin were developed to increment the
digestion yield due to the extended active surface areas and the reduced distances
between the protein and the immobilized enzyme [8,20–25]. Nowadays, preparation of
monoliths with immobilized trypsin requires rather challenging, specialized and long
and tedious synthesis procedures to obtain reproducible results [7]. In contrast, a wide
range of activated particle supports ready to immobilize trypsin or with immobilized
5
trypsin are commercially available [8,22,23]. These immobilized trypsin particles can
be simply and reproducibly packed in the on-line microreactors for IMER-CE-MS.
Unfortunately, the number of studies describing completely on-line IMER-CE-MS are
rather scarce, and all of them are using open tubular IMERs [14,17,18]. Recently, Liu et
al. described a novel method with packed IMERs using commercial silica particles with
immobilized trypsin for the on-line digestion of proteins by IMER-CE with UV and
fluorescence detection, and fractions were collected to be analyzed by MS [8]. In this
study, we use commercial cellulose resin particles with immobilized trypsin for the
packed IMERs and we develop a completely on-line IMER-CE-MS method for the
bottom-up analysis of standard proteins (e.g. β-lactoglobulin (β-LG), α-casein (α-CSN),
β-casein (β-CSN) and κ-casein, (κ-CSN)) and complex protein mixtures (e.g. an
Escherichia coli whole cell lysate). The performance of the on-line protein digestion is
compared with the off-line digestion using free trypsin and immobilized trypsin to
demonstrate the potential of the novel method, and expand the applicability of IMER-
CE-MS.
2. Materials and methods
2.1. Chemicals and reagents
All the chemicals used in the preparation of the background electrolyte (BGE) and the
rest of solutions were of analytical reagent grade or better. Water (LC-MS grade),
ammonium acetate (NH4Ac, ≥99.9%), ammonium bicarbonate (LC-MS grade), DL-
dithiothreitol (DTT, ≥99.0%) and iodoacetamide (IAA, ≥98.0%) were purchased from
Sigma-Aldrich (St. Louis, MO, USA). Acetic acid (HAc, glacial), formic acid (HFor,
99.0%), ammonia (25%) and sodium hydroxide (≥99.0%) were supplied by Merck
(Darmstadt, Germany). Iodoacetamide (IAA, ≥98.0%) was provided by Fluka (Buchs,
6
Switzerland). Acetonitrile (≥99.9%) was purchased from Panreac (Castellar del Vallès,
Spain). 2-propanol (≥99.9%) was supplied by Scharlau (Sentmenat, Spain).
Free trypsin (sequencing grade modified trypsin) and particles with immobilized trypsin
(immobilized trypsin) were provided by Promega (Madison, Wisconsin, USA). β-LG
(~90%, PAGE), α-CSN (>70%), β-CSN (>90%) and κ-CSN (≥80%) were purchased
from Sigma-Aldrich. An Escherichia coli cell lysate (E. coli positive control whole cell
lysate – expressing 6X His tag protein) was supplied by Abcam (Cambridge, UK).
2.2. Electrolyte solutions, sheath liquid, protein standards and samples.
The BGE for the CE-MS separation was a solution of 50 mM HAc : 50 mM HFor (pH
2.3) and was filtered through a 0.22 µm nylon filter (MSI, Westboro, MA, USA). The
sheath liquid solution consisted of a mixture of 60:40 (v/v) 2-propanol:water with
0.05% (v/v) of HFor. The sheath liquid and the BGE were degassed for 10 min by
sonication before use.
An aqueous standard solution (2000 µg mL-1) of each model protein (β-LG, α-CSN, β-
CSN and κ-CSN) was prepared and aliquoted into 50 µL portions. These aliquots (100
µg protein each) were dried at 37 ºC and stored in a freezer at -20 ºC when not in use.
The E. coli cell lysate was a lyophilized pellet that contained 250 µg of protein and was
dissolved in 125 µL of 50 mM NH4HCO3 (2000 µg mL-1 of protein). Excipients of low
Mr were removed by passage through a 10,000 Mr cut-off cellulose acetate centrifugal
filters (Millipore Microcon Ultracel PL, Merck). The sample (25 µL) was centrifuged at
25 ºC for 7 min at 11,300 x g and the residue was washed three times for 7 min in the
7
same way, with 50 µL of digestion buffer. Under the optimized conditions, the digestion
buffer was 50 mM NH4HCO3, pH = 7.9 for the off-line digestions and 10 mM
NH4HCO3, pH = 7.9 for the on-line digestion. The final residue was recovered by
placing the filter upside down in a new vial and centrifuging once more at a reduced
centrifugal force (2 min at 700 x g). Sufficient digestion buffer was added to the vial to
adjust the final volume to 50 µL (1000 µg mL-1). Filtered samples were stored in the
fridge at 4 ºC when not in use.
2.3. Apparatus and procedures
pH measurements were made with a Crison 2002 potentiometer and a Crison electrode
52-03 (Crison Instruments, Barcelona, Spain). Protein stock aliquots were dried in a
Savant™ SPD111V SpeedVac™ (Thermo Fisher Scientific, Waltham, MA, USA).
Centrifugal filtration was carried out in a Mikro 20 centrifuge (Hettich Zentrifugen,
Tuttlingen, Germany). Agitation was performed with a Vortex Genius 3 (Ika®, Staufen,
Germany). Digestion mixtures were incubated in a Thermo-Shaker TS-100 (Biosan,
Riga, Latvia) at controlled temperature.
All CE-MS experiments were performed in a 7100 CE system coupled with an
orthogonal G1603 sheath-flow interface to a 6220 oa-TOF LC/MS spectrometer
(Agilent Technologies, Waldbronn, Germany). The sheath liquid was delivered at a
flow rate of 3.3 µL min-1 by a KD Scientific 100 series infusion pump (Holliston, MA,
USA). The TOF mass spectrometer was operated under optimized conditions in positive
mode using the following parameters: capillary voltage 4000 V, drying temperature 200
ºC, drying gas flow rate 2.9 L min-1, nebulizer gas 7 psig, fragmentor voltage 190 V,
skimmer voltage 60 V, OCT 1 RF Vpp voltage 300 V. Chemstation and MassHunter
8
softwares (Agilent Technologies) were used for CE and TOF mass spectrometer
control, data acquisition and integration. Data were collected in profile at 1 spectrum/s
between 100 and 3200 m/z, with the mass range set to high resolution mode (4 GHz).
2.4. Off-line digestion with free and immobilized trypsin and CE-MS
The off-line digestion with trypsin in solution was conducted following the procedures
described elsewhere [5,26]. A dried stock aliquot of β-LG was reconstituted with 100
µL of digestion buffer (50 mM NH4HCO3 under the optimised conditions) and was
reduced adding 2.5 µL of 0.5 M DTT in digestion buffer (1000 µg mL-1 of β-LG, i.e.
~50 µM). The mixture was incubated with agitation at 56 ºC for 30 min and let it cool
down to room temperature. Then, the reduced protein was alkylated adding 7 µL of a
0.73 M IAA solution in digestion buffer (30 min at room temperature with agitation in
the dark). To remove the excess of DDT and IAA, the mixture was filtered using 10,000
Mr cut-off centrifugal filters at 25 ºC. First, the filters were washed with 100 µL of the
digestion buffer and centrifuged for 10 min at 11,300 x g. Then, the sample was added
and centrifuged (10 min at 11,300 x g). Finally, the sample was washed three times with
100 µL of digestion buffer (10 min at 11,300 x g). The final residue was recovered by
placing the filter upside down in a new vial and centrifuging at a reduced centrifugal
force (2 min at 700 x g). Sufficient digestion buffer was added to the vial to adjust the
final volume to 100 µL (1000 µg mL-1 of β-LG). Trypsin (2.5 µL at 1000 µg mL-1) was
added to the protein sample and the mixture was vortexed and incubated with agitation
at 37 ºC for 18 h. The reaction was stopped by heating the mixture for 10 min at 100 ºC.
The protein digests were dried at 37 ºC and stored in a freezer at -20 ºC when not in use.
Before the digestion, the E. coli cell lysate solution in digestion buffer (50 µL, 1000 µg
9
mL-1 of protein) was reduced and alkylated as β-LG adding 1.25 µL of 0.5 M DTT in
digestion buffer and 3.5 µL of IAA 0.73 M.
The off-line enzymatic digestion procedure with immobilized trypsin was performed
following the manufacturer instructions [27]. β-LG (1000 µg mL-1) was reduced and
alkylated as explained above in digestion buffer (10 mM NH4HCO3 under the optimized
conditions) and dried at 37 ºC before use. First, 5 µL of digestion buffer were added to
the dried reduced and alkylated protein. After that, 16 µL of acetonitrile and 19 µL of
digestion buffer were added to prepare the final protein sample. A spin column was
placed in a 1.5 mL centrifuge tube and 200 µL of the suspension with the immobilized
trypsin resin were added. Then, the liquid was separated from the resin by
centrifugation at 25 ºC, and the resin was washed three times with 200 µL of the
digestion buffer (5 s at 300 x g in all cases). The spin column was placed in a clean 1.5
mL tube, the protein sample was added, and it was incubated without agitation at room
temperature for 30 minutes. Then, 100 µL of the digestion buffer were added to recover
the peptides by centrifugation at 25 ºC (5 s at 300 x g). This last step was repeated three
times. The protein digests were dried at 37 ºC and stored in a freezer at -20 ºC when not
in use. The dried protein digests were reconstituted with 100 µL of digestion buffer
before the analysis (1000 µg mL-1 of β-LG). To study the reusability of the immobilized
trypsin resin, the spin column was washed four times with 100 µL of the digestion
buffer between digestions to prevent carry-over effects. Otherwise, the resin was
discarded.
Fused silica capillaries (72 cm total length (LT) x 75 µm internal diameter (id) x 365 µm
outer diameter (od)) were supplied by Polymicro Technologies (Phoenix, AZ, USA) and
10
were activated flushing at 930 mbar with water (5 min), 1 M NaOH (15 min), water (15
min) and BGE (50 mM HAc : 50 mM HFor, pH = 2.3, 10 min). Activation was
performed off-line to avoid mass spectrometer contamination. Before CE-MS analysis,
capillaries were conditioned flushing with water (1 min), 1 M HAc (3 min), water (1
min) and BGE (5 min). Samples were hydrodynamically injected at 50 mbar for 15 s
(~80 nL with the Hagen-Poiseuille equation [28]) and the separation was carried out at
25 ºC or 37 ºC applying 25 kV during 30 min. The analyses were performed in
triplicate.
2.5. On-line IMER-CE-MS
The on-line enzymatic digestion was performed in an IMER (0.7 cm LT x 250 µm id x
365 µm od fused silica capillary) that was inserted at 7.5 cm of the beginning of an
activated separation capillary (72 cm LT x 75 µm id x 365 µm od fused silica capillary)
[29]. The IMER preparation was very simple. First, a polymeric frit was placed at the
beginning of the microreactor and this side was connected to a 7.5 cm separation
capillary using a plastic sleeve. Second, the microreactor was filled with the
immobilized enzyme resin applying vacuum during 10 s. The packing was checked
under an optical microscope (100x) and the procedure was repeated until the
microcartridge was completely packed. Then, another polymeric frit was introduced at
the end of the microreactor that was finally connected to a 64.5 cm separation capillary
using another plastic sleeve. The IMER-CE capillary was checked for abnormal flow
restriction, flushing with water and BGE with a syringe, and applying the separation
voltage for 15 min (25 kV).
11
Under the optimized conditions, IMER-CE capillaries were conditioned flushing with
BGE (50 mM HAc : 50 mM HFor, pH = 2.3) for 2 min. Two plugs of digestion buffer
(10 mM NH4HCO3 under the optimized conditions) were injected at 50 mbar for 8 s
(~40 nL, i.e. ~1 cm) before and after the protein sample, which was injected at 50 mbar
for 15 s (~80 nL, i.e. ~2 cm). Then, the BGE was introduced at 5 mbar for 600 s (~325
nL, i.e. ~7 cm) to ensure that the sample plug passed through the microreactor giving
enough time for the protein digestion. Finally, 25 kV were applied for the separation.
Between the analyses, the capillary was flushed with BGE (5 min) and water (5 min).
The analyses were performed in triplicate.
β-LG, α-CSN, β-CSN and κ-CSN (1000 µg mL-1 all; i.e. ~50, ~40, ~40 and ~50 µM,
respectively) and the E. coli cell lysate (1000 µg mL-1 of protein) were analyzed by on-
line IMER-CE-MS. Before the on-line digestion, β-LG, κ-CSN and the E. coli cell
lysate were reduced and alkylated as explained in Section 2.4. α-CSN and β-CSN dried
stock aliquots were reconstituted directly with the digestion buffer, because no disulfide
bonds were present.
3. Results and discussion
3.1. Off-line digestion with trypsin in solution and CE-MS
Protein digestion with trypsin has been traditionally conducted in solution using free
trypsin and long digestion times (18 h) at 37 ºC and pH around 8 to ensure efficient
and reproducible digestions [3,5,26]. The use of a digestion buffer of 50 mM
NH4HCO3, at pH 7.9 has been widely described in the literature [5]. In this study, as an
alternative, we also tested digestion buffers of 10 mM NH4HCO3 and 10 mM NH4Ac at
pH 7.9, because low ionic strength buffers are more recommendable for the analysis of
12
protein digests by CE-MS and IMER-CE-MS. Furthermore, we also evaluated the
influence on peptide sensitivity of the separation temperature in CE-MS and on the
digestion yield of the digestion time, because later the on-line digestion and the
separation by IMER-CE-MS were performed at the same temperature, and digestion
was produced in a very short time.
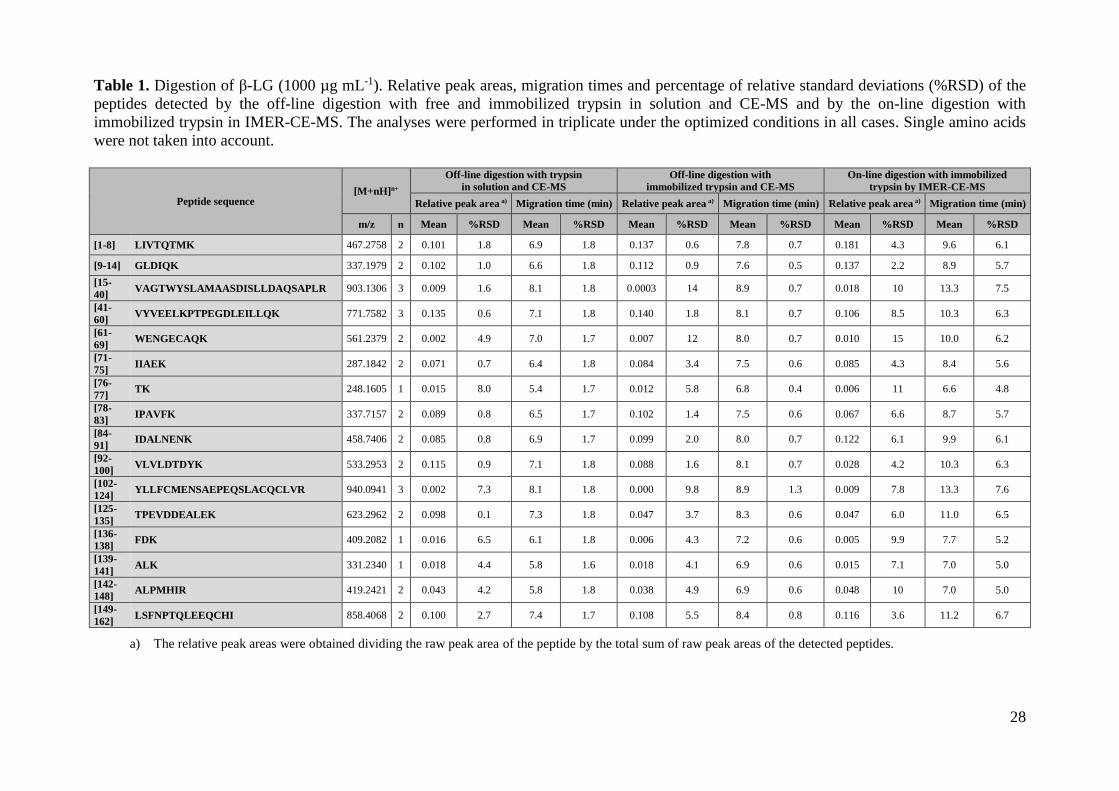
Table 1 shows the sequence and the mass-to-charge (m/z) ratio of the molecular ions of
the peptides detected by CE-MS for β-LG (1000 µg mL-1). β-LG was chosen as a model
protein due to its low Mr (~19,900) and structural simplicity, even though the presence
of disulfide bonds that needed reduction and alkylation for an efficient digestion. At this
protein concentration, all the expected peptides after tryptic digestion were detected by
CE-MS (sequence coverage was 100%, calculated considering the number of amino
acids detected from the peptide sequence). Table 1 also shows the relative peak area and
the migration time values, as well as the percentages of relative standard deviation
(%RSD, n=3), for the CE-MS separation at 37 ºC, with a 50 mM NH4HCO3 digestion
buffer and 18 h of digestion time. As can be observed, repeatability was good, ranging
between 0.1-8.0% and 1.6-1.8% for peak areas and migration times, respectively. These
values agreed with the values obtained by CE-MS for peptide digests in previous studies
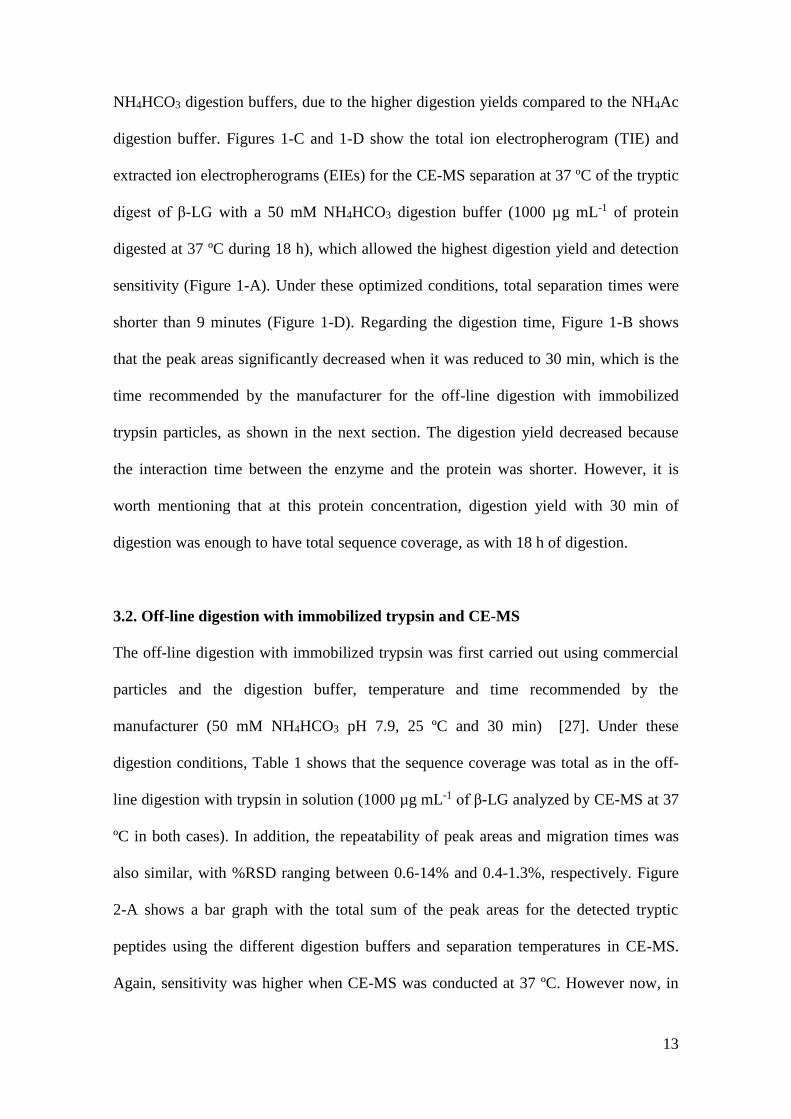
[30]. To easily compare the results with the different digestion buffers, separation
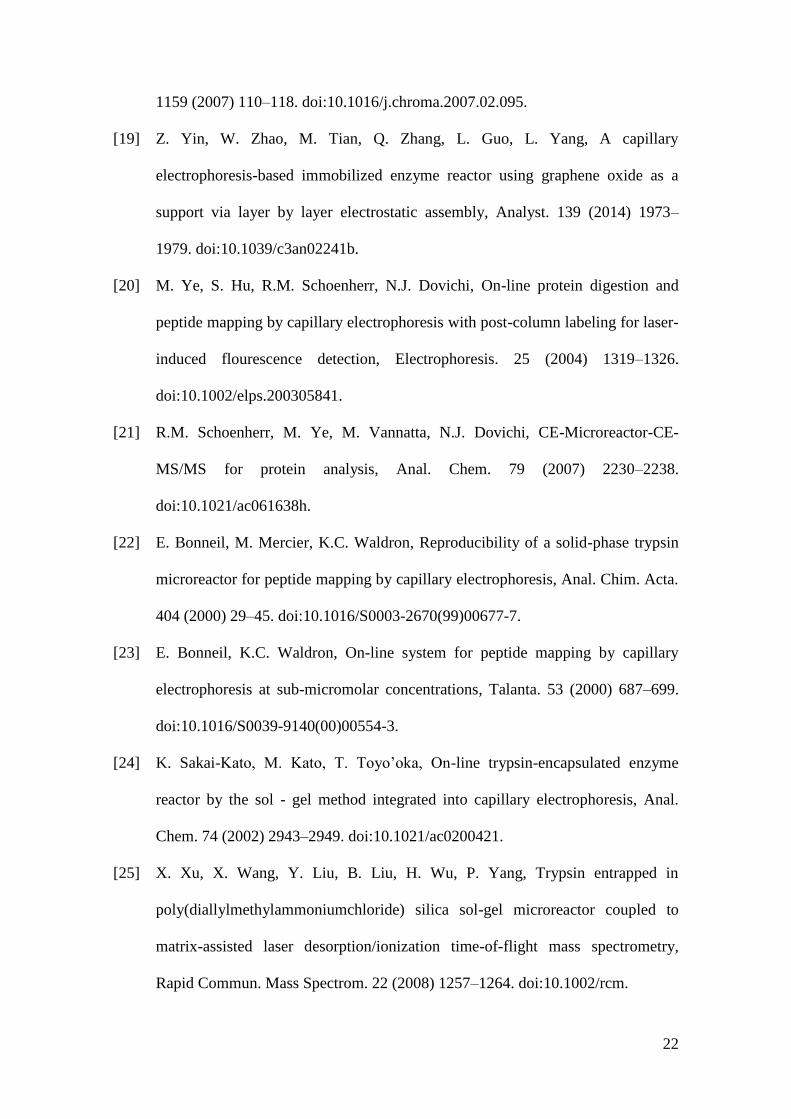
temperatures and digestion times, Figure 1 shows two bar graphs with the total sum of
the peak areas for the detected tryptic peptides in the different conditions. As can be
observed in Figure 1-A, at 18 h of digestion, sensitivity was higher when separation by
CE-MS was conducted at 37 ºC. At higher separation temperatures, the peaks were
narrower and the migration times were shorter due the lower viscosity of the BGE,
improving ionization efficiency and peak areas. In addition, peak areas were higher with
13
NH4HCO3 digestion buffers, due to the higher digestion yields compared to the NH4Ac
digestion buffer. Figures 1-C and 1-D show the total ion electropherogram (TIE) and
extracted ion electropherograms (EIEs) for the CE-MS separation at 37 ºC of the tryptic
digest of β-LG with a 50 mM NH4HCO3 digestion buffer (1000 µg mL-1 of protein
digested at 37 ºC during 18 h), which allowed the highest digestion yield and detection
sensitivity (Figure 1-A). Under these optimized conditions, total separation times were
shorter than 9 minutes (Figure 1-D). Regarding the digestion time, Figure 1-B shows
that the peak areas significantly decreased when it was reduced to 30 min, which is the
time recommended by the manufacturer for the off-line digestion with immobilized
trypsin particles, as shown in the next section. The digestion yield decreased because
the interaction time between the enzyme and the protein was shorter. However, it is
worth mentioning that at this protein concentration, digestion yield with 30 min of
digestion was enough to have total sequence coverage, as with 18 h of digestion.
3.2. Off-line digestion with immobilized trypsin and CE-MS
The off-line digestion with immobilized trypsin was first carried out using commercial
particles and the digestion buffer, temperature and time recommended by the
manufacturer (50 mM NH4HCO3 pH 7.9, 25 ºC and 30 min) [27]. Under these
digestion conditions, Table 1 shows that the sequence coverage was total as in the off-
line digestion with trypsin in solution (1000 µg mL-1 of β-LG analyzed by CE-MS at 37
ºC in both cases). In addition, the repeatability of peak areas and migration times was
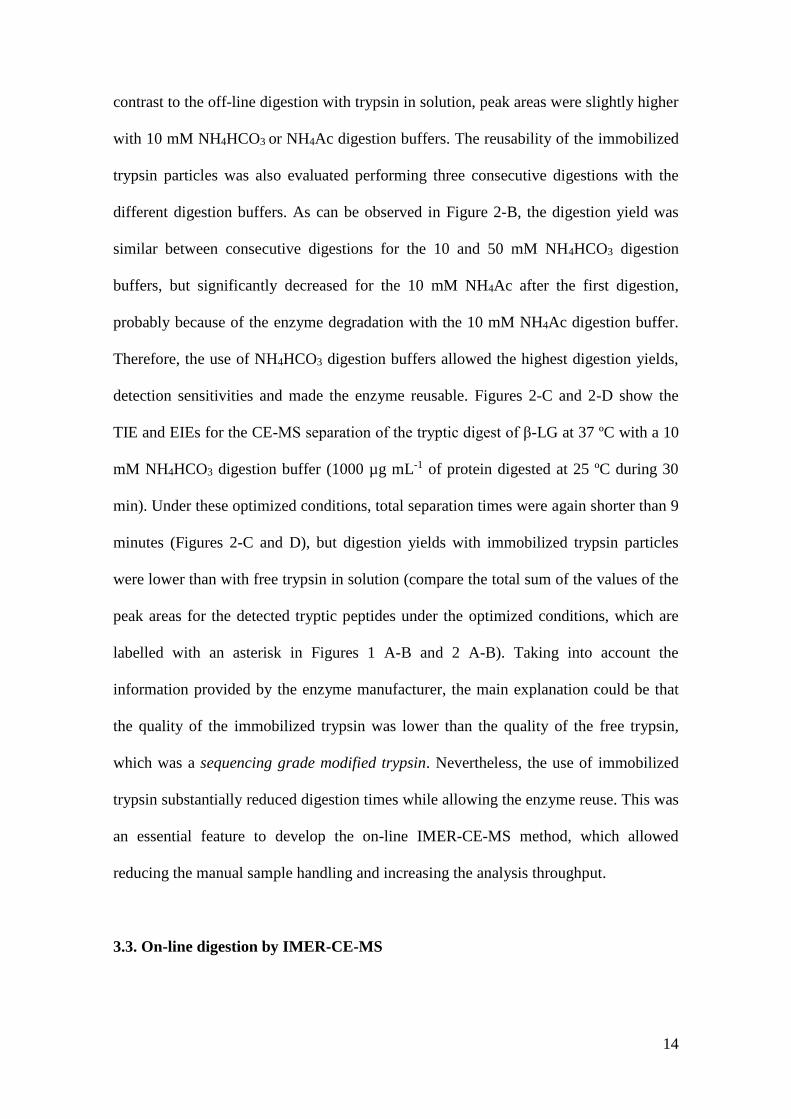
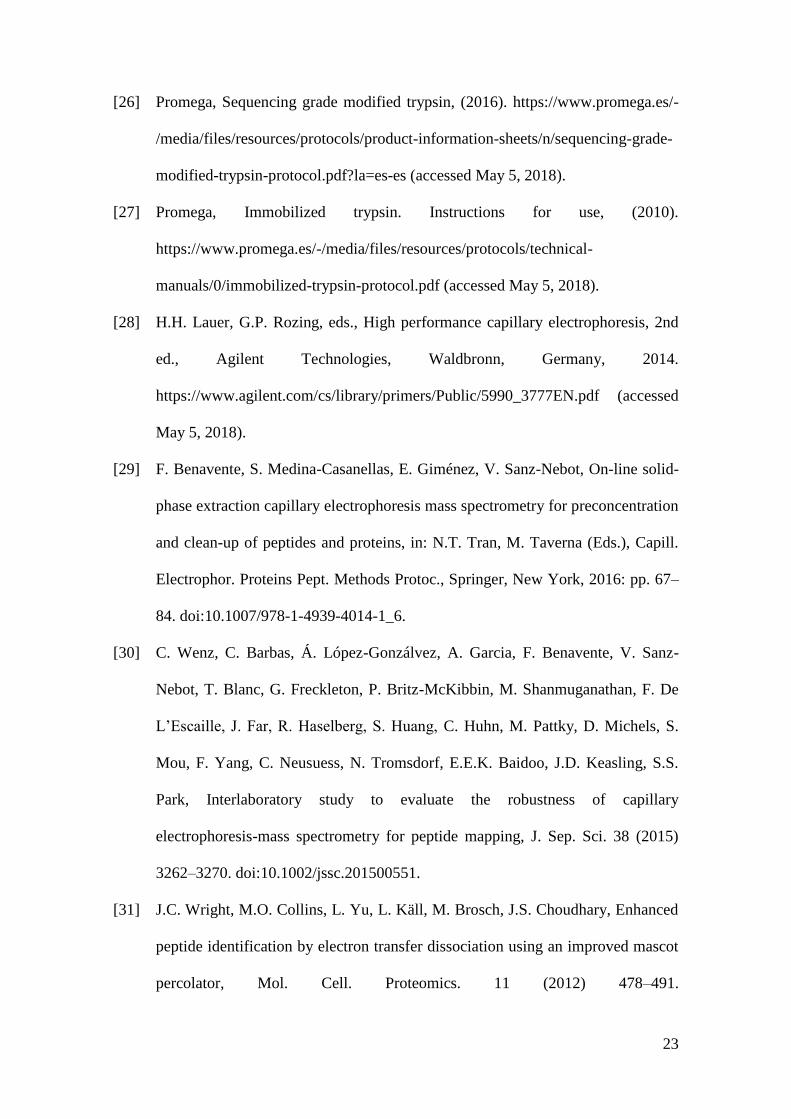
also similar, with %RSD ranging between 0.6-14% and 0.4-1.3%, respectively. Figure
2-A shows a bar graph with the total sum of the peak areas for the detected tryptic
peptides using the different digestion buffers and separation temperatures in CE-MS.
Again, sensitivity was higher when CE-MS was conducted at 37 ºC. However now, in
14
contrast to the off-line digestion with trypsin in solution, peak areas were slightly higher
with 10 mM NH4HCO3 or NH4Ac digestion buffers. The reusability of the immobilized
trypsin particles was also evaluated performing three consecutive digestions with the
different digestion buffers. As can be observed in Figure 2-B, the digestion yield was
similar between consecutive digestions for the 10 and 50 mM NH4HCO3 digestion
buffers, but significantly decreased for the 10 mM NH4Ac after the first digestion,
probably because of the enzyme degradation with the 10 mM NH4Ac digestion buffer.
Therefore, the use of NH4HCO3 digestion buffers allowed the highest digestion yields,
detection sensitivities and made the enzyme reusable. Figures 2-C and 2-D show the
TIE and EIEs for the CE-MS separation of the tryptic digest of β-LG at 37 ºC with a 10
mM NH4HCO3 digestion buffer (1000 µg mL-1 of protein digested at 25 ºC during 30
min). Under these optimized conditions, total separation times were again shorter than 9
minutes (Figures 2-C and D), but digestion yields with immobilized trypsin particles
were lower than with free trypsin in solution (compare the total sum of the values of the
peak areas for the detected tryptic peptides under the optimized conditions, which are
labelled with an asterisk in Figures 1 A-B and 2 A-B). Taking into account the
information provided by the enzyme manufacturer, the main explanation could be that
the quality of the immobilized trypsin was lower than the quality of the free trypsin,
which was a sequencing grade modified trypsin. Nevertheless, the use of immobilized
trypsin substantially reduced digestion times while allowing the enzyme reuse. This was
an essential feature to develop the on-line IMER-CE-MS method, which allowed
reducing the manual sample handling and increasing the analysis throughput.
3.3. On-line digestion by IMER-CE-MS
15
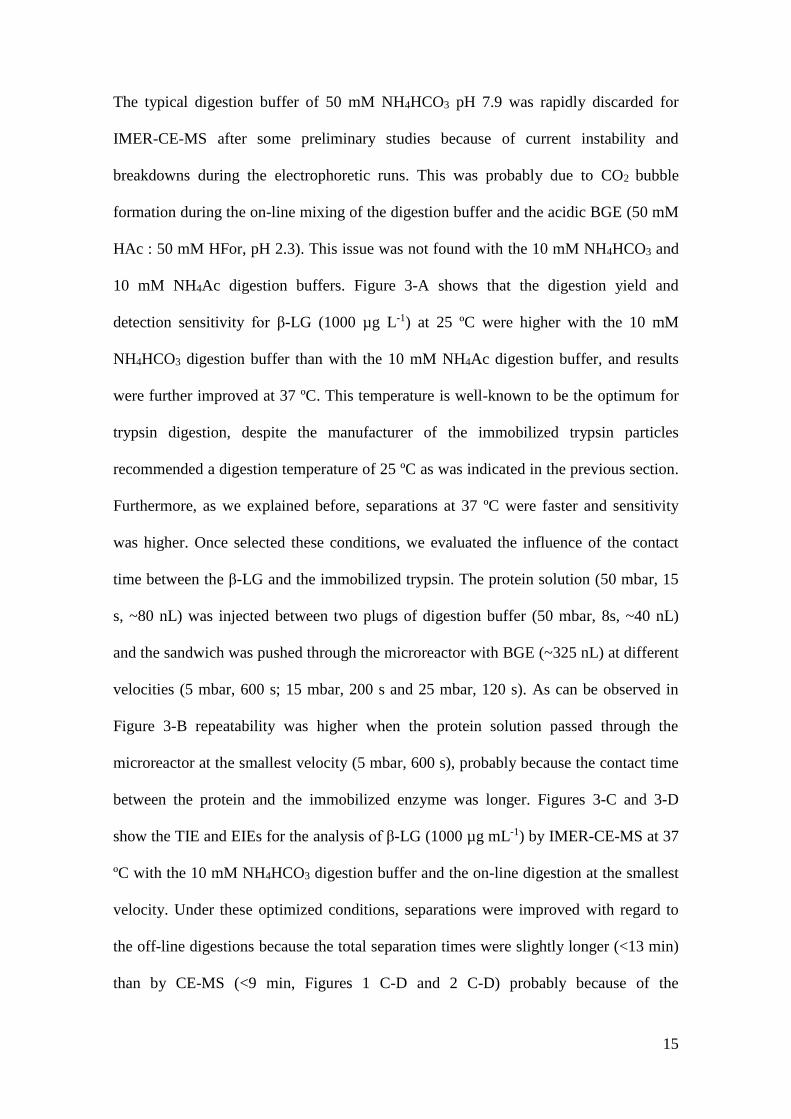
The typical digestion buffer of 50 mM NH4HCO3 pH 7.9 was rapidly discarded for
IMER-CE-MS after some preliminary studies because of current instability and
breakdowns during the electrophoretic runs. This was probably due to CO2 bubble
formation during the on-line mixing of the digestion buffer and the acidic BGE (50 mM
HAc : 50 mM HFor, pH 2.3). This issue was not found with the 10 mM NH4HCO3 and
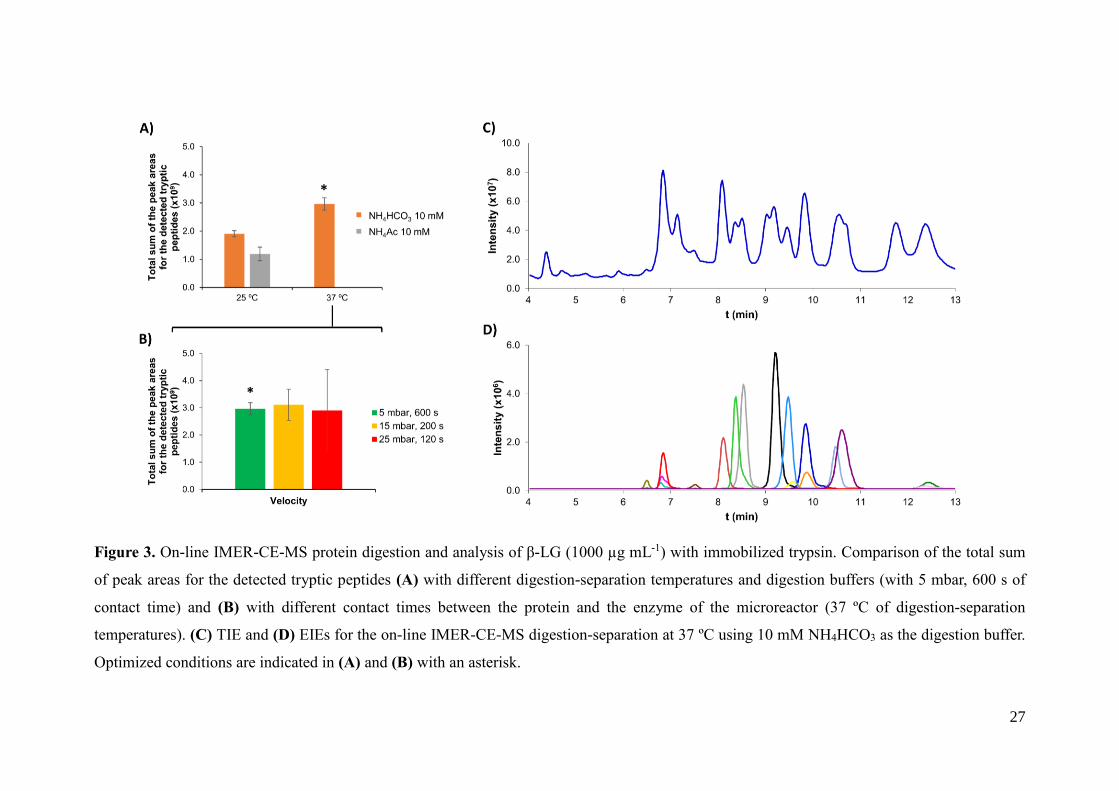
10 mM NH4Ac digestion buffers. Figure 3-A shows that the digestion yield and
detection sensitivity for β-LG (1000 µg L-1) at 25 ºC were higher with the 10 mM
NH4HCO3 digestion buffer than with the 10 mM NH4Ac digestion buffer, and results
were further improved at 37 ºC. This temperature is well-known to be the optimum for
trypsin digestion, despite the manufacturer of the immobilized trypsin particles
recommended a digestion temperature of 25 ºC as was indicated in the previous section.
Furthermore, as we explained before, separations at 37 ºC were faster and sensitivity
was higher. Once selected these conditions, we evaluated the influence of the contact
time between the β-LG and the immobilized trypsin. The protein solution (50 mbar, 15
s, ~80 nL) was injected between two plugs of digestion buffer (50 mbar, 8s, ~40 nL)
and the sandwich was pushed through the microreactor with BGE (~325 nL) at different
velocities (5 mbar, 600 s; 15 mbar, 200 s and 25 mbar, 120 s). As can be observed in
Figure 3-B repeatability was higher when the protein solution passed through the
microreactor at the smallest velocity (5 mbar, 600 s), probably because the contact time
between the protein and the immobilized enzyme was longer. Figures 3-C and 3-D
show the TIE and EIEs for the analysis of β-LG (1000 µg mL-1) by IMER-CE-MS at 37
ºC with the 10 mM NH4HCO3 digestion buffer and the on-line digestion at the smallest
velocity. Under these optimized conditions, separations were improved with regard to
the off-line digestions because the total separation times were slightly longer (<13 min)
than by CE-MS (<9 min, Figures 1 C-D and 2 C-D) probably because of the
16
backpressure promoted by the presence of the microreactor. Furthermore, digestion
yields were comparable, but slightly lower, than in the off-line digestion with
immobilized trypsin (compare the total sum of the values of the peak areas for the
detected tryptic peptides under the optimized conditions, which are labelled with an
asterisk in Figures 2 A-B and 3 A-B). This was probably due to the reduced contact
time between the protein and the enzyme and the lower amount of protein. Digestion
velocity could not be further reduced, because 5 mbar was the smallest pressure that can
be applied by the CE instrument. With regard to the amount of protein, the injected
volume of protein solution was increased, from 80 nL (50 mbar, 15 s) to 160 nL (50
mbar, 30 s) but results did not significantly improved. Under the optimized conditions,
Table 1 shows that %RSD for peak areas and migration times ranged between 2.2-15
and 4.8-7.6%, respectively. Therefore, repeatabilities in peak areas and migration times
were only slightly lower than for the off-line digestions (Table 1). With regard to the
sequence coverage, it was found to be total until a concentration of around 10 µg mL-1
of β-LG, which was considered as the limit of detection (at 5 µg mL-1 of protein the
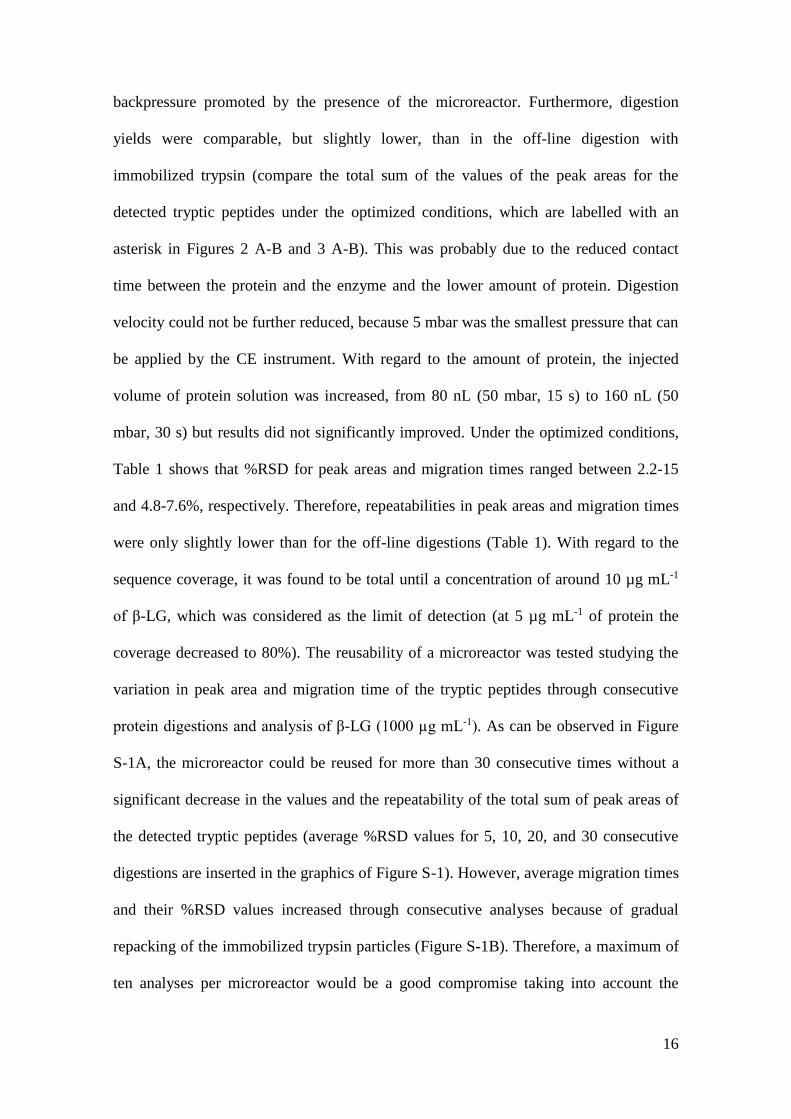
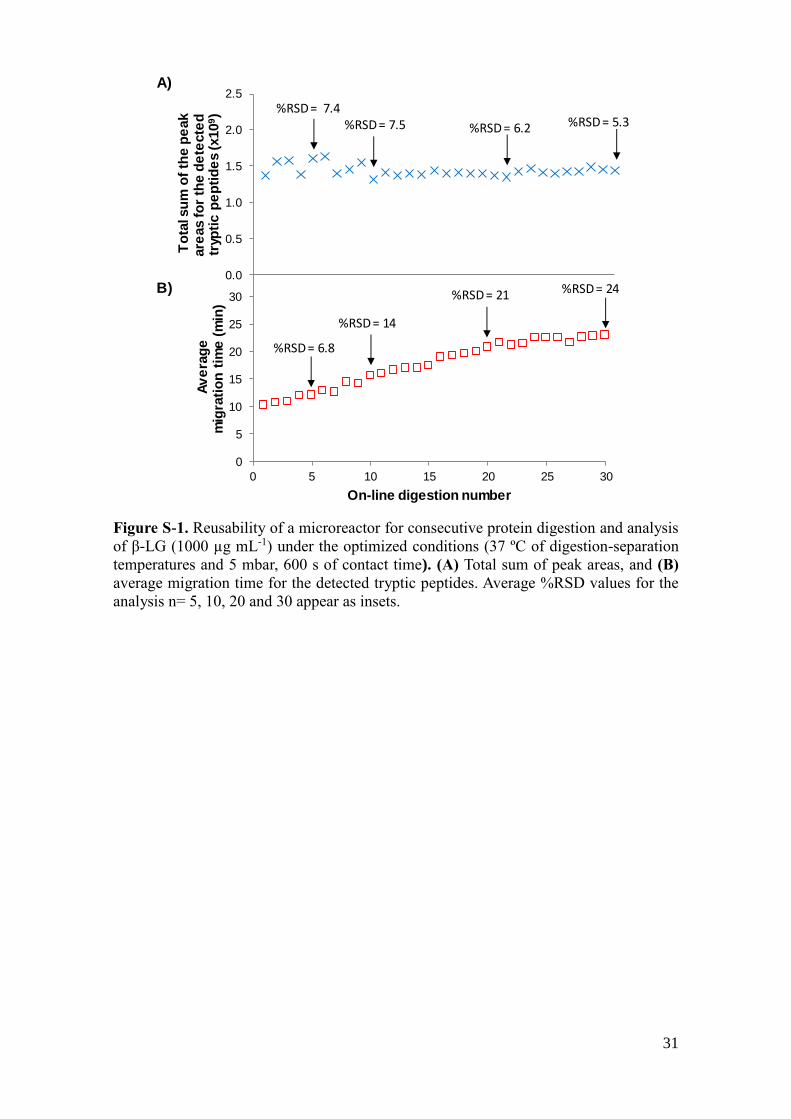
coverage decreased to 80%). The reusability of a microreactor was tested studying the
variation in peak area and migration time of the tryptic peptides through consecutive
protein digestions and analysis of β-LG (1000 µg mL-1). As can be observed in Figure
S-1A, the microreactor could be reused for more than 30 consecutive times without a
significant decrease in the values and the repeatability of the total sum of peak areas of
the detected tryptic peptides (average %RSD values for 5, 10, 20, and 30 consecutive
digestions are inserted in the graphics of Figure S-1). However, average migration times
and their %RSD values increased through consecutive analyses because of gradual
repacking of the immobilized trypsin particles (Figure S-1B). Therefore, a maximum of
ten analyses per microreactor would be a good compromise taking into account the
17
overall performance of the system. No carry-over effect was observed when blank
samples were analyzed between consecutive digestions.
To validate the IMER-CE-MS method, α-CSN (a mixture of α-CSN1 and α-CSN2), β-
CSN and κ-CSN were also analyzed (1000 µg mL-1 of protein), and results in terms of
repeatability and sequence coverage were similar as for β-LG (1000 µg mL-1 of
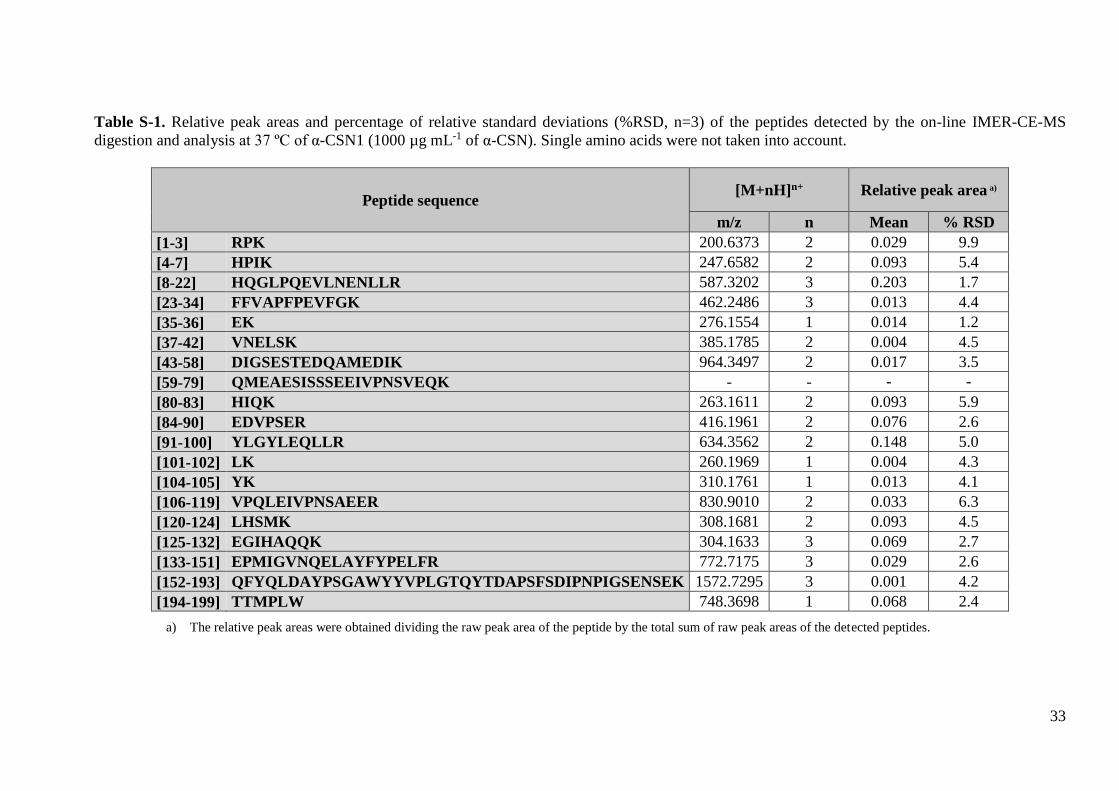
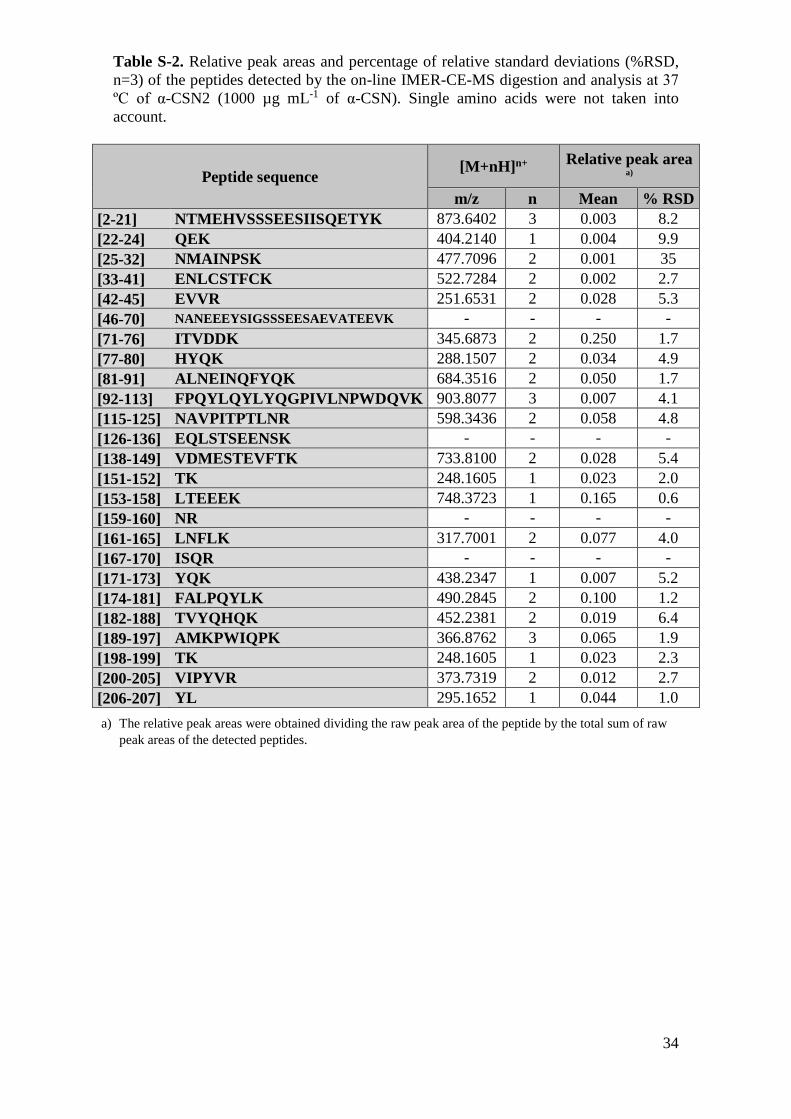
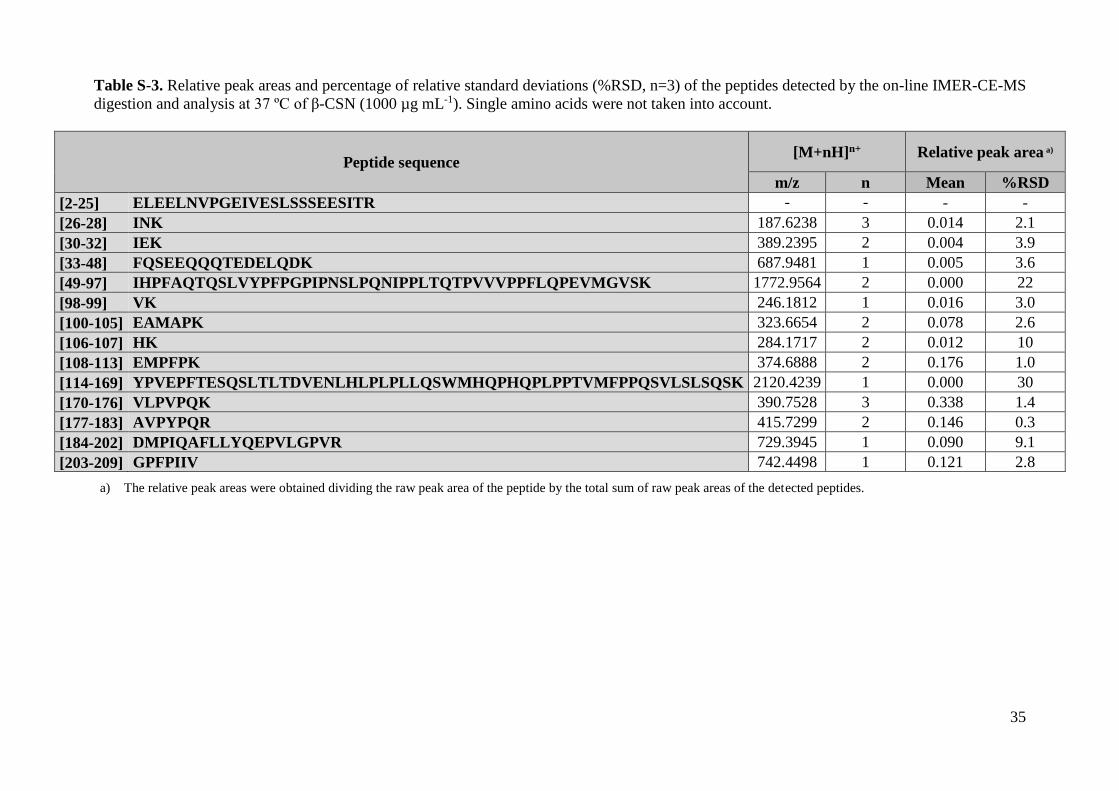
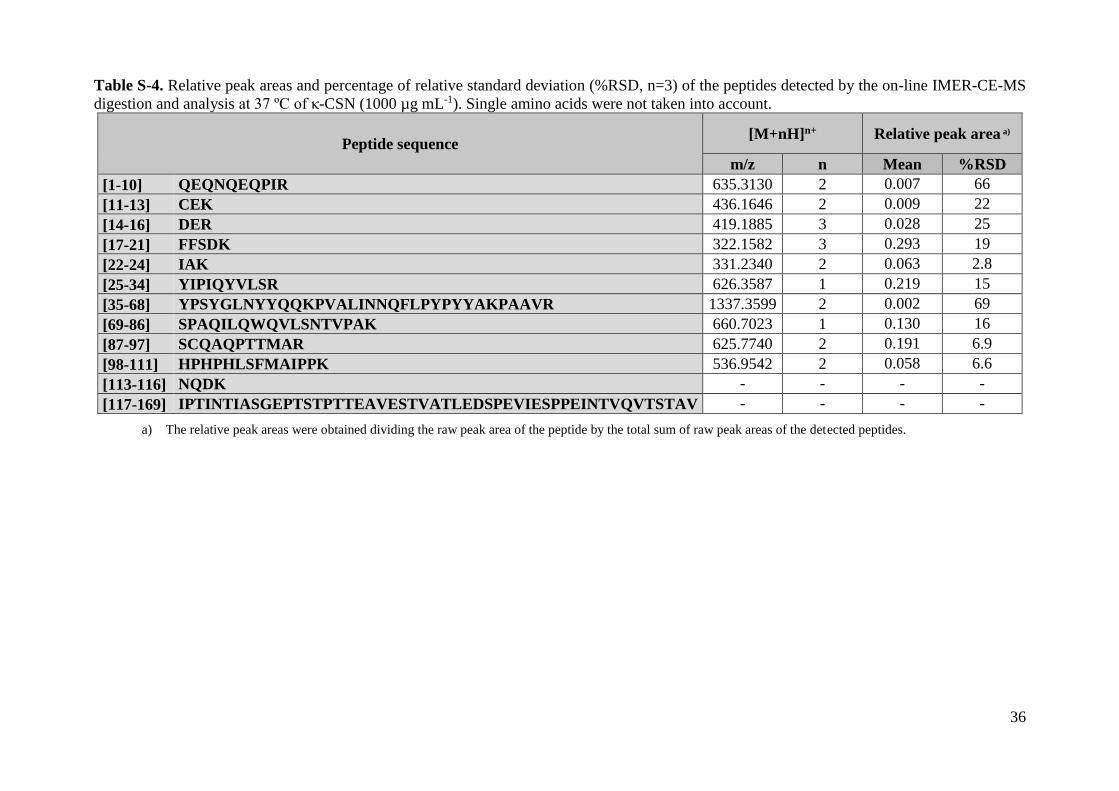
protein). Supplementary Tables S-1, S-2, S-3 and S-4 show the %RSD (n=3) for peak
areas of the peptides detected by IMER-CE-MS for the different proteins. At this
protein concentration, sequence coverages were 89%, 79%, 88% and 66% for α-CSN1,
α-CSN2, β-CSN and κ-CSN, respectively. In α-CSN, the sequence coverage for α-
CSN2 was lower because this proteoform was at lower abundance in the mixture.
Among all the proteins, the sequence coverage was the lowest for κ-CSN because a high
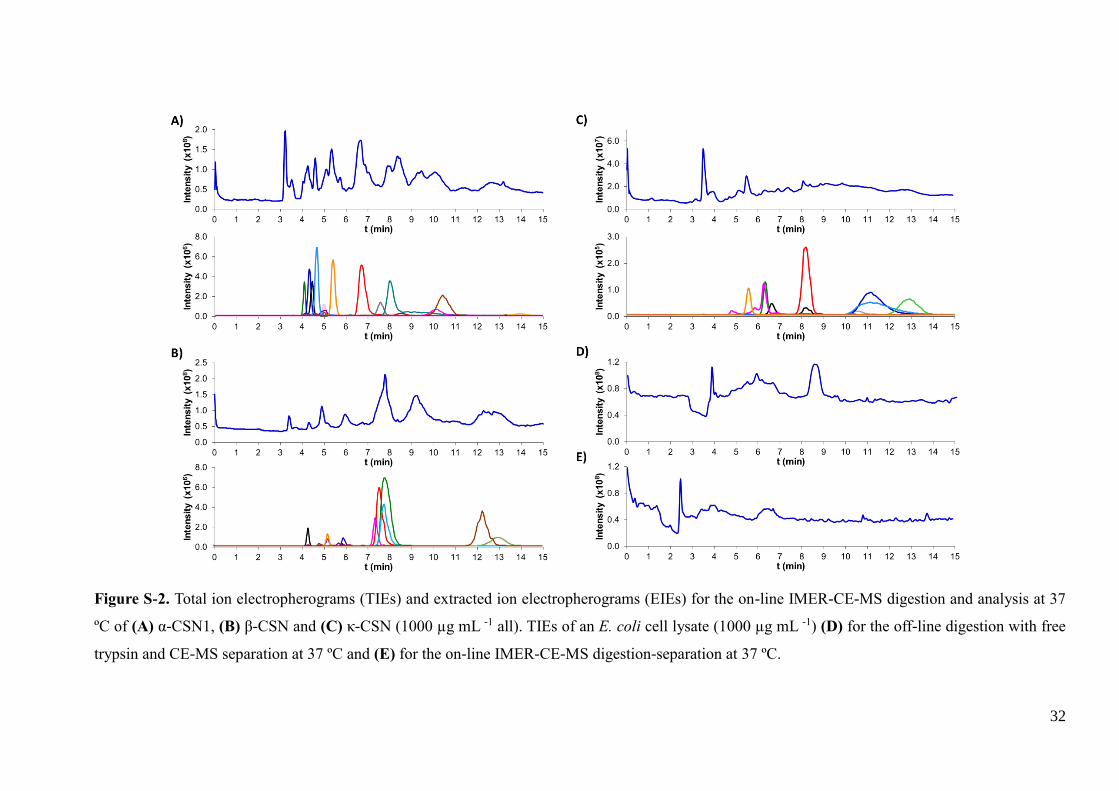
Mr peptide (53 amino acids long) was not detected. Supplementary Figures S-2 A, B
and C show the TIE and EIEs for the IMER-CE-MS analysis of α-CSN1, β-CSN and κ-
CSN, respectively, and total separation times were shorter than 15 min in all cases.
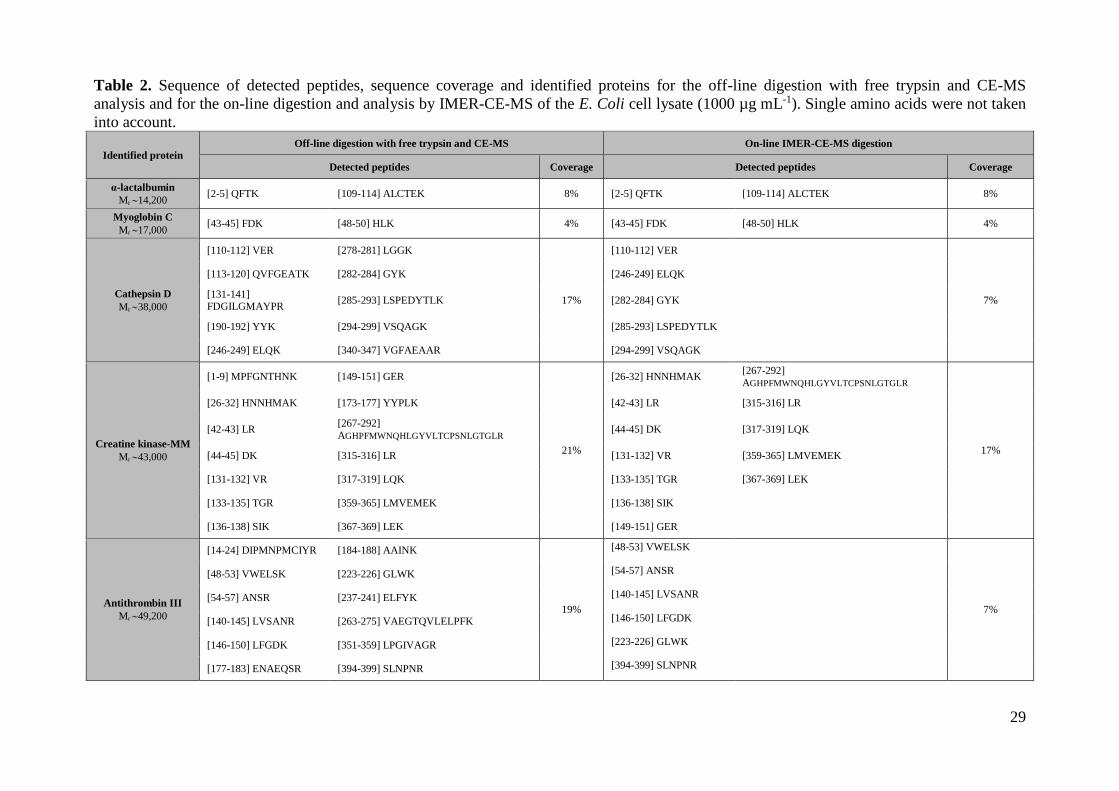
In order to demonstrate the feasibility of IMER-CE-MS for the analysis of complex real
samples an E. coli cell lysate (1000 µg mL-1) was analyzed under the optimized
conditions by off-line digestion with free trypsin and CE-MS and by on-line IMER-CE-
MS. Supplementary Figure S-2 D and E show the TIEs for the off-line and the on-line
digestions, respectively. In both cases, a similar electrophoretic profile was obtained but
it was difficult to appreciate electrophoretic peaks due to the tryptic peptides because of
the low abundance of the different proteins in the cell lysate. The studied cell lysate was
specifically prepared as a quality control for purification of His-tagged proteins, which
contained an overexpressed protein with six additional His amino acids in the C-
18
terminal position (6x-His, Mr ~14,200). Taking into account the western blot provided
by the manufacturer and the LC-MS/MS bottom-up analysis study of Wright et al. [31],
the 6x-His protein was identified as 6x-His human α-lactalbumin. As Wright et al. [31],
it was also possible to identify other high abundant proteins in the cell lysate with the
off-line and the on-line digestions. Table 2 shows the sequence of the detected peptides,
the sequence coverage and the identified proteins in both cases. As can be observed,
sequence coverages were only slightly lower with the on-line digestion, due to the
shorter digestion times and the lower amount of protein, and in both cases 6x-His
human α-lactalbumin, myoglobin C, cathepsin D, creatine kinase-MM and antithrombin
III were identified. The number of identified peptides and the sequence coverages were
also very similar to those found by Wright et al. by LC-MS/MS [31], indicating the
good performance of the on-line digestion by IMER-CE-MS compared to the traditional
off-line digestion methods and the potential for the high-throughput bottom-up analysis
of complex protein mixtures in proteomics research.
4. Conclusions
We have developed and validated an IMER-CE-MS method for the on-line enzymatic
digestion, separation and characterization of proteins. Under the optimized conditions,
using 10 mM NH4HCO3 pH 7.9 as the digestion buffer, a very low protein sample flow
through the microreactor, a separation BGE of 50 mM HAc : 50 mM HFor, pH 2.3, and
a temperature of digestion and separation of 37 ºC, proteins were analyzed in less than
30 min (including all the steps). Furthermore, the sequence coverage for β-LG was
complete until a concentration of 10 µg mL-1 of protein and the microreactor could be
reused until 10 times with optimum performance, without decreasing repeatability or
observing carry-over. Results were comparable to the off-line digestion with free or
19
immobilized trypsin and CE-MS, despite a slightly smaller digestion yield was observed
due to the shorter digestion times and the lower amount of protein. The good
performance of the IMER-CE-MS method was also demonstrated for α-CSN1, α-CSN2,
β-CSN and κ-CSN, as well as for an E. coli cell lysate, confirming the great potential of
this approach to reduce the protein sample volume and the digestion times, while
minimizing the sample handling and reusing the microreactors. These features are
critical to perform rapid, reliable and high-throughput analysis of complex protein
mixtures in proteomics research, with trypsin or any other proteolytic enzyme, in
bottom-up or middle-down approaches using hybrid mass spectrometers.
Acknowledgements
This study was supported by a grant from the Spanish Ministry of Economy and
Competitiveness (CTQ2014-56777-R) and the Cathedra UB Rector Francisco
Buscarons Ubeda (Forensic Chemistry and Chemical Engineering). Roger Pero-Gascon
acknowledges the Spanish Ministry of Education, Culture and Sport for a FPU
(Formación del Profesorado Universitario) fellowship.
The authors declare no competing interests.
References
[1] A.F.M. Altelaar, J. Munoz, A.J.R. Heck, Next-generation proteomics: towards an
integrative view of proteome dynamics, Nat. Rev. Genet. 14 (2013) 35–48.
doi:10.1038/nrg3356.
[2] L.M. Smith, N.L. Kelleher, Proteoform: a single term describing protein
complexity, Nat. Methods. 10 (2013) 186–187. doi:10.1038/nmeth.2369.

20
[3] L. Tsiatsiani, A.J.R. Heck, Proteomics beyond trypsin, FEBS J. 282 (2015)
2612–2626. doi:10.1111/febs.13287.
[4] A. Lapolla, D. Fedele, R. Reitano, N.C. Aricò, R. Seraglia, P. Traldi, E. Marotta,
R. Tonani, Enzymatic digestion and mass spectrometry in the study of advanced
glycation end products/peptides, J. Am. Soc. Mass Spectrom. 15 (2004) 496–509.
doi:10.1016/j.jasms.2003.11.014.
[5] E. Giménez, R. Ramos-Hernan, F. Benavente, J. Barbosa, V. Sanz-Nebot,
Analysis of recombinant human erythropoietin glycopeptides by capillary
electrophoresis electrospray-time of flight-mass spectrometry, Anal. Chim. Acta.
709 (2012) 81–90. doi:10.1016/j.aca.2011.10.028.
[6] A.A. Homaei, R. Sariri, F. Vianello, R. Stevanato, Enzyme immobilization: An
update, J. Chem. Biol. 6 (2013) 185–205. doi:10.1007/s12154-013-0102-9.
[7] X. Liu, J. Yang, L. Yang, Capillary electrophoresis-integrated immobilized
enzyme reactors, Rev. Anal. Chem. 35 (2016) 115–131. doi:10.1515/revac-2016-
0003.
[8] L. Liu, B. Zhang, Q. Zhang, Y. Shi, L. Guo, L. Yang, Capillary electrophoresis-
based immobilized enzyme reactor using particle-packing technique, J.
Chromatogr. A. 1352 (2014) 80–86. doi:10.1016/j.chroma.2014.05.058.
[9] S. Moore, S. Hess, J. Jorgenson, Characterization of an immobilized enzyme
reactor for on-line protein digestion, J. Chromatogr. A. 1476 (2016) 1–8.
doi:10.1016/j.chroma.2016.11.021.
[10] C.A. Toth, Z. Kuklenyik, J.I. Jones, B.A. Parks, M.S. Gardner, D.M. Schieltz,
J.C. Rees, M.L. Andrews, L.G. McWilliams, J.L. Pirkle, J.R. Barr, On-column
trypsin digestion coupled with LC-MS/MS for quantification of apolipoproteins,
J. Proteomics. 150 (2017) 258–267. doi:10.1016/j.jprot.2016.09.011.
21
[11] L.N. Amankwa, W.G. Kuhr, Trypsin-modified fused-silica capillary microreactor
for peptide mapping by capillary zone electrophoresis, Anal. Chem. 64 (1992)
1610–1613. doi:10.1021/ac00038a019.
[12] L.N. Amankwa, W.G. Kuhr, On-line peptide mapping by capillary zone
electrophoresis, Anal. Chem. 65 (1993) 2693–2697. doi:10.1021/ac00067a025.
[13] L.N. Amankwa, K. Harder, F. Jirik, R. Aebersold, High-sensitivity determination
of tyrosine-phosphorylated peptides by on-line enzyme reactor and electrospray
ionization mass spectrometry, Protein Sci. 4 (1995) 113–125.
doi:10.1002/pro.5560040114.
[14] L. Licklider, W.G. Kuhr, M.P. Lacey, T. Keough, M.P. Purdon, R. Takigiku,
Online microreactors/capillary electrophoresis/mass spectrometry for the analysis
of proteins and peptides, Anal. Chem. 67 (1995) 4170–4177.
doi:10.1021/ac00118a021.
[15] L. Licklider, W.G. Kuhr, Optimization of on-line peptide mapping by capillary
zone electrophoresis, Anal. Chem. 66 (1994) 4400–4407.
doi:10.1021/ac00096a003.
[16] N.A. Guzman, Consecutive protein digestion and peptide derivatization
employing an on-line analyte concentrator to map proteins using capillary
electrophoresis, in: P.G. Righetti (Ed.), Capill. Electrophor. Anal. Biotechnol.,
CRC Press, 1996: pp. 101–121.
[17] J. Gao, J. Xu, L.E. Locascio, C.S. Lee, Integrated microfluidic system enabling
protein digestion, peptide separation, and protein identification, Anal. Chem. 73
(2001) 2648–2655. doi:10.1021/ac001126h.
[18] J. Křenková, K. Klepárník, F. Foret, Capillary electrophoresis mass spectrometry
coupling with immobilized enzyme electrospray capillaries, J. Chromatogr. A.
22
1159 (2007) 110–118. doi:10.1016/j.chroma.2007.02.095.
[19] Z. Yin, W. Zhao, M. Tian, Q. Zhang, L. Guo, L. Yang, A capillary
electrophoresis-based immobilized enzyme reactor using graphene oxide as a
support via layer by layer electrostatic assembly, Analyst. 139 (2014) 1973–
1979. doi:10.1039/c3an02241b.
[20] M. Ye, S. Hu, R.M. Schoenherr, N.J. Dovichi, On-line protein digestion and
peptide mapping by capillary electrophoresis with post-column labeling for laser-
induced flourescence detection, Electrophoresis. 25 (2004) 1319–1326.
doi:10.1002/elps.200305841.
[21] R.M. Schoenherr, M. Ye, M. Vannatta, N.J. Dovichi, CE-Microreactor-CE-
MS/MS for protein analysis, Anal. Chem. 79 (2007) 2230–2238.
doi:10.1021/ac061638h.
[22] E. Bonneil, M. Mercier, K.C. Waldron, Reproducibility of a solid-phase trypsin
microreactor for peptide mapping by capillary electrophoresis, Anal. Chim. Acta.
404 (2000) 29–45. doi:10.1016/S0003-2670(99)00677-7.
[23] E. Bonneil, K.C. Waldron, On-line system for peptide mapping by capillary
electrophoresis at sub-micromolar concentrations, Talanta. 53 (2000) 687–699.
doi:10.1016/S0039-9140(00)00554-3.
[24] K. Sakai-Kato, M. Kato, T. Toyo’oka, On-line trypsin-encapsulated enzyme
reactor by the sol - gel method integrated into capillary electrophoresis, Anal.
Chem. 74 (2002) 2943–2949. doi:10.1021/ac0200421.
[25] X. Xu, X. Wang, Y. Liu, B. Liu, H. Wu, P. Yang, Trypsin entrapped in
poly(diallylmethylammoniumchloride) silica sol-gel microreactor coupled to
matrix-assisted laser desorption/ionization time-of-flight mass spectrometry,
Rapid Commun. Mass Spectrom. 22 (2008) 1257–1264. doi:10.1002/rcm.
23
[26] Promega, Sequencing grade modified trypsin, (2016). https://www.promega.es/-
/media/files/resources/protocols/product-information-sheets/n/sequencing-grade-
modified-trypsin-protocol.pdf?la=es-es (accessed May 5, 2018).
[27] Promega, Immobilized trypsin. Instructions for use, (2010).
https://www.promega.es/-/media/files/resources/protocols/technical-
manuals/0/immobilized-trypsin-protocol.pdf (accessed May 5, 2018).
[28] H.H. Lauer, G.P. Rozing, eds., High performance capillary electrophoresis, 2nd
ed., Agilent Technologies, Waldbronn, Germany, 2014.
https://www.agilent.com/cs/library/primers/Public/5990_3777EN.pdf (accessed
May 5, 2018).
[29] F. Benavente, S. Medina-Casanellas, E. Giménez, V. Sanz-Nebot, On-line solid-
phase extraction capillary electrophoresis mass spectrometry for preconcentration
and clean-up of peptides and proteins, in: N.T. Tran, M. Taverna (Eds.), Capill.
Electrophor. Proteins Pept. Methods Protoc., Springer, New York, 2016: pp. 67–
84. doi:10.1007/978-1-4939-4014-1_6.
[30] C. Wenz, C. Barbas, Á. López-Gonzálvez, A. Garcia, F. Benavente, V. Sanz-
Nebot, T. Blanc, G. Freckleton, P. Britz-McKibbin, M. Shanmuganathan, F. De
L’Escaille, J. Far, R. Haselberg, S. Huang, C. Huhn, M. Pattky, D. Michels, S.
Mou, F. Yang, C. Neusuess, N. Tromsdorf, E.E.K. Baidoo, J.D. Keasling, S.S.
Park, Interlaboratory study to evaluate the robustness of capillary
electrophoresis-mass spectrometry for peptide mapping, J. Sep. Sci. 38 (2015)
3262–3270. doi:10.1002/jssc.201500551.
[31] J.C. Wright, M.O. Collins, L. Yu, L. Käll, M. Brosch, J.S. Choudhary, Enhanced
peptide identification by electron transfer dissociation using an improved mascot
percolator, Mol. Cell. Proteomics. 11 (2012) 478–491.

24
doi:10.1074/mcp.O111.014522.
25
Figure 1. Off-line protein digestion of β-LG (1000 µg mL-1) with free trypsin at 37 ºC and CE-MS analysis. Comparison of the total sum of peak
areas for the detected tryptic peptides (A) with different separation temperatures and digestion buffers (18 h of digestion time) and (B) with
different digestion times and digestion buffers (37 ºC of separation temperature). (C) Total ion electropherogram (TIE) and (D) extracted ion
electropherograms (EIEs) for 18 h of digestion time and CE-MS analysis at 37 ºC using 50 mM NH4HCO3 as the digestion buffer. Optimized
conditions are indicated in (A) and (B) with an asterisk.
26
Figure 2. Off-line protein digestion of β-LG (1000 µg mL-1) with immobilized trypsin performed during 30 min at 25º C and CE-MS analysis.
Comparison of the total sum of peak areas for the detected tryptic peptides (A) with different separation temperatures and digestion buffers and
(B) after consecutives enzymatic digestions with different digestion buffers (37 ºC of separation temperature). (C) TIE and (D) EIEs for the CE-
MS analysis at 37 ºC using 10 mM NH4HCO3 as the digestion buffer. Optimized conditions are indicated in (A) and (B) with an asterisk.
27
Figure 3. On-line IMER-CE-MS protein digestion and analysis of β-LG (1000 µg mL-1) with immobilized trypsin. Comparison of the total sum
of peak areas for the detected tryptic peptides (A) with different digestion-separation temperatures and digestion buffers (with 5 mbar, 600 s of
contact time) and (B) with different contact times between the protein and the enzyme of the microreactor (37 ºC of digestion-separation
temperatures). (C) TIE and (D) EIEs for the on-line IMER-CE-MS digestion-separation at 37 ºC using 10 mM NH4HCO3 as the digestion buffer.
Optimized conditions are indicated in (A) and (B) with an asterisk.
28
Table 1. Digestion of β-LG (1000 µg mL-1). Relative peak areas, migration times and percentage of relative standard deviations (%RSD) of the
peptides detected by the off-line digestion with free and immobilized trypsin in solution and CE-MS and by the on-line digestion with
immobilized trypsin in IMER-CE-MS. The analyses were performed in triplicate under the optimized conditions in all cases. Single amino acids
were not taken into account.
Peptide sequence [M+nH]n+
Off-line digestion with trypsin
in solution and CE-MS
Off-line digestion with
immobilized trypsin and CE-MS
On-line digestion with immobilized
trypsin by IMER-CE-MS
Relative peak area a) Migration time (min) Relative peak area a) Migration time (min) Relative peak area a) Migration time (min)
m/z n Mean %RSD Mean %RSD Mean %RSD Mean %RSD Mean %RSD Mean %RSD
[1-8] LIVTQTMK 467.2758 2 0.101 1.8 6.9 1.8 0.137 0.6 7.8 0.7 0.181 4.3 9.6 6.1
[9-14] GLDIQK 337.1979 2 0.102 1.0 6.6 1.8 0.112 0.9 7.6 0.5 0.137 2.2 8.9 5.7
[15-
40] VAGTWYSLAMAASDISLLDAQSAPLR 903.1306 3 0.009 1.6 8.1 1.8 0.0003 14 8.9 0.7 0.018 10 13.3 7.5
[41-
60] VYVEELKPTPEGDLEILLQK 771.7582 3 0.135 0.6 7.1 1.8 0.140 1.8 8.1 0.7 0.106 8.5 10.3 6.3
[61-
69] WENGECAQK 561.2379 2 0.002 4.9 7.0 1.7 0.007 12 8.0 0.7 0.010 15 10.0 6.2
[71-
75] IIAEK 287.1842 2 0.071 0.7 6.4 1.8 0.084 3.4 7.5 0.6 0.085 4.3 8.4 5.6
[76-
77] TK 248.1605 1 0.015 8.0 5.4 1.7 0.012 5.8 6.8 0.4 0.006 11 6.6 4.8
[78-
83] IPAVFK 337.7157 2 0.089 0.8 6.5 1.7 0.102 1.4 7.5 0.6 0.067 6.6 8.7 5.7
[84-
91] IDALNENK 458.7406 2 0.085 0.8 6.9 1.7 0.099 2.0 8.0 0.7 0.122 6.1 9.9 6.1
[92-
100] VLVLDTDYK 533.2953 2 0.115 0.9 7.1 1.8 0.088 1.6 8.1 0.7 0.028 4.2 10.3 6.3
[102-
124] YLLFCMENSAEPEQSLACQCLVR 940.0941 3 0.002 7.3 8.1 1.8 0.000 9.8 8.9 1.3 0.009 7.8 13.3 7.6
[125-
135] TPEVDDEALEK 623.2962 2 0.098 0.1 7.3 1.8 0.047 3.7 8.3 0.6 0.047 6.0 11.0 6.5
[136-
138] FDK 409.2082 1 0.016 6.5 6.1 1.8 0.006 4.3 7.2 0.6 0.005 9.9 7.7 5.2
[139-
141] ALK 331.2340 1 0.018 4.4 5.8 1.6 0.018 4.1 6.9 0.6 0.015 7.1 7.0 5.0
[142-
148] ALPMHIR 419.2421 2 0.043 4.2 5.8 1.8 0.038 4.9 6.9 0.6 0.048 10 7.0 5.0
[149-
162] LSFNPTQLEEQCHI 858.4068 2 0.100 2.7 7.4 1.7 0.108 5.5 8.4 0.8 0.116 3.6 11.2 6.7
a) The relative peak areas were obtained dividing the raw peak area of the peptide by the total sum of raw peak areas of the detected peptides.
29
Table 2. Sequence of detected peptides, sequence coverage and identified proteins for the off-line digestion with free trypsin and CE-MS
analysis and for the on-line digestion and analysis by IMER-CE-MS of the E. Coli cell lysate (1000 µg mL-1). Single amino acids were not taken
into account.
Identified protein Off-line digestion with free trypsin and CE-MS On-line IMER-CE-MS digestion
Detected peptides Coverage Detected peptides Coverage
α-lactalbumin
Mr 14,200
[2-5] QFTK [109-114] ALCTEK 8% [2-5] QFTK [109-114] ALCTEK 8%
Myoglobin C
Mr 17,000 [43-45] FDK [48-50] HLK 4% [43-45] FDK [48-50] HLK 4%
Cathepsin D
Mr 38,000
[110-112] VER [278-281] LGGK
17%
[110-112] VER
7%
[113-120] QVFGEATK [282-284] GYK [246-249] ELQK
[131-141] FDGILGMAYPR
[285-293] LSPEDYTLK [282-284] GYK
[190-192] YYK [294-299] VSQAGK [285-293] LSPEDYTLK
[246-249] ELQK [340-347] VGFAEAAR [294-299] VSQAGK
Creatine kinase-MM
Mr 43,000
[1-9] MPFGNTHNK [149-151] GER
21%
[26-32] HNNHMAK [267-292]
AGHPFMWNQHLGYVLTCPSNLGTGLR
17%
[26-32] HNNHMAK [173-177] YYPLK [42-43] LR [315-316] LR
[42-43] LR [267-292]
AGHPFMWNQHLGYVLTCPSNLGTGLR [44-45] DK [317-319] LQK
[44-45] DK [315-316] LR [131-132] VR [359-365] LMVEMEK
[131-132] VR [317-319] LQK [133-135] TGR [367-369] LEK
[133-135] TGR [359-365] LMVEMEK [136-138] SIK
[136-138] SIK [367-369] LEK [149-151] GER
Antithrombin III
Mr 49,200
[14-24] DIPMNPMCIYR [184-188] AAINK
19%
[48-53] VWELSK
7%
[48-53] VWELSK [223-226] GLWK [54-57] ANSR
[54-57] ANSR [237-241] ELFYK [140-145] LVSANR
[140-145] LVSANR [263-275] VAEGTQVLELPFK [146-150] LFGDK
[146-150] LFGDK [351-359] LPGIVAGR [223-226] GLWK
[177-183] ENAEQSR [394-399] SLNPNR [394-399] SLNPNR
30
Supporting Information
Table of contents
Figure S-1. Reusability of a microreactor for consecutive protein
digestion and analysis of β-LG
31
Figure S-2. Electropherograms for the off-line or on-line digestions and
analysis at 37 ºC of α-CSN1, β-CSN, κ-CSN, and an E. coli cell lysate.
32
Table S-1. On-line IMER-CE-MS digestion and analysis at 37 ºC of
α-CSN1 (1000 µg mL-1 of α-CSN).
33
Table S-2. On-line IMER-CE-MS digestion and analysis at 37 ºC of
α-CSN2 (1000 µg mL-1 of α-CSN).
34
Table S-3. On-line IMER-CE-MS digestion and analysis at 37 ºC of
β -CSN (1000 µg mL-1).
35
Table S-4. On-line IMER-CE-MS digestion and analysis at 37 ºC of
κ-CSN (1000 µg mL-1).
36
31
Figure S-1. Reusability of a microreactor for consecutive protein digestion and analysis
of β-LG (1000 µg mL-1) under the optimized conditions (37 ºC of digestion-separation
temperatures and 5 mbar, 600 s of contact time). (A) Total sum of peak areas, and (B)
average migration time for the detected tryptic peptides. Average %RSD values for the
analysis n= 5, 10, 20 and 30 appear as insets.
0.0
0.5
1.0
1.5
2.0
2.5
To
tal s
um
of
the
pe
ak
are
as fo
r th
e d
ete
cte
d
tryp
tic p
ep
tid
es (x10
9) %RSD = 7.4
%RSD = 5.3 %RSD = 7.5 %RSD = 6.2
0
5
10
15
20
25
30
0 5 10 15 20 25 30
Av
era
ge
mig
rati
on
tim
e (
min
)
On-line digestion number
%RSD = 6.8
%RSD = 14
%RSD = 21 %RSD = 24
A)
B)
32
Figure S-2. Total ion electropherograms (TIEs) and extracted ion electropherograms (EIEs) for the on-line IMER-CE-MS digestion and analysis at 37
ºC of (A) α-CSN1, (B) β-CSN and (C) κ-CSN (1000 µg mL -1 all). TIEs of an E. coli cell lysate (1000 µg mL -1) (D) for the off-line digestion with free
trypsin and CE-MS separation at 37 ºC and (E) for the on-line IMER-CE-MS digestion-separation at 37 ºC.
33
Table S-1. Relative peak areas and percentage of relative standard deviations (%RSD, n=3) of the peptides detected by the on-line IMER-CE-MS
digestion and analysis at 37 ºC of α-CSN1 (1000 µg mL-1 of α-CSN). Single amino acids were not taken into account.
Peptide sequence [M+nH]n+ Relative peak area a)
m/z n Mean % RSD
[1-3] RPK 200.6373 2 0.029 9.9
[4-7] HPIK 247.6582 2 0.093 5.4
[8-22] HQGLPQEVLNENLLR 587.3202 3 0.203 1.7
[23-34] FFVAPFPEVFGK 462.2486 3 0.013 4.4
[35-36] EK 276.1554 1 0.014 1.2
[37-42] VNELSK 385.1785 2 0.004 4.5
[43-58] DIGSESTEDQAMEDIK 964.3497 2 0.017 3.5
[59-79] QMEAESISSSEEIVPNSVEQK - - - -
[80-83] HIQK 263.1611 2 0.093 5.9
[84-90] EDVPSER 416.1961 2 0.076 2.6
[91-100] YLGYLEQLLR 634.3562 2 0.148 5.0
[101-102] LK 260.1969 1 0.004 4.3
[104-105] YK 310.1761 1 0.013 4.1
[106-119] VPQLEIVPNSAEER 830.9010 2 0.033 6.3
[120-124] LHSMK 308.1681 2 0.093 4.5
[125-132] EGIHAQQK 304.1633 3 0.069 2.7
[133-151] EPMIGVNQELAYFYPELFR 772.7175 3 0.029 2.6
[152-193] QFYQLDAYPSGAWYYVPLGTQYTDAPSFSDIPNPIGSENSEK 1572.7295 3 0.001 4.2
[194-199] TTMPLW 748.3698 1 0.068 2.4
a) The relative peak areas were obtained dividing the raw peak area of the peptide by the total sum of raw peak areas of the detected peptides.
34
Table S-2. Relative peak areas and percentage of relative standard deviations (%RSD,
n=3) of the peptides detected by the on-line IMER-CE-MS digestion and analysis at 37
ºC of α-CSN2 (1000 µg mL-1 of α-CSN). Single amino acids were not taken into
account.
Peptide sequence [M+nH]n+
Relative peak area
a)
m/z n Mean % RSD
[2-21] NTMEHVSSSEESIISQETYK 873.6402 3 0.003 8.2
[22-24] QEK 404.2140 1 0.004 9.9
[25-32] NMAINPSK 477.7096 2 0.001 35
[33-41] ENLCSTFCK 522.7284 2 0.002 2.7
[42-45] EVVR 251.6531 2 0.028 5.3
[46-70] NANEEEYSIGSSSEESAEVATEEVK - - - -
[71-76] ITVDDK 345.6873 2 0.250 1.7
[77-80] HYQK 288.1507 2 0.034 4.9
[81-91] ALNEINQFYQK 684.3516 2 0.050 1.7
[92-113] FPQYLQYLYQGPIVLNPWDQVK 903.8077 3 0.007 4.1
[115-125] NAVPITPTLNR 598.3436 2 0.058 4.8
[126-136] EQLSTSEENSK - - - -
[138-149] VDMESTEVFTK 733.8100 2 0.028 5.4
[151-152] TK 248.1605 1 0.023 2.0
[153-158] LTEEEK 748.3723 1 0.165 0.6
[159-160] NR - - - -
[161-165] LNFLK 317.7001 2 0.077 4.0
[167-170] ISQR - - - -
[171-173] YQK 438.2347 1 0.007 5.2
[174-181] FALPQYLK 490.2845 2 0.100 1.2
[182-188] TVYQHQK 452.2381 2 0.019 6.4
[189-197] AMKPWIQPK 366.8762 3 0.065 1.9
[198-199] TK 248.1605 1 0.023 2.3
[200-205] VIPYVR 373.7319 2 0.012 2.7
[206-207] YL 295.1652 1 0.044 1.0
a) The relative peak areas were obtained dividing the raw peak area of the peptide by the total sum of raw
peak areas of the detected peptides.
35
Table S-3. Relative peak areas and percentage of relative standard deviations (%RSD, n=3) of the peptides detected by the on-line IMER-CE-MS
digestion and analysis at 37 ºC of β-CSN (1000 µg mL-1). Single amino acids were not taken into account.
Peptide sequence [M+nH]n+ Relative peak area a)
m/z n Mean %RSD
[2-25] ELEELNVPGEIVESLSSSEESITR - - - -
[26-28] INK 187.6238 3 0.014 2.1
[30-32] IEK 389.2395 2 0.004 3.9
[33-48] FQSEEQQQTEDELQDK 687.9481 1 0.005 3.6
[49-97] IHPFAQTQSLVYPFPGPIPNSLPQNIPPLTQTPVVVPPFLQPEVMGVSK 1772.9564 2 0.000 22
[98-99] VK 246.1812 1 0.016 3.0
[100-105] EAMAPK 323.6654 2 0.078 2.6
[106-107] HK 284.1717 2 0.012 10
[108-113] EMPFPK 374.6888 2 0.176 1.0
[114-169] YPVEPFTESQSLTLTDVENLHLPLPLLQSWMHQPHQPLPPTVMFPPQSVLSLSQSK 2120.4239 1 0.000 30
[170-176] VLPVPQK 390.7528 3 0.338 1.4
[177-183] AVPYPQR 415.7299 2 0.146 0.3
[184-202] DMPIQAFLLYQEPVLGPVR 729.3945 1 0.090 9.1
[203-209] GPFPIIV 742.4498 1 0.121 2.8
a) The relative peak areas were obtained dividing the raw peak area of the peptide by the total sum of raw peak areas of the detected peptides.
36
Table S-4. Relative peak areas and percentage of relative standard deviation (%RSD, n=3) of the peptides detected by the on-line IMER-CE-MS
digestion and analysis at 37 ºC of κ-CSN (1000 µg mL-1). Single amino acids were not taken into account.
Peptide sequence [M+nH]n+ Relative peak area a)
m/z n Mean %RSD
[1-10] QEQNQEQPIR 635.3130 2 0.007 66
[11-13] CEK 436.1646 2 0.009 22
[14-16] DER 419.1885 3 0.028 25
[17-21] FFSDK 322.1582 3 0.293 19
[22-24] IAK 331.2340 2 0.063 2.8
[25-34] YIPIQYVLSR 626.3587 1 0.219 15
[35-68] YPSYGLNYYQQKPVALINNQFLPYPYYAKPAAVR 1337.3599 2 0.002 69
[69-86] SPAQILQWQVLSNTVPAK 660.7023 1 0.130 16
[87-97] SCQAQPTTMAR 625.7740 2 0.191 6.9
[98-111] HPHPHLSFMAIPPK 536.9542 2 0.058 6.6
[113-116] NQDK - - - -
[117-169] IPTINTIASGEPTSTPTTEAVESTVATLEDSPEVIESPPEINTVQVTSTAV - - - -
a) The relative peak areas were obtained dividing the raw peak area of the peptide by the total sum of raw peak areas of the detected peptides.