fabricating and imaging carbon-fiber immobilized enzyme
TRANSCRIPT
Introduction
An important advantage of immobilizing enzymes on electrodesurfaces is that it separates the enzyme from the reactant in theanalyte solution. This advantage, combined with the specificityof enzyme catalysis and the sensitivity of electrochemicaltechniques, has lead to the wide use of immobilized enzymeelectrodes in biosensing and catalytic electrochemicaltechniques.1–8 Covalent attachment of enzymes has beenconsidered as one of the most important immobilizationmethods because it leads to a stable active surface and a thinimmobilized enzyme layer.9–13 Using an ultramicroelectrode asa support for immobilized enzymes is increasingly popular dueto an interest in biosensor miniaturization.13–22 Immobilizationon carbon-fiber electrodes is often preferred because of theirlow cost and the relative ease in producing covalently bondedfunctional groups for the enzyme attachment.11,13–15,22–25
Carboxylic, quinonic, phenolic, and ketonic functional groupscan be readily formed by electrochemical or chemicaloxidation26,27 and further coupling with linking agents isstraightforward. However, controlling the extent and type ofoxidation is difficult. Another option, direct reaction offunctionalized molecules with the carbon surface, allows a
qualitative and quantitative control over the modificationprocess.24,28 A recent innovation is a method to covalentlymodify carbon surface via reduction of diazonium salts. Forexample, this method has been used for covalent binding ofenzymes29 and proteins30 and study of the voltammetricdifferentiation of dopamine and ascorbic acid.31
Production of immobilized enzyme-based sensors requiresdetermination of enzyme activity to allow optimization of thesensor response. A poor sensor response can arise fromincomplete enzyme immobilization, non-uniformimmobilization, deactivation of the enzyme activity due to theimmobilization process, or passivation of the electrode due tothe presence of the enzyme layer. Determining the cause of apoor response at microscopic sensors requires an independentmethod of assaying the enzyme activity. Optical methodsinvolving luminescence or fluorescence techniques have beensuccessful at identifying poor sensor response due toheterogeneous enzyme distribution or activity.32,33 The scanningelectrochemical microscope (SECM) can identify enzymaticactivity directly (by electrolysis of the enzyme reactions)without addition of fluorescent dyes or other foreign material.Several experiments have now been reported in which theSECM has been used to examine enzyme activity.17,34–44 Inaddition to its imaging usage, SECM is useful in preparingsurfaces with patterned enzymatic activity.16,40 Such patternedelectrodes are useful in simulating the behavior of non-uniformimmobilization and can be useful in preparing multifunctionalmicro-sensors.
In this paper, we will report several methods to modify thesurface of a 33-µm diameter carbon-fiber electrode atmicroscopic scales by using the SECM. All rely on productionof an aminated surface that, with the use of biotin-avidin
27ANALYTICAL SCIENCES JANUARY 2001, VOL. 17
2001 © The Japan Society for Analytical Chemistry
Fabricating and Imaging Carbon-Fiber Immobilized EnzymeUltramicroelectrodes with Scanning ElectrochemicalMicroscopy
Fuyun GE, Robert C. TENENT, and David O. WIPF†
Department of Chemistry, Box 9573, Mississippi State University, Mississippi State, MS 39762, USA
The scanning electrochemical microscope (SECM) is used to image the activity of enzymes immobilized on the surfacesof disk-shaped carbon-fiber electrodes. SECM was used to map the concentration of enzymatically producedhydroquinone or hydrogen peroxide at the surface of a 33-µm diameter disk-shaped carbon-fiber electrode modified by animmobilized glucose-oxidase layer. Sub-monolayer coverage of the enzyme at the electrode surface could be detectedwith micrometer resolution. The SECM was also employed as a surface modification tool to produce microscopicregions of enzyme activity by using a variety of methods. One method is a gold-masking process in which microscopicgold patterns act as mask for producing patterns of chemical modification. The gold masks allow operation in both apositive or negative process for patterning enzyme activity. A second method uses the direct mode of the SECM toproduce covalently attached amine groups on the carbon surface. The amine groups are anchors for attachment ofglucose oxidase by use of a biotin/avidin process. The effect of non-uniform enzyme activity was investigated by usingthe SECM tip to temporarily damage an immobilized enzyme surface. SECM imaging can observe the spatial extent andtime-course of the enzyme recovery process.
(Received October 3, 2000; Accepted October 9, 2000)
† To whom correspondence should be addressed.E-mail: [email protected]. G. present address: DBS Communications, Inc., 126 W.Center Court, Schaumburg, IL 60195, USA.R. C. T. present address: Department of Chemistry, NorthCarolina State University, Dabney Hall, Box 8204, Raleigh NC27695, USA.
chemistry, allows localized enzyme immobilization. Onemethod is direct covalent attachment of nitrophenyl to thecarbon surface via the diazonium salt reduction. Reduction ofthe nitrophenyl produces an aminophenyl functional group. Asecond method relies on the oxidation of a long-chain diamine.A separate technique is the deposition of gold on the carbonsurface, producing a mask. Enzymes can be attached directly tothe uncovered carbon or to self-assembled films at the goldsurface. Once immobilized, the enzyme surface can be furtherstudied by localized methods. By changing the local pH at themodified surface with the SECM, the immobilized enzyme isobserved to deactivate and reactivate on the carbon surface.
The enzyme-modified surface is examined bygeneration/collection (GC) SECM. Production of H2O2 orhydroquinone at glucose oxidase surfaces is readily detected.Images of the modified surfaces are used to verify themodifications performed previously with the SECM and areable to quantitatively and qualitatively identify regions of highor low enzyme activity. Thus, the effectiveness of variousmodification and construction procedures of microscopicsensors can be quickly determined.
Experimental
ReagentsGlucose oxidase (GOD) biotinamidocaproyl labeled 150
units/mg protein with biotin content 5.0 mol/mol protein (SigmaChemical Co.), ExtrAvidin (Sigma), sulfosuccinimidyl-6-(biotinamido)hexanoate (NHS-LC-Biotin, immuno pure, PierceChemical Co., Rockford, IL), β-D-glucose (ICN, Costa Mesa,CA), poly(oxyalkylene)diamine (Jeffamine ED 2001, gift fromHuntsman Chemical Co., Houston TX), 4-nitrobenzenediazonium tetrafluoroborate (97%, AldrichChemical Co.), tetrabutylammonium hexafluorophosphate(Bu4NPF6, SAChem Inc., Austin TX) were used as received. p-Benzoquinone (BQ) was purified by sublimation before use.All other chemicals used were of reagent grade. Phosphate-citrate buffer solutions of 0.5 M ionic strength were preparedfrom Na2HPO4, citric acid, and KCl as described previously.45
Acetate buffer solutions were prepared from sodium acetate andacetic acid. All the solutions were prepared with Milli-Qultrapure water (>18 MΩ-cm). All glucose solutions wereallowed to mutarotate at room temperature for at least 24 hbefore use.
ElectrodesCarbon-fiber electrodes were prepared by heat-sealing 33-µm
fibers (Textron Specialty Materials) into low-melting 2-mm i.d.“flint” glass capillaries (FHC Corp., Brunswick, ME) accordingto published methods.46,47 The microelectrode was polishedwith the aid of a micromanipulator-based microelectrodepolisher (World Precision Instrument) and the use of a diamondabrasive plate (“fine”, Sutter Instrument Co., Novato CA). 2-µmdiameter platinum ultramicroelectrodes were prepared bysealing 2-µm diameter Pt wires (Goodfellow Metals, CambridgeScience Park, England) into soft glass capillaries according topublished methods.47 These electrodes were polished withsuccessively finer grades of alumina polish, culminating in 0.05µm alumina on cloth. In some cases, the glass-encased carbonfiber or Pt electrode was molded into an epoxy-shell (Epon 828Resin, Shell Chemicals and 13% TETA hardener, Miller-Stephenson, Danbury, CT) to produce an electrode with a 1 – 5cm overall dimension. When used as tips for the SECMexperiment, the 33 µm diameter carbon-fiber electrode was
prepared so that the overall dimension of the surrounding glassinsulator was 200 – 500 µm (i.e. an electrode-to-insulator ratiobetween 6 and 15). A platinum wire was used as an auxiliaryelectrode. A Ag/AgCl reference electrode was used in allexperiments and all potentials in this paper are referred to theAg/AgCl electrode
The tip was positioned near the substrate by employing acombination of generation/collection and feedbackpositioning.48 Depending on the experiment, either hydrogenperoxide or hydroquinone was electrochemically generated atthe carbon-fiber electrode. With the Pt substrate biased tooxidize the tip-generated species, the current increases as the tipapproaches the surface. The tip will be located over thesubstrate when the substrate current is at a maximum in thelateral directions (x or y). At this point, the tip-substratedistance is adjusted by collecting a current-distance curveduring a vertical movement. For most experiments, the tip-substrate separation was less than 5 µm.
EquipmentVoltammetry and potential step experiments were carried out
on the BAS 100B/W electrochemical workstation (BAS, WestLafayette, IN). The SECM equipment has been describedpreviously.49 A special order low-current preamplifier modulewith 10 pA/V sensitivity was used with the EI-400 potentiostat,(Ensman Instrumentation, Bloomington, IN) to facilitate low-current SECM measurements.
Enzyme immobilizationDetails of the covalent attachment of the amine linker on 33-
µm diameter carbon microelectrodes and microscopicmodifications with SECM are described in the Results andDiscussion section. In general, after attaching the amine linkerto the carbon electrode surface, the enzyme was immobilized onthe surface by employing biotin-avidin chemistry. The carbonsurface was biotinylated by first rinsing the 4-aminophenylmodified electrode with phosphate buffer and then soaking theelectrode for 2 h in room-temperature pH 7.4 phosphate buffercontaining 5 mg/ml sulfo-NHS-LC-biotin. After rinsing withpure buffer, the electrode was soaked for 12 h in a phosphatebuffer (4˚C, pH 7.4) containing 2 mg/ml ExtrAvidin buffer.After formation of the biotin/avidin surface layer, the electrodewas rinsed with phosphate buffer, then soaked for 24 h in aphosphate buffer (4˚C pH 6.1) containing 1 mg/ml biotinylatedglucose oxidase. Assaying the activity of the immobilizedenzyme will be discussed in the following section. Unlessotherwise noted, SECM data were collected in a pH 6.1phosphate buffer at room temperature.
Results and Discussion
Covalent modification of carbon microelectrodesCovalent attachment of an amine linker is a critical step for
production of a surface-immobilized enzyme layer. Twomodification methods were investigated in combination with theuse of biotin-avidin technology to produce enzyme-modifiedsurfaces.13,15,50 The first method attaches aminophenyl to thecarbon surface by reduction of a diazonium salt and the secondattaches a long-chain diamine by an oxidative process.Aminophenyl modification. As reported by Savéant and co-workers,28,51 aryl radicals can be covalently attached on thecarbon electrode by the electrochemical reduction ofcorresponding diazonium salts. A covalent monolayer of 4-nitrophenyl is formed in an overall 2e reduction in acetonitrile.
28 ANALYTICAL SCIENCES JANUARY 2001, VOL. 17
A subsequent 6e, 6H+ reduction of the nitrophenyl in proticsolvent completes the production of the aminophenyl layer.
Production of the aminophenyl layer at a 33-µm diametercarbon fiber microelectrode (CFE) begins with ten cyclicvoltammetric (CV) scans between 0.4 to 0 V at scan rate of 200mV/s in a solution of 2 mM 4-nitrobenzendiazoniumtetrafluoroborate, 0.1 M Bu4NPF6, and CH3CN. A distinctirreversible reduction wave at 0.1 V on the first cycle isfollowed by a nearly complete loss of a wave on subsequentcycles. After 5 cycles, the CV in the diazonium salt solution isindistinguishable from the background.
Initial reports suggested that production of an aminophenyllayer was possible by electrochemical reduction in anethanol/water solution. However, XPS experiments51 show thatonly a partial 4-nitrophenyl reduction is accomplished after ca.2 h of electrolysis at −1.4 V vs. SCE in ethanol/water solution.Raman spectroscopy52 did not identify aminophenyl on thesurface after the reduction of 4-nitrophenyl attached on carbonin ethanol/water solution. Rather, the reduction produced Ar-NO and Ar-NHOH.53 Since these by-products are reducible inacidic buffer solution, we carried out the reduction of 4-nitrophenyl to 4-aminophenyl in a pH 4.3 acetate buffersolution. Cyclic voltammetry from 0 to −1.2 V for the carbonelectrode modified with 4-nitrophenyl shows a broadirreversible reduction wave at about −0.9 V. A nearly completeloss of the wave occurs on subsequent cycles and after 5 cycles,the response is indistinguishable from the background.
Based on the assumption of a closest packing of 4-nitrophenylon the carbon surface, the surface excess of 4-nitrophenyl on thecarbon surface is 12.5×10⁻¹⁰ mol/cm2.51 Thus, the charge passedin the complete reduction of a 4-nitrophenyl to 4-aminophenylmonolayer on the 33-µm diameter CFE should be 6.2 nC. CVdata indicate that the charge for the reduction of 4-nitrophenylover the first four scans is 8.7 nC. The larger experimentalcharge may be partially accounted for by a larger real electrodearea as compared to the geometric area, i.e. the roughness factor(We have observed that the CFE electrode is not completely flatbut assumes a spherical-segment geometry after polishing. Thisslight convexity is, however, insufficient to completely accountfor the extra charge). These results indicate that the 4-nitrophenyl monolayer is completely reduced to a 4-aminophenyl monolayer in acetate buffer solution.
For comparison, electrodes modified with a nitrophenyl layer,as described above, were reduced in a 0.1 M solution of a 10%(v/v) aqueous ethanol solution by applying −1.5 V for 1 h. Asexpected, these electrodes showed poor enzyme activity afterimmobilization (vide infra).Jeffamine modification. A second procedure for generatingcovalently attached amine groups was investigated. Based onan observation by Porter and co-workers that electrochemicaloxidation of amine-containing molecules at a carbon electrodelead to covalent bond formation at the N to the carbon surface,54
we followed a procedure outlined by Pantano and Kuhr forattaching the diamine Jeffamine 2001 to a carbon-microelectrode.13,15 Jeffamine 2001 is a long-chain poly-(oxyalkylene)diamine with an average MW of 2000. Aftercleaning by aqueous sonication for 10 min and anelectrochemical CV pretreatment from −0.2 to 1.6 V in 0.5 MH2SO4 solution at a scan rate of 1 V/s, Jeffamine 2001 wasattached to the 33-µm diameter CFE by CV scans from 0.20 Vto 1.50 V at 10 mV/s in a 50 mM Jeffamine 2001, 0.1 MLiClO4/ethanol solution until successive CV waves wereidentical (ca. 30 min).
SECM assay of immobilized enzyme activity The SECM can be used to assay the activity of the
immobilized enzyme activity. In doing so, the questions thatarise are: can activity be observed, is the activity truly due toenzymatic process, can we judge the effectiveness of differentimmobilization methods, and can we examine the overallkinetics of the immobilized enzyme? The key to examiningactivity with SECM is recognizing that the catalytic oxidationof glucose to gluconic acid by GOD requires the presence of anoxidized co-substrate (Ox) (Eq. (1)).
glucose + Ox GOD→ gluconic acid + Red (1)
Near the enzyme-modified CFE, the relative concentration ofthe reduced co-substrate (Red) is an indication of the activity.A qualitative examination of the activity is available by usingSECM generation/collection imaging to make a map of Red’sconcentration.
SECM generation/collection (GC) imaging uses a microscopicelectrode probe that is scanned near the surface of interest.48
Images are formed by plotting the amperometric tip current forthe electrolysis of the sample species as a function of the tip’slateral position. All else being equal, larger tip currents indicatelarger local concentration of the species of interest. Normally,GC images use a tip much smaller than the sample to beexamined. In this case, however, the sample itself ismicroscopic, which leads to a practical problem of positioningtwo microscopic electrodes near each other in 3-dimensionalspace. To reduce the position problem to two dimensions, weemploy an inverted GC imaging mode (Fig. 1), in which thesample is the tip and the substrate is a very small electrode (e.g.2-µm diameter Pt disk) embedded in an insulating plane.Images are formed by scanning the sample immediately abovethe substrate while recording the electrolysis current at the
29ANALYTICAL SCIENCES JANUARY 2001, VOL. 17
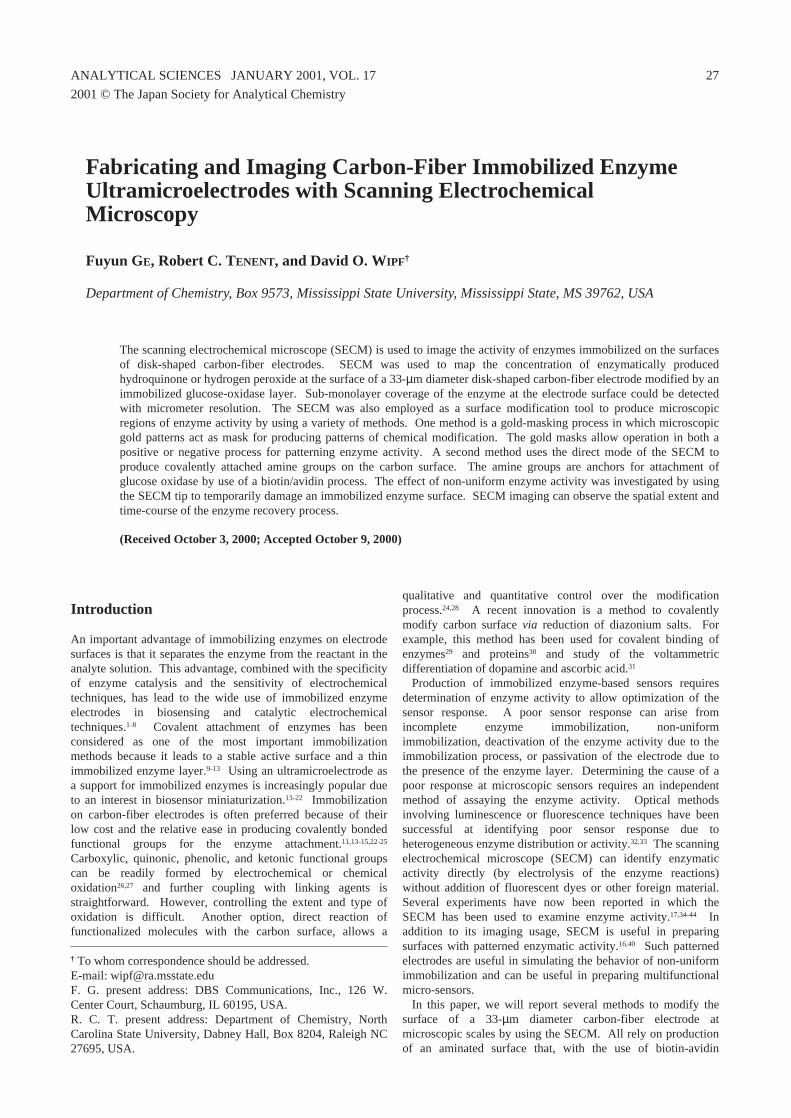
Fig. 1 Illustrations of the different SECM modes used in this work.All modes are inverted versions of more conventional measurementswith a larger mobile tip scanning over a stationary, smaller substrate.A, Generation/Collection (GC) imaging of an immobilized enzymemodified CFE; B, use of the substrate as a micro-auxiliary electrodeduring direct mode attachment of nitrophenyl on the CFE; C, use ofa gold substrate as a sacrificial electrode in a micro-reagent modedeposition of gold on the CFE; D, use of the micro-reagent mode tolocally generate a high pH at an enzyme-modified electrode.
substrate electrode.Qualitative imaging assay. GC images of the GODimmobilized 33-µm diameter CFE clearly show the results ofenzymatic activity. Electrodes produced with differentimmobilization conditions or the use of different enzyme co-substrate (Ox) have GC images that are similar in appearance;an increase in anodic substrate current located directly over thecarbon-fiber. Images differ predominately in the magnitude ofthe signal and the background current level. A backgroundcurrent is observed in all experiments because the enzymeactivity produces significant amounts of species Red near thecarbon electrode. Thus, an increase in enzyme activityproduces an increased background. In addition, backgroundcurrent varies due to very low signal levels and the presence ofday-to-day variations caused by instrument drift, electrodehistory, and low levels of solution impurities. In comparingvarious immobilization procedures, only a lateral current-distance slice across the image maximum is presented and theimages have been adjusted to have the same absolutebackground current (Fig. 2). In all SECM images, the carbonelectrode is at open-circuit (disconnected from the potentiostat)to preclude the possibility of electrolysis at the carbon electrodeperturbing the enzymatic assay procedure.
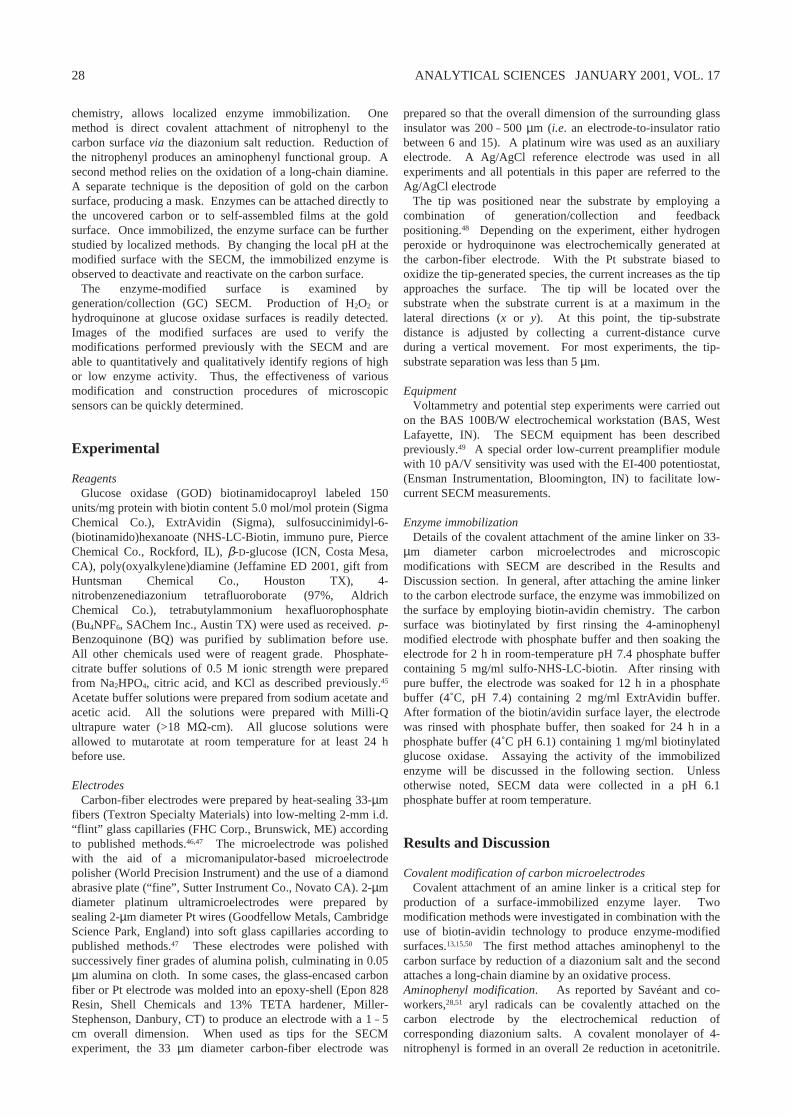
With oxygen as the co-substrate, the enzymatic reactionproduces H2O2, which is electrolyzed at 750 mV at the Ptsubstrate. The peak in anodic current over the carbon electrodein a 50-mM glucose and O2 (sat’d) solution is clear evidence ofenzyme activity (Fig. 2A). Sparging the solution with N2 for 5
min reduces the O2 concentration and lowers the signal, furtherimplicating enzymatic activity as the source of the substratesignal. After resaturating the solution with pure O2, the enzymeactivity is restored to the original level. Note that the someactivity is still present even after N2 sparging. This is due to theshort time of sparging and the use of a non-sealed SECM cell.Control experiments in which glucose or the co-substrate arenot present, show no signal at the substrate electrode.
p-Benzoquinone (BQ) was also used as a co-substrate. Theenzymatic product is hydroquinone (HQ), which is detected atthe substrate potential of 500 mV. A comparison of the enzymeactivity in a solution of O2 (sat’d), 50 mM glucose to theactivity in a solution of 2 mM BQ, 40 mM glucose (Fig. 2B),shows that the BQ mediator gives an improved response. Thedifference is likely due to the lower O2 concentration (about 1mM at 1 atm55).
In comparing Figs. 2A and 2B, note the difference in verticaland horizontal scale. Figure 2A was acquired with the use of a10-µm diameter Pt substrate while Figs. 2B – 2D are acquiredwith a 2-µm diameter Pt substrate. The vertical scaledifference, about 5×, is proportional to the electrode diameter.Although the peak width appears larger in Fig. 2A than in Figs.2B – 2C, the apparent size difference is predominately due to adifferent scan range. The data in Fig. 2A show more clearly theextent to which the enzymatic reaction products diffuse fromthe 33-µm diameter carbon surface. This diffusional blurring,however, does not mitigate the usefulness of a smaller substratein imaging enzyme activity (vide infra).
Figures 2A and 2B are data from electrodes modified usingthe Jeffamine process. Figure 2C illustrates data from modifiedelectrodes using the diazonium salt process. As discussedabove, reduction of the covalently bound nitrophenyl groups toaminophenyl is preferable in acetate buffer. Comparison of amodified electrode prepared by acetate reduction to theethanol/water reduction clearly shows the poor results producedby ethanol/water reduction (Fig. 2C) and demonstrates theability to detect sub-monolayer enzyme surface concentration.The diazonium process with acetate reduction is also clearlysuperior to the Jeffamine process. Under identical conditions,the diazonium-modified electrode exhibits a greater enzymeactivity than the Jeffamine modified electrode (Fig.2D).Quantitative assay. Calibrating the substrate current to theconcentration of reduced co-substrate allows a quantitativeassay of enzyme activity. The amount of oxidation currentobserved at the substrate will depend on the concentration but,critically, on the tip-substrate distance and the rate of theenzymatic reaction. The current at an embedded disk-shapedelectrode can be expressed by47
i = 4nFDaf(z)C (2)
where n is number of electrons passed in the electrode reaction,F is the Faraday, D is the diffusion coefficient, a is the substrateradius, C is the concentration of the reduced co-substrate, andf(z) is a function of the tip-substrate distance and of the tipgeometry. Although f(z) can be calculated theoretically,56,57 itcan also be determined for a specific electrode by calibrationwith standards. Therefore, for a given electrode and co-substrate, the current is only a function of the co-substrateconcentration, which is a function of the enzymatic reaction.
The activity of a 33-µm diameter GOD modified CFE(Jeffamine process) as a function of glucose concentration ismeasured from the substrate current. Figure 3 shows anexample of a current-distance curve acquired with a 10-µm tip-substrate gap in 2 mM glucose, pH 6.1 PBS solution saturated
30 ANALYTICAL SCIENCES JANUARY 2001, VOL. 17
Fig. 2 Cross sections of SECM GC images showing anodic currentover immobilized GOD 33-µm diam CFEs in pH 6.1 PBS. Curvesare offset vertically for clarity and the offset, ioff, for each curve isnoted. The Pt substrate potential is 500 or 750 mV with use of O2 orBQ as a mediator, respectively. A, 10-µm diam Pt substrate, 12 µmtip-substrate separation, 5 µm/s scan rate, 50 mM glucose, GODimmobilization by the Jeffamine process: ( ) initial scan in O2
sat’d solution, ioff = 6.4 pA; ( ) 5 min sparge with N2, ioff = 3.8 pA;( ) after resaturation with pure O2, ioff = 6.4 pA. B, 2-µm diam Ptsubstrate, Jeffamine process: ( ) 2 mM BQ, 40 mM glucose, 2 µmseparation, 10 µm/s, ioff = 9.5 pA; ( ) sat’d O2, 50 mM glucose, 3µm separation, 12 µm/s, ioff = 1.6 pA. C, 2-µm diam Pt substrate, 2mM BQ, 40 mM glucose, diazonium process, 2 µm separation, 10µm/s: ( ) acetate reduction of nitrophenyl, ioff = 32.5 pA; ( )ethanol/water reduction of nitrophenyl, ioff = 12.4 pA. D, 2-µm diamPt substrate, 2 µm separation, 10 µm/s: ( ) 2 mM BQ, 40 mMglucose, diazonium process, ioff = 32.5 pA; ( ) 2 mM BQ, 40 mMglucose, Jeffamine process, ioff = 9.5 pA.
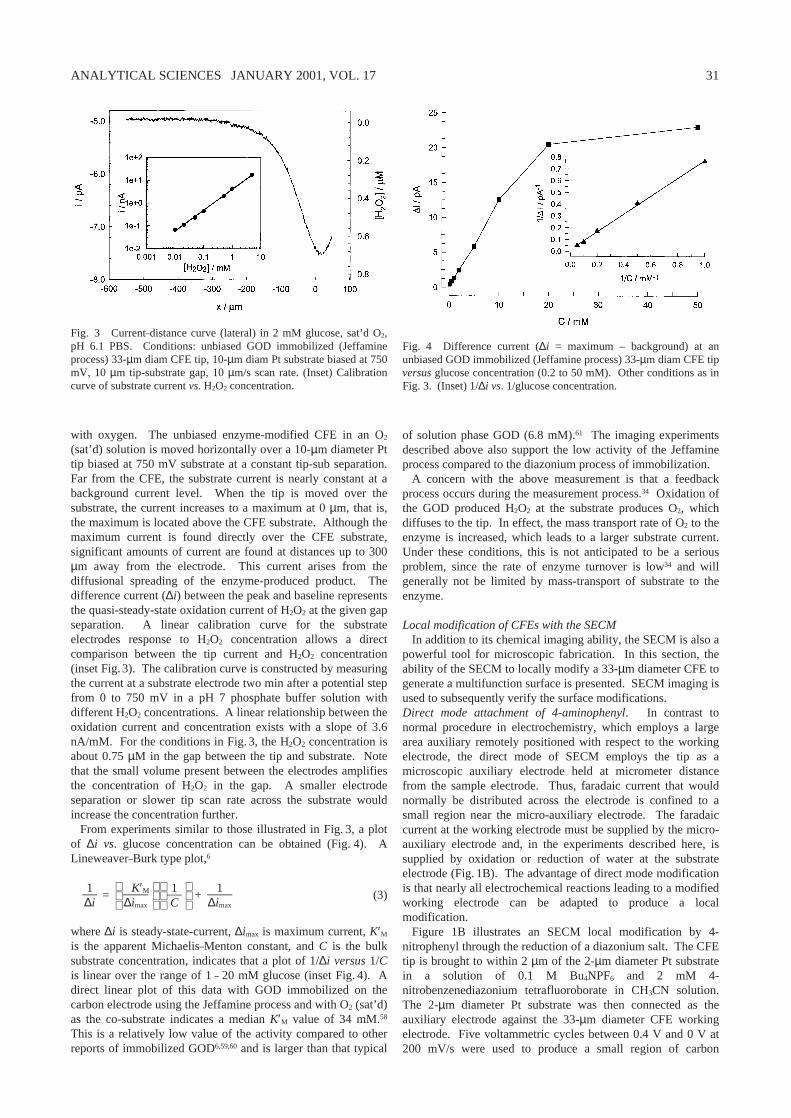
with oxygen. The unbiased enzyme-modified CFE in an O2
(sat’d) solution is moved horizontally over a 10-µm diameter Pttip biased at 750 mV substrate at a constant tip-sub separation.Far from the CFE, the substrate current is nearly constant at abackground current level. When the tip is moved over thesubstrate, the current increases to a maximum at 0 µm, that is,the maximum is located above the CFE substrate. Although themaximum current is found directly over the CFE substrate,significant amounts of current are found at distances up to 300µm away from the electrode. This current arises from thediffusional spreading of the enzyme-produced product. Thedifference current (∆i) between the peak and baseline representsthe quasi-steady-state oxidation current of H2O2 at the given gapseparation. A linear calibration curve for the substrateelectrodes response to H2O2 concentration allows a directcomparison between the tip current and H2O2 concentration(inset Fig. 3). The calibration curve is constructed by measuringthe current at a substrate electrode two min after a potential stepfrom 0 to 750 mV in a pH 7 phosphate buffer solution withdifferent H2O2 concentrations. A linear relationship between theoxidation current and concentration exists with a slope of 3.6nA/mM. For the conditions in Fig. 3, the H2O2 concentration isabout 0.75 µM in the gap between the tip and substrate. Notethat the small volume present between the electrodes amplifiesthe concentration of H2O2 in the gap. A smaller electrodeseparation or slower tip scan rate across the substrate wouldincrease the concentration further.
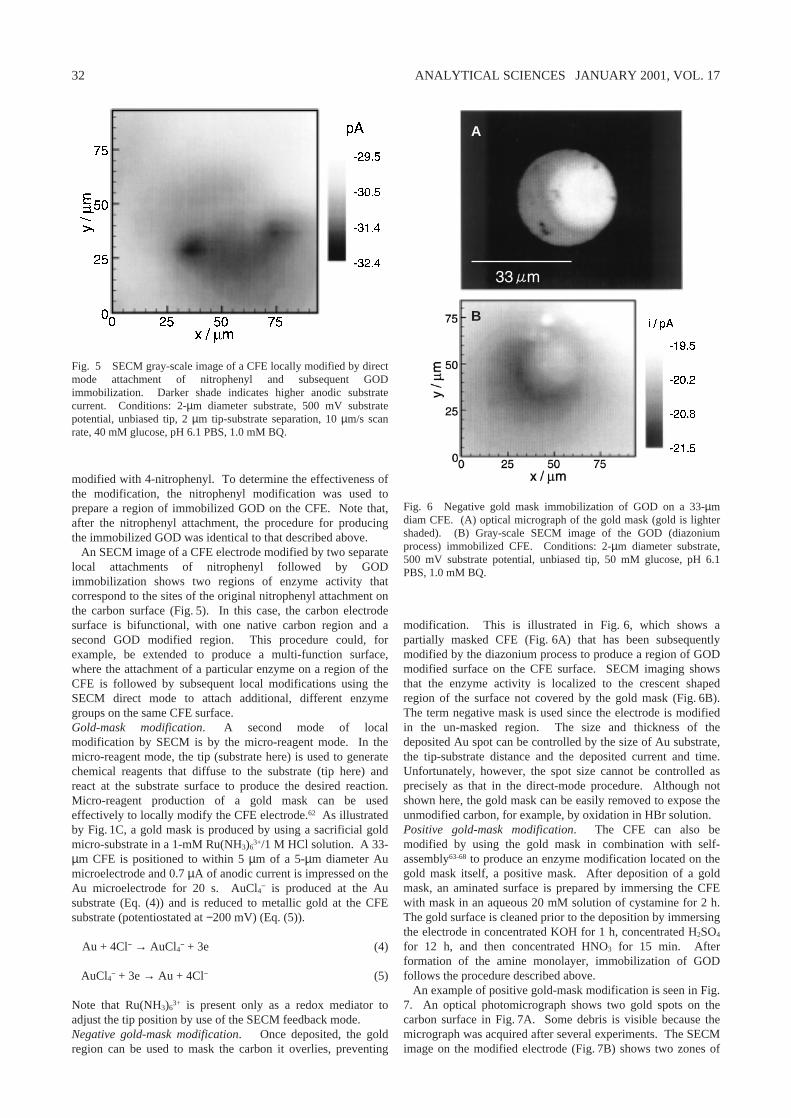
From experiments similar to those illustrated in Fig. 3, a plotof ∆i vs. glucose concentration can be obtained (Fig. 4). ALineweaver–Burk type plot,6
= + (3)
where ∆i is steady-state-current, ∆imax is maximum current, K′Mis the apparent Michaelis–Menton constant, and C is the bulksubstrate concentration, indicates that a plot of 1/∆i versus 1/Cis linear over the range of 1 – 20 mM glucose (inset Fig. 4). Adirect linear plot of this data with GOD immobilized on thecarbon electrode using the Jeffamine process and with O2 (sat’d)as the co-substrate indicates a median K′M value of 34 mM.58
This is a relatively low value of the activity compared to otherreports of immobilized GOD6,59,60 and is larger than that typical
1—∆imax
1—C
K′M—∆imax
1—∆i
of solution phase GOD (6.8 mM).61 The imaging experimentsdescribed above also support the low activity of the Jeffamineprocess compared to the diazonium process of immobilization.
A concern with the above measurement is that a feedbackprocess occurs during the measurement process.34 Oxidation ofthe GOD produced H2O2 at the substrate produces O2, whichdiffuses to the tip. In effect, the mass transport rate of O2 to theenzyme is increased, which leads to a larger substrate current.Under these conditions, this is not anticipated to be a seriousproblem, since the rate of enzyme turnover is low34 and willgenerally not be limited by mass-transport of substrate to theenzyme.
Local modification of CFEs with the SECMIn addition to its chemical imaging ability, the SECM is also a
powerful tool for microscopic fabrication. In this section, theability of the SECM to locally modify a 33-µm diameter CFE togenerate a multifunction surface is presented. SECM imaging isused to subsequently verify the surface modifications.Direct mode attachment of 4-aminophenyl. In contrast tonormal procedure in electrochemistry, which employs a largearea auxiliary remotely positioned with respect to the workingelectrode, the direct mode of SECM employs the tip as amicroscopic auxiliary electrode held at micrometer distancefrom the sample electrode. Thus, faradaic current that wouldnormally be distributed across the electrode is confined to asmall region near the micro-auxiliary electrode. The faradaiccurrent at the working electrode must be supplied by the micro-auxiliary electrode and, in the experiments described here, issupplied by oxidation or reduction of water at the substrateelectrode (Fig. 1B). The advantage of direct mode modificationis that nearly all electrochemical reactions leading to a modifiedworking electrode can be adapted to produce a localmodification.
Figure 1B illustrates an SECM local modification by 4-nitrophenyl through the reduction of a diazonium salt. The CFEtip is brought to within 2 µm of the 2-µm diameter Pt substratein a solution of 0.1 M Bu4NPF6 and 2 mM 4-nitrobenzenediazonium tetrafluoroborate in CH3CN solution.The 2-µm diameter Pt substrate was then connected as theauxiliary electrode against the 33-µm diameter CFE workingelectrode. Five voltammetric cycles between 0.4 V and 0 V at200 mV/s were used to produce a small region of carbon
31ANALYTICAL SCIENCES JANUARY 2001, VOL. 17
Fig. 3 Current–distance curve (lateral) in 2 mM glucose, sat’d O2,pH 6.1 PBS. Conditions: unbiased GOD immobilized (Jeffamineprocess) 33-µm diam CFE tip, 10-µm diam Pt substrate biased at 750mV, 10 µm tip-substrate gap, 10 µm/s scan rate. (Inset) Calibrationcurve of substrate current vs. H2O2 concentration.
Fig. 4 Difference current (∆i = maximum – background) at anunbiased GOD immobilized (Jeffamine process) 33-µm diam CFE tipversus glucose concentration (0.2 to 50 mM). Other conditions as inFig. 3. (Inset) 1/∆i vs. 1/glucose concentration.
modified with 4-nitrophenyl. To determine the effectiveness ofthe modification, the nitrophenyl modification was used toprepare a region of immobilized GOD on the CFE. Note that,after the nitrophenyl attachment, the procedure for producingthe immobilized GOD was identical to that described above.
An SECM image of a CFE electrode modified by two separatelocal attachments of nitrophenyl followed by GODimmobilization shows two regions of enzyme activity thatcorrespond to the sites of the original nitrophenyl attachment onthe carbon surface (Fig. 5). In this case, the carbon electrodesurface is bifunctional, with one native carbon region and asecond GOD modified region. This procedure could, forexample, be extended to produce a multi-function surface,where the attachment of a particular enzyme on a region of theCFE is followed by subsequent local modifications using theSECM direct mode to attach additional, different enzymegroups on the same CFE surface.Gold-mask modification. A second mode of localmodification by SECM is by the micro-reagent mode. In themicro-reagent mode, the tip (substrate here) is used to generatechemical reagents that diffuse to the substrate (tip here) andreact at the substrate surface to produce the desired reaction.Micro-reagent production of a gold mask can be usedeffectively to locally modify the CFE electrode.62 As illustratedby Fig. 1C, a gold mask is produced by using a sacrificial goldmicro-substrate in a 1-mM Ru(NH3)6
3+/1 M HCl solution. A 33-µm CFE is positioned to within 5 µm of a 5-µm diameter Aumicroelectrode and 0.7 µA of anodic current is impressed on theAu microelectrode for 20 s. AuCl4
− is produced at the Ausubstrate (Eq. (4)) and is reduced to metallic gold at the CFEsubstrate (potentiostated at −200 mV) (Eq. (5)).
Au + 4Cl− → AuCl4− + 3e (4)
AuCl4− + 3e → Au + 4Cl− (5)
Note that Ru(NH3)63+ is present only as a redox mediator to
adjust the tip position by use of the SECM feedback mode.Negative gold-mask modification. Once deposited, the goldregion can be used to mask the carbon it overlies, preventing
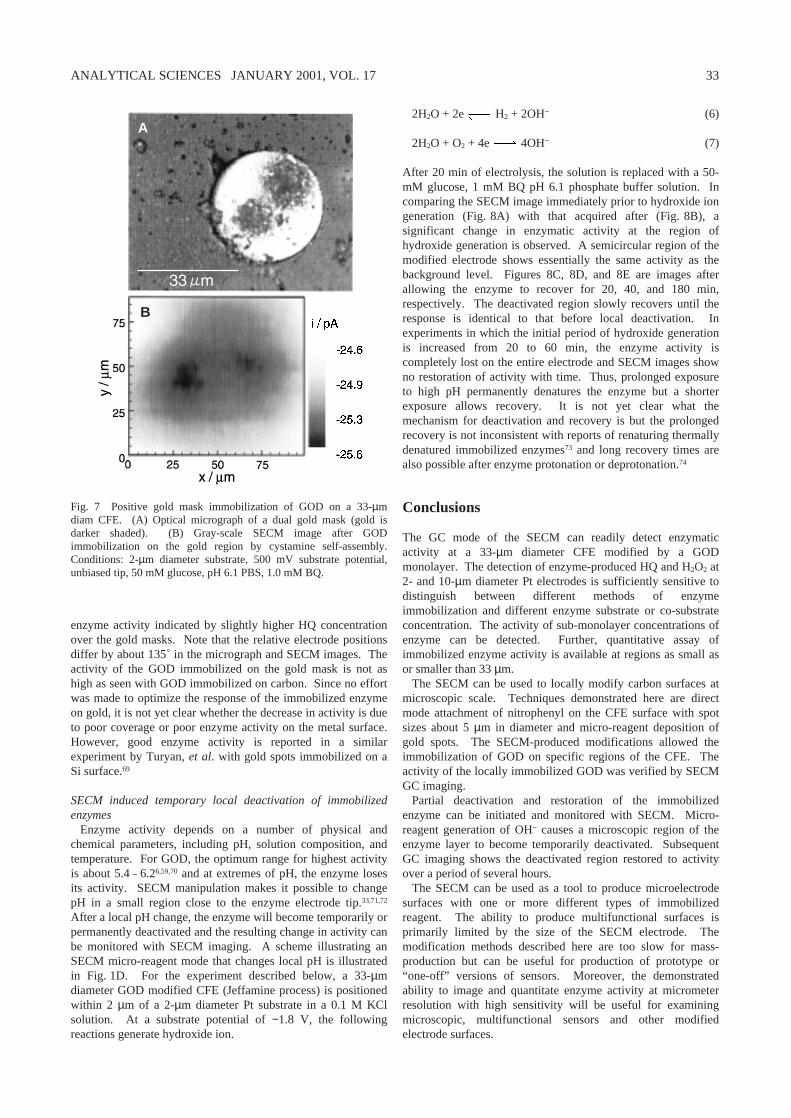
modification. This is illustrated in Fig. 6, which shows apartially masked CFE (Fig. 6A) that has been subsequentlymodified by the diazonium process to produce a region of GODmodified surface on the CFE surface. SECM imaging showsthat the enzyme activity is localized to the crescent shapedregion of the surface not covered by the gold mask (Fig. 6B).The term negative mask is used since the electrode is modifiedin the un-masked region. The size and thickness of thedeposited Au spot can be controlled by the size of Au substrate,the tip-substrate distance and the deposited current and time.Unfortunately, however, the spot size cannot be controlled asprecisely as that in the direct-mode procedure. Although notshown here, the gold mask can be easily removed to expose theunmodified carbon, for example, by oxidation in HBr solution.Positive gold-mask modification. The CFE can also bemodified by using the gold mask in combination with self-assembly63–68 to produce an enzyme modification located on thegold mask itself, a positive mask. After deposition of a goldmask, an aminated surface is prepared by immersing the CFEwith mask in an aqueous 20 mM solution of cystamine for 2 h.The gold surface is cleaned prior to the deposition by immersingthe electrode in concentrated KOH for 1 h, concentrated H2SO4
for 12 h, and then concentrated HNO3 for 15 min. Afterformation of the amine monolayer, immobilization of GODfollows the procedure described above.
An example of positive gold-mask modification is seen in Fig.7. An optical photomicrograph shows two gold spots on thecarbon surface in Fig. 7A. Some debris is visible because themicrograph was acquired after several experiments. The SECMimage on the modified electrode (Fig. 7B) shows two zones of
32 ANALYTICAL SCIENCES JANUARY 2001, VOL. 17
Fig. 5 SECM gray-scale image of a CFE locally modified by directmode attachment of nitrophenyl and subsequent GODimmobilization. Darker shade indicates higher anodic substratecurrent. Conditions: 2-µm diameter substrate, 500 mV substratepotential, unbiased tip, 2 µm tip-substrate separation, 10 µm/s scanrate, 40 mM glucose, pH 6.1 PBS, 1.0 mM BQ.
A
B
Fig. 6 Negative gold mask immobilization of GOD on a 33-µmdiam CFE. (A) optical micrograph of the gold mask (gold is lightershaded). (B) Gray-scale SECM image of the GOD (diazoniumprocess) immobilized CFE. Conditions: 2-µm diameter substrate,500 mV substrate potential, unbiased tip, 50 mM glucose, pH 6.1PBS, 1.0 mM BQ.
enzyme activity indicated by slightly higher HQ concentrationover the gold masks. Note that the relative electrode positionsdiffer by about 135˚ in the micrograph and SECM images. Theactivity of the GOD immobilized on the gold mask is not ashigh as seen with GOD immobilized on carbon. Since no effortwas made to optimize the response of the immobilized enzymeon gold, it is not yet clear whether the decrease in activity is dueto poor coverage or poor enzyme activity on the metal surface.However, good enzyme activity is reported in a similarexperiment by Turyan, et al. with gold spots immobilized on aSi surface.69
SECM induced temporary local deactivation of immobilizedenzymes
Enzyme activity depends on a number of physical andchemical parameters, including pH, solution composition, andtemperature. For GOD, the optimum range for highest activityis about 5.4 – 6.26,59,70 and at extremes of pH, the enzyme losesits activity. SECM manipulation makes it possible to changepH in a small region close to the enzyme electrode tip.33,71,72
After a local pH change, the enzyme will become temporarily orpermanently deactivated and the resulting change in activity canbe monitored with SECM imaging. A scheme illustrating anSECM micro-reagent mode that changes local pH is illustratedin Fig. 1D. For the experiment described below, a 33-µmdiameter GOD modified CFE (Jeffamine process) is positionedwithin 2 µm of a 2-µm diameter Pt substrate in a 0.1 M KClsolution. At a substrate potential of −1.8 V, the followingreactions generate hydroxide ion.
2H2O + 2e H2 + 2OH− (6)
2H2O + O2 + 4e 4OH− (7)
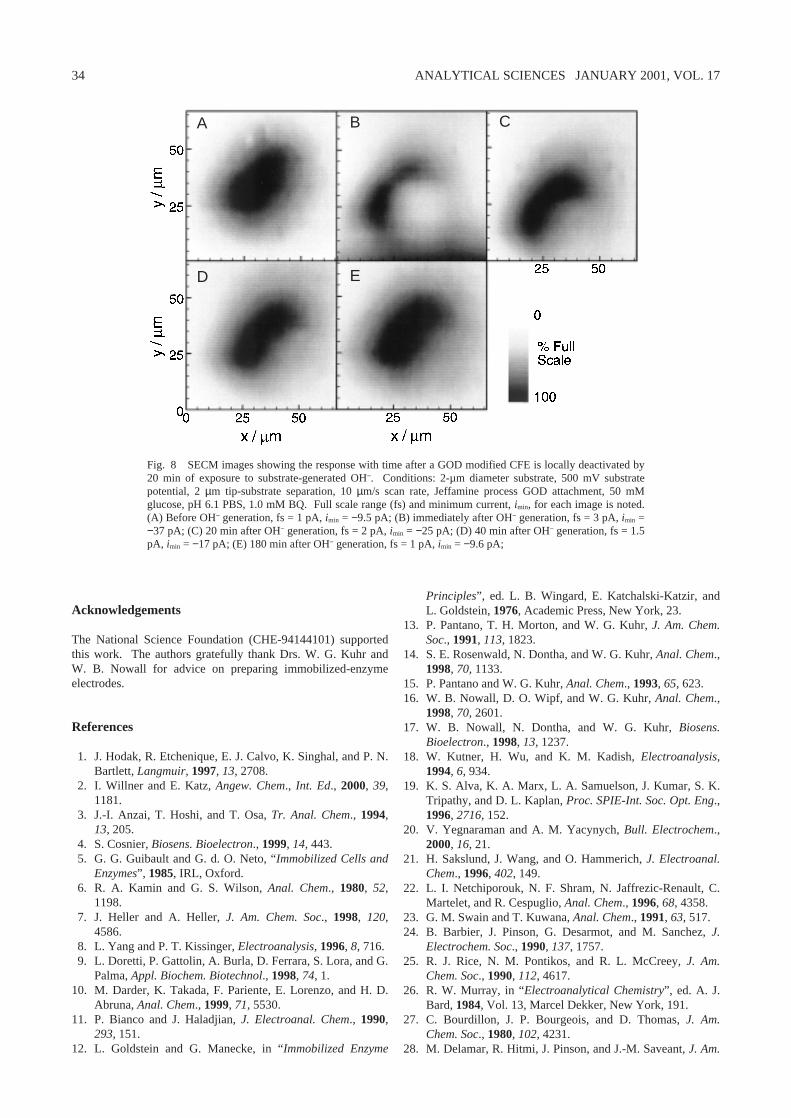
After 20 min of electrolysis, the solution is replaced with a 50-mM glucose, 1 mM BQ pH 6.1 phosphate buffer solution. Incomparing the SECM image immediately prior to hydroxide iongeneration (Fig. 8A) with that acquired after (Fig. 8B), asignificant change in enzymatic activity at the region ofhydroxide generation is observed. A semicircular region of themodified electrode shows essentially the same activity as thebackground level. Figures 8C, 8D, and 8E are images afterallowing the enzyme to recover for 20, 40, and 180 min,respectively. The deactivated region slowly recovers until theresponse is identical to that before local deactivation. Inexperiments in which the initial period of hydroxide generationis increased from 20 to 60 min, the enzyme activity iscompletely lost on the entire electrode and SECM images showno restoration of activity with time. Thus, prolonged exposureto high pH permanently denatures the enzyme but a shorterexposure allows recovery. It is not yet clear what themechanism for deactivation and recovery is but the prolongedrecovery is not inconsistent with reports of renaturing thermallydenatured immobilized enzymes73 and long recovery times arealso possible after enzyme protonation or deprotonation.74
Conclusions
The GC mode of the SECM can readily detect enzymaticactivity at a 33-µm diameter CFE modified by a GODmonolayer. The detection of enzyme-produced HQ and H2O2 at2- and 10-µm diameter Pt electrodes is sufficiently sensitive todistinguish between different methods of enzymeimmobilization and different enzyme substrate or co-substrateconcentration. The activity of sub-monolayer concentrations ofenzyme can be detected. Further, quantitative assay ofimmobilized enzyme activity is available at regions as small asor smaller than 33 µm.
The SECM can be used to locally modify carbon surfaces atmicroscopic scale. Techniques demonstrated here are directmode attachment of nitrophenyl on the CFE surface with spotsizes about 5 µm in diameter and micro-reagent deposition ofgold spots. The SECM-produced modifications allowed theimmobilization of GOD on specific regions of the CFE. Theactivity of the locally immobilized GOD was verified by SECMGC imaging.
Partial deactivation and restoration of the immobilizedenzyme can be initiated and monitored with SECM. Micro-reagent generation of OH− causes a microscopic region of theenzyme layer to become temporarily deactivated. SubsequentGC imaging shows the deactivated region restored to activityover a period of several hours.
The SECM can be used as a tool to produce microelectrodesurfaces with one or more different types of immobilizedreagent. The ability to produce multifunctional surfaces isprimarily limited by the size of the SECM electrode. Themodification methods described here are too slow for mass-production but can be useful for production of prototype or“one-off” versions of sensors. Moreover, the demonstratedability to image and quantitate enzyme activity at micrometerresolution with high sensitivity will be useful for examiningmicroscopic, multifunctional sensors and other modifiedelectrode surfaces.
33ANALYTICAL SCIENCES JANUARY 2001, VOL. 17
A
B
Fig. 7 Positive gold mask immobilization of GOD on a 33-µmdiam CFE. (A) Optical micrograph of a dual gold mask (gold isdarker shaded). (B) Gray-scale SECM image after GODimmobilization on the gold region by cystamine self-assembly.Conditions: 2-µm diameter substrate, 500 mV substrate potential,unbiased tip, 50 mM glucose, pH 6.1 PBS, 1.0 mM BQ.
Acknowledgements
The National Science Foundation (CHE-94144101) supportedthis work. The authors gratefully thank Drs. W. G. Kuhr andW. B. Nowall for advice on preparing immobilized-enzymeelectrodes.
References
1. J. Hodak, R. Etchenique, E. J. Calvo, K. Singhal, and P. N.Bartlett, Langmuir, 1997, 13, 2708.
2. I. Willner and E. Katz, Angew. Chem., Int. Ed., 2000, 39,1181.
3. J.-I. Anzai, T. Hoshi, and T. Osa, Tr. Anal. Chem., 1994,13, 205.
4. S. Cosnier, Biosens. Bioelectron., 1999, 14, 443.5. G. G. Guibault and G. d. O. Neto, “Immobilized Cells and
Enzymes”, 1985, IRL, Oxford.6. R. A. Kamin and G. S. Wilson, Anal. Chem., 1980, 52,
1198.7. J. Heller and A. Heller, J. Am. Chem. Soc., 1998, 120,
4586.8. L. Yang and P. T. Kissinger, Electroanalysis, 1996, 8, 716.9. L. Doretti, P. Gattolin, A. Burla, D. Ferrara, S. Lora, and G.
Palma, Appl. Biochem. Biotechnol., 1998, 74, 1.10. M. Darder, K. Takada, F. Pariente, E. Lorenzo, and H. D.
Abruna, Anal. Chem., 1999, 71, 5530.11. P. Bianco and J. Haladjian, J. Electroanal. Chem., 1990,
293, 151.12. L. Goldstein and G. Manecke, in “Immobilized Enzyme
Principles”, ed. L. B. Wingard, E. Katchalski-Katzir, andL. Goldstein, 1976, Academic Press, New York, 23.
13. P. Pantano, T. H. Morton, and W. G. Kuhr, J. Am. Chem.Soc., 1991, 113, 1823.
14. S. E. Rosenwald, N. Dontha, and W. G. Kuhr, Anal. Chem.,1998, 70, 1133.
15. P. Pantano and W. G. Kuhr, Anal. Chem., 1993, 65, 623.16. W. B. Nowall, D. O. Wipf, and W. G. Kuhr, Anal. Chem.,
1998, 70, 2601.17. W. B. Nowall, N. Dontha, and W. G. Kuhr, Biosens.
Bioelectron., 1998, 13, 1237.18. W. Kutner, H. Wu, and K. M. Kadish, Electroanalysis,
1994, 6, 934.19. K. S. Alva, K. A. Marx, L. A. Samuelson, J. Kumar, S. K.
Tripathy, and D. L. Kaplan, Proc. SPIE-Int. Soc. Opt. Eng.,1996, 2716, 152.
20. V. Yegnaraman and A. M. Yacynych, Bull. Electrochem.,2000, 16, 21.
21. H. Sakslund, J. Wang, and O. Hammerich, J. Electroanal.Chem., 1996, 402, 149.
22. L. I. Netchiporouk, N. F. Shram, N. Jaffrezic-Renault, C.Martelet, and R. Cespuglio, Anal. Chem., 1996, 68, 4358.
23. G. M. Swain and T. Kuwana, Anal. Chem., 1991, 63, 517.24. B. Barbier, J. Pinson, G. Desarmot, and M. Sanchez, J.
Electrochem. Soc., 1990, 137, 1757.25. R. J. Rice, N. M. Pontikos, and R. L. McCreey, J. Am.
Chem. Soc., 1990, 112, 4617.26. R. W. Murray, in “Electroanalytical Chemistry”, ed. A. J.
Bard, 1984, Vol. 13, Marcel Dekker, New York, 191.27. C. Bourdillon, J. P. Bourgeois, and D. Thomas, J. Am.
Chem. Soc., 1980, 102, 4231.28. M. Delamar, R. Hitmi, J. Pinson, and J.-M. Saveant, J. Am.
34 ANALYTICAL SCIENCES JANUARY 2001, VOL. 17
A B C
D E
Fig. 8 SECM images showing the response with time after a GOD modified CFE is locally deactivated by20 min of exposure to substrate-generated OH−. Conditions: 2-µm diameter substrate, 500 mV substratepotential, 2 µm tip-substrate separation, 10 µm/s scan rate, Jeffamine process GOD attachment, 50 mMglucose, pH 6.1 PBS, 1.0 mM BQ. Full scale range (fs) and minimum current, imin, for each image is noted.(A) Before OH− generation, fs = 1 pA, imin = −9.5 pA; (B) immediately after OH− generation, fs = 3 pA, imin =−37 pA; (C) 20 min after OH− generation, fs = 2 pA, imin = −25 pA; (D) 40 min after OH− generation, fs = 1.5pA, imin = −17 pA; (E) 180 min after OH− generation, fs = 1 pA, imin = −9.6 pA;
Chem. Soc., 1992, 114, 5883.29. C. Bourdillon, C. Demaille, R. Hitmi, J. Moiroux, and J.
Pinson, J. Electroanal. Chem., 1992, 336, 113.30. A. J. Downard and A. D. Roddick, Electroanalysis, 1995,
7, 376.31. A. J. Downard, A. D. Roddick, and A. M. Bond, Anal.
Chim. Acta, 1995, 317, 303.32. P. Hopper and W. G. Kuhr, Anal. Chem., 1994, 66, 1996.33. J. C. O’Brien, J. Shumaker-Parry, and R. C. Engstrom,
Anal. Chem., 1998, 70, 1307.34. D. T. Pierce, P. R. Unwin, and A. J. Bard, Anal. Chem.,
1992, 64, 1795.35. D. T. Pierce and A. J. Bard, Anal. Chem., 1993, 65, 3598.36. B. R. Horrocks, D. Schmidtke, A. Heller, and A. J. Bard,
Anal. Chem., 1993, 65, 3605.37. G. Wittstock and W. Schuhmann, Anal. Chem., 1997, 69,
5059.38. C. Kranz, G. Wittstock, H. Wohlschlager, and W.
Schuhmann, Electrochim. Acta, 1997, 42, 3105.39. T. Wilhelm, G. Wittstock, and R. Szargan, Fresenius J.
Anal. Chem., 1999, 365, 163.40. H. Shiku, T. Takeda, H. Yamada, T. Matsue, and I. Uchida,
Anal. Chem., 1995, 67, 312.41. J. Zaumseil, G. Wittstock, S. Bahrs, and P. Steinrucke,
Fresenius J. Anal. Chem., 2000, 367, 352.42. T. Yasukawa, N. Kanaya, D. Mandler, and T. Matsue,
Chem. Lett., 2000, 458.43. D. J. Strike, A. Hengstenberg, M. Quinto, C. Kurzawa, M.
Koudelkahep, and W. Schuhmann, Mikrochim. Acta, 1999,131, 47.
44. C. A. Wijayawardhana, G. Wittstock, H. B. Halsall, and W.R. Heineman, Anal. Chem., 2000, 72, 333.
45. P. J. Elving, J. M. Markowitz, and I. Rosenthal, Anal.Chem., 1956, 28, 1179.
46. D. O. Wipf and A. J. Bard, J. Electrochem. Soc., 1991, 138,469.
47. R. M. Wightman and D. O. Wipf, in “ElectroanalyticalChemistry”, ed. A. J. Bard, 1989, Vol. 15, Marcel Dekker,New York, 267.
48. A. J. Bard, F.-R. F. Fan, and M. V. Mirkin, in“Electroanalytical Chemistry”, ed. A. J. Bard, 1994,Marcel Dekker Inc., New York, 244.
49. D. O. Wipf, Colloid Surf. A, 1994, 93, 251.50. S. Luo and D. R. Walt, Anal. Chem., 1989, 61, 1069.51. P. Allongue, M. Delamar, B. Desbat, O. Fagebaume, R.
Hitmi, J. Pinson, and J.-M. Saveant, J. Am. Chem. Soc.,1997, 119, 201.
52. Y.-C. Liu and R. McCreery, J. Am. Chem. Soc., 1995, 117,
11254.53. W. Kemula and T. M. Krygowski, in “Encyclopedia of
Electrochemistry of the Elements”, ed. A. J. Bard, 1973,Vol. 13, Marcel Dekker Inc., New York, 78.
54. R. S. Deinhammer, M. Ho, J. W. Anderegg, and M. D.Porter, Langmuir, 1994, 10, 1306.
55. W. C. Barrette, Jr., H. W. Johnson, Jr., and D. T. Sawyer,Anal. Chem., 1984, 56, 1890.
56. J. L. Amphlett and G. Denuault, J. Phys. Chem. B, 1998,102, 9946.
57. Q. Fulian, A. C. Fisher, and G. Denuault, J. Phys. Chem. B,1999, 103, 4387.
58. A. Cornish-Bowden and R. Eisenthal, Biochem. J., 1974,139, 721.
59. R. M. Ianniello and A. M. Yacynych, Anal. Chem., 1981,53, 2090.
60. F. R. Shu and S. Wilson, Anal. Chem., 1976, 48, 1679.61. L. D. Mell and J. T. Maloy, Anal. Chem., 1975, 47, 299.62. S. Meltzer and D. Mandler, J. Electrochem. Soc., 1995,
142, L82.63. Y. Xiao, H.-X. Ju, and H.-Y. Chen, Anal. Chim. Acta,
1999, 391, 73.64. H. O. Finklea, in “Electroanalytical Chemistry”, ed. A. J.
Bard and I. Rubinstein, 1996, Vol. 19, Marcel Dekker, NewYork, 110.
65. I. Willner and A. Riklin, Anal. Chem., 1994, 66.66. E. Katz, D. D. Schlereth, H.-L. Schmidt, and A. J. J.
Olsthoorn, J. Electroanal. Chem., 1994, 368, 165.67. E. Katz, V. Heleg-Shabtai, A. Bardea, I. Willner, H. K.
Rau, and W. Haehnel, Biosens. Bioelectron., 1998, 13, 741.68. T. Loetzbeyer, W. Schuhmann, E. Katz, J. Falter, and H.-L.
Schmidt, J. Electroanal. Chem., 1994, 377, 291.69. I. Turyan, T. Matsue, and D. Mandler, Anal. Chem., 2000,
72, 3431.70. R. Bentley, in “The Enzymes”, ed. P. D. Boyer, H. Lardy,
and K. Myrbäck, 1963, Vol. 7, Academic Press, New York,567.
71. I. Shohat and D. Mandler, J. Electrochem. Soc., 1994, 141,995.
72. B. B. Ratcliff, J. W. Klancke, M. D. Koppang, and R. C.Engstrom, Anal. Chem., 1996, 68, 2010.
73. V. V. Mozhaev, I. V. Berezin, and K. Martinek, in“Methods in Enzymology”, ed. K. Mosbach, 1987, Vol.135, Academic Press, New York, 586.
74. K. F. Tipton and H. B. F. Dixon, in “Methods inEnzymology”, ed. D. L. Purich, 1979, Vol. 63, AcademicPress, New York, 183.
35ANALYTICAL SCIENCES JANUARY 2001, VOL. 17