fabrication of a three-dimensional electrochemical paper
TRANSCRIPT

Int. J. Electrochem. Sci., 13 (2018) 6940 – 6957, doi: 10.20964/2018.07.65
International Journal of
ELECTROCHEMICAL SCIENCE
www.electrochemsci.org
Fabrication of a three-dimensional electrochemical paper-based
device (3D-ePAD) for individual and simultaneous detection of
ascorbic acid, dopamine and uric acid
Nongyao Nontawong1, Maliwan Amatatongchai
1*, Wanchai Wuepchaiyaphum
1, Sanoe Chairam
1,
Saichol Pimmongkol2, Sirirat Panich
3, Suparb Tamuang
1 and Purim Jarujamrus
1
1Department of Chemistry and Center of Excellence for Innovation in Chemistry, Faculty of Science,
Ubon Ratchathani University, Ubon Ratchathani 34190, Thailand. 2Department of Physics, Faculty of Science, Ubon Ratchathani University, Ubon Ratchathani 34190,
Thailand. 3Faculty of Science and Technology, RMUTP, Bangkok 10800, Thailand.
*E-mail: [email protected], [email protected]
Received: 23 March 2018 / Accepted: 15 May 2018 / Published: 5 June 2018
We report the development of a three-dimensional electrochemical paper-based analytical device (3D-
ePAD) for the individual and simultaneous determination of ascorbic acid (AA), dopamine (DA) and
uric acid (UA). The device was fabricated by alkyl ketene dimer (AKD)-inkjet printing of a circularly
hydrophobic zone on filter paper for application of aqueous samples coupled with screen-printing of
the electrodes on the paper which was folded underneath hydrophobic zone. A self-assembled three-
electrode system, comprising a graphite paste modified with Fe3O4@Au-Cys/PANI was fabricated on
the patterned paper by screen printed through the pre-designed transparent film slit. The three
electrodes of Fe3O4@Au-Cys/PANI modified graphite electrodes (Fe3O4@Au-Cys/PANI/GFE) on the
layout paper were served as the working electrode, the reference electrode, and the counter electrode,
respectively. Cyclic voltammetry (CV) was used to study the electrochemical mechanism of AA, DA
and UA. The results indicated that a high sensitivity towards AA, DA and UA was observed. Our
results suggested that coating the working electrode with anionic surfactant, SDS (1 mM, pH 2),
provides the distinguishable oxidation peak potential of AA and did not overlap with the oxidation
peak of DA and UA. As a result, simultaneous determination of these three molecules in a mixture can
be achieved. Examples of individual quantification of DA and UA in pharmaceutical and urine
samples were demonstrated using differential pulse voltammetry (DPV). Under the optimum
condition, the developed 3D-ePAD gave a linearity ranged from 20 to 1,000 µM for both DA and UA.
The detection limits were 2.19 and 1.80 µM for DA and UA, respectively. There are no significant
matrix interferences in the analyzed samples which can be concluded that the proposed method is
suitable for the quantification of DA and UA with sufficient accuracy and precision.
Keywords: Three-dimensional electrochemical paper-based device (3D-ePAD), Gold-coated
magnetite (Fe3O4@Au), Polyaniline (PANI), Ascorbic acid, Dopamine, Uric acid

Int. J. Electrochem. Sci., Vol. 13, 2018
6941
1. INTRODUCTION
Dopamine (DA), uric acid (UA) and ascorbic acid (AA) are important compounds of great
biomedical interest, playing an essential role in human metabolism. These compounds commonly exist
in human biological fluids, mainly in serum, blood, and urine. DA is a neurotransmitter within the
central and peripheral nervous systems and always used as the significant clinical biomarker for the
diagnostic function of human metabolism, cardiovascular, renal, hormone and central nervous systems
[1-2]. In a healthy human, DA is found in the brain at ∼50 nmol g-1
and in extracellular fluids at 0.01–
1 µM. Abnormal levels are associated with Parkinson’s disease [1], and Alzheimer’s disease [2]. UA is
the primary end product of purine metabolism while abnormal levels of UA related to symptoms of
several diseases such as gout, hyperuricemia, and Lesch-Nyan illness [3]. This study also set out to
determined AA or vitamin C, which is naturally antioxidants present in some foods such as fruits and
vegetables. The most prominent role of AA is its immune-stimulating effect and preventing many
diseases [4-5]. Therefore, the determination of these compounds is very important in pharmaceutical or
biological fluid samples. Among the analytical methods reported so far for these three compounds
determination, electrochemical technique represents one of the most attractive approaches due to their
high sensitivity, low cost, portability, simplicity and ability to apply as a direct measurement in
biological samples [6-9]. AA usually coexists with DA in extracellular fluid at a high concentration
level, nearly 1,000 times higher than DA. Similarly, UA also recognizes as co-present at higher level
than DA in biological fluids such as blood and urine. Moreover, DA, AA and UA can be oxidized at
practically the similar potentials [6, 7]. Therefore, the peak overlapping as well as the presence at
different level in samples made the selective quantification difficult to achieve. Thus, interference
caused by AA is a challenge for the determination of DA and UA. Attempts to overcome this problem
induced the used of various materials to modify the electrode surface such as polymer, metal or metal-
oxide nanoparticles, and nanocomposites [7-9].
In the last decades, screen printing is a well-known fabrication method for the production of
widely-used screen printed electrodes (SPE), which have been further modified with various materials
by different methods [10-12]. Screen printing technique offers several advantages including low cost,
easy to use, and disposable devices specially designed to work with microvolumes of samples.
Advancements in miniaturization have led to the fabrication of the electrochemical analytical devices
with screen-printing electrode on paper [13-20]. Paper, a commonly material seen in laboratories, has
been extensively exploited as an attractive substrate for the development of cost-effective, disposable
and portable electrochemical paper-based analytical devices (ePADs) [21-23]. Paper substrates offer
many advantages for ePADs. Not only is paper widely available and inexpensive, but it is also
lightweight, flexible, easy to modify chemically, acquire small volume of reagents and samples, and
can be rolled or folded into 3D configurations to allow for more complex operations [13,16, 24].
Herein, we firstly report a 3D electrochemical paper-based analytical device (3D-ePAD) for
detection of dopamine and uric acid in the presence of ascorbic acid by using Fe3O4@Au-Cys/PANI
modified screen printed graphite electrodes. The device was fabricated by AKD inkjet printing to
obtain the twin circular areas of the detection zone and electrode coated sheet. The Fe3O4@Au-
Cys/PANI modified graphite paste was screened on the paper as working, counter and reference
Int. J. Electrochem. Sci., Vol. 13, 2018
6942
electrodes. For analysis, the twin zones are brought into contact by folding the device along the central
crease and double over on itself to form the 3D-ePAD. The Fe3O4@Au-Cys/PANI modified graphite
screen-printed electrode (Fe3O4@Au-Cys/PANI/GFE) achieved selectively and simultaneously
determination of DA and UA in the presence of AA through the use of the anionic surfactant, SDS,
coated on the working electrode. The developed 3D-ePAD was successfully applied for the
determination of DA in intravenous injection solutions and UA in urine samples. This device platform
possesses several advantages, including low cost of material, flexibility, disposability, portability, in–
house fabrication and the possibility for the mass production.
2. MATERIALS AND METHODS
2.1 Reagents and materials
All chemicals were analytical grade and all solutions were prepared in deionized-distilled water
(Water Pro-PS, USA). Dopamine hydrochloride (DA), uric acid (UA), hydrogen
tetrachloroaurate(III)tri-hydrate (HAuCl4•3H2O), 99.99%), N, N’-dicyclohexylcarbodimide (DCC), L-
Cysteine (C3H7NO2S), tri-sodium citrate dihydrate (C6H5Na3O7•2H2O), sodium phosphate monobasic
dihydrate (NaH2PO4·2H2O), sodium phosphate dibasic (Na2HPO4), ferric nitrate nonahydrate
(Fe(NO3)3•9H2O), ferrous sulfate heptahydrate (FeSO4•7H2O) and graphite powder were purchased
from Acros Organic (Geel, Belgium). Ascorbic acid (AA) and filter paper (Whatman no. 1) were
obtained from Sigma–Aldrich (St. Louis, USA). Sodium dodecyl sulfate (SDS) was purchased from
Loba Chemie (Maharashtra, India). All electrochemical measurements were carried out using an
eDAQ potentiostat (EA161) equipped with an e-corder (model 210), and using e-Chem v2.0.13
software.
The solid form of alkyl ketene dimer (AKD wax88 konz), was dissolved in n-heptane (C7H16)
and applied as hydrophobilizing agent on the 3D-ePAD surface. The 3D-ePAD was fabricated from
A4 size Whatman filter paper (No.1) with a thickness of 0.180 mm and pore size of 11 µm by using an
inkjet printer (Canon iP3680) modified with a custom-field printer cartridge containing 3%, w/v AKD
[25].
2.2 Apparatus
Electrochemical measurements were performed on 3D-ePAD using an eDAQ potentiostat
(model EA161, Australia) equipped with e-corder (model 210), and e-Chem software v2.0.13. For
cyclic voltammetry (CV) and differential pulse voltammetry (DPV), we used a self-assembled three-
electrode system, comprising a graphite paste modified with Fe3O4@Au-Cys/PANI as working,
reference and counter electrodes. The carbon paste electrode (CPE) active surface area was
approximately 0.051 cm2. Electrochemical measurements were performed in phosphate buffered
solution (PBS, 0.1 M, pH 7).
A JEM-1230 transmission electron microscope (TEM; JEOL, Japan) was used to observe the
size and morphology of Fe3O4, Fe3O4@Au and Fe3O4@Au-Cys/PANI nanoparticles. Structure and

Int. J. Electrochem. Sci., Vol. 13, 2018
6943
composition of the nanocomposites were evaluated by Fourier transformed infrared (FT-IR)
spectroscopy (Perkin Elmer, USA).
2.3 Synthesis of the Fe3O4@Au-Cys/PANI
2.3.1 Preparation of magnetite nanoparticles (Fe3O4)
Magnetite nanoparticles were prepared by co-precipitation as described in our previous works
[26, 27]. Briefly, Fe(NO3)3.9H2O (0.02 mol) and FeSO4.7H2O (0.01mol) were dissolved in HCl (60
mL 0.2 M) with vigorous stirring under nitrogen atmosphere. NaOH solution (100 mL, 1.0 M) was
then added dropwise to the suspension with vigorous stirring. Stirring was continued for another 2 h.
The resulting black-brown precipitates (Fe3O4) were collected by magnetic decantation, washed three
times with DI water, and then dried in a desiccator.
Although Fe3O4 nanoparticles possess high surface-to-volume ratios, they are easily oxidized in
the air with the trend of highly aggregation, which could reduce conductivity. Therefore, we prepared
gold coated magnetite (Fe3O4@Au) nanoparticles to avoid the aggregation or oxidation and plus
further acquire excellent conductive of the combine nanocomposites. Moreover, gold nanoparticles
also have been reported as superior materials to fabricate sensors because of their catalytic activity,
high stability, easy surface functionalization, and excellent conductivity [26, 28].
2.3.2 Preparation of Fe3O4@Au
Fe3O4@Au nanoparticles were prepared by reducing Au3+
to Au0
on the surface of Fe3O4 using
tri-sodium citrate as previously described [26-28]. Fe3O4 nanoparticles (30 mg) were dispersed in 10
mL deionized (DI) water in an ultrasonic bath for 30 min. The dispersion was transferred to a 250-mL
round-bottom flask containing 40 mL of water. Then, HAuCl4 (20 mL, 0.1%) was added while stirring
vigorously. Stirring was continued while the solution was brought to reflux. Then tri-sodium citrate (4
mL, 1 wt.%) was rapidly added to the boiling solution. The mixture was kept under reflux for further
15 min. During this process, the added Au3+
ion was reduced to Au0 on the Fe3O4 surface, to form red-
brown Fe3O4@Au. The synthesized Fe3O4@Au nanoparticles were separated by magnetic decantation,
washed three times with DI water, and then dried in a desiccator.
2.3.3 Preparation of Fe3O4@Au-Cys
Our synthesis strategy for further acquire excellent conductivity to combined nanocomposites
is based on cysteine (Cys)-conjugated gold-coated magnetite nanoparticles (Fe3O4@Au-Cys) using L-
cysteine as a bi-functional linker for attachment to the gold surface via its thiol group. The red-brown
Fe3O4@Au solution was adjusted to pH 10 using a 1% NH3 solution. Then 5 mL aqueous L-cysteine
(1mM) was added and the mixture was stirred for 24 h at room temperature. The Fe3O4@Au-Cys
nanoparticles were separated using an external magnetic field, washed three times with water by
magnetic decantation, and then dried in a desiccator.
Int. J. Electrochem. Sci., Vol. 13, 2018
6944
2.3.4 Preparation of Fe3O4@Au-Cys/PANI
Method for preparation Fe3O4@Au-Cys/PANI was adopted from the method of Fe3O4@PANI
by T. Wen [29]. Firstly, 30 mg Fe3O4@Au-Cys was dispersed in 30 mL of 1 M HCl by vigorous
stirring and the dispersion solution was stirred for further 15 min. Then 1.5 mL of aniline was added
into the solution and the solution was continuously stirred for 30 min. Subsequently, 3 mL of
ammonium persulfate was added drop wise, and incubated for 3 h at 0-5 ºC. Then the dark green of
Fe3O4@Au-Cys/PANI composites were formed. The nanocomposites were collected by an external
magnetic field, washed by 1 M HCl, ethanol, deionized water sequentially. Finally, the
nanocomposites were dried in a desiccator.
2.3.5 Preparation of Fe3O4@Au-Cys/PANI/GFE
Fe3O4@Au-Cys/PANI modified graphite screen printed electrode (Fe3O4@Au-Cys/PANI/GFE)
was constructed by using this following method. Graphite powder (85 mg) and Fe3O4@Au-Cys/PANI
(15 mg) with mineral oil (60 µL) were hand-mixed in a mortar to form a homogeneous paste.
Subsequently, the composite was screen printed on the detection zone of pattern paper (Fig 1 b)
through the transparent film mask.
2.4 Design and fabrication of a 3D paper-based electrochemical device
Each fabrication method has its own advantages and drawbacks. AKD inkjet printing technique
used in this work are able to produce precise and flexible design with mass production and has been
described to be cost effective in generating hydrophobic zone when compared to other fabrication
techniques [24, 25]. Schematic representation of the fabrication process of the 3D electrochemical
paper-based analytical device (3D-ePAD) is shown in Scheme 1A. Firstly, filter paper (Whatman no.
1) was cut into A4 size (210 mm × 297 mm). In order to define the hydrophilic zones and the path of
the hydrophilic sample solutions, the 3D-ePAD with twin circular shapes (diameter 8 mm) of detection
zone was designed using Microsoft PowerPoint 2016. Then the patterns were printed on the paper with
an AKD inkjet printer. The printed paper was baked in an oven at 105 ºC for 60 min to form
hydrophobic areas to prevent the back-flow or over flowing of solution from the 3D-ePAD. The paper
was allowed to cool at room temperature and cut into pieces. After that screen-printed electrode was
performed. In addition, to keep the alignment of electrodes consistent and precise in position on all
fabricated devices, the patterns of the working electrode (WE), reference electrode (RE) and counter
electrode (CE) mask were pre-designed and printed on the transparent film using a laser printer. The
transparent film layout was cut to form the electrode slits as a designed pattern. Three electrodes were
screen-printed on the AKD patterned paper. The working electrode (WE), the counter electrode (CE)
and the reference electrode (RE) were printed using graphite paste modified with Fe3O4@Au-
Cys/PANI. CE is always designed to be slightly bigger that the WE and RE to allow for the unlimited
current transfer within the current circuit. CE is also placed closely to WE to allow the measurement at

Int. J. Electrochem. Sci., Vol. 13, 2018
6945
working electrode by passing current over it. The printed-paper was baked in an oven at 80 ºC for 60
min to form electrodes.
Scheme 1. (A) Schematic representation of the fabrication process of a 3D-ePAD (a) Patterns printed
on paper. (b) The paper was baking at 105 °C for 120 min and cut into pieces after cooling. (c)
Three-electrode system was screen-printed on the detection zone using graphite paste modified
with Fe3O4@Au-Cys/PANI. (d) The magnification of the detection zone. (B) Schematic
representation of the electrochemical analysis process.
B) Electrochemical
analysis
A) Fabrication of 3D-ePAD
hydrophobic part
hydropillic part

Int. J. Electrochem. Sci., Vol. 13, 2018
6946
2.4.1 Analysis using a 3D paper-based electrochemical device
For analysis, the twin zones are brought into contact by folding the device along the central
crease and double over on itself (Scheme 1B.). The advantages for using the 3D-ePAD design are i)
able to contain greater volume of standard/sample solution, ii) minimize the direct contact between the
fabricated electrodes and sample in sample loading step and iii) very well impregnated of
standard/sample solution on the fabricated electrode because of the paper fiber matrix provide high
surface-to-volume ratio in the detection zone. After that, 20 μL of sample solution was dropped on
detection zone and left to dry. Then 20 µL of 1 mM SDS (in PBS adjusted to pH 2 with 3 M HCl) was
added to the 3D-ePAD and left at ambient temperature to the dryness. The electrochemical
measurements were performed by either CV or DPV via the alligator clips contacted between the
electrodes and the potentiostat.
2.5 Sample preparation
Dopamine (DA) samples, dopamine hydrochloride injection (DHI) solutions (250 mg per 10
mL solution) for intravenous infusion, were obtained from a local pharmacy. Urine samples for UA
determination were collected from volunteer students. The samples were filtered through a 0.25-
micron cellulose membrane and diluted appropriately with 0.1 M PBS. To ascertain the correctness of
the results, real samples were analyzed by the standard addition method and then detected.
3. RESULTS AND DISCUSSION
3.1 Characterization of the Fe3O4@Au-Cys/PANI nanocomposites
The morphology of the different composites was studied by TEM. The TEM samples were
prepared by dispersing the nanocomposites in de-ionized water with an ultra-sonicator and then drying
a drop of the suspension on a copper grid. Fig. 1 (A-C) shows TEM images of (A) the homogenous
dispersion of Fe3O4, (B) Fe3O4@Au and (C) synthesized Fe3O4@Au-Cys/PANI. The synthesized
Fe3O4 (Fig. 1A) nanoparticles appear approximately spherical with an average diameter of 11.3 ± 3.1
nm (count =50). After reduction of Au3+
to Au0 on the Fe3O4 nanoparticle surface, the obtained
nanocomposites (Fig. 1B) appear much darker than the uncoated Fe3O4 nanoparticles (Fig. 1A)
because of heavy atom effects [24-26]. The average Fe3O4@Au nanocomposite diameter is 15.38 ±
2.71 nm (count =50). After modified with PANI, clearly the morphology of the Fe3O4@Au-Cys was
changed by thin film covered with the core particles. TEM images of Fe3O4@Au-Cys/PANI (Fig. 1C)
suggested that the surface of Fe3O4@Au-Cys was coated with PANI.

Int. J. Electrochem. Sci., Vol. 13, 2018
6947
4000 3500 3000 2500 2000 1500 1000 500
617
795
1282
1490
1551
1627
2924
3444
800
1137
1290
1488
1565
6181
406
1634
3412
638
1618
3420
Fe3O
4@Au-Cys/PANI
PANI
Fe3O
4@Au
Fe3O
4
d
c
b
a
Tra
ns
mit
tan
ce (
%)
Wavenumber (cm-1)
D)
C) Fe3O4@Au-Cys/PANI
B) Fe3O4@Au A) Fe3O4
Figure 1. TEM images of (A) Fe3O4, (B) Fe3O4@Au and (C) Fe3O4@Au-Cys/PANI and (D) FT-IR
spectra of a) Fe3O4, b) Fe3O4@Au, c) PANI and d) Fe3O4@Au-Cys/PANI.
FT-IR was used to confirm the composition of the synthesized Fe3O4@Au-Cys/PANI
nanocomposites. Strong evidence of interaction between the nanoparticles and PANI in the composites
was found from FT-IR spectra as shown in Fig. 1D. From the spectrum of pure PANI (curve c), the
bands at 1565, 1488, 1290, 1137 and 800 could be assigned to the C=C stretching of the quinoid ring,
C=C stretching of the benzene ring, C-N stretching of the benzenoid unit, C-N stretching of the
quinoid unit and the plane as well as out-of-plane bending vibration of C-H, respectively. These
characteristic bands demonstrated the successful of polymerization of aniline. Similarly, as it can be
seen in Fe3O4@Au-Cys/PANI nanocomposites, the entire spectrum (curve d) was similar to that of the
Fe3O4@Au (curve b) and pure PANI (curve c). The relevant characteristic peaks (1551, 1490, 1282
and 795) indicated that aniline monomer was successfully polymerized in the Fe3O4@Au-Cys/PANI
nanocomposites. The observation of successful formation of the PANI on the Fe3O4@Au-Cys
nanocomposites is in good agreement of with previous reports for silver nanoparticle/MWCNTs
composites [28] and gold nanoparticle/graphene composites [29].
Int. J. Electrochem. Sci., Vol. 13, 2018
6948
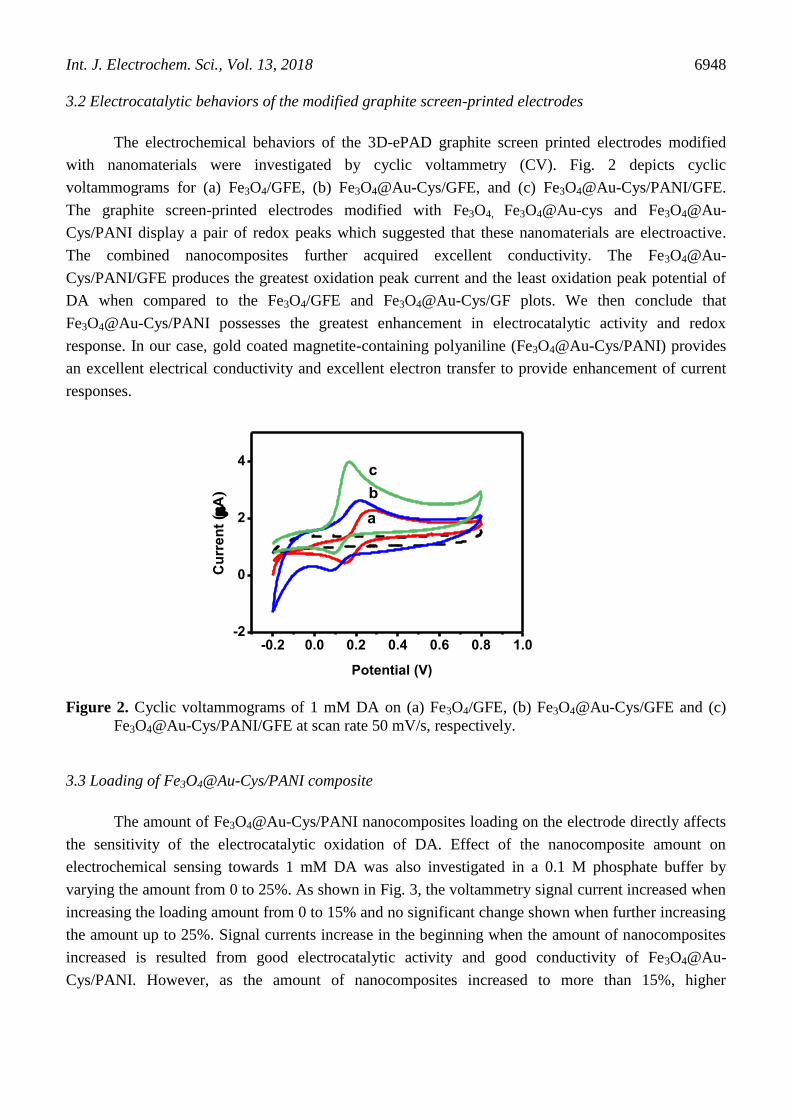
3.2 Electrocatalytic behaviors of the modified graphite screen-printed electrodes
The electrochemical behaviors of the 3D-ePAD graphite screen printed electrodes modified
with nanomaterials were investigated by cyclic voltammetry (CV). Fig. 2 depicts cyclic
voltammograms for (a) Fe3O4/GFE, (b) Fe3O4@Au-Cys/GFE, and (c) Fe3O4@Au-Cys/PANI/GFE.
The graphite screen-printed electrodes modified with Fe3O4, Fe3O4@Au-cys and Fe3O4@Au-
Cys/PANI display a pair of redox peaks which suggested that these nanomaterials are electroactive.
The combined nanocomposites further acquired excellent conductivity. The Fe3O4@Au-
Cys/PANI/GFE produces the greatest oxidation peak current and the least oxidation peak potential of
DA when compared to the Fe3O4/GFE and Fe3O4@Au-Cys/GF plots. We then conclude that
Fe3O4@Au-Cys/PANI possesses the greatest enhancement in electrocatalytic activity and redox
response. In our case, gold coated magnetite-containing polyaniline (Fe3O4@Au-Cys/PANI) provides
an excellent electrical conductivity and excellent electron transfer to provide enhancement of current
responses.
Figure 2. Cyclic voltammograms of 1 mM DA on (a) Fe3O4/GFE, (b) Fe3O4@Au-Cys/GFE and (c)
Fe3O4@Au-Cys/PANI/GFE at scan rate 50 mV/s, respectively.
3.3 Loading of Fe3O4@Au-Cys/PANI composite
The amount of Fe3O4@Au-Cys/PANI nanocomposites loading on the electrode directly affects
the sensitivity of the electrocatalytic oxidation of DA. Effect of the nanocomposite amount on
electrochemical sensing towards 1 mM DA was also investigated in a 0.1 M phosphate buffer by
varying the amount from 0 to 25%. As shown in Fig. 3, the voltammetry signal current increased when
increasing the loading amount from 0 to 15% and no significant change shown when further increasing
the amount up to 25%. Signal currents increase in the beginning when the amount of nanocomposites
increased is resulted from good electrocatalytic activity and good conductivity of Fe3O4@Au-
Cys/PANI. However, as the amount of nanocomposites increased to more than 15%, higher
-0.2 0.0 0.2 0.4 0.6 0.8 1.0-2
0
2
4
a
b
c
A
Cu
rren
t (
A)
Potential (V)

Int. J. Electrochem. Sci., Vol. 13, 2018
6949
100 : 0 97.5 : 2.5 95 : 5 90 : 10 85 : 15 80 : 20 75 : 25
5
10
15
20
25
30
Cu
rre
nt
(A
)
Ratio of Graphite : Fe3O
4@Au-Cys/PANI (%)
background currents were observed and attributed to the steady current signals. Thus, the optimum
ratio between graphite powder and Fe3O4@Au-Cys/PANI nanocomposites is 85:15.
Figure 3. The effect of graphite powder and Fe3O4@Au-Cys/PANI ratio that used to make modified
screen-printed graphite electrode on the current responses.
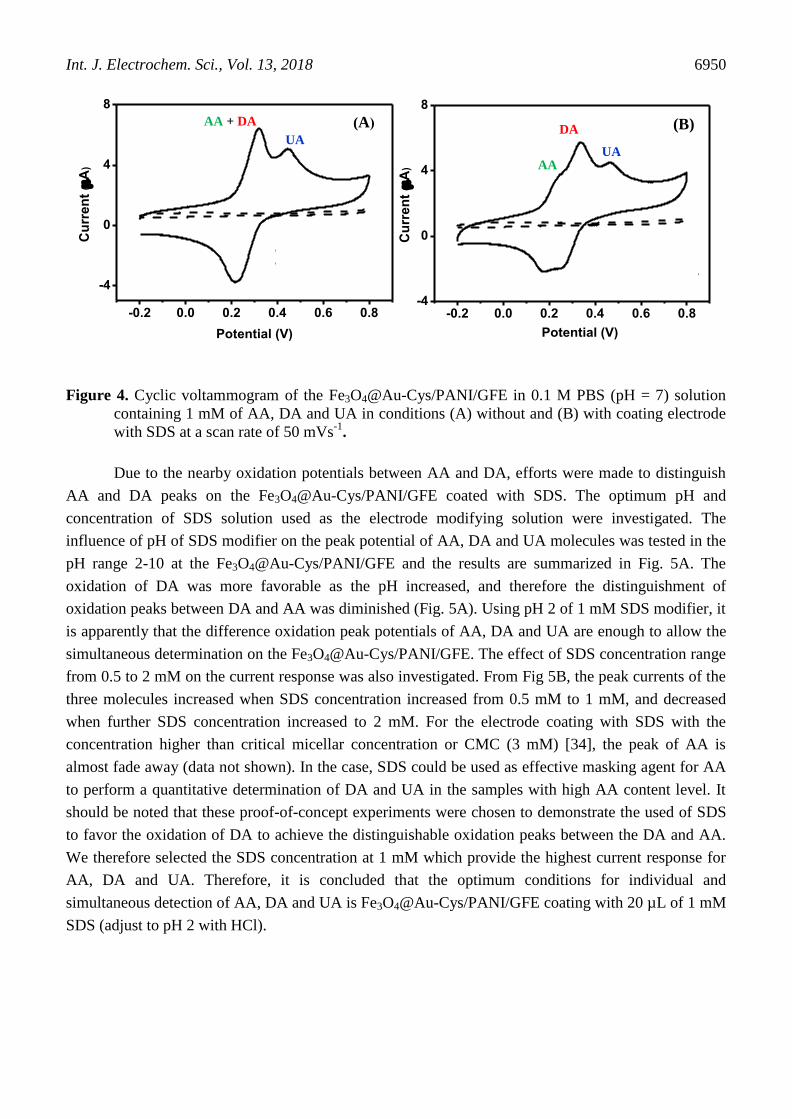
3.4 Coating of the electrode with SDS for the simultaneous determination
In order to test the possibility to determine AA simultaneously DA and UA on the developed
Fe3O4@Au-Cys/PANI/GFE, cyclic voltammogram of 0.1 M PBS (pH = 7) solution containing 1 mM
of AA, DA and UA was investigated. As shown in Fig.4A, overlapping of oxidative potentials between
AA and DA make the electrode unable for direct simultaneous determination. As a result, the anionic
surfactant, sodium dodecyl sulfate (SDS), was dropped casting on the surface of Fe3O4@Au-
Cys/PANI/GFE to differentiate the overlapping peaks. Fig. 4B showed the cyclic voltammogram of
0.1 M PBS containing 1 mM of AA, DA and UA on the Fe3O4@Au-Cys/PANI/GFE coated with SDS.
As could be seen that the separated oxidation peaks for the peak potential of 0.23, 0.32 and 0.44 V for
AA, DA and UA were observed on the electrode with SDS coating. Pure DA shows a quasi-reversible
cyclic voltammogram (Fig. 2, curve c) on the Fe3O4@Au-Cys/PANI/GFE with anodic peak at 0.15 V.
A mixture containing DA shows the anodic peak at 0.23 V (Fig.4A). Using the electrode coated with
the anionic surfactant SDS shifted the DA potential to more positive value from 0.15 to 0.23 V. The
significant shift of the oxidation potential upon the addition of SDS surfactant can be rationalized by
the adsorption of the surfactant at the electrode surface, which may alter the overvoltage of the
electrode and influence the rate of electron transfer that may affect the mass transport of the
electroactive species to the electrode. The oxidation potential shift is presumed to be caused by
preferential electrostatic interactions between the cationic DA and the anionic SDS which accordant to
the previous reports [13, 30-32]
Int. J. Electrochem. Sci., Vol. 13, 2018
6950
Figure 4. Cyclic voltammogram of the Fe3O4@Au-Cys/PANI/GFE in 0.1 M PBS (pH = 7) solution
containing 1 mM of AA, DA and UA in conditions (A) without and (B) with coating electrode
with SDS at a scan rate of 50 mVs-1
.
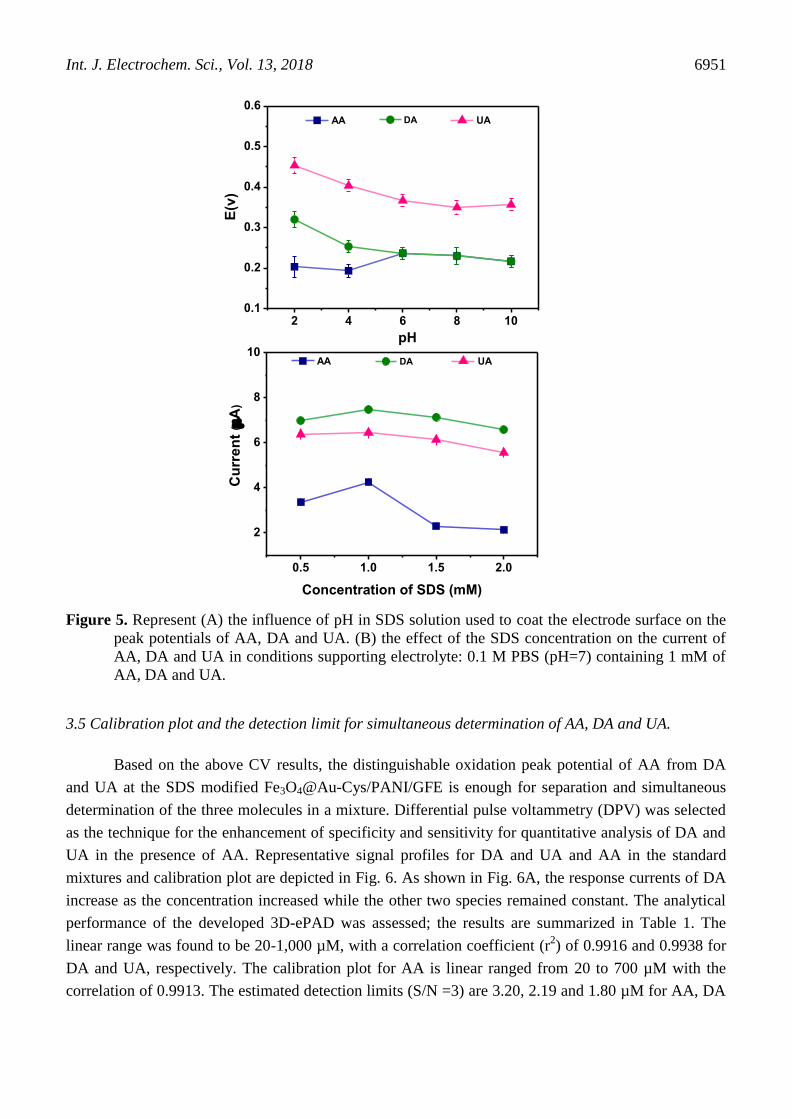
Due to the nearby oxidation potentials between AA and DA, efforts were made to distinguish
AA and DA peaks on the Fe3O4@Au-Cys/PANI/GFE coated with SDS. The optimum pH and
concentration of SDS solution used as the electrode modifying solution were investigated. The
influence of pH of SDS modifier on the peak potential of AA, DA and UA molecules was tested in the
pH range 2-10 at the Fe3O4@Au-Cys/PANI/GFE and the results are summarized in Fig. 5A. The
oxidation of DA was more favorable as the pH increased, and therefore the distinguishment of
oxidation peaks between DA and AA was diminished (Fig. 5A). Using pH 2 of 1 mM SDS modifier, it
is apparently that the difference oxidation peak potentials of AA, DA and UA are enough to allow the
simultaneous determination on the Fe3O4@Au-Cys/PANI/GFE. The effect of SDS concentration range
from 0.5 to 2 mM on the current response was also investigated. From Fig 5B, the peak currents of the
three molecules increased when SDS concentration increased from 0.5 mM to 1 mM, and decreased
when further SDS concentration increased to 2 mM. For the electrode coating with SDS with the
concentration higher than critical micellar concentration or CMC (3 mM) [34], the peak of AA is
almost fade away (data not shown). In the case, SDS could be used as effective masking agent for AA
to perform a quantitative determination of DA and UA in the samples with high AA content level. It
should be noted that these proof-of-concept experiments were chosen to demonstrate the used of SDS
to favor the oxidation of DA to achieve the distinguishable oxidation peaks between the DA and AA.
We therefore selected the SDS concentration at 1 mM which provide the highest current response for
AA, DA and UA. Therefore, it is concluded that the optimum conditions for individual and
simultaneous detection of AA, DA and UA is Fe3O4@Au-Cys/PANI/GFE coating with 20 µL of 1 mM
SDS (adjust to pH 2 with HCl).
-0.2 0.0 0.2 0.4 0.6 0.8
-4
0
4
8
(a)
background
1 mM AA+DA+UA
without SDS
Cu
rre
nt
(A
)
Potential (V)
AA + DA
UA
(A)
)
-0.2 0.0 0.2 0.4 0.6 0.8-4
0
4
8
(b)
Cu
rre
nt
(A
)
Potential (V)
background
1 mM AA+DA+UA
with SDS
DA
UA AA
(B)
Int. J. Electrochem. Sci., Vol. 13, 2018
6951
Figure 5. Represent (A) the influence of pH in SDS solution used to coat the electrode surface on the
peak potentials of AA, DA and UA. (B) the effect of the SDS concentration on the current of
AA, DA and UA in conditions supporting electrolyte: 0.1 M PBS (pH=7) containing 1 mM of
AA, DA and UA.
3.5 Calibration plot and the detection limit for simultaneous determination of AA, DA and UA.
Based on the above CV results, the distinguishable oxidation peak potential of AA from DA
and UA at the SDS modified Fe3O4@Au-Cys/PANI/GFE is enough for separation and simultaneous
determination of the three molecules in a mixture. Differential pulse voltammetry (DPV) was selected
as the technique for the enhancement of specificity and sensitivity for quantitative analysis of DA and
UA in the presence of AA. Representative signal profiles for DA and UA and AA in the standard
mixtures and calibration plot are depicted in Fig. 6. As shown in Fig. 6A, the response currents of DA
increase as the concentration increased while the other two species remained constant. The analytical
performance of the developed 3D-ePAD was assessed; the results are summarized in Table 1. The
linear range was found to be 20-1,000 µM, with a correlation coefficient (r2) of 0.9916 and 0.9938 for
DA and UA, respectively. The calibration plot for AA is linear ranged from 20 to 700 µM with the
correlation of 0.9913. The estimated detection limits (S/N =3) are 3.20, 2.19 and 1.80 µM for AA, DA
0.5 1.0 1.5 2.0
2
4
6
8
10
Cu
rren
t (
A)
UA DA
Concentration of SDS (mM)
AA
2 4 6 8 100.1
0.2
0.3
0.4
0.5
0.6
UA DA
E(v
)
pH
AA

Int. J. Electrochem. Sci., Vol. 13, 2018
6952
and UA, respectively. %RSD calculated from the signals (n=5) of 20 µM of AA, DA and UA was less
than 3.63%. This results suggested that the 3D-ePAD has an excellent precision.
Figure 6. DPV of the Fe3O4@Au-Cys/PANI/GFE under the optimal condition for (A) DA of 20 –
1,000 µM in the co-presence of AA and UA at 80 µM and (B) UA of 20 –1,000 µM in the co-
presence of AA and DA at 80 µM. (C) AA of 20 –700 µM in the co-presence of DA and UA at
80 µM.
Table 1. Analytical performances of the analysis on the developed 3D-ePAD.
AA DA UA
working range (µM) 20 - 700 20 - 1000 20 - 1000
calibration equation y = 0.0034x + 0.3581 Y = 0.0061x + 0.0787 Y = 0.0053x + 0.0559
correlation coefficient 0.9913 0.9916 0.9938 aprecision (%RSD), n=5 3.49 3.63 3.00
blimit of detection (µM) 3.20 2.19 1.80
aCalculated from the signals of 20 µM of AA, DA and UA
bCalculated from (3S/N).
0.0 0.2 0.4 0.6 0.8
0
2
4
6
UA
DA
AA
1000 M
20 M
Cu
rren
t (
A)
Potential (V)
(b)A
0.0 0.2 0.4 0.6 0.8
0
2
4
6UA
DAAA
(c)
Cu
rren
t (
A)
Potential (V)
20 M
1000 M
B
-0.2 0.0 0.2 0.4 0.6 0.8
0
1
2
3
4(a)
700 M
20 M DA UA
AA
Cu
rren
t (
A)
Potential (V)
C

Int. J. Electrochem. Sci., Vol. 13, 2018
6953
Comparisons of the resulted from proposed method with the similar electrochemical methods
are presented in Table 2. As the results showed, the proposed method is comparable to, or better the
reported methods regarding linear range or limit of detection. The use of Fe3O4@Au-Cys/PANI/GFE
also offers a wider range of linearity compared with previously reported for DA [13, 38, 39] and UA
[36, 38, 40] determination, and lower limit of detection when compared with the values previously
reported for DA [37, 39] and UA [35, 40, 41] determination. In addition, the major advantages of the
Fe3O4@Au-Cys/PANI/GFE over previously reported devices are easy, in–house and fast fabrication,
low cost of material, flexibility, portability, and high selectivity for the determination of DA and UA.
Table 2. Comparison of analytical performance of the Fe3O4@Au-Cys/PANI /GFE for determination
of DA and UA, with literature reports of differently modified electrodes.
Method Linear range (µM) Detection limit (µM) Ref
DA UA DA UA
Pyrogallol red/CPE 1-700 50-1000 0.78 35 [35]
PtAu hybrid film/GCE 103 – 1,650 21 - 336 - - [36]
Nf-Fc/GCE 250–5,000 - 22.7 - [37]
Nf/p(FcAni)/CNTsPE 1-150 5-250 0.21 0.58 [38]
CNTs/ePAD 10 -100 - 10 - [39]
SPCE/ePAD 1-100 - 0.37 - [13]
PDE/ ePAD 0.1-700 - 0.04 - [19]
Au/ePAD - 50 - 200 - 20 [40]
carbon ink /ePAD - 30-2,000 - 80 [41]
Fe3O4@Au-Cys/PANI
GFE/ePAD 20-1,000 20-1,000 2.19 1.80 this work
CPE= carbon paste electrode, PtAu = platinum and gold, GCE=glassy carbon electrode, Nf-Fc = ferrocene bound Nafion,
Nf/p(FcAni)= Nafion /poly(m-ferrocenylaniline), CNTsPE= carbon nanotubes paste electrode, CNTs = multi walled carbon
nanotubes, ePAD = electrochemical paper-based analytical devices, SPCE = screen printed carbon electrode, PDE = pencil-
drawing electrode, Au =gold, Fe3O4@Au-Cys/PANI/GFE = Cysteine-gold coated magnetite nanoparticles core coated with
polyaniline modified graphite screen printed electrode.
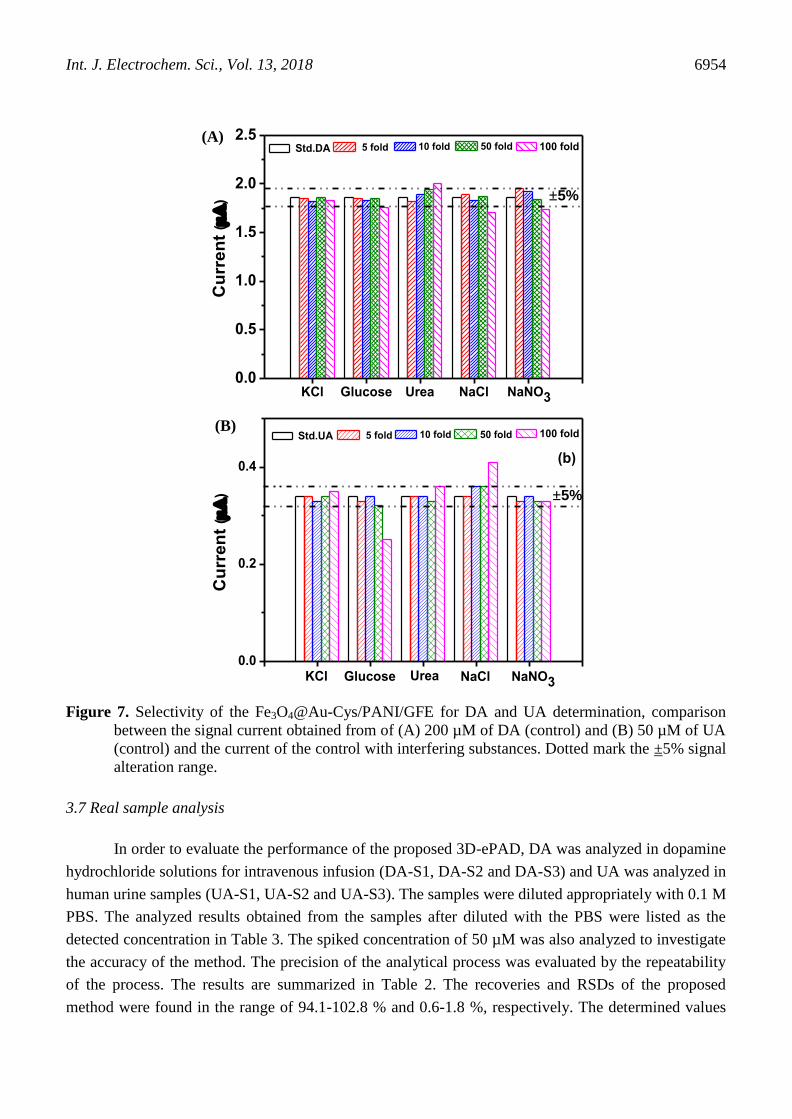
3.6 Interference studies
We performed interference studies on the determination of DA and UA at the Fe3O4@Au-
Cys/PANI/GFE using DPV. The DA and UA concentrations were maintained at 200 µM and 50 µM.
Interfering species were added to the test solution in the range of 5–100 fold greater concentration than
that of DA and UA shown in Fig. 7. The tolerance limit was taken as the amount of substance needed
to cause a signal alteration of greater than ± 5%. According to our results (Fig.7), glucose and KCl do
not interfere the DA determination for studied up to 100-fold concentration. While urea, NaCl and
NaNO3 produce very low interference signals and do not interfere at 50 fold with respect to DA. In
addition, KCl, urea and NaNO3 also do not interfere with the UA determination studied up to 100-fold.
Whereas, glucose and NaCl do not interfere with UA determination at 50- fold with respect to UA.
This finding indicates that the Fe3O4@Au-Cys/PANI/GFE provides an acceptable selectivity for the
determination of DA and UA in real samples.
Int. J. Electrochem. Sci., Vol. 13, 2018
6954
Figure 7. Selectivity of the Fe3O4@Au-Cys/PANI/GFE for DA and UA determination, comparison
between the signal current obtained from of (A) 200 µM of DA (control) and (B) 50 µM of UA
(control) and the current of the control with interfering substances. Dotted mark the ±5% signal
alteration range.
3.7 Real sample analysis
In order to evaluate the performance of the proposed 3D-ePAD, DA was analyzed in dopamine
hydrochloride solutions for intravenous infusion (DA-S1, DA-S2 and DA-S3) and UA was analyzed in
human urine samples (UA-S1, UA-S2 and UA-S3). The samples were diluted appropriately with 0.1 M
PBS. The analyzed results obtained from the samples after diluted with the PBS were listed as the
detected concentration in Table 3. The spiked concentration of 50 µM was also analyzed to investigate
the accuracy of the method. The precision of the analytical process was evaluated by the repeatability
of the process. The results are summarized in Table 2. The recoveries and RSDs of the proposed
method were found in the range of 94.1-102.8 % and 0.6-1.8 %, respectively. The determined values
0.0
0.2
0.4
NaNO3NaClUreaGlucose
Cu
rren
t (
)
100 fold 50 fold 10 fold 5 fold Std.UA
(b)
KCl
0.0
0.5
1.0
1.5
2.0
2.5
NaNO3NaClUreaGlucoseKCl
(a)
100 fold 50 fold 10 fold 5 fold Std.DA
Cu
rren
t (
) ±5%
±5%
(A)
(B)

Int. J. Electrochem. Sci., Vol. 13, 2018
6955
from the samples obtained from our proposed method are listed as the “amount contained” in Table 3.
As can be seen in Table 3 the determined values from our method compared well with reference values
obtained from DA labelled value (250 mg/dm3) and UA contents obtained from hospital results. The
relative differences between data obtained from the 3D-ePAD and that derived from reference values
are in the range of 0.1-2.6% and 1.1-2.7% for DA and UA, respectively. These results indicated that
there are no significant matrix interferences in the analyze samples as well as this presented method is
sufficiently accurate, precise and suitable for the quantification of DA and UA in the mentioned
samples.
Table 3. DA and UA concentration in different samples (n=3) obtained from the proposed method and
the reference values.
Samplea
Recovery study Validation
Detected
(µM)b
Found
(µM)c
Recovery
(%)
Amount contained
(mg/dm3)
Reference
values
(mg/dm3)
Relative
errord
(%)
DA-S1 100.2 ± 0.7 153.2 ± 1.5 101.2 ± 1.8 250.33 ± 0.02
250
+0.13
DA-S2 97.6 ± 0.9 146.9 ± 1.3 94.1 ± 0.6 244.45 ± 0.02 -2.22
DA-S3 97.1 ± 1.4 148.6 ± 1.2 98.3 ± 1.3 243.63 ± 0.02 -2.55
UA-S1 112.8 ± 0.4 160.4 ± 1.7 100.3 ± 1.6 1.90 ± 0.04 1.95 -2.56
UA-S2 424.6 ± 1.4 473.3 ± 1.1 102.8 ± 1.0 7.13 ± 0.08 7.31 -2.46
UA-S3 114.8 ± 0.3 161.3 ± 0.9 97.4 ± 1.5 1.93 ± 0.04 1.91 +1.05
aDA-S1- DA-S3 are injection solutions and UA-S1- UA-S3 are urine samples.
bAmount found in the samples after dilution, X ± S.D.
cAmount found after spiked either 50 µM of DA or UA
d DA contents form the samples compared with labeled value [250 mg (dm
3)
-1] and UA contents compared with value
obtained from hospital results.
4. CONCLUSION
This study has indicated that the Fe3O4@Au-Cys/PANI/GFE exhibits electrocatalytic activity
to AA, DA, and UA oxidation. The fabricated electrode not only improved the electrochemical
catalytic oxidation of AA, DA, and UA but also resolved the overlapping anodic peaks when coating
with SDS (1 mM, pH 2). The Fe3O4@Au-Cys/PANI/GFE in 3D-ePAD platform exhibits high
sensitivity and selectivity in individual and simultaneous determination of AA, DA and UA. The
developed 3D-ePAD gave a linearity ranged of 20-1,000 with detection limit of 2.19 and 1.80 µM for
DA and UA, respectively. This 3D-ePAD has successfully applied for DA and UA determination with
sufficiently accurate and precise results in pharmaceutical and urine samples. The results demonstrated
that our fabricated 3D-ePAD possess many advantages including an easy to-use, inexpensive, and
portable alternative for point of care monitoring. In addition, our developed 3D-ePAD are expected to
be a pioneer platform for the development of other interesting analytes with a broad range of
applications.

Int. J. Electrochem. Sci., Vol. 13, 2018
6956
ACKNOWLEDGMENTS
Financial support from the National Research Council of Thailand (NRCT:2560A11702005), the
Center of Excellence for Innovation in Chemistry (PERCH-CIC), Office of the Higher Education
Commission (OHEC), Ministry of Education are gratefully acknowledged. Science Achievement
Scholarship of Thailand (SAST) given to N. N. is also acknowledgements. The authors also would like
to thank Department of Chemistry, Faculty of Science, Ubon Ratchathani University for research
instrumental facility.
References
1. P. Song, O. S. Mabrouk, N. D. Hershey and R. T. Kennedy, Anal. Chem., 84 (2012) 412.
2. J. Bicker, A. Fortuna, G. Alves and A. Falcão, Anal. Chim. Acta, 768 (2013) 12.
3. V. V. S. E. Dutt and H. A. Mottola, Anal. Chem., 46 (1974) 1777.
4. J. Du, J. J. Cullen and G. R. Buettner, Biochim. Biophys. Acta, 1826 (2012) 443.
5. C. André, I. Castanheira, J. M. Cruz, P. Paseiro and A. Sanches-Silva, Trends Food Sci Technol.,
21 (2010) 229.
6. H. Wang, F. Ren, C. Wang, B. Yang, D. Bin, K. Zhang and Y. Du, RSC Advances., 4 (2014)
26895.
7. Y. Zhao, Y. Gao, D. Zhan, H. Liu, Q. Zhao, Y. Kou, Y. Shao, M. Li, Q. Zhuang and Z. Zhu,
Talanta, 66 (2005) 51.
8. A. A. Ensafi, M. Taei and T. Khayamian, Int. J. Electrochem. Sci., 5 (2010) 116.
9. J. Jiang and X. Du, Nanoscale., 6 (2014) 11303.
10. C. Karuwan, A. Wisitsoraat, D. Phokharatkul, C. Sriprachuabwong, T. Lomas, D. Nacapricha and
A. Tuantranont, RSC Adv., 3 (2013) 25792.
11. M. Trojanowicz, A. Mulchandani and M. Mascini, Anal. Lett., 37 (2004) 3185.
12. K. F. Chan, H. N. Lim, N. Shams, S. Jayabal, A. Pandikumar and N. M. Huang, Mater. Sci. Eng.
C., 58 (2016) 666.
13. P. Rattanarat, W. Dungchai, W. Siangproh, O. Chailapakul and C. S. Henry, Anal. Chim. Acta, 744
(2012) 1.
14. M. Santhiago and L. T. Kubota, Sens Actuators B Chem., 177 (2013) 224.
15. S. H. Lee, J. H. Lee, V.-K. Tran, E. Ko, C. H. Park, W. S. Chung and G. H. Seong, Sens Actuators
B Chem., 232 (2016) 514.
16. W. Dungchai, O. Chailapakul and C. S. Henry, Anal. Chem., 81 (2009) 5821.
17. S. Ge, L. Zhang, Y. Zhang, H. Liu, J. Huang, M. Yan and J. Yu, Talanta, 145 (2015) 12.
18. Z. Nie, C. A. Nijhuis, J. Gong, X. Chen, A. Kumachev, A. W. Martinez, M. Narovlyansky and G.
M. Whitesides, Lab Chip., 10 (2010) 477.
19. W. Li, D. Qian, Y. Li, N. Bao, H. Gu and C. Yu, J. Electroanal. Chem., 769 (2016) 72.
20. W. Li, D. Qian, Q. Wang, Y. Li, N. Bao, H. Gu and C. Yu, Sens Actuators B Chem., 231 (2016)
230.
21. J. A. Adkins and C. S. Henry, Anal. Chim. Acta, 891 (2015) 247.
22. A. K. Yetisen, M. S. Akram and C. R. Lowe, Lab Chip., 13 (2013) 2210.
23. D. M. Cate, J. A. Adkins, J. Mettakoonpitak and C. S. Henry, Anal. Chem., 87 (2015) 19.
24. J. C. Cunningham, P. R. Degregory and R. M. Crooks, Ann. Rev. Anal. Chem.,9 (2016) 183.
25. X. Li, J. tian, G. Garnier and W. Shen, Colloids Surf B Biointerfaces, 76 (2010) 564.
26. W. Sroysee, K. Ponlakhet, S. Chairam, P. Jarujamrus and M. Amatatongchai, Talanta, 156-157
(2016) 154.
27. K. Ponlakhet, M. Amatatongchai, W Sroysee, P. Jarujamrus and S. Chairam, Anal. Methods, 8
(2016) 8288.
Int. J. Electrochem. Sci., Vol. 13, 2018
6957
28. S. Karamipour, M. S. Sadjadi and N. Farhadyar, Spectrochim. Acta Mol. Biomol. Spectrosc., 148
(2015) 146.
29. T. Wen, W. Zhu, C. Xue, J. Wu, Q. Han, X. Wang, X. Zhou and H. Jiang, Biosens. Bioelectron., 56
(2014) 180.
30. J. Li, D. Zhang, J-B. Guo and J. Wei, Chinese Journal of Chemical Physic, 27 (2014) 718.
31. Y. P. Dong,Y. Zhou, Y. Ding, X. F.Chu and C. M.Wang, Anal. Methods, 6(2014) 9367.
32. G. Alarcón-Angeles, S. Corona-Avendaño, M. Palomar-Pardavé, A. Rojas-Hernández, M. Romero-
Romo and M. T. Ramírez-Silva, Electrochim. Acta., 53 (2008) 3013.
33. X.-L. Wen, Y.-H. Jia and Z.-L. Liu, Talanta, 50 (1999) 1027.
34. J. G. Manjunatha, M. Deraman, N. H. Basri, N. S. M. Nor, I. A. Talib and N. Atoallahi, C. R.
Chimie, 17 (2014) 405.
35. A. A. Ensafi, A. Arabzadeh and H. Karimi-Maleh, Anal. Lett., 43 (2010) 1976.
36. S. Thiagarajan and S. M. Chen, Talanta, 74 (2007) 212.
37. A. S. Kumar, P. Swetha and K. C. Pillai, Anal. Methods, 2 (2010) 1962.
38. W. Sroysee , S. Chairam, M. Amatatongchai, P. Jarujamrus , S. Tamuang, S. Pimmongkol, L.
Chaicharoenwimolkul and E. Somsook, J. of Saudi Chem. Soc., 22 (2018) 173.
39. T. H. da Costa, E. Song, R. P. Tortorich and J.-W. Choi, ECS J. Solid State Sci. Technol., 4 (2015)
S3044.
40. R. F. Carvalhal, M. Simão Kfouri, M. H. de Oliveira Piazetta, A. L. Gobbi and L. T. Kubota, Anal.
Chem., 82 (2010) 1162.
41. Y. Yao and C. Zhang, Biomed Microdevices, 18 (2016) 92.
© 2018 The Authors. Published by ESG (www.electrochemsci.org). This article is an open access
article distributed under the terms and conditions of the Creative Commons Attribution license
(http://creativecommons.org/licenses/by/4.0/).