fate of free, “masked” and conjugated
TRANSCRIPT

Fate of Free, “Masked” and Conjugated/M
odified forms of M
ycotoxins • Michele Sum
an
Fate of Free, “Masked” and Conjugated/Modified forms of Mycotoxins
Printed Edition of the Special Issue Published in Toxins
www.mdpi.com/journal/toxins
Michele SumanEdited by

Fate of Free, “Masked” and Conjugated/Modified forms of Mycotoxins


Fate of Free, “Masked” and Conjugated/Modified forms of Mycotoxins
Editor
Michele Suman
MDPI • Basel • Beijing • Wuhan • Barcelona • Belgrade • Manchester • Tokyo • Cluj • Tianjin

Editor
Michele Suman
Barilla G. R. F.lli SpA,
Advanced Laboratory Research
Italy
Editorial Office
MDPI
St. Alban-Anlage 66
4052 Basel, Switzerland
This is a reprint of articles from the Special Issue published online in the open access journal Toxins
(ISSN 2072-6651) (available at: https://www.mdpi.com/journal/toxins/special issues/Masked
Conjugated Mycotoxins).
For citation purposes, cite each article independently as indicated on the article page online and as
indicated below:
LastName, A.A.; LastName, B.B.; LastName, C.C. Article Title. Journal Name Year, Volume Number,
Page Range.
ISBN 978-3-0365-0158-1 (Hbk)
ISBN 978-3-0365-0159-8 (PDF)
Cover image courtesy of Michele Suman.
© 2021 by the authors. Articles in this book are Open Access and distributed under the Creative
Commons Attribution (CC BY) license, which allows users to download, copy and build upon
published articles, as long as the author and publisher are properly credited, which ensures maximum
dissemination and a wider impact of our publications.
The book as a whole is distributed by MDPI under the terms and conditions of the Creative Commons
license CC BY-NC-ND.

Contents
About the Editor . . . . . . . . . . . . . . . . . . . . . . . . . . . . . . . . . . . . . . . . . . . . . . vii
Michele Suman
Fate of Free and Modified Forms of Mycotoxins during Food ProcessingReprinted from: Toxins 2020, 12, 448, doi:10.3390/toxins12070448 . . . . . . . . . . . . . . . . . . 1
Huijie Zhang, Li Wu, Weixi Li, Yan Zhang, Jingmei Li, Xuexu Hu, Lijuan Sun, Wenming Du
and Bujun Wang
Conversion of Deoxynivalenol-3-Glucoside to Deoxynivalenol during Chinese SteamedBread ProcessingReprinted from: Toxins 2020, 12, 225, doi:10.3390/toxins12040225 . . . . . . . . . . . . . . . . . . 5
Edyta Ksieniewicz-Wozniak, Marcin Bryła, Agnieszka Waskiewicz, Tomoya Yoshinari and
Krystyna Szymczyk
Selected Trichothecenes in Barley Malt and Beer from Poland and an Assessment of DietaryRisks Associated with their ConsumptionReprinted from: Toxins 2019, 11, 715, doi:10.3390/toxins11120715 . . . . . . . . . . . . . . . . . . 13
Michele Suman, Silvia Generotti, Martina Cirlini and Chiara Dall’Asta
Acrylamide Reduction Strategy in Combination with Deoxynivalenol Mitigation in IndustrialBiscuits ProductionReprinted from: Toxins 2019, 11, 499, doi:10.3390/toxins11090499 . . . . . . . . . . . . . . . . . . 29
Barbara De Santis, Francesca Debegnach, Brunella Miano, Giorgio Moretti, Elisa Sonego,
Antonio Chiaretti, Danilo Buonsenso and Carlo Brera
Determination of Deoxynivalenol Biomarkers in Italian Urine SamplesReprinted from: Toxins 2019, 11, 441, doi:10.3390/toxins11080441 . . . . . . . . . . . . . . . . . . 41
Vincenzo Lippolis, Anna C. R. Porricelli, Erminia Mancini, Biancamaria Ciasca, Veronica M.T. Lattanzio, Annalisa De Girolamo, Chris M. Maragos, Susan McCormick, Peiwu Li, Antonio F. Logrieco and Michelangelo Pascale
Fluorescence Polarization Immunoassay for the Determination of T-2 and HT-2 Toxins and Their Glucosides in WheatReprinted from: Toxins 2019, 11, , doi:10.3390/toxins11070380 . . . . . . . . . . . . . . . . . . . . 57
Igor Jajic, Tatjana Dudas, Sasa Krstovic, Rudolf Krska, Michael Sulyok, Ferenc Bagi, Zagorka Savic, Darko Guljas and Aleksandra Stankov
Emerging Fusarium Mycotoxins Fusaproliferin, Beauvericin, Enniatins, and Moniliformin in Serbian MaizeReprinted from: Toxins 2019, 11, 357, doi:10.3390/toxins11060357 . . . . . . . . . . . . . . . . . . 71
Franziska Sueck, Vanessa Hemp, Jonas Specht, Olga Torres, Benedikt Cramer and
Hans-Ulrich Humpf
Occurrence of the Ochratoxin A Degradation Product 2′R-Ochratoxin A in Coffee and OtherFood: An UpdateReprinted from: Toxins 2019, 11, 329, doi:10.3390/toxins11060329 . . . . . . . . . . . . . . . . . . 85
David Stadler, Francesca Lambertini, Lydia Woelflingseder, Heidi Schwartz-Zimmermann,
Doris Marko, Michele Suman, Franz Berthiller and Rudolf Krska
The Influence of Processing Parameters on the Mitigation of Deoxynivalenol duringIndustrial BakingReprinted from: Toxins 2019, 11, 317, doi:10.3390/toxins11060317 . . . . . . . . . . . . . . . . . . 95
v

Sheryl A. Tittlemier, Dainna Drul, Mike Roscoe, Dave Turnock, Dale Taylor and Bin Xiao Fu
Fate of Ergot Alkaloids during Laboratory Scale Durum Processing and Pasta ProductionReprinted from: Toxins 2019, 11, 195, doi:10.3390/toxins11040195 . . . . . . . . . . . . . . . . . . 113
Sara Schaarschmidt and Carsten Fauhl-Hassek
Mycotoxins during the Processes of Nixtamalization and Tortilla ProductionReprinted from: Toxins 2019, 11, 227, doi:10.3390/toxins11040227 . . . . . . . . . . . . . . . . . . 125
vi

About the Editor
Michele Suman was born in Rovigo, Italy, in 1973. He is married with two children. Michele
graduated with a degree in Analytical Chemistry, Summa Cum Laude, from the University of Ferrara
in 1997. He won the National Prize for Young Researchers promoted by the Italian Chemistry
Federation (Federchimica) in 1998. He then completed a master’s degree in 1998 (Master in Science,
Technology and Management from University of Ferrara), while simultaneously working at the
”Natta Research Center” of Shell-Montell Polyolefins, and a doctorate in 2005 (Ph.D. in Science
and Technology of Innovative Materials from University of Parma) He landed in the role of Food
Safety & Authenticity Research Manager of the Barilla Spa company in 2003. Here he has been
working in an international context with public and private research centers organizations on
research projects within the field of food chemistry, food safety-quality-authenticity, food contact
materials, sensing and mass spectrometry applications for food products. He is Chair of the Italian
National Normative Organization (UNI) Food Authenticity Working Group, a member of working
groups for Biotoxins-Processing Contaminants-Food Authenticity in the European Committee for
Standardization (CEN), Chair of the ILSI Process Related Compounds & Natural Toxins Task Force,
a member of the Scientific Committee of Italian National Cluster Agrifood, a member of the Board of
Mass Spectrometry Division – Italian Chemistry Society from 2014 to 2019, a member of the Scientific
Board of Italian Chemistry Society—Food Chemistry Inter-divisional Group, and on the editorial
boards of important peer-reviewed journals (World Mycotoxin Journal, Food Additives and Contaminants,
etc.). He has been involved in various National/European funded projects and, presently, he
is the WP Leader of the EU-FP7 FoodIntegrity Project and part of the EU-H2020 MyToolBox
projects. He has experience in academic teaching activities, masters Ph.D. projects supervision,
coordination/chairmanship of international conferences (Recent Advances in Food Analysis, World,
Mycotoxins Forum, FoodIntegrity, MS Food Day, Rapid Methods Europe, and International Mass
Spectrometry Conference). He is Adjunct Professor of AgriFood Authenticity at Catholic University
of the Sacred Heart – Milan/Piacenza (Italy). His scientific production is documented by 7 books
(editor/chapters), more than 150 contributions at national and international conferences, and more
than 90 papers in international ISI journals.
vii

toxins
Editorial
Fate of Free and Modified Forms of Mycotoxinsduring Food Processing
Michele Suman
Barilla G. R. F.lli SpA, Advanced Research Labs, via Mantova 166, 43122 Parma, Italy;[email protected]
Received: 22 May 2020; Accepted: 2 July 2020; Published: 10 July 2020
International trade is highly affected by mycotoxin contaminations, which result in an annual5% to 10% loss of global crop production [1]. In the last decade, the mycotoxin scenario has beencomplicated through the progressive understanding—beside emerging mycotoxins—of the parallelpresence of modified (masked and conjugated) forms, in addition to the previously free known ones.
The present Toxins Special Issue provides original research papers and reviews that deal with thefates of all these forms of mycotoxins, with respect to aspects that cover traditional and industrial foodprocessing, yearly grain campaign peculiar conditions and management, novel analytical solutions,consumer exposure, and biomarkers-assessment directions.
Among emerging mycotoxins, Fusarium ones, such as fusaproliferin (FUS), beauvericin (BEA),enniatins (ENNs), and moniliformin (MON) are discussed within the Serbian maize context by Jajic et al.,highlighting exactly the economic impact of these mycotoxins in terms of the yield and quality of grainalong different yearly campaigns [2]. MON, BEA and FUS are indicated as being major contaminantsin more than half of the analyzed samples, and are considered in strict connection with climate changeconsequences which surely must be taken into account more and more in the future.
Mechanical & thermal energy involved in food processing determine changes into mycotoxinforms and the creating or destroying of new bonds with other food components: a clear exampleis reported by Zhang et al., describing the conversion of deoxynivalenol-3-glucoside (DON-3G) todeoxynivalenol (DON) during Chinese steamed bread processing, along the fermentation and steamingsteps. Mechanical friction and shear seem to play roles which lead to these mycotoxins’ structuralchanges, but only in combination with other parallel factors probably related to ingredients andcomplex physico-chemical modifications that occur and need further investigation [3].
In a global scenario, Schaarschmidt and Fauhl-Hassek consider South American atmospheresand traditions with their review about mycotoxins’ changes during the processes of nixtamalizationand tortilla production [4]. Alkaline cooking has been proven effective for reducing aflatoxins andfumonisins in cooked maize and tortillas, even if acidic conditions could partially reverse this process.
These phenomena must be deeply understood in the future for assuring that the benefits concerningthe formation of low toxic hydrolyzed fumonisins are not negatively balanced out by the parallelformation of other toxicologically relevant modified and matrix-associated forms.
Remaining in the context of bakery products, can we properly design and optimize industrialbaking conditions to mitigate processing contaminants and mycotoxins, while not heavily affectingthe organoleptic aspects, in one single shot? The answer of Suman et al. is yes! This answer iscorroborated by scientific evidence on how acrylamide concentration may be influenced by wholegrainand cocoa biscuit bakery-making parameters within a parallel strategy of DON mitigation, highlightinga significant role of pH, followed by the baking time/temperature parameters [5].
Stadler et al. focus their attention on bakery production and in particular on the optimization ofrecipes and processing parameters at an industrial scale, devoted to the mitigation of the main mycotoxincontaminant in the common wheat chain: DON [6]. DON degradation is accurately quantified inindustrially made crackers, biscuits, and bread, showing how degradation (setting properly raising
Toxins 2020, 12, 448; doi:10.3390/toxins12070448 www.mdpi.com/journal/toxins1

Toxins 2020, 12, 448
agents and baking times/temperatures) means, practically, conversion into a less toxic isomeric product(isoDON), with correspondingly positive implications towards the safety of the final consumer withregard to these commodities, with respect to the original contamination of the exploited raw material.
Moving from bakery production to meal solutions, Tittlemier et al. show changes into ergotalkaloids pattern along the durum wheat pasta production chain. More than 80% of the total ergotalkaloids are confined into outer kernel layers after milling; ergocristine, ergocristinine, and ergotamineremain the predominant components which do not also decrease after pasta production and cookingsteps. Besides, the milling and cooking of pasta alters the ratio of R- to S-enantiomers; this epimerizationresults in a higher final concentration of the less biologically active S-enantiomers in boiled spaghetti [7].
Sueck et al. rightly consider some doubts regarding the real effect of thermal processing in foodcommodities such as coffee or bread; this does not always imply a degrading/detoxifying action,but, in some instances, determines the formation of unexpected forms, the toxicological definitiveevaluations that would permit an adequate overall risk assessment for which are still missing. In theirrecent study, they specifically demonstrate the generation of the isomerization product, 20R-ochratoxinA (20R-OTA), from ochratoxin A (OTA) [8].
Ksieniewicz-Wozniak et al. are keen on the consumers’ exposure scenario, looking into the beerproduction chain, demonstrating that, within Fusarium mycotoxins, DON and its main metaboliteDON-3G, among the samples analyzed, are present practically everywhere [9]. Then, nivalenol (NIV)and nivalenol-3-glucoside (NIV-3G) were also found to be largely present in both malt samples andbeers. Their conclusion sounds like a warning: Fusarium mycotoxins should not be overlooked incountries with a very high beer consumption. In the worst-case scenario the probable daily intake(PDI) would exceed the tolerable daily intake (TDI) with only one half-liter bottle!
De Santis et al. provide relevant findings about the useful exploitation of urinary DON and itsglucuronide and de-epoxydated (DOM-1) forms as biomarkers for exposure assessment purposes,permitting us to identify particularly vulnerable categories, such as children and adolescent agegroups [10].
Finally, there is the evident necessity for all the stakeholders (from authorities, to control bodiesand food business operators) to dispose of rapid and easy-to-use methods for the determinationof free and modified forms of toxins in raw materials; Lippolis et al. propose here a fluorescencepolarization immunoassay (FPIA) for the simultaneous determination of T-2 toxin, HT-2 toxin andrelevant glucosides, expressed as sum, exploiting a HT-2-specific antibody with high sensitivity andhigh cross-reactivity towards the different forms present in cereals [11]. This analytical method iscompliant with harmonized guidelines for the validation of screening methods recently stated byEuropean regulations.
I would like to congratulate and thank all the authors involved in this special issue of Toxinsand I hope you enjoy reading its contents; it gives a taste of an exciting scientific field which hasseveral implications into our daily life, because (i) it covers our diet practically and from every pointof view, (ii) it intersects our culinary uses and customs, but also industrial production processes,and (iii) it involves a careful evaluation of costs and benefits and a constant continuous improvementof mitigation strategies. There will still be a lot to see and discover in the coming years!
Funding: This research received no external funding.
Conflicts of Interest: The author declares no conflict of interest.
References
1. EC. European Commission Decision C 2453: Horizon 2020 Work Programme 2014–2015: Food Security,Sustainable Agriculture and Forestry, Marine and Maritime and Inland Water Research and Bioeconomy(Revised). 2015. Available online: https://ec.europa.eu/research/participants/data/ref/h2020/wp/2014_2015/main/h2020-wp1415-food_en.pdf (accessed on 7 June 2020).
2

Toxins 2020, 12, 448
2. Jajic, I.; Dudaš, T.; Krstovic, S.; Krska, R.; Sulyok, M.; Bagi, F.; Savic, Z.; Guljaš, D.; Stankov, A. EmergingFusarium Mycotoxins Fusaproliferin, Beauvericin, Enniatins, and Moniliformin in Serbian Maize. Toxins2019, 11, 357. [CrossRef]
3. Zhang, H.; Wu, L.; Li, W.; Zhang, Y.; Li, J.; Hu, X.; Sun, L.; Du, W.; Wang, B. Conversion of Deoxynivalenol-3-Glucoside to Deoxynivalenol during Chinese Steamed Bread Processing. Toxins 2020, 12, 225. [CrossRef][PubMed]
4. Schaarschmidt, S.; Fauhl-Hassek, C. Mycotoxins during the Processes of Nixtamalization and TortillaProduction. Toxins 2019, 11, 227. [CrossRef] [PubMed]
5. Suman, M.; Generotti, S.; Cirlini, M.; Dall’Asta, C. Acrylamide Reduction Strategy in Combination withDeoxynivalenol Mitigation in Industrial Biscuits Production. Toxins 2019, 11, 499. [CrossRef] [PubMed]
6. Stadler, D.; Lambertini, F.; Woelflingseder, L.; Schwartz-Zimmermann, H.; Marko, D.; Suman, M.; Berthiller, F.;Krska, R. The Influence of Processing Parameters on the Mitigation of Deoxynivalenol during IndustrialBaking. Toxins 2019, 11, 317. [CrossRef] [PubMed]
7. Tittlemier, S.A.; Drul, D.; Roscoe, M.; Turnock, D.; Taylor, D.; Fu, B.X. Fate of Ergot Alkaloids duringLaboratory Scale Durum Processing and Pasta Production. Toxins 2019, 11, 195. [CrossRef] [PubMed]
8. Sueck, F.; Hemp, V.; Specht, J.; Torres, O.; Cramer, B.; Humpf, H.-U. Occurrence of the Ochratoxin A DegradationProduct 2′R-Ochratoxin A in Coffee and Other Food: An Update. Toxins 2019, 11, 329. [CrossRef] [PubMed]
9. Ksieniewicz-Wozniak, E.; Bryła, M.; Waskiewicz, A.; Yoshinari, T.; Szymczyk, K. Selected Trichothecenes inBarley Malt and Beer from Poland and an Assessment of Dietary Risks Associated with their Consumption.Toxins 2019, 11, 715. [CrossRef] [PubMed]
10. De Santis, B.; Debegnach, F.; Miano, B.; Moretti, G.; Sonego, E.; Chiaretti, A.; Buonsenso, D.; Brera, C.Determination of Deoxynivalenol Biomarkers in Italian Urine Samples. Toxins 2019, 11, 441. [CrossRef][PubMed]
11. Lippolis, V.; Porricelli, A.C.R.; Mancini, E.; Ciasca, B.; Lattanzio, V.M.T.; De Girolamo, A.; Maragos, C.M.;McCormick, S.; Li, P.; Logrieco, A.F.; et al. Fluorescence Polarization Immunoassay for the Determination ofT-2 and HT-2 Toxins and Their Glucosides in Wheat. Toxins 2019, 11, 380. [CrossRef] [PubMed]
© 2020 by the author. Licensee MDPI, Basel, Switzerland. This article is an open accessarticle distributed under the terms and conditions of the Creative Commons Attribution(CC BY) license (http://creativecommons.org/licenses/by/4.0/).
3


toxins
Article
Conversion of Deoxynivalenol-3-Glucoside toDeoxynivalenol during Chinese SteamedBread Processing
Huijie Zhang 1,2, Li Wu 1,2, Weixi Li 1,2, Yan Zhang 1,2, Jingmei Li 1,2, Xuexu Hu 1,2, Lijuan Sun 1,2,
Wenming Du 1,2 and Bujun Wang 1,2,*
1 Institute of Crop Science, Chinese Academy of Agricultural Sciences, Beijing 100081, China;[email protected] (H.Z.); [email protected] (L.W.); [email protected] (W.L.); [email protected] (Y.Z.);[email protected] (J.L.); [email protected] (X.H.); [email protected] (L.S.); [email protected] (W.D.)
2 Laboratory of Quality & Safety Risk Assessment for Cereal Products (Beijing), Ministry of Agriculture,Beijing 100081, China
* Correspondence: [email protected]; Tel.: +86-010-8210-5798
Received: 2 March 2020; Accepted: 30 March 2020; Published: 3 April 2020
Abstract: We reported the conversion of deoxynivalenol-3-glucoside (D3G) to deoxynivalenol (DON)during Chinese steamed bread (CSB) processing by artificial D3G contamination. Meanwhile,the effects of enzymes in wheat flour and those produced from yeast, along with the two maincomponents in wheat flour—wheat starch and wheat gluten—on the conversion profiles of D3G wereevaluated. The results showed D3G could convert to DON during CSB processing, and the conversionbegan with dough making and decreased slightly after fermentation and steaming. However, therewas no significant difference in three stages. When yeast was not added, or enzyme-deactivatedwheat flour was used to simulate CSB process, and whether yeast was added or not, D3G conversioncould be observed, and the conversion was significantly higher after dough making. Likewise, D3Gconverted to DON when wheat starch and wheat gluten were processed to CSB, and the conversionin wheat starch was higher.
Keywords: deoxynivalenol-3-glucoside; deoxynivalenol; conversion; Chinese steamed bread; processing
Key Contribution: D3G could convert to DON during Chinese steamed bread (CSB) processing,the conversion started from dough making, and this conversion could also occur when wheat starchand wheat gluten were processed to CSB. In addition, D3G could convert to DON without yeast orenzymes in wheat flour or both of them.
1. Introduction
Trichothecenes are the most prevalent mycotoxin family, which are mainly produced by Fusariumspecies such as F. culmorum and F. graminearumand. Deoxynivalenol (DON), in particular, is the bestknown and predominant one due to its worldwide occurrence in cereals and products derived fromthem [1]. Due to the importance of wheat in diet, it is of concern that Fusarium can infect grains andproduce mycotoxins under certain climate conditions, which can contaminate final food products.In recent years, interest has been growing in toxins called masked mycotoxins that are primarilyproduced in plants by enzymatic transformations related to plant resistance mechanisms to counteractpathogen invasions [2–6]. Masked mycotoxins, usually formed by the reaction of parent mycotoxinswith amino acids or sugars, therefore, occur in conjugated forms. Furthermore, the modification mayoccur in the food matrix, by covalent binding or non-covalent association to sugars, proteins, or othermacromolecules [7]. Deoxynivalenol-3-glucoside (D3G) is the most known masked mycotoxin, which
Toxins 2020, 12, 225; doi:10.3390/toxins12040225 www.mdpi.com/journal/toxins5

Toxins 2020, 12, 225
is produced by conjugation of DON and glucose, and has been detected in various foods, such asbreakfast cereals, bread, and beers [8–10]. The main concern about masked mycotoxins is that theirconjugates can be hydrolyzed in the stomachs of mammals after uptake, thereby releasing the toxicprecursor DON and influencing its bioaccessibility [11]. The Joint FAO/WHO Expert Committee onFood Additives (JECFA) declared that D3G could contribute to DON dietary exposure; research onits absorption, distribution, metabolism, excretion in animal and human body, and its fate in foodprocessing are needed [12]. The acetylated derivatives of DON, 15-acetyl-deoxynivalenol (15-AcDON)and 3-acetyl-deoxynivalenol (3-AcDON), are intermediate products of fungal DON biosynthesisthat generally occur together with DON in cereal commodities, and 3-AcDON can convert to DONduring mammalian metabolic processes and thus contribute to the total DON toxicity [13]. Therefore,AcDONs are considered to be masked mycotoxins by some researchers [7], and the JECFA amendedthe provisional maximum tolerable daily intake (PMTDI) for DON to 1 mg/kg bodyweight for DONand its acetylated forms [12].
DON’s glucoside form has been found in various raw cereals. It was reported that the meanconcentrations of D3G were 393 μg/kg and 141 μg/kg, respectively, for wheat and maize samples [14].Palacios et al. (2017) [15] reported that D3G was detected in 94% of the investigated durum wheatcommercial cultivars from the Argentinean main growing area at concentrations ranging from < thelimit of quantification (LOQ, 50 μg/kg) to 850 μg/kg. Lancova et al. (2008) [16] found D3G in naturallycontaminated barley, and a remarkable increase of D3G was observed in malt compared to raw barley.Ksieniewicz-Wo’zniak et al. (2019) [17] investigated D3G levels in 87 barley malt samples, and 91%were positive, with concentrations ranging from 4.4–410.3 μg/kg. Quite a lot of similar reports havebeen presented [18–20].
Previous research indicates that mycotoxins may transform in food processing via heating,fermentation, or from ingredients such as enzymes [21]. It was also reported that food processes,such as sorting, cleaning, milling, brewing, baking, frying, roasting, alkaline cooking, extrusion, etc.,might affect mycotoxins [22]. Many agricultural products that contaminated with mycotoxins areprocessed using germination (barley, for example), fermentation, hydrolysis, enzymes, and alkaline oracidic hydrolytic conditions, which contribute to the production or release of masked mycotoxins [23].D3G can be transformed to DON in food processing, and vice versa [24]. The cleavage of maskedmycotoxins occurs during the process of malting, leading to an increase in free DON [8]. DON contentsincreased after baking, which suggests that bound DON is released in baking [25].
Among the many factors influencing masked mycotoxin transformation during food processing,enzymes produced from microorganisms have garnered substantial interest from researchers worldwide.It was reported that doughnuts fermented with yeast contaminated higher DON content than that inthe flour, and this may be due to enzymatic transformation [26]. Simsek et al. (2012) [25] reportedthe effects of milling and baking processing on D3G. The addition of enzyme mixtures to improvebaking increased the content of D3G in fermented dough up to 145%. D3G and DON levels decreasedslightly in baking. When whole wheat was treated with enzymes to evaluate the effects of enzymatichydrolysis on DON, the results showed that DON contents were prominently higher after treatmentwith protease (16%) and xylanase (39%), which suggested DON maybe embed or bind in the cell wallor protein component of wheat kernel. Bread processing usually involves fermentation with yeastor leavening agents (leaven). In particular, rye bread with leaven requires more extensive enzymaticactivity [27].
In our previous study, we found that the DON levels in baked bread were almost double thosein flour, while the D3G contents in baked bread were notably lower. The increase in DON and thedecrease in D3G started during the fermentation of the dough. DON contents approximately doubledafter mixed and fermented dough was processed to CSB, and D3G concentrations were almost 50%lower than in flour, suggesting that CSB processing may release bound DON in the flour [28,29].Our research team investigated the fate of 3-ADON and 15-ADON in bread processing by spiking
6

Toxins 2020, 12, 225
mycotoxin-free wheat flour with 3-ADON and 15-ADON standards, and the results showed thatADONs could convert to DON during bread processing [30].
The objective of the assay presented in this study was to investigate whether D3G could convertto DON during CSB processing, as suggested by our previous research. The effects of enzymatichydrolysis and different wheat compositions on D3G conversion were verified.
2. Results
2.1. Conversion of D3G during CSB Processing
In our previous study, wheat flour naturally contaminated with DON and D3G was used forwheat-based product processing. Thus, it was generally contaminated with small amounts of otherderivatives of DON, especially other masked DONs. To elucidate the behavior of D3G during Chinesesteamed bread processing, D3G contaminated wheat flour samples were prepared in this study byspiking wheat flour, free of target mycotoxins, with a standard solution of D3G.
DON concentrations in the doughs (mixed dough and fermented dough) and steamed productsproduced from wheat flour spiked with three different D3G levels are presented in Table 1. DON wasdetected in the whole processing of CSB, and the amount of DON converted from D3G was proportionalto the spiked amount. In addition, the DON concentrations converted from D3G during the wholeprocessing decreased, and there was no significant difference (p < 0.05) among mixed dough, fermenteddough, and steamed products. The results indicated that D3G could release DON in CSB processingand that the conversion started with the dough making process. The results agreed with those from ourprevious research, in which D3G concentration changes started with the dough making process [28].
Table 1. Deoxynivalenol (DON) concentrations converted from spiked deoxynivalenol-3-glucoside(D3G) at different stages of Chinese steamed bread processing.
SamplesSpiking Levels (μg/kg)
300 500 800
Mixed dough 26.02 ± 2.07a 34.64 ± 5.42a 61.75 ± 4.88aFermented dough 26.37 ± 2.11a 31.55 ± 4.96a 54.42 ± 5.16a
Chinese steamed bread 21.33 ± 3.37a 25.96 ± 3.46a 52.16 ± 5.69a
DON concentrations were average values based on three replicates. Means followed by the same small letters withincolumns are not significantly different (p > 0.05).
2.2. Role of Enzymes in the Conversion of D3G during CSB Processing
Previous research suggests that D3G can release DON during food processing as a result ofenzymatic degradation of polysaccharides [25,26]. Yeast and wheat flour were two sources of enzymesin CSB processing. Wheat flour contains several important enzymes, such as amylases, proteases,lipoxygenase, polyphenol oxidase, and peroxidase. These enzymes are inactive during grain and flourstorage, and they become active when water is added [31]. Enzymes produced by yeast also play animportant role in dough fermentation. The results of the present study showed that D3G could convertto DON during CSB processing without using yeast (Treatment 1) and when using enzyme-deactivatedwheat flour with the addition of yeast (Treatment 2). The conversion started from dough making,as observed in the CSB processing of wheat flour with added yeast (CK) (Figure 1). In addition,the conversion was also observed when enzyme-deactivated wheat flour was processed to CSB,and with no yeast used (Treatment 3). While DON concentrations converted from D3G after doughmaking in these three treatments were significantly higher than that of the control, they decreaseddramatically after dough fermentation and decreased or increased slightly after steaming. Exceptwhen enzyme-deactivated wheat flour with no yeast was used in CSB processing, the DON levels infermented dough and steamed products were significantly lower than those of the control. Theseresults suggested that D3G could convert to DON during CSB processing in the absence of yeast
7

Toxins 2020, 12, 225
or enzymes in wheat flour or both of them, while the production of DON in steamed products wasgenerally lower. The significant increase in the concentration of DON after dough making meritsfurther research.
Figure 1. DON concentrations converted from spiked D3G (300 μg/kg) in different treatments ofChinese steamed bread. CK: wheat flour, yeast used; Treatment 1: wheat flour, no yeast used;Treatment 2: enzyme-deactivated wheat flour, yeast used; Treatment 3: enzyme-deactivated wheatflour, no yeast used.
2.3. Conversion of D3G in Different Wheat Compositions during CSB Processing
The fate of mycotoxins in food processing was affected by several factors, such as the foodmatrix, pH, moisture content, temperature, natural or spiked contamination, and original mycotoxinconcentration [32]. To determine whether the compositions in flour play an important role in D3Gconversion during CSB processing, wheat starch and wheat gluten were chosen to simulate CSBprocessing, since they account for approximately 75% and 10%, respectively, of wheat flour. The resultsshowed that D3G conversion also occurred during the CSB processing of wheat starch and wheatgluten (Figure 2). The conversion of D3G in wheat starch was significantly higher than that of wheatflour and wheat gluten in dough mixing, fermentation, or steaming, and the conversion amounts ofD3G in wheat gluten was the lowest. As observed in the CSB processing of three wheat flour samplesspiked with three different D3G levels, the DON conversion from D3G during the CSB processingof wheat starch and wheat gluten decreased. No data are available on the conversion of D3G indifferent wheat compositions during CSB processing. The results of this study suggest that amylose oramylopectin in wheat flour may play a crucial role in D3G conversion during CSB processing, and thatthis mechanism merits further study.
8

Toxins 2020, 12, 225
Figure 2. DON concentrations converted from spiked D3G (500 μg/kg) during Chinese steamed breadprocessing with different wheat compositions.
3. Discussion
This study confirmed that D3G could convert to DON during CSB processing, and the conversionstarted from the dough making process and decreased slightly after dough fermentation and steaming.In addition, D3G could convert to DON during CSB processing in the absence of yeast or enzymes inwheat flour or both of these components, while converted DON in steamed products was generallylower. In addition, D3G conversion could occur when wheat starch and wheat gluten were processedto CSB, and the amounts converted in wheat starch were significantly higher.
The results of this work indicated that the conversion of D3G in CSB processing began with doughmixing. Our previous research indicated that DON levels increased significantly after dough was rolledin a noodle machine during noodle processing, and that D3G levels decreased dramatically [29]. Thesestudies suggested that mechanical force may exert a remarkable influence on mycotoxin structure,therefore leading to the liberation of masked mycotoxins. To verify this hypothesis, we studied the effectof mechanical forces (oscillate in an ultrasonic cleaner and blend at high speed in a blender for 30 min,respectively) on the conversion of D3G by spiking D3G standard in water and acetonitrile. The results(data not listed) showed that only trace amounts of D3G (approximately 1%) converted to DON afteroscillating or blending. Further research indicated 15-AcDON and 3-AcDON could also convert totheir parent mycotoxins when 15-AcDON and 3-AcDON standard spiked in water or acetonitrile wereoscillated in an ultrasonic cleaner, blended at high speed in a blender, shaken in a shaking incubator, orstirred in a magnetic stirring stirrer; likewise, only a little bit of DON could be detected after treating.The results suggested that mechanical force had an impact on the structures of D3G, 15-AcDON,and 3-AcDON, leading to the conversion to DON, and the conversion of D3G standard (in acetonitrile)under mechanical forces indicated that the hydroxyl of water molecules was not a crucial factor inD3G conversion. There is no description of this phenomenon in the existing literature. This may leadus to a new realm called mechanochemistry, which involves mechanical and chemical behaviors on amolecular level, and various phenomena, such as mechanical breakage, polymeride degradation byshearing, cavitation-involved phenomena, shock wave chemistry and physics, molecular machines,etc., are included. Mechanochemistry could be regarded as the intersection of mechanical engineeringand chemistry, and it produces chemical product synthesis depending on possible mechanical actions.The mechanisms of mechanochemical transformations are different from those of general techniques [33].Ball milling is a widely used technology, in which chemical processing and transformations are movedby mechanical force [34]. In this study, the generation of DON under mechanical forces may occur dueto the mechanical energy of mechanical friction and shear exerted upon mycotoxin molecules thatlead to structural changes of D3G, 15-AcDON, and 3-AcDON. However, as only a trace amount ofD3G could convert to DON in liquid under mechanical forces, and CSB processing generally involves
9

Toxins 2020, 12, 225
different compositions in a flour matrix, ingredients and complex physico-chemical modifications thatoccur in the processing, D3G conversion in CSB processing may be due to other mechanisms, and itstill needs further research.
4. Materials and Methods
4.1. Chemicals and Reagents
The analytical standard of D3G (50 μg/mL in acetonitrile, certified purity >99.9%) was purchasedfrom Sigma (Sigma-Aldrich, Alcobendas, Spain). Purified water was obtained from a Milli-Q apparatus(Millipore Corp., Bedford, MA, USA). Methanol, acetonitrile and formic acid (all HPLC grade) werepurchased from Thermo Fisher Scientific Corporation (Shanghai, China).
4.2. Preparation of D3G-Contaminated Wheat Flour/Enzyme-Deactivated Wheat Flour/Wheat Starch/Wheat Gluten
In the present experiment, wheat flour, wheat starch and wheat gluten samples with undetectedlevels of target mycotoxins were designated to be “blank”. Wheat flour was purchased from HuanghuaJinmai Flour Co., Ltd. (Cangzhou, Hebei, China). Wheat starch was purchased from ShanghaiSaiwengfu Agricultural Development Co., Ltd., and wheat gluten was from Shandong Qufeng FoodTech Co., Ltd. Blank wheat flour was dried at 130 ◦C in a drying oven (DHG-9140A, Shanghai YihengScientific Instruments Co., Ltd., Shanghai, China) for three hours to prepare enzyme-deactivated blankwheat flour. D3G-contaminated wheat flour/enzyme-deactivated wheat flour/wheat starch/wheatgluten samples were prepared by spiking blank samples with a standard solution of D3G.
4.3. Preparation of Chinese Steamed Bread
Chinese steamed bread was processed according to the Chinese Business Standard (procedure10139-93, Appendix A, 1993) with some modifications. The experiment was conceived and executedas follows: (1) blank wheat flour spiked with 3 levels of 300, 500, and 800 μg/kg D3G (based on thedry sample as delineated below), mixed with yeast solution (0.26 g dry yeast dispersed in 12.5 mLwater at 38 ◦C, as delineated below); (2) blank wheat flour spiked with 300 μg/kg D3G, mixed with12.5 mL water (38 ◦C) instead of yeast solution; (3) enzyme-deactivated blank wheat flour spikedwith 300 μg/kg D3G, mixed with 12.5 mL yeast solution, and an additional 12.5 mL water (38 ◦C) wasadded to form the resultant dough; (4) enzyme-deactivated blank wheat flour spiked with 300 μg/kgD3G, mixed with 25 mL water (38 ◦C) instead of yeast solution; (5) blank wheat starch spiked with500 μg/kg D3G, mixed with 12.5 mL yeast solution; (6) blank wheat gluten spiked with 500 μg/kg D3G,mixed with 12.5 mL yeast solution and additional 7.5 mL water (38 ◦C). Each treatment was preparedin triplicate. After 3 min of mixing, the mixed doughs were fermented in a fermentation cabinet (38 ◦C,85% RH) for 60 min. Then manually molding to produce a round dough with a smooth surface wasperformed for 3 min, followed by steaming at 100 ◦C in a steaming chamber for 20 min after putting inair for 15 min. Then the steamed dough was cooled at room temperature for 40–60 min. Sampling wasconducted at the end of dough preparation, after fermentation, and after steaming. Representativesubsamples were stored at −20 ◦C until analysis.
4.4. Sample Treatment and UPLC-MS/MS Analysis
Sample treatment was performed as described by Zhang and Wang (2014) [28] with slightmodifications. Ten mL acetonitrile: water (80:20, v/v) was blended with two grams of a representativesample and extracted for 3 min with a blender (IKA Co., Staufen, Germany). Then the sample wascentrifuged at 10,000 rpm for 10 min, and the supernatant (5 mL) was filtered through a multifunctionalMycoSep 226 columns (Romer Labs, Inc. Union, MO, USA), and 2 mL of the extract was submitted toN-EVAP at 50 ◦C until dry. Sequentially, the residue was dissolved in a mixture of 0.4 mL methanol:water (50:50, v/v), then vortexed and filtered through 0.22 μm MICRO PES filter (Membrana, Germany)for UPLC-MS/MS analysis.
10

Toxins 2020, 12, 225
The UPLC-MS/MS analysis of DON was conducted as described by Zhang and Wang (2014) [28]with some modifications. A multiple reaction monitoring (MRM) mode was performed, and columntemperature was set at 26 ◦C, capillary voltage at 2.5 KV, cone voltage at 20 V. Gaseous nitrogen wasused as desolvation gas, and its flows were maintained at 800 L/h. Desolvation temperature was setat 450 ◦C. Mobile phase A was methanol and mobile phase B was 0.1% (v/v) formic acid in water.Gradient of phase A performed was 0.2 mL/min for 0–3.5 min, and increased linearly from 5% to 85%,for 3.5–4.5 min a linear increase from 85% to 100% was followed, then decreased from 100% to 5% for4.5–5.0 min, and followed by an isocratic washout of 5% A for 1 min.
Author Contributions: All authors conceived the experimental design. H.Z. performed the experiment, datastatistical analysis, and wrote the original draft. L.W., W.L., and Y.Z. helped with laboratory analysis. J.L., X.H.,L.S., and W.D. carried out the literature investigation. B.W. reviewed and edited the manuscript. All authors haveread and agreed to the published version of the manuscript.
Funding: This research was funded by the National Key Research and Development Program of China(2016YFF0201803).
Conflicts of Interest: The authors declare no conflict of interest.
References
1. Pestka, J.J. Deoxynivalenol: Mechanisms of action, human exposure, and toxicological relevance. Arch. Toxicol.2010, 137, 283–298. [CrossRef]
2. Engelhardt, G.; Ruhland, M.; Wallnöfer, P.R. Metabolism of mycotoxins in plants. Adv. Food Sci. 1999,21, 71–78.
3. Karlovsky, P. Biological detoxification of fungal toxins and its use in plant breeding, feed and food production.Nat. Toxins 1999, 7, 1–23. [CrossRef]
4. Berthiller, F.; Werner, U.; Adam, G.; Krska, R.; Lemmens, M.; Sulyok, M.; Hauser, M.T.; Schuhmacher, R.Bildung von maskierten Fusarium mykotoxinen in Pflanzen. Ernaehrung 2006, 30, 477–481.
5. Lemmens, M.; Scholz, U.; Berthiller, F.; Dall’Asta, C.; Koutnik, A.; Schuhmacher, R.; Adam, G.; Buerstmayr, H.;Mesterházy, A.; Krska, R.; et al. The ability to detoxify the mycotoxin deoxynivalenol colocalizes with amajor quantitative trait locus for Fusarium head blight resistance in wheat. Mol. Plant Microbe Interact. 2005,18, 1318–1324. [CrossRef] [PubMed]
6. Schweiger, W.; Boddu, J.; Shin, S.; Poppenberger, B.; Berthiller, F.; Lemmens, M.; Muehlbauer, G.J.; Adam, G.Validation of a candidate deoxynivalenol-inactivating UDP-glucosyltransferase from barley by heterologousexpression in yeast. Mol. Plant Microbe Interact. 2010, 23, 977–986. [CrossRef] [PubMed]
7. Cirlini, M.; Dall’Asta, C.; Galaverna, G. Hyphenated chromatographic techniques for structuralcharacterization and determination of masked mycotoxins. J. Chromatogr. A. 2012, 1255, 145–152. [CrossRef]
8. Kostelanska, M.; Hajslova, J.; Zachariasova, M.; Malachova, A.; Kalachova, K.; Poustka, J.; Fiala, J.; Scott, P.M.;Berthiller, F.; Krska, R. Occurrence of deoxynivalenol and its major conjugate, deoxynivalenol-3-glucoside, inbeer and some brewing intermediates. J. Agric. Food Chem. 2009, 57, 3187–3194. [CrossRef]
9. Malachova, A.; Dzuman, Z.; Veprikova, Z.; Vaclavikova, M.; Zachariasova, M.; Hajslova, J. Deoxynivalenol,deoxynivalenol-3-glucoside, and enniatins: The major mycotoxins found in cereal-based products on theCzech market. J. Agric. Food Chem. 2011, 59, 12990–12997. [CrossRef]
10. Vendl, O.; Berthiller, F.; Crews, C.; Krska, R. Simultaneous determination of deoxynivalenol, zearalenone,and their major masked metabolites in cereal based food by LCMS/MS. Anal. Bioanal. Chem. 2009, 395,1347–1354. [CrossRef]
11. González-Arias, C.A.; Marín, S.; Sanchis, V.; Ramos, A.J. Mycotoxin bioaccessibility/absorption using in vitrodigestion model: A review. World Mycotoxin J. 2013, 6, 167–184. [CrossRef]
12. JECFA (Joint FAO/WHO Expert Committee on Food Additives). Evaluation of Certain Contaminants inFood: Seventy-Second Report of the Joint FAO/WHO Expert Committee on Food Additives. WHO TechnicalReport Series, 959. 2011. Available online: http://whqlibdoc.who.int/trs/WHO_TRS_959_eng.pdf (accessedon 25 January 2014).
13. Bretz, M.; Beyer, M.; Cramer, B.; Humpf, H.U. Synthesis of stable isotope labeled 3-acetyldeoxynivalenol.Mol. Nutr. Food Res. 2005, 49, 1151–1153. [CrossRef] [PubMed]
11

Toxins 2020, 12, 225
14. Berthiller, F.; Dall’asta, C.; Corradini, R.; Marchelli, R.; Sulyok, M.; Krska, R.; Adam, G.; Schuhmacher, R.Occurrence of deoxynivalenol and its 3-beta-D-glucoside in wheat and maize. Food Addit. Contam. 2009, 26,507–511. [CrossRef] [PubMed]
15. Palacios, S.A.; Erazo, J.G.; Ciasca, B.; Lattanzio, V.M.T.; Reynoso, M.M.; Farnochi, M.C.; Torres, A.M.Occurrence of deoxynivalenol and deoxynivalenol-3-glucoside in durum wheat from Argentina. Food Chem.2017, 230, 728–734. [CrossRef]
16. Lancova, K.; Hajslova, J.; Poustka, J.; Krplova, A.; Zachariasova, M.; Dostalek, P.; Sachambula, L. Transfer ofFusarium mycotoxins and ‘masked’ deoxynivalenol (deoxynivalenol-3-glucoside) from field barley throughmalt to beer. Food Addit. Contam. 2008, 25, 732–744. [CrossRef]
17. Ksieniewicz-Wozniak, E.; Bryła, M.; Waskiewicz, A.; Yoshinari, T.; Szymczyk, K. Selected Trichothecenes inbarley malt and beer from Poland and an assessment of dietary risks associated with their consumption.Toxins 2019, 11, 715.
18. Berthiller, F.; Dall’Asta, C.; Schuhmacher, R.; Lemmens, M.; Adam, G.; Krska, R. Masked mycotoxins:Determination of a deoxynivalenol glucoside in artificially and naturally contaminated wheat by liquidchromatography-tandem mass spectrometry. J. Agric. Food Chem. 2005, 53, 3421–3425. [CrossRef]
19. Sasanya, J.J.; Hall, C.; Wolf-Hall, C. Analysis of deoxynivalenol, masked deoxynivalenol, and Fusariumgraminearum pigment in wheat samples, using liquid chromatography–UV–mass spectrometry. J. FoodProtect. 2008, 71, 1205–1213. [CrossRef]
20. Li, F.Q.; Yu, C.C.; Shao, B.; Wang, W.; Yu, H.X. Natural occurrence of masked deoxynivalenol andmulti-mycotoxins in cereals from China harvested in 2007 and 2008. Chin. J. Prev. Med. 2011, 45, 57–63.
21. Berthiller, F.; Schuhmacher, R.; Adam, G.; Krska, R. Formation, determination and significance of maskedand other conjugated mycotoxins. Anal. Bioanal. Chem. 2009, 395, 1243–1252. [CrossRef]
22. Bullerman, L.B.; Bianchini, A. Stability of mycotoxins during food processing. Int. J. Food Microbiol. 2007,119, 140–146. [CrossRef] [PubMed]
23. Berthiller, F.; Crews, C.; Dall’Asta, C.; De Saeger, S.; Haesaert, G.; Karlovsky, P.; Oswald, I.P.; Seefelder, W.;Speijers, G.; Stroka, J. Masked mycotoxins: A review. Mol. Nutr. Food Res. 2013, 57, 165–186. [CrossRef][PubMed]
24. Voss, K.A.; Snook, M.E. Stability of the mycotoxin deoxynivalenol (DON) during the production of flour-basedfoods and wheat flake cereal. Food Addit. Contam. 2010, 27, 1694–1700. [CrossRef] [PubMed]
25. Simsek, S.; Burgess, K.; Whitney, K.L.; Gu, Y.; Qian, S.Y. Analysis of deoxynalenol and deoxynivalenol-3-glucoside in wheat. Food Control 2012, 26, 287–292. [CrossRef]
26. Young, J.; Fulcher, R.; Hayhoe, J.; Scott, P.M.; Dexter, J. Effect of milling and baking on deoxynivalenol(vomitoxin) content of eastern Canadian wheats. J. Agric. Food Chem. 1984, 32, 659–664. [CrossRef]
27. Belitz, H.D.; Grosch, W.; Schieberle, P. Lehrbuch der Lebensmittelchemie, 6th ed.; Springer: Berlin/Heidelberg,Germany, 2008.
28. Zhang, H.J.; Wang, B.J. Fate of deoxynivalenol and deoxynivalenol-3-glucoside during wheat milling andChinese steamed bread processing. Food Control 2014, 44, 86–91. [CrossRef]
29. Zhang, H.J.; Wang, B.J. Fates of deoxynivalenol and deoxynivalenol-3-glucoside during bread and noodleprocessing. Food Control 2015, 50, 754–757. [CrossRef]
30. Wu, L.; Wang, B.J. Evaluation on levels and conversion profiles of spiked DON, 3-ADON and 15-ADONduring bread making process. Food Chem. 2015, 185, 509–516. [CrossRef]
31. Rani, K.U.; Prasada Rao, U.J.S.; Leelavathi, K.; Haridas Rao, P. Distribution of enzymes in wheat flour millstreams. J. Cereal Sci. 2001, 34, 233–242. [CrossRef]
32. Samar, M.M.; Neira, M.S.; Resnik, S.L.; Pacin, A. Effect of fermentation on naturally occurring deoxynivalenol(DON) in Argentinean bread processing technology. Food Addit. Contam. 2001, 18, 1004–1010. [CrossRef]
33. Carlier, L.; Baron, M.; Chamayou, A.; Couarraze, G. Greener pharmacy using solvent-free synthesis:Investigation of the mechanism in the case of dibenzophenazine. Powder Technol. 2013, 240, 41–47. [CrossRef]
34. Carlier, L.; Baron, M.; Chamayou, A.; Couarraze, G. Use of co-grinding as a solvent-free solid state methodto synthesize dibenzophenazines. Tetrahedron Lett. 2011, 52, 4686–4689. [CrossRef]
© 2020 by the authors. Licensee MDPI, Basel, Switzerland. This article is an open accessarticle distributed under the terms and conditions of the Creative Commons Attribution(CC BY) license (http://creativecommons.org/licenses/by/4.0/).
12

toxins
Article
Selected Trichothecenes in Barley Malt and Beer fromPoland and an Assessment of Dietary RisksAssociated with their Consumption
Edyta Ksieniewicz-Wozniak 1, Marcin Bryła 1,*, Agnieszka Waskiewicz 2, Tomoya Yoshinari 3 and
Krystyna Szymczyk 1
1 Department of Food Analysis, Prof. Waclaw Dabrowski Institute of Agricultural and Food Biotechnology,Rakowiecka 36, 02-532 Warsaw, Poland; [email protected] (E.K.-W.);[email protected] (K.S.)
2 Department of Chemistry, Poznan University of Life Sciences, Wojska Polskiego 75, 60-625 Poznan, Poland;[email protected]
3 Division of Microbiology, National Institute of Health Sciences, 3-25-26 Tonomachi, Kawasaki-ku,Kawasaki-shi, Kanagawa 210-9501, Japan; [email protected]
* Correspondence: [email protected]; Tel.: +48-22-606-3884
Received: 21 November 2019; Accepted: 6 December 2019; Published: 9 December 2019
Abstract: Eighty-seven samples of malt from several Polish malting plants and 157 beer samplesfrom the beer available on the Polish market (in 2018) were tested for Fusarium mycotoxins(deoxynivalenol (DON), nivalenol (NIV)), and their modified forms ((deoxynivalenol-3-glucoside(DON-3G), nivalenol-3-glucoside (NIV-3G), 3-acetyldeoxynivalenol (3-AcDON)). DON and itsmetabolite, DON-3G, were found the most, among the samples analyzed; DON and DON-3Gwere present in 90% and 91% of malt samples, and in 97% and 99% of beer samples, respectively. NIVwas found in 24% of malt samples and in 64% of beer samples, and NIV-3G was found in 48% ofmalt samples and 39% of beer samples. In the malt samples, the mean concentration of DON was52.9 μg/kg (range: 5.3–347.6 μg/kg) and that of DON-3G was 74.1 μg/kg (range: 4.4–410.3 μg/kg). Inthe beer samples, the mean concentration of DON was 12.3 μg/L (range: 1.2–156.5 μg/L) and that ofDON-3G was 7.1 μg/L (range: 0.6–58.4 μg/L). The concentrations of other tested mycotoxins in thesamples of malt and beer were several times lower. The risk of exposure to the tested mycotoxins,following the consumption of beer in Poland, was assessed. The corresponding probable daily intakes(PDIs) remained a small fraction of the tolerable daily intake (TDI). However, in the improbableworst-case scenario, in which every beer bottle consumed would be contaminated with mycotoxinspresent at the highest level observed among the analyzed beer samples, the PDI would exceed theTDI for DON and its metabolite after the consumption of a single bottle (0.5 L) of beer.
Keywords: Fusarium toxins; modified mycotoxins; beer; malt; risk assessment
Key Contribution: High number of malt and beer samples were contaminated with mycotoxins.Strong beers (with higher alcohol content) contain higher levels of mycotoxins. Risk analysis showeda low level group probable daily intake of mycotoxin from beer. DON-3G present in beer has asignificant share in group exposure to mycotoxins.
1. Introduction
Barley (Hordeum vulgare L.) has been grown for many years and is of great economic importance [1].Approximately 57 million tonnes of barley was produced annually (in 2018) in the European Union,while global production has reached 147 million tonnes annually [2]. Most of the harvested grain isused as feed but the highest quality barley is selected for food production, including the production of
Toxins 2019, 11, 715; doi:10.3390/toxins11120715 www.mdpi.com/journal/toxins13

Toxins 2019, 11, 715
malt. Malt is an ample source of the B-group vitamins, niacin, and minerals. It is increasingly used inthe bakery and pastry industries to improve the quality of both the taste and health of their products [3].However, beer production remains as the main application of malt [1,4]. Beer is an alcoholic beveragecommonly consumed in numerous countries globally. Poland has the third largest quantity of beerproduction in Europe (approximately 93, 40.5, and 40.4 million hectoliters in Germany, UK, and Poland,respectively) and the fourth highest beer consumption per capita in Europe (approximately 138, 105,101, and 97 liters in Czech Republic, Austria, Germany, and Poland, respectively [5]).
To arrive at a high-quality malt, one needs to start with a healthy grain with sufficiently highenergy for germination and sufficient protein content. However, unfavorable climatic conditionsduring the plant vegetation season may negatively impact the quality of the grain and consequently,the decrease quality of the malt produced from that grain [6]. The most important climatic conditionsare rainfall and temperature, which are two factors that mostly determine the degree to which theplants may become infected with pathogen fungi. Fusarium is one of the major fungal species infectingcereal grains, including barley. Fusarium head blight (FHB) disease caused by these fungi is a problemin various regions of the world. The fungal infection decreases crop yield, but even greater damagemay result from the production of mycotoxins, which are secondary metabolites of the fungi that aretoxic to humans and animals [7].
Fusarium spp. most often responsible for FHB in Poland include F. graminearum, F. avenaceum,and F. culmorum; however, other species are also seen in various regions of the world [8–10]. Themycotoxins produced by Fusarium in cereal grains include the trichothecenes, deoxynivalenol (DON),and nivalenol (NIV), and their modified forms. These toxins are also phytotoxic [11,12]. F. culmorumand F. graminearum are among the varieties that most aggressively infect plant ears [13,14]. Manyof these fungi are capable of synthesizing 3- (3-AcDON) or 15-acetyl deoxynivalenol (15-AcDON),which are modified forms of DON [15]. Studies of the phytotoxic effects of DON have shown thatthe ability to covert DON into deoxynivalenol-3-glucoside (DON-3G) is the plant’s primary defensemechanism against the toxin. Similar metabolic detoxication mechanisms help to build resistance totoxins in numerous cereal grain plants [16]. In barley, this mechanism is thought to be controlled bythe QTL (quantitative trait loci)-specific region. Future studies involving deeper genetic analyses mayhelp to develop tools to select fungal toxin-resistant plants using specific markers (marker-assistedselection; [17]). The phytotoxic effects of DON-3G are very weak compared to DON [18] and thus, itmay be expected that a similar relationship holds for nivalenol 3-glucoside (NIV-3G) and NIV.
The consumption of DON- and/or NIV-contaminated food/feed may lead to disorders of thegastrointestinal tract, reproductive organs, and/or the immune system in both humans and animals.The toxicological characteristics of these toxins have been extensively described [19]. The lower levelsof toxicity of DON-3G compared with DON have been confirmed in both humans and animals. In somein vitro studies and in some research on animals, it has been shown that DON-3G is not transportedthrough the intestinal epithelium, but rather, is hydrolyzed by bacteria within the lower part of thealimentary tract [20]. Similar data are not available for NIV-3G, but it is commonly thought that theadverse effects of NIV-3G are weaker than those of NIV, as they are for DON-3G and DON.
Currently, the only European Commission regulation concerning mycotoxins in foodstuffs requiresthat the DON concentration in unprocessed cereal grains must not exceed 1250 μg/kg [21]. Taking intoconsideration the scientific evidence regarding the rapid absorption and excretion of DON, the in vivodeacetylation of 3- and 15-AcDON, and the hydrolysis of DON-3G in the lower parts of the alimentarytract; a European Food and Safety Authority (EFSA) expert panel recognized in 2017 that the toxiceffects of DON-derivatives in humans may be comparable to the toxic effects of DON. Therefore, thetolerable daily intake (TDI) and reference dose (RfD) values have been recalculated as the sum of thethree latter substances. Based on epidemiological data, a TDI threshold of 1 μg/kg body weight/dayand an RfD dose of 8 μg/kg body weight/day have been accepted [19].
Reports on mycotoxins and their metabolites in Polish malts used in the brewing industry arevery limited. The aims of this work included: (i) to assess the contamination of malts, sampled from
14

Toxins 2019, 11, 715
several Polish malting plants, with selected Fusarium mycotoxins including their modified forms; (ii) toassess the mycotoxin contamination of beer available in 2019 on the Polish market; and (iii) to assessthe risk of exposure to these mycotoxins following the consumption of beer in Poland.
2. Results and Discussion
2.1. Malt
Mycotoxins were found in the majority of the malt samples analyzed (Table 1). DON and DON-3Gwere found most often (in 90% and 91% of the malt samples, respectively) and at the highest levels(average of 52.9 and 74.1 μg/kg for DON and DON-3G, respectively). The percentage of samplespositive for 3-AcDON was clearly lower 59% and NIV and NIV-3G were detected in the least numberof samples (24% and 48%, respectively). DON-3G/DON molar ratios varied from 22% to 186% amongDON-positive samples, while NIV-3G/NIV molar ratios varied from 32% to 126% among NIV-positivesamples. Individual results regarding the content of individual mycotoxins in malt samples arepresented in Table S1.
Table 1. Concentration of mycotoxins in 87 barley malt samples.
AssumedValues
Concentration (μg/kg) Molar Ratios
DON DON-3G 3-AcDON NIV NIV-3GDON-3G/DON
NIV-3G/NIV
Positivesamples (%)
78(90%)
79(91%)
51(59%)
21(24%)
42(48%)
78(90%)
21(24%)
Average 52.9 74.1 7.7 22.1 13.9 89% 65%Median 24.2 33.1 4.9 17.5 10.0 88% 66%
Min–Max 5.3–347.6 4.4–410.3 2.2–40.2 8.3–118.6 5.0–57.4 22%–186% 32%–126%
DON, deoxynivalenol; DON-3G, deoxynivalenol-3-glucoside; 3-AcDON, 3-acetyldeoxynivalenol; NIV, nivalenol;NIV-3G, nivalenol-3-glucoside.
In grains, DON-3G is known to be a product of the plant defense reaction to the presence ofthe phytotoxin, DON [22–24]. DON-3G is easily soluble and plants can easily transport it from thecytoplasm to vacuoles or the intercellular space [16]. The DON-3G/DON ratio in the grain itself does notusually exceed 30% [25,26]. However, in malt samples we observed an average DON-3G/DON ratio of89%, with a range of 22%–186%. Relatively high values (average 65%, range 32%–126%) were also notedfor the NIV-3G/NIV ratio. Some researchers have suggested that changes occur during the maltingprocess that activate secondary detoxicating enzymes, which then catalyze the conversion of the toxinsto their glycoside derivatives [27–29]. Maul et al. [29] have shown that sprouting seeds of barley, millet,oat, rye, and spelt are capable of converting DON into DON-3G by means of UDP-glucosyltransferases.In barley, approximately 50% of DON was found to be converted, mainly into DON-3G, with a similarconversion rate observed in wheat. Moreover, Lancova et al. [28] reported that, during barley graingermination, the concentration of DON may decrease by 90%, while the concentration of DON-3G maymarkedly increase, to a level as high or several times higher than DON. Spanic et al. [30] presenteddata on mycotoxin levels in wheat varieties varying in Fusarium head blight resistance; the averagecontent of DON-3G increased from 59.9 μg/kg in grain to 163.9 μg/kg in malt.
There are very few reports in the literature on the co-occurrence of DON/DON-3G and NIV/NIV-3Gin brewing malts, even though such data are essential for regulating food safety. In the present study,we detected these substances in both malt and beer samples. However, the DON concentration did notexceed 750μg/kg, the maximum permissible level in malt specified in EC Regulation 1881/2006, in any ofthe tested malt samples [21]. Practically, malt plants in Poland do not purchase grain contaminated withDON at levels above 1 mg/kg, while the maximum permissible level in grain is 1.25 mg/kg, as per ECRegulation 1881/2006 [21]. Mitteleuropäische Brautechnische Analyskomommision [31] recommendsthe inspection of each batch of grain offered to a malting plant for the presence of F. graminearum and
15

Toxins 2019, 11, 715
F. culmorum. If mycelia are visible, they recommend the analysis of the grain for mycotoxins. Thereare some indications in the literature [32–35] that high amounts of additional mycotoxins may besynthesized in fungi-contaminated grain during the malting process, thus significantly impactingfood safety.
2.2. Beer
The majority of beers marketed in Poland are light beers based on pilsner malts. However, dark aleor lager beers produced from Munich malts, usually obtained from lower quality grains [36], caramelmalts or roasted pale ale malts are also popular. The two latter malts are enzymatically inactive; theyare introduced in small amounts [37], to darken the beer and enhance its flavor. Wheat beers are alsobecoming increasingly common on the market. They are produced from barley malt, with the additionof at least 50% wheat or wheat malt. The flavor of these beers is unique, differing from the flavorof classical barley-only beers [38]. We divided our beer samples into three common categories foranalysis: light, dark, and wheat beers. The percentage of mycotoxin-positive beer samples in all thesegroups was high (Table 2). Individual results regarding the content of mycotoxins in beer samples arepresented in Table S1.
Table 2. Concentration of mycotoxins in light, dark, and wheat beers.
Type of BeerConcentration (μg/L) Molar Ratios
DON DON-3G 3-AcDON NIV NIV-3GDON-3G/DON
NIV-3G/NIV
Lightbeers
(n = 105)
No. of positivesamples (%) 101 (96%) 103 (98%) 72 (69%) 70 (67%) 45 (43%) 100 (95%) 42 (40%)
Average 13.0 7.3 1.0 1.5 1.1 46% 42%Median 8.0 4.8 0.7 1.4 0.8 33% 30%
Min–Max 1.2–156.5 0.6–36.8 0.3–8.3 0.6–3.6 0.5–4.5 10–149% 12–137%
Darkbeers
(n = 28)
No. of positivesamples (%) 28 (100%) 28 (100%) 7 (25%) 15 (54%) 7 (25%) 28 (100%) 6 (21%)
Average 11.7 7.8 1.2 1.0 0.7 40% 41%Median 8.8 4.8 0.8 0.8 0.6 39% 36%
Min–Max 2.7–54.4 1.3–58.4 0.3–3.9 0.6–2.5 0.5–0.8 18–71% 30–74%
Wheatbeers
(n = 24)
No. of positivesamples (%) 24 (100%) 24 (100%) 13 (58%) 15 (63%) 10 (42%) 24 (100%) 9 (38%)
Average 9.6 5.0 0.9 1.1 0.9 34% 50%Median 9.9 3.8 0.9 1.0 0.9 34% 52%
Min–Max 2.2–24.6 0.6–13.2 0.9–1.9 0.6–2.0 0.5–1.6 14–59% 23–79%
Total(n = 157)
No. of positivesamples (%) 153 (97%) 155 (99%) 92 (59%) 100 (64%) 62 (39%) 152 (97%) 57 (36%)
Average 12.3 7.1 1.0 1.3 1.1 43% 43%Median 8.6 4.8 0.8 1.2 0.8 38% 37%
Min–Max 1.2–156.5 0.6–58.4 0.3–8.3 0.6–3.6 0.5–4.5 10–149% 12–137%
DON, deoxynivalenol; DON-3G, deoxynivalenol-3-glucoside; 3-AcDON, 3-acetyldeoxynivalenol; NIV, nivalenol;NIV-3G, nivalenol-3-glucoside.
As was the case for malt samples, DON and DON-3G were the most frequently found toxins inbeer samples, being present in 96% and 98% of light beer samples, respectively, and in all the samplesof dark and wheat beers. Other mycotoxins, namely, 3-AcDON, NIV, and NIV-3G were found at lowerlevels in 69%, 25%, and 58%; 67%, 54%, and 63%; and 43%, 25%, and 42% of the light, dark, and wheatbeer samples, respectively. The maximum DON (156.5 μg/L) and DON-3G (58.4 μg/L) concentrationswere found in a light and a dark beer sample, respectively. The average levels of the three remainingtested mycotoxins ranged from 0.7 to 1.5 μg/L, i.e., they were approximately 6–20 times lower than theDON levels. The average DON-3G/DON and NIV-3G/NIV molar ratios ranged from 34% to 46% and41% to 50%, respectively. Neither the mycotoxin concentrations nor their molar ratios were dependenton the beer category.
16

Toxins 2019, 11, 715
The alcohol content of beer depends on the extent to which the yeast ferments the sugars, whichlargely depends on the amount of grain and malt in the fermentation batch. Stronger beer requires moregrain, which results in a higher risk of mycotoxin contamination [27,39,40]. Grain extracts used for beerproduction contain mainly sugars but may also contain dextrins, nitrogenous compounds (proteins),mineral salts, and other compounds, depending on the recipe used by the beer manufacturer [41].Therefore, a comparison of the level of mycotoxin contamination in beers with different extract contentsmust be treated only as an approximation. Therefore, we re-organized the beer samples into threedifferent categories: mild beers (0.5–5.0% alcohol, 3.5–12.5% extract), regular beers (5.1–6.0% alcohol,6.8–16.0% extract), and strong beers (6.1–10.0% alcohol, 8.4%–21.0% extract; Table 3).
Table 3. Concentrations of mycotoxins in mild, regular, and strong beers.
Type of BeerConcentration (μg/L) Molar Ratios
DON DON-3G 3-AcDON NIV NIV-3GDON-3G/DON
NIV-3G/NIV
Mildbeers
n = 48)
No. of positivesamples (%)
45(94%)
47(98%)
26(54%)
21(44%)
18(38%)
45(94%)
15(31%)
Average 7.1 5.6 0.8 1.2 1.3 50% 58%Median 4.3 3.0 0.7 1.0 1.0 45% 43%
Min–Max 1.4–24.6 0.6–30.9 0.3–2.7 0.6–2.3 0.5–4.5 18–149% 26–137%
Regularbeers
(n = 61)
No. of positivesamples (%)
61(100%)
61(100%)
40(67%)
45(75%)
23(38%)
59(97%)
23(38%)
Average 12.1 7.0 0.9 1.5 1.1 42% 41%Median 9.5 5.2 0.8 1.3 0.9 37% 37%
Min–Max 1.2–54.2 0.6–31.5 0.4–2.6 0.6–3.6 0.5–2.8 15–118% 16–90%
Strongbeers
(n = 48)
No. of positivesamples (%)
48(100%)
48(100%)
27(56%)
34(71%)
21(44%)
48(100%)
19(40%)
Average 17.3 8.6 1.3 1.3 0.7 38% 34%Median 8.5 5.2 0.9 1.1 0.7 37% 32%
Min–Max 2.0–156.5 0.6–58.4 0.3–8.3 0.6–3.3 0.5–1.8 10–104% 12–52%
DON, deoxynivalenol; DON-3G, deoxynivalenol-3-glucoside; 3-AcDON, 3-acetyldeoxynivalenol; NIV, nivalenol;NIV-3G, nivalenol-3-glucoside.
The number of positive samples and the concentration of the majority of the tested mycotoxinspositively correlated with alcohol content in most cases. DON and DON-3G were the predominanttoxins in 94% and 98% of mild beer samples, respectively, and in all samples of regular and strong beer,with average DON concentrations of 7.1, 12.1, and 17.3 μg/L and average DON-3G concentrations of5.6, 7.0, and 8.6 μg/L for mild, regular, and strong beers, respectively. Less clear, but similar trendswere noted for the other tested mycotoxins.
Mycotoxin contamination of beer has been studied by numerous groups (Table 4). However,data on the co-occurrence of DON, DON-3G, 3-AcDON, NIV, and NIV-3G in beer are scarce. Thescope of most reported studies has been restricted to DON, DON-3G, and 3-AcDON, with a fewstudies also including NIV. Typically, the reported concentrations of the predominant DON have notexceeded 100 μg/L [27,42–45]. The findings from the present study mostly agree with those fromprevious studies (because the fraction of positive samples may depend on the LOD and LOQ of themethod used). Higher concentrations of DON have been found mainly in beers originating fromnon-European countries, including craft beers from Brazil (127–501 μg/L; [46]), traditional African beersfrom Cameroon (140–730 μg/L; [47]), and Busaa-type beers from Kenya (200–360 μg/kg [48]). However,relatively high DON concentrations (104–182 μg/L) have also been found in strong (>8% alcohol)Norwegian Imperial Stout beer [49]. In this study, we found a high DON concentration (156.5 μg/L)only in one strong (>8% alcohol) sample of a light beer.
17

Toxins 2019, 11, 715
Table 4. Selected literature data on mycotoxins in beer.
BeerNo. of
SamplesToxin
LOD(μg/L)
LOQ(μg/L)
Concentration(μg/L)Reference
Average Max
Wheat beer 46DON 1 4.5 18.4 49.6
[43]
DON-3G 0.9 3.5 11.5 28.43-AcDON 2.2 8.2 <LOD <LOD
Pale beer 217DON 2.2 5.4 12 89.3
DON-3G 0.4 3.5 9.3 81.33-AcDON 2.4 6.8 <LOD <LOD
Dark beer 47DON 2.9 11 22.4 45
DON-3G 1.4 4.1 10.7 26.23-AcDON 4.3 11 <LOD <LOD
Bock beer 20DON 1.2 4.1 13.8 27.1
DON-3G 0.5 1.5 14.8 33.33-AcDON 3.6 9.2 <LOD <LOD
Non-alcoholicbeer
19DON 1.2 3 14.8 33.3
DON-3G 0.4 1.4 3 6.63-AcDON 2.6 6 <LOD <LOD
Shandy beer 25DON 1.5 3.9 6.9 12.7
DON-3G 0.4 1.3 3.8 7.93-AcDON 2.7 10 <LOD <LOD
Wheat beer 10DON 1 4.5 14 27
[44]
DON-3G 0.9 3.5 8.6 153-AcDON 2.2 8.2 <LOD <LOD
Pale beer 10DON 2.2 5.4 13 30
DON-3G 0.4 3.5 8.3 193-AcDON 2.4 6.8 <LOD <LOD
Dark beer 10DON 2.9 11 11 11
DON-3G 1.4 4.1 9.6 163-AcDON 4.3 11 <LOD <LOD
Bock beer 10DON 1.2 4.1 13 22
[44]
DON-3G 0.5 1.5 16 323-AcDON 3.6 9.2 <LOD <LOD
Non-alcoholicbeer
10DON 1.2 3 3.7 3.7
DON-3G 0.4 1.4 2.3 3.13-AcDON 2.6 6 <LOD <LOD
Shandy beer 10DON 1.5 3.9 6.4 6.4
DON-3G 0.4 1.3 3.5 5.53-AcDON 2.7 10 <LOD <LOD
Light beers 158
DON 1 2.51.6–9.2
(depending onalcohol content)
3.7–35.9
[27]
DON-3G 1 2.5 1.7–5.8 1.2–37AcDONs 2 5 1.7–5.8 1.0–25
NIV 2.5 10 <LOD <LOD
Dark beers 18
DON 1 2.5 1.3–11.2 1.0–16.0DON-3G 1 2.5 <LOQ–7.8 <LOQ–26.0AcDONs 2 5 <LOQ–13.7 <LOQ–24.0
NIV 2.5 10 <LOD <LOD
18

Toxins 2019, 11, 715
Table 4. Cont.
BeerNo. of
SamplesToxin
LOD(μg/L)
LOQ(μg/L)
Concentration(μg/L)Reference
Average Max
Africantraditional
beer10
DON
n.r
10 81.8 140
[49]
DON-3G 2.5 <LOD <LODAcDONs 10 <LOQ <LOQ
NIV 5 8.7 9
Bock beer 2
DON
n.r.
10 52 64DON-3G 2.5 60 97AcDONs 10 <LOD <LOD
NIV 5 <LOD <LOD
Dark lager 2
DON
n.r.
10 32.5 41DON-3G 2.5 52 68AcDONs 10 <LOD <LOD
NIV 5 <LOD <LOD
Double IndiaPale Ale
1
DON
n.r.
10 67 67DON-3G 2.5 48 48AcDONs 10 <LOD <LOD
NIV 5 <LOD <LOD
Eisbock 1
DON
n.r.
10 32 32
[49]
DON-3G 2.5 32 32AcDONs 10 <LOD <LOD
NIV 5 <LOD <LOD
Fruit/Vegetable/Spice 1
DON
n.r.
10 <LOQ <LOQDON-3G 2.5 LOD LODAcDONs 10 <LOD <LOD
NIV 5 <LOD <LOD
Imperial Stout 18
DON
n.r.
10 95.1 412DON-3G 2.5 96.7 619AcDONs 10 <LOD <LOD
NIV 5 <LOD <LOD
India Pale Ale 3
DON
n.r.
10 40 64DON-3G 2.5 14 18AcDONs 10 <LOD <LOD
NIV 5 <LOD <LOD
Non/LowAlcohol
1
DON
n.r.
10 <LOQ <LOQDON-3G 2.5 <LOD <LODAcDONs 10 <LOD <LOD
NIV 5 <LOD <LOD
Pale ale 5
DON
n.r.
10 20.3 40DON-3G 2.5 29.5 82AcDONs 10 <LOQ <LOQ
NIV 5 <LOD <LOD
Pale Lager 6
DON
n.r.
10 12.5 13DON-3G 2.5 22 53AcDONs 10 <LOQ <LOQ
NIV 5 <LOD <LOD
Smoked 1
DON
n.r.
10 23 23DON-3G 2.5 14 14AcDONs 10 <LOQ <LOD
NIV 5 <LOD <LOD
19

Toxins 2019, 11, 715
Table 4. Cont.
BeerNo. of
SamplesToxin
LOD(μg/L)
LOQ(μg/L)
Concentration(μg/L)Reference
Average Max
Sour Ale 4
DON
n.r.
10 17 29
[49]
DON-3G 2.5 16.7 22AcDONs 10 <LOD <LOD
NIV 5 <LOD <LOD
Stout 4
DON
n.r.
10 28 30DON-3G 2.5 41.3 52AcDONs 10 <LOD <LOD
NIV 5 <LOD <LOD
Strong DarkPale
3
DON
n.r.
10 17.5 25DON-3G 2.5 26.5 35AcDONs 10 <LOQ <LOD
NIV 5 <LOD <LOD
Strong PaleAle
9
DON
n.r.
10 17.5 25DON-3G 2.5 26.5 35AcDONs 10 <LOQ <LOD
NIV 5 <LOD <LOD
Strong PaleLager 1
DON
n.r.
10 12 12DON-3G 2.5 17 17AcDONs 10 <LOQ <LOD
NIV 5 <LOD <LOD
Wheat beer 5
DON
n.r.
10 10 32DON-3G 2.5 4 41AcDONs 10 <LOQ <LOD
NIV 5 <LOD <LOD
Mild beer 28DON 1.3 4.1 10.5 65
[42]
DON-3G 1.9 6.2 7.6 25NIV 0.6 2.1 2.7 4.8
Regular beer 34DON 1.3 4.1 6.6 19.7
DON-3G 1.9 6.2 8.8 35.8NIV 0.6 2.1 1.5 7.4
Strong beer 38DON 1.3 4.1 10 73.6
DON-3G 1.9 6.2 10.3 35.2NIV 0.6 2.1 2.8 7.6
n.r. = not reported.
Some of the beer samples tested had a higher concentration of DON-3G than DON.Similar DON-3G/DON molar ratios have been reported in the literature, with averages of 0.56(range 0.11–1.25 [43]) and 0.79 (range 0.1–2.6 [49] and 0.7–1.0 [26]. As can be seen, the DON-3G/DONmolar ratios in beer are similar to those in malt.
2.3. Dietary Exposure Assessment
The following group TDI values were used in the assessment of risk of exposure to mycotoxinsfollowing beer consumption: 1 μg/kg body weight/day of the sum of DON, DON-3G, 3-AcDON, and15-AcDON [20] and 1.2 μg/kg body weight/day of the sum of NIV and NIV-3G [50]. The average beerconsumption in Poland is 97 L per capita annually, i.e., 0.27 L per capita per day [5]. In three consideredscenarios, it was assumed that consumed beer contained mycotoxins at a level equal to: (i) the median,(ii) the third quartile, or (iii) the maximum concentration found in our samples (the worst-case scenario).It was assumed that the average adult in Poland weighs 70 kg. The results of the calculations areshown in Table 5. PDI values remained a small fraction of TDI values in the first and second scenarios(5.1% and 7.9%, respectively, for DON and its derivatives and 0.32% and 0.61%, respectively, for NIVand its derivatives). In the improbable third scenario (worst case), the PDI would reach 65.2% of theTDI for DON and its derivatives and 2.41% of the TDI for NIV and its derivatives.
20

Toxins 2019, 11, 715
Table 5. Group probable daily intake and its share of the total daily intake calculated in three scenarios,in which different concentrations of mycotoxins were assumed in the consumed beer.
AssumedValues
DON DON+DON3G+3AcDON NIV+NIV3G
Concentration(μg/L)
* PDI(ng/kg b.w./day)
%TDIConcentration
(μg/L)PDI
(ng/kg b.w./day)%TDI
Concentration(μg/L)
PDI(ng/kg b.w./day)
%TDI
Median ** 8.3 31.5 3.2 14.2 50.7 5.1 1.1 3.8 0.32Quartile 3 ** 13.3 50.4 5.0 22.2 79.4 7.9 2.1 7.3 0.61Maximum 156.5 594.1 59.4 182.5 651.8 65.2 8.1 28.9 2.41
DON, deoxynivalenol; DON-3G, deoxynivalenol-3-glucoside; 3-AcDON, 3-acetyldeoxynivalenol; NIV, nivalenol;NIV-3G, nivalenol-3-glucoside; PDI, probable daily intake; TDI, total daily intake; * PDI = C∗Cd
b.w. , where C isconcentration of the mycotoxin in the contaminated beer, Cd is the average daily consumption of beer in Poland,and b.w. is mean body weight. ** If the measurement for any analyte was below the LOQ, the median and 3rdquartile were calculated assuming that the analyte was present at the level of LOQ/2.
The average consumption of 0.27 L of beer per day assumed in the above dietary exposureassessment does not reflect the real situation, since beer consumers rarely drink less than one bottle(0.5 L) per day. The PDI for persons drinking 0.5 L of beer daily would be approximately twice thevalues calculated above, in which case the TDI of DON and its derivatives would exceed the worst-casescenario by approximately 30%. Each additional beer bottle consumed per day would double theabove calculated PDI values. It is also worth noting that the analytical method developed here was notefficient at detecting 15-AcDON. However, since 3-AcDON was detected at very low levels, one canexpect that the contribution of 15-AcDON to the PDI is insignificant.
Of course, beer is not the main source of DON and its derivatives (the most important trichothecenesfrom a food safety point of view) in the human diet. Greater levels of exposure come from theconsumption of bakery products, corn flakes, pasta, and other grain-based foodstuffs that are consumeddaily, not only by beer consumers. Considering the exposition, bakery products and pastas are inEurope more and more often indicated as a possible quite serious threat to human health [50]. Studiesof markers in urine have shown that chronic exposure to DON and its derivatives is greater thanthe accepted TDI [51–53]. Therefore, the consumption of beer may increase the risk of excessivemycotoxin exposure.
Data on the risks associated with the consumption of mycotoxin-contaminated beers exist onlywith respect to officially regulated toxins. It is a common observation that DON is the greatest riskfactor, but beer is not generally considered an important source of dietary mycotoxin exposure. Even ifthe maximum detected DON concentrations are taken into account, the PDI values remain a smallpercentage of the TDI values, regardless of the country of origin of the beer. For example, the PDI is14.0–20.8% of the TDI in Poland [54]; 18% of the TDI in Brazil [46]; 0.15–6.14% of the TDI in Spain,where the average consumption is just half of that in Poland [55]; 0% of the TDI in Cyprus and 10% ofthe TDI in Ireland [56].
The consumption of mycotoxin-contaminated beer results in negligible risk of exposure to NIVand NIV-3G. EFSA has reported that even the consumption of bakery products and pasta is safe interms of exposure to these toxins [57]. In view of the low concentrations of NIV and NIV-3G, the PDIvalues are far below the TDI values, even for foodstuffs that are consumed in relatively large quantities,such as bakery products and pasta.
3. Conclusions
The data presented here on the co-occurrence of DON, NIV, and their metabolized (masked)forms in brewing malts and beers available on the Polish market are among the first reported in theliterature. Mycotoxins were found in the majority of the barley malt and beer samples tested. DONand its metabolite, DON-3G, were found most frequently (in more than 90% of samples), althoughat safely low levels. NIV and its metabolite, NIV-3G, were found at lower levels in malt and beersamples. Because of the low mycotoxin levels, none of the tested beers were regarded as unsafe from atoxicological point of view. However, in the worst-case scenario, the PDI would exceed the TDI forDON and its metabolites after drinking just one bottle (0.5 L) of beer.
21

Toxins 2019, 11, 715
4. Materials and Methods
4.1. Reagents and Standards
Certified reference standards of DON, 3-AcDON, and NIV (100 μg/mL in acetonitrile),and DON-3G (50 μg/mL in acetonitrile:water, 50:50, v/v), were purchased from Romer Labs(Tulln, Austria). NIV-3G (110 μg/mL) was isolated from wheat, according to the procedure describedby Yoshinari et al. [58]. Acetonitrile, methanol, and LC/MS-grade water were purchased from Witko(Łódz, Poland). Ammonium formate and formic acid (LC-MS grade) were obtained from FisherScientific (Millersburg, PA, USA). DON-NIV wide-bore (WB) immunoaffinity columns and PBS buffersolutions were purchased from Vicam (Watertown, NY, USA).
4.2. Research Material
One hundred and fifty-seven beer samples and 87 barley malt samples were analyzed. Variousbrands of light, dark, and wheat beers (mild, regular, and strong) were purchased in 2019 from localsupermarkets in Poland. Malt was sampled from various malt plants located throughout the country,in line with the guidelines specified within EC Regulation 519/2014 (February 23, 2006) [59], whichdescribes sampling and analysis methods for the official control of mycotoxin levels in foodstuffs. Allthe acquired samples belonged to the most common Pilsner malts, which are used to produce palestraw-colored ale and lager beers [36]. Malt samples, each with a mass of approximately 1 kg, wereground in a Knife Mill Grindomix GM 200 grinder (Retsch GmbH, Haan, Germany).
4.3. Sample Preparation
Malt and beer samples were prepared for analysis using a method previously described by ourresearch team [42,60]. After extraction and homogenization (for malt extraction in Unidrive 1000homogenizer, CAT Scientific Inc., Paso Robles, CA, USA), each sample was passed through a DON-NIVWB immunoaffinity column at a speed of 1–2 drops/s. The column was rinsed with 10 mL of PBS and10 mL of de-ionized water. Analytes were washed out of the column, first with 0.5 mL of methanol andthen with 1.5 mL of acetonitrile and were collected into a reaction vial. The solvent was evaporatedin a stream of nitrogen. The residues were re-dissolved in 300 μL of 30% methanol and analyzed byliquid chromatography-mass spectrometry (LC-MS). Samples were analyzed at three replications.
4.4. LC-MS Analysis
An H-class liquid chromatograph coupled to a mass spectrometer with a time-of-flight analyzer(UPLC-TOF-HRMS; Waters, Milford, MA, USA) was used to analyze mycotoxins. Analytes wereseparated on a 2.1 × 100 mm, 1.6 μm UPLC C18 Cortecs chromatographic column (Waters) with anappropriate pre-column, operated with a gradient regime. Phase A was 90:10 v/v methanol:water,phase B was 10:90 v/v methanol:water. Both phases contained 0.2% formic acid and 10 mM ammoniumformate. The flow rate was 0.3 mL/min, with the following flow gradient: 0–2 min, 100% B; 3–6 min,50% B; 22–23 min, 100% A; and 25–28 min, 100% B. Five microliters of each sample was injected ontothe column. The mass spectrometer was operated in the positive/negative electrospray ionizationmode, with an ion source temperature of 150 ◦C and a desolvation temperature of 300/350 ◦C forpositive/negative ionization, respectively. The nebulizing gas (N2) flow rate was 750 L/min and thecone gas flow rate was 40 L/min. The capillary bias was 3200 V. Ion optics was operated in V mode andthe instrument was calibrated using a leucine-enkephalin solution.
4.5. Method Validation
Linearity ranges, limits of detection (LOD, the concentration at which the signal:noise ratio was 3),limits of quantification (LOQ, the concentration at which the signal:noise ratio was 10), recovery rates(R), and repeatability/precision (expressed as the relative standard deviation [RSD]), were determined
22

Toxins 2019, 11, 715
using calibration curves that were constructed using separate blank samples for each mycotoxin ofinterest in the beer and malt matrices. The blanks were prepared in the same way as the analytes,except that the respective amount of standard mixture was added just prior to finally dissolving it in30% methanol, after which the solvent was removed in a dry nitrogen stream. Each calibration curveconsisted of eight points. The concentrations covered for the malt samples (in μg/kg) were: 5.0–1028for DON; 4.0–516 for DON-3G; 2.0–1028 for 3-AcDON; 8.0–1050 for NIV; and 5.0–565 for NIV-3G. Theconcentrations covered for the beer samples (in μg/L) were: 3–68.6 for DON; 2.1–34.4 for DON-3G;0.9–68.6 for 3-AcDON; 2.1–70.1 for NIV; and 1.6–37.7 for NIV-3G. The results of the analytical methodvalidation experiment are shown in Tables 6 and 7.
Table 6. Limits of detection, limits of quantification, and determination coefficients for individualanalytes determined in malt and beer samples.
Analyte Ion Mass (m/z)Retention
Time (min)
Malt Beer
LOD(μg/kg)
LOQ(μg/kg)
R2 LOD(μg/L)
LOQ(μg/L)
R2
DON 341.2 (M+FA−H)− 4.08 5 17 0.9891 0.6 2.1 0.9977DON-3G 503.2 (M+FA−H)− 4.22 4 13 0.9910 0.5 1.6 0.99193-AcDON 339.2 (M+H)+ 4.98 2 7 0.9974 0.3 0.9 0.9899
NIV 357.2 (M+FA−H)− 2.38 8 24 0.9909 1.0 3.0 0.9889NIV-3G 519.2 (M+FA−H)− 2.45 5 17 0.9905 0.6 2.1 0.9989
DON, deoxynivalenol; DON-3G, deoxynivalenol-3-glucoside; 3-AcDON, 3-acetyldeoxynivalenol; NIV, nivalenol;NIV-3G, nivalenol-3-glucoside; LOD, limit of detection; LOQ, limit of quantification; R2, determination coefficient.
Table 7. Recovery rates and relative standard deviations for individual analytes determined in maltand in beer samples spiked at different fortification levels.
AnalyteMalt (n = 4) Beer (n = 4)
Fortification Level(μg/kg)
R (%) RSD (%)Fortification Level
(μg/L)R (%) RSD (%)
DON
42.9128.6514.3
1028.5
90.794.3
101.397.0
12.98.2
11.915.0
17.134.368.6
75.0106.085.0
8.82.89.5
DON-3G
21.564.5258.1516.2
87.473.589.979.1
6.19.811.115.4
8.617.234.4
87.093.089.0
6.72.56.0
3-AcDON
42.9128.6514.3
1028.5
105.1105.4103.8102.1
18.44.78.822.1
17.134.368.6
93.097.087.0
6.72.76.7
NIV
43.8131.4525.6
1051.2
89.985.885.183.7
11.48.69.3
13.0
17.535.070.1
80.0100.091.0
6.26.59.4
NIV-3G
23.670.7
282.8565.6
105.085.087.786.4
13.77.89.6
13.1
9.418.937.7
93.0101.096.0
6.76.68.0
DON, deoxynivalenol; DON-3G, deoxynivalenol-3-glucoside; 3-AcDON, 3-acetyldeoxynivalenol; NIV, nivalenol;NIV-3G, nivalenol-3-glucoside; R, recovery rate; RSD, relative standard deviation.
Since all analytes of interest belonged to the trichothecenes group, we assessed the performance ofthe method for DON analysis using the following specifications listed in EC Regulation 519/2014 [59]:recovery rates 60%–110% or 70%–120%, depending on the fortification level and RSD ≤20%. These
23

Toxins 2019, 11, 715
criteria were met in 34 out of 35 analyte/fortification level combinations. In one case, the RSD wasabove 20%.
This validated method was then used to analyze DON, DON-3G, 3-AcDON, NIV, and NIV-3G inthe malt and beer samples.
Supplementary Materials: The following are available online at http://www.mdpi.com/2072-6651/11/12/715/s1,Table S1: Individual results of mycotoxin concentrations in the analyzed beer and malt samples.
Author Contributions: Conceptualization, E.K.-W. and M.B.; methodology, M.B. and A.W.; formal analysis, M.B.and E.K.-W.; performed isolation of the NIV-3G analytical standard, T.Y.; performed the manuscript preparation,M.B., E.K.-W. and T.Y.; supervised the research, A.W., K.S.
Funding: This research was financially supported from the Polish National Science Centre project2016/21/D/NZ9/02597.
Conflicts of Interest: The authors declare no conflict of interest.
References
1. Zhou, M.X. Barley Production and Consumption. In Genetics and Improvement of Barley Malt Quality; Zhang, G.,Li, C., Eds.; Springer: Berlin/Heidelberg, Germany, 2009; pp. 1–17.
2. Central Statistics Office (CSO). Available online: https://www.cso.ie/en/releasesandpublications/er/aypc/areayieldandproductionofcrops2018 (accessed on 20 September 2019).
3. Ha, K.S.; Jo, S.H.; Mannam, V.; Kwon, Y.I.; Apostolidis, E. Stimulation of phenolics, antioxidant andα-glucosidase inhibitory activities during barley (Hordeum vulgare L.) seed germination. Plant Food Hum.Nutr. 2016, 71, 211–217. [CrossRef]
4. Tricase, C.; Amicarelli, V.; Lamonaca, E.; Rana, R.L. Economic analysis of the barley market and related uses.In Grasses as Food and Feed; Tadele, Z., Ed.; IntechOpen Limited: London, UK, 2018; pp. 25–46.
5. The Brewers of Europe. Beer Statistics, 2018 ed.; The Brewers of Europe: Brussels, Belgium, 2018.6. Eagles, H.A.; Bedggood, A.G.; Panozzo, J.F.; Martin, P.J. Cultivar and environmental effects on malting
quality in barley. Aust. J. Agric. Res. 1995, 46, 831–844. [CrossRef]7. Popovski, S.; Celar, F.A. The impact of environmental factors on the infection of cereals with Fusarium species
and mycotoxin production-a review. Acta Agric. Slov. 2013, 101, 105–116. [CrossRef]8. Perkowski, J.; Kiecana, I.; Kaczmarek, Z. Natural occurrence and distribution of Fusarium toxins in
contaminated barley cultivars. Eur. J. Plant. Pathol. 2003, 109, 331–339. [CrossRef]9. Nielsen, L.K.; Cook, D.J.; Edwards, S.G.; Ray, R.V. The prevalence and impact of Fusarium head blight
pathogens and mycotoxins on malting barley quality in UK. Int. J. Food Microbiol. 2014, 179, 38–49. [CrossRef][PubMed]
10. Schwarz, P.B.; Schwarz, J.G.; Zhou, A.; Prom, L.K.; Steffenson, B.J. Effect of Fusarium graminearum and F. Poaeinfection on barley and malt quality. Monatsschrift Brauwiss. 2001, 54, 55–63.
11. Abbas, H.K.; Yoshizawa, T.; Shier, W.T. Cytotoxicity and phytotoxicity of trichothecene mycotoxins producedby Fusarium spp. Toxicon 2013, 74, 68–75. [CrossRef] [PubMed]
12. International Agency for Research on Cancer. Some Naturally Occurring Substances: Food Items and Constituents,Heterocyclic Aromatic Amines and Mycotoxins; Monograph on the evaluation of carcinogenic risks to humans;International Agency for Research on Cancer: Lyon, France, 1993.
13. Pestka, J.J. Deoxynivalenol: Toxicity, mechanisms and animal health risks. Anim. Feed Sci. Technol. 2007, 137,283–298. [CrossRef]
14. Zinedine, A.; Soriano, J.M.; Moltó, J.C.; Mañes, J. Review on the toxicity, occurrence, metabolism, detoxification,regulations and intake of zearalenone: An oestrogenic mycotoxin. Food Chem. Toxicol. 2007, 45, 1–18.[CrossRef]
15. Pasquali, M.; Beyer, M.; Logrieco, A.; Audenaert, K.; Balmas, V.; Basler, R.; Boutigny, A.L.; Chrpová, J.;Czembor, E.; Gagkaeva, T.; et al. A European database of Fusarium graminearum and F. culmorum trichothecenegenotypes. Front. Microbiol. 2016, 7, 406. [CrossRef]
16. Shin, S.; Torres-Acosta, J.A.; Heinen, S.J.; McCormick, S.; Lemmens, M.; Kovalsky Paris, M.P.; Berthiller, F.;Adam, G.; Muehlbauer, G.J. Transgenic Arabidopsis thaliana expressing a barley UDP-glucosyltransferaseexhibit resistance to the mycotoxin deoxynivalenol. J. Exp. Bot. 2012, 63, 4731–4740. [CrossRef] [PubMed]
24
Toxins 2019, 11, 715
17. Miedaner, T.; Korzun, V. Marker-assisted selection for disease resistance in wheat and barley breeding.Phytopathology 2012, 102, 560–566. [CrossRef] [PubMed]
18. Amarasinghe, C.C.; Simsek, S.; Brulè-Babel, A.; Fernando, W.G.D. Analysis of deoxynivalenol anddeoxynivalenol-3-glucosides content in Canadian spring wheat cultivars inoculated with Fusariumgraminearum. Food Addit. Contam. A 2016, 33, 1254–1264. [CrossRef] [PubMed]
19. Pestka, J. Toxicological mechanisms and potential health effects of deoxynivalenol and nivalenol. WorldMycotoxin J. 2010, 3, 323–347. [CrossRef]
20. Knutsen, H.K.; Alexander, J.; Barregård, L.; Bignami, M.; Brüschweiler, B.; Ceccatelli, S.; Cottrill, B.;Dinovi, M.; Grasl-Kraupp, B.; Hogstrand, C.; et al. Risks to human and animal health related to the presenceof deoxynivalenol and its acetylated and modified forms in food and feed. EFSA J. 2017, 15, 4718. [CrossRef]
21. European Commission. Commission Regulation (EC) No 1881/2006 of 19 December 2006 setting maximumlevels for certain contaminants in foodstuffs. Off. J. Eur. Union 2006, 364, 5–24.
22. Busman, M.; Poling, S.M.; Maragos, C.M. Observation of T-2 toxin and HT-2 toxin glucosides from Fusariumsporotrichioides by liquid chromatography coupled to tandem mass spectrometry (LC-MS/MS). Toxins 2011, 3,1554–1568. [CrossRef]
23. Nakagawa, H.; Ohmichi, K.; Sakamoto, S.; Sago, Y.; Kushiro, M.; Nagashima, H.; Yoshida, M.; Nakajima, T.Detection of a new Fusarium masked mycotoxin in wheat grain by high-resolution LC-Orbitrap MS. FoodAddit. Contam. A 2011, 28, 1447–1456. [CrossRef]
24. Nakagawa, H.; Sakamoto, S.; Sago, Y.; Nagashima, H. Detection of type A trichothecene di-glucosidesproduced in corn by high-resolution liquid chromatography-Orbitrap mass spectrometry. Toxins 2013, 5,590–604. [CrossRef]
25. Berthiller, F.; Dall’Asta, C.; Corradini, R.; Marchelli, R.; Sulyok, M.; Krska, R.; Adam, G.; Schuhmacher, R.Occurrence of deoxynivalenol and its 3-beta-D-glucoside in wheat and maize. Food Addit. Contam. A 2009,26, 507–511. [CrossRef]
26. Dall’Asta, C.; Dall’Erta, A.; Mantovani, P.; Massi, A.; Galaverna, G. Occurrence of deoxynivalenol anddeoxynivalenol-3-glucoside in durum wheat. World Mycotoxin J. 2013, 6, 83–91. [CrossRef]
27. Kostelanska, M.; Hajslova, J.; Zachariasova, M.; Malachova, A.; Kalachova, K.; Poustka, J.; Fiala, J.; Scott, P.M.;Berthiller, F.; Krska, R. Occurrence of deoxynivalenol and its major conjugate, deoxynivalenol-3-glucoside, inbeer and some brewing intermediates. J. Agric. Food Chem. 2009, 57, 3187–3194. [CrossRef] [PubMed]
28. Lancova, K.; Hajslova, J.; Poustka, J.; Krplova, A.; Zachariasova, M.; Dostalek, P.; Sachambula, L. Transfer ofFusarium mycotoxins and “masked” deoxynivalenol (deoxynivalenol-3-glucoside) from field barley throughmalt to beer. Food Addit. Contam. A 2008, 25, 732–744. [CrossRef] [PubMed]
29. Maul, R.; Müller, C.; Rieß, S.; Koch, M.; Methner, F.J.; Nehls, I. Germination induces the glucosylation of theFusarium mycotoxin deoxynivalenol in various grains. Food Chem. 2012, 131, 274–279. [CrossRef]
30. Spanic, V.; Zdunic, Z.; Drezner, G.; Sarkanj, B. The pressure of Fusarium disease and its relation withmycotoxins in the wheat grain and malt. Toxins 2019, 11, 198. [CrossRef] [PubMed]
31. MEBAK®. Methodensammlung der Mitteleuropäischen Analysenkommission. In Raw Materials: Barley,Adjuncts, Malt, Hops and Hop Products; Jacob, F., Ed.; Selbstverlag der MEBAK®: Freising-Weihenstephan,Germany, 2011.
32. Jin, Z.; Cao, Y.; Su, A.; Yu, Y.; Xu, M. Increase of deoxynivalenol during the malting of naturally Fusariuminfected Chinese winter wheat. Food Control. 2018, 87, 88–93. [CrossRef]
33. Jin, Z.; Gillespie, J.; Barr, J.; Wiersma, J.J.; Sorrells, M.E.; Zwinger, S.; Gross, T.; Cumming, J.; Bergstrom, G.C.;Brueggeman, R.; et al. Malting of Fusarium Head Blight-infected rye (Secale cereale): Growth of Fusariumgraminearum, trichothecene production, and the impact on malt quality. Toxins 2018, 10, 369. [CrossRef]
34. Jin, Z.; Zhou, B.; Gillespie, J.; Gross, T.; Barr, J.; Simsek, S.; Brueggeman, R.; Schwarz, P.B. Production ofdeoxynivalenol (DON) and DON-3-glucoside during the malting of Fusarium infected hard red spring wheat.Food Control. 2018, 85, 6–10. [CrossRef]
35. Yu, J.; Yin, H.; Dong, J.; Zhang, C.; Zhang, B.; Jin, Z.; Cao, Y. Pullulation of toxigenic Fusarium anddeoxynivalenol in the malting of de minimis infected barley (Hordeum vulgare). LWT Food Sci. Tech. 2019, 113,108242. [CrossRef]
36. Shellhammer, T.H. Beer Fermentations. In The Oxford Handbook of Food Fermentations; Bamforth, C.W.,Ward, R.E., Eds.; Oxford University Press: Oxford, UK, 2014.
25

Toxins 2019, 11, 715
37. Carvalho, D.O.; Gonçalves, L.M.; Guido, L.F. Overall antioxidant properties of malt and how they areinfluenced by the individual constituents of barley and the malting process. Compr. Rev. Food Sci. Food Saf.2016, 15, 927–943. [CrossRef]
38. Oliver, G. The Oxford Companion to Beer, 1st ed.; Oxford University Press: Oxford, UK, 2011.39. Papadopoulou-Bouraoui, A.; Vrabcheva, T.; Valzacchi, S.; Stroka, J.; Anklam, E. Screening survey of
deoxynivalenol in beer from the European market by an enzyme-linked immunosorbent assay. Food Addit.Contam. 2004, 21, 607–617. [CrossRef] [PubMed]
40. Zachariasova, M.; Hajslova, J.; Kostelanska, M.; Poustka, J.; Krplova, A.; Cuhra, P.; Hochel, I. Deoxynivalenoland its conjugates in beer: A critical assessment of data obtained by enzyme-linked immunosorbent assayand liquid chromatography coupled to tandem mass spectrometry. Anal. Chim. Acta 2008, 625, 77–86.[CrossRef] [PubMed]
41. Esslinger, H.M.; Narziss, L. Beer. In Ullmann’s Encyclopedia of Industrial Chemistry; Wiley-VCH Verlag GmbH& Co. KGaA: Weinheim, Germany, 2009.
42. Bryła, M.; Ksieniewicz-Wozniak, E.; Waskiewicz, A.; Szymczyk, K.; Jedrzejczak, R. Co-occurrence of nivalenol,deoxynivalenol and deoxynivalenol-3-glucoside in beer samples. Food Control. 2018, 92, 319–324. [CrossRef]
43. Varga, E.; Malachova, A.; Schwartz, H.; Krska, R.; Berthiller, F. Survey of deoxynivalenol and its conjugatesdeoxynivalenol-3-glucoside and 3-acetyl-deoxynivalenol in 374 beer samples. Food Addit. Contam. 2013, 30,137–146. [CrossRef]
44. Malachova, A.; Varga, E.; Schwartz, H.; Krska, R.; Berthiller, F. Development, validation and application ofan LC-MS/MS based method for the determination of deoxynivalenol and its conjugates in different types ofbeer. World Mycotoxin J. 2012, 5, 261–270. [CrossRef]
45. Bertuzzi, T.; Rastelli, S.; Mulazzi, A.; Donadini, G.; Amedeo, P. Mycotoxin occurrence in beer produced inseveral European countries. Food Control. 2011, 22, 2059–2064. [CrossRef]
46. Piacentini, K.C.; Savi, G.D.; Olivo, G.; Scussel, V.M. Quality and occurrence of deoxynivalenol and fumonisinsin craft beer. Food Control. 2015, 50, 925–929. [CrossRef]
47. Roger, D.D. Deoxynivanol (DON) and fumonisins B1 (FB1) in artisanal sorghum opaque beer brewed innorth Cameroon. Afr. J. Microbiol. Res. 2011, 5, 1565–1567. [CrossRef]
48. Kirui, M.C.; Alakonya, A.E.; Talam, K.K.; Tohru, G.; Bii, C.C. Total aflatoxin, fumonisin and deoxynivalenolcontamination of busaa in Bomet county, Kenya. Afr. J. Biotechnol. 2014, 13, 2675–2678. [CrossRef]
49. Peters, J.; van Dam, R.; van Doorn, R.; Katerere, D.; Berthiller, F.; Haasnoot, W.; Nielen, M.W.F. Mycotoxinprofiling of 1000 beer samples with a special focus on craft beer. PLoS ONE 2017, 12, e0185887. [CrossRef]
50. EFSA CONTAM Panel (EFSA Panel on Contaminants in the Food Chain). Scientific Opinion on risks foranimal and public health related to the presence of nivalenol in food and feed. EFSA J. 2013, 11, 3262.[CrossRef]
51. Vidal, A.; Cano-Sancho, G.; Marin, S.; Ramos, A.J.; Sanchis, V. Multidetection of urinary ochratoxin A,deoxynivalenol and its metabolites: Pilot time-course study and risk assessment in Catalonia, Spain. WorldMycotoxin J. 2016, 9, 597–612. [CrossRef]
52. Heyndrickx, E.; Sioen, I.; Huybrechts, B.; Callebaut, A.; De Henauw, S.; De Saeger, S. Human biomonitoringof multiple mycotoxins in the Belgian population: Results of the BIOMYCO study. Environ. Int. 2015, 84,82–89. [CrossRef] [PubMed]
53. Warth, B.; Sulyok, M.; Fruhmann, P.; Berthiller, F.; Schuhmacher, R.; Hametner, C.; Adam, G.; Frohlich, J.;Krska, R. Assessment of human deoxynivalenol exposure using an LC-MS/MS based biomarker method.Toxicol. Lett. 2012, 211, 85–90. [CrossRef] [PubMed]
54. Grajewski, J.; Kosicki, R.; Twaruzek, M.; Błajet-Kosicka, A. Occurrence and Risk Assessment of Mycotoxinsthrough Polish Beer Consumption. Toxins 2019, 11, 254. [CrossRef]
55. Pascari, X.; Ortiz-Solá, J.; Marín, S.; Ramos, A.J.; Sanchis, V. Survey of mycotoxins in beer and exposureassessment through the consumption of commercially available beer in Lleida, Spain. LWT Food Sci. Technol.2018, 92, 87–91. [CrossRef]
56. Rodriguez-Carrasco, Y.; Fattore, M.; Albrizio, S.; Berrada, H.; Manes, J. Occurrence of Fusarium mycotoxinsand their dietary intake through beer consumption by the European population. Food Chem. 2015, 178,149–155. [CrossRef]
57. European Food Safety Authority. Deoxynivalenol in food and feed: Occurrence and exposure. EFSA J. 2013,11, 3379. [CrossRef]
26

Toxins 2019, 11, 715
58. Yoshinari, T.; Sakuda, S.; Furihata, K.; Furusawa, H.; Ohnishi, T.; Sugita-Konishi, Y.; Ishizaki, N.; Terajima, J.Structural determination of a nivalenol glucoside and development of an analytical method for thesimultaneous determination of nivalenol and deoxynivalenol, and their glucosides, in wheat. J. Agric. FoodChem. 2014, 62, 1174–1180. [CrossRef]
59. European Commission. Commission Regulation (EC) No 519/2014 of 16 May 2014 amending Regulation(EC) No 401/2006 as regards methods of sampling of large lots, spices and food supplements, performancecriteria for T-2, HT-2 toxin and citrinin and screening methods of analysis. Off. J. Eur. Union 2014, 147, 29–43.
60. Bryła, M.; Ksieniewicz-Wozniak, E.; Yoshinari, T.; Waskiewicz, A.; Szymczyk, K. Contamination of wheatcultivated in various regions of Poland during 2017 and 2018 agricultural seasons with selected trichothecenesand their modified forms. Toxins 2019, 11, 88. [CrossRef] [PubMed]
© 2019 by the authors. Licensee MDPI, Basel, Switzerland. This article is an open accessarticle distributed under the terms and conditions of the Creative Commons Attribution(CC BY) license (http://creativecommons.org/licenses/by/4.0/).
27


toxins
Article
Acrylamide Reduction Strategy in Combinationwith Deoxynivalenol Mitigation in IndustrialBiscuits Production
Michele Suman 1,*, Silvia Generotti 1,2, Martina Cirlini 2 and Chiara Dall’Asta 2
1 Advanced Research Laboratory, Barilla G. e R. Fratelli S.p.A., Via Mantova, 166-43122 Parma, Italy2 Department of Food & Drug, University of Parma, Parco Area delle Scienze, 95/A-43124 Parma, Italy* Correspondence: [email protected]
Received: 12 August 2019; Accepted: 22 August 2019; Published: 27 August 2019
Abstract: Acrylamide is formed during baking in some frequently consumed food products. It isproven to be carcinogenic in rodents and a probable human carcinogen. Thus, the food industry isworking to find solutions to minimize its formation during processing. To better understand thesources of its formation, the present study is aimed at investigating how acrylamide concentrationmay be influenced by bakery-making parameters within a parallel strategy of mycotoxin mitigation(focusing specifically on deoxynivalenol—DON) related to wholegrain and cocoa biscuit production.Among Fusarium toxins, DON is considered the most important contaminant in wheat and relatedbakery products, such as biscuits, due to its widespread occurrence. Exploiting the power of a Designof Experiments (DoE), several conditions were varied as mycotoxin contamination levels of theraw materials, recipe formulation, pH value of dough, and baking time/temperature; each selectedtreatment was varied within a defined range according to the technological requirements to obtainan appreciable product for consumers. Experiments were performed in a pilot-plant scale in orderto simulate an industrial production and samples were extracted and analysed by HPLC-MS/MSsystem. Applying a baking temperature of 200 ◦C at the highest sugar dose, acrylamide increased itsconcentration, and in particular, levels ranged from 306 ± 16 μg/Kg d.m. and 400 ± 27 μg/Kg d.m.in biscuits made without and with the addition of cocoa, respectively. Conversely, using a bakingtemperature of 180 ◦C in the same conditions (pH, baking time, and sugar concentrations), acrylamidevalues remained below 125 ± 14 μg/Kg d.m. and 156 ± 15 μg/Kg d.m. in the two final products.The developed predictive model suggested how some parameters can concretely contribute to limitacrylamide formation in the final product, highlighting a significant role of pH value (correlated alsoto sodium bicarbonate raising agent), followed by baking time/temperature parameters. In particular,the increasing range of baking conditions influenced in a limited way the final acrylamide contentwithin the parallel effective range of DON reduction. The study represents a concrete example ofhow the control and optimization of selected operative parameters may lead to multiple mitigationof specific natural/process contaminants in the final food products, though still remaining in thesensorial satisfactory range.
Keywords: acrylamide; deoxynivalenol; multiple mitigation strategies; design of experiments; bakeryfood processing; biscuits
Key Contribution: The study here reported represents a concrete example of how the control andoptimization of selected operative industrial parameters may lead to multiple mitigation of specificnatural/process contaminants in the final food products: in this specific case Deoxynivalenol &Acrylamide within the contest of biscuits production.
Toxins 2019, 11, 499; doi:10.3390/toxins11090499 www.mdpi.com/journal/toxins29

Toxins 2019, 11, 499
1. Introduction
Process-related mitigation strategies are among the most promising tools for controllingand minimizing mycotoxins, i.e., Fusarium mycotoxins, in cereal-based products [1]. Among Fusariummycotoxins, deoxynivalenol (DON), along with its modified forms, is considered the most importantcontaminant in wheat and related bakery products, such as biscuits, due to its widespread occurrence [2].It has been shown that milling and baking/roasting may effectively reduce the amount of DON inthe bakery. At this purpose, Generotti et al. reported on the strategic mitigation of DON andits related compounds deoxynivalenol-3-glucoside (DON3Glc) and culmorin, during two differentbiscuit processes, exploiting the synergistic effects of recipe formulation and thermal treatment [3].A significant reduction was achieved while not negatively impacting product quality and identity.However, increased time and temperature during baking might favor the formation of process-derivedcontaminants, such as acrylamide, in the final product.
Besides often reported among the most studied contaminants in cereal-based products, mycotoxinsand acrylamide are almost unavoidable compounds, being the former natural toxins accumulated incrops under natural field conditions, and the latter process-related compounds formed in food duringmanufacturing, as a consequence of chemical reaction triggered by processing.
Although their toxic effects have been deeply studied as single compounds, little to nothing isknown about combined effects exerted in animals and humans. Nonetheless, the scientific communityis posing increasing emphasis on health concern related to the exposure to chemical mixtures, asrecently reported by the European Food Safety Authority [4]. Therefore, the identification of possiblestrategies for the simultaneous mitigation of mycotoxins and acrylamide, are of upmost interest for theagro-food sector.
Concerning process-related compounds, food industry and the European Commission haveundertaken extensive efforts since 2002, when scientists from the Swedish National Food Authorityand the University of Stockholm reported high levels of acrylamide in normally cooked starch-richfood (compared to what had been reported earlier in other food commodities), in order to investigatepathways of formation and to reduce its levels in processed food.
Acrylamide is typically formed from an amino acid, primarily asparagine, and a reducing sugarsuch as fructose or glucose in starchy food products during high temperature cooking, including frying,baking and roasting through a series of reactions, known as Maillard reactions. Its formation startsat temperatures around 120 ◦C and peaks at temperatures between 160 and 180 ◦C [5,6]. Due to itstoxicity and possible carcinogenic effects to humans (IARC—International Agency for Research onCancer [7]), the European Commission has established mitigation measures and benchmark levels forits concrete reduction in food [8,9].
Several attempts have been made so far to develop mitigation strategies for acrylamide formationin bakery products, mainly focused on the processing stage and recipes [10–17]. Each strategy couldpresent limiting factors in their applicability depending on the product type and industrial settingsas feasibility and compatibility with processing, formulation, impact on sensory and nutritionalcharacteristics, regulatory compliance and costs.
Acrylamide formation is favored by a high baking temperature and time treatment [17–23],therefore a decreasing of thermal input represents an effective way of mitigation. Reduction canbe obtained by applying prolonged heating at lower temperatures, or at lower pressure than theatmospheric one [16] or by optimizing the oven temperature profile. On the other hand, a decreasedthermal input may significantly affect the achievement of both appropriate hygienic properties andsensorial acceptance of the final product.
Moving from our previous studies [24–27], the present investigation is aimed at verifying howacrylamide concentration in bakery products, such as wholegrain and cocoa biscuits, is affected bymodifications of technological parameters (recipe formulation and baking time/temperature) duringbiscuit-making process (Figure 1), while at the same targeting potential DON reduction and withoutaffecting the sensory properties.
30

Toxins 2019, 11, 499
Figure 1. Scheme of wholegrain and cocoa biscuit production.
In this regard, predictive models would represent a time and cost-saving tool for finding the mostsuitable conditions for minimizing both natural occurring and process-related contaminants. In thepresent work, we have exploited them to estimate acrylamide evolution in a considered system and tomanage the industrial process to optimize the role of involved parameters with regard to its formation.
Starting from naturally DON contaminated raw material, the experiments were performed usingstatistical Design of Experiment (DoE) schemes to explore the relationship between the analyticalresponses and independent variables conducting to an overall optimization of the baking process [28].In particular, this approach was conducted in order to consider only those modifications that can bereally applied to the industrial scale, obtaining a final product appreciable by consumers and remainingin an acceptable technological range.
2. Results and Discussion
The present study was carried out to better understand whether and how acrylamide evolutioncould be influenced by selected technological factors within a strategy of DON mitigation related towholegrain and cocoa biscuit production. Different parameters were considered and a variation rangewas defined, as shown in Table 1. The statistical model required 19 single experiments per technologicalprocess; acrylamide level was measured by LC-MS/MS according to a previously published methodwith slight modifications [29].
Table 1. Wholegrain and cocoa biscuit experiments—pilot plant processing conditions.
TREATMENT
WHOLEGRAIN BISCUIT MAKING COCOA BISCUIT MAKING
MinimumCentralPoint
Maximum MinimumCentralPoint
Maximum
DON bran level(μg/kg) 600 1050 1500 600 1050 1500
Dextrose (%) 15 19 23 15 19 23
Milk (%) - - - 5 6.5 8
Eggs (%) 4 6 7 - - -
Margarine (%) 10 15 20 - - -
pH value 5 6.5 8 5 6.5 8
Baking time(min) 5 6.5 8 5 6.5 8
Bakingtemperature (◦C) 180 190 200 180 190 200
31

Toxins 2019, 11, 499
2.1. Statistical Elaboration of the Experimental Model
At the end of the analysis performed on the collected samples, MODDE software extracted ananswer concerning robustness and prediction capability of the method, evaluating model efficiencyby fitting (R2) and prediction (Q2) values. Replicate values of acrylamide reduction per experimentwere expressed on dry matter basis and averaged for the statistical elaboration. Partial least-squares(PLS) was chosen as the statistical regression treatment. The two statistical models (wholegrain andcocoa biscuit model) gave high fitting (R2 > 0.7) and good prediction value (Q2 ≥ 0.5), referring to theMODDE software output settings. Model robustness was also confirmed by ANOVA plot (Figure 2),being standard deviation of the regression much larger than standard deviation of the residuals.
Figure 2. Design of Experiments on acrylamide levels within cocoa biscuit-making—Model Robustnessby ANOVA plot.
2.2. Acrylamide Evolution within Biscuit-Making Technology
All values were collected in a Variable Importance Plot (VIP, Figure 3) that enables (and illustratesin an effective and condensed way) an understanding of the effect of each factor in terms of influenceon acrylamide response.
In the present case, VIP would suggest that the pH value, has the most relevant effect on thefinal acrylamide level: in fact pH increase is responsible for an acceleration of the reaction betweenasparagine and the reducing sugars, followed by baking time/temperature parameters.
With regard to the other minor ingredients, dextrose (or glucose) content confirm (as reportedin previous scientific literature findings) to contribute to the overall acrylamide increase. When highdextrose level and higher thermal input are employed (200 ◦C for 8 min) an acrylamide increaseup to 120% was observed (data not shown) with respect to the central point. On the other hand, acombination of lower dextrose content and moderate thermal input (180 ◦C for 8 min) may lead to areduction up to 77%.
This is consistent with literature studies in which it was demonstrated that increasing the quantityof sugars in cookies formulation, as glucose and sucrose, the concentration of acrylamide raised upespecially when a temperature of 205◦ was applied for 11 min. Moreover, the choice of the sugarresulted crucial for keeping acrylamide formation under control. Using glucose, a reducing compound,and applying the same baking conditions, acrylamide content increased more in respect to sucrose. So,the authors suggested to use sucrose in order to obtain a reduction of about the 50% of acrylamideproduction [30,31]. Similar results were showed by Vass et al. [32] whom replaced invert sugar syrupwith sucrose in wheat crackers, obtaining an acrylamide reduction by 60%. In addition, the samestudies speculated that applying baking temperatures of 160◦C the formation of acrylamide remains
32

Toxins 2019, 11, 499
below 150 μg/Kg [30]. Also in this study, the measured amount of acrylamide presented values belowor close to 150 μg/Kg when the baking temperature did not exceed 180 ◦C (Table 2).
Figure 3. Variable Importance Plot (VIP) obtained for the data referred to cocoa biscuit-making process:influence of each main factor with respect to acrylamide response: pH, ct (cooking time), Temperature(Temp), Egg.
Table 2. Analytical results for acrylamide levels throughout several wholegrain and cocoa biscuit-makingprocess trials.
Sample
Baking Stage
DON inWholegrain
Flour(μg/kg d.m.) *
NaHCO3(g)
Time(min)
Temperature(◦C)
Acrylamide(μg/kg d.m.) *
DON(μg/kg d.m.) *§
Wholegrainbiscuits
219 ± 8 8 5 180 16 ± 3 154 ± 1
304 ± 9 8 8 180 125 ± 14 192 ± 4
219 ± 8 8 5 200 66 ± 10 188 ± 7
304 ± 9 8 8 200 306 ± 16 189 ± 7
Cocoabiscuits
219 ± 8 8 5 180 43 ± 13 129 ± 7
304 ± 9 8 8 180 156 ± 15 208 ± 2
219 ± 8 8 5 200 185 ± 15 154 ± 1
304 ± 9 8 8 200 400 ± 27 192 ± 4
* Data expressed as mean value ± standard deviation. § Data reported and discussed elsewhere [3].
Furthermore, some authors showed how acrylamide mitigation can be achieved by adding aminoacids or protein-based ingredients to food, which may influence the reaction pathway or favor AAdegradation [33–35]. In our study, no significant mitigation was obtained probably due to the closevariation range related to milk/egg content in the recipe formulation.
Basically, acrylamide content seems to be affected by the food matrix, being higher for the cocoabiscuits than for the wholegrain biscuits. This could be related to the additional acrylamide loadrelated to cocoa beans roasting (Table 2). It was indeed demonstrated that acrylamide could be presentin roasted cocoa beans in the order of mg/Kg and the content may depend form the temperature usedduring roasting [36].
With regard to the sodium bicarbonate content and the correspondent pH variation, a potentialreduction in acrylamide level higher than 50% could be achieved in the finished product, remaining
33

Toxins 2019, 11, 499
within an acceptable range from the sensorial point of view. Sodium bicarbonate could indeed limit theformation of acrylamide if compared to other raising agents as ammonium hydrogen carbonate. Thiswas demonstrated during experiments conducted on biscuits, in which also the addition of tartaricand citric acids was tested in order to reduce acrylamide content. The authors showed that a reductionof about 70% of acrylamide content was achieved when sodium bicarbonate was applied [31].
Taking into account the previously mentioned mycotoxin mitigation strategy, bakingtime/temperature play an important role in order to achieve a parallel significant DON mitigation;considering experiments carried out within the most severe time/temperature baking conditions, thegreatest effect was observed with the baking step being performed at 200 ◦C for 8 min. In particular, anincrease in time during the baking phase, in an acceptable technological range, can effectively reduceDON content in the final product [3].
Notably, an acrylamide reduction ranged from 77% to 100% was achieved in the finishedproduct when baking was conducted at 180 ◦C for 5 min, though still remaining in the sensorialsatisfactory range.
Overall, data collected within this study allow to proper set the baking time and temperature forcontrolling mycotoxin and acrylamide content in the finished product, as suggested by the responseContour Plot (Figure 4). The increase of baking parameters (which also goes in the direction of theobvious industrial requirement to speed-up the process, in order to increase the productivity as muchas possible) within a range of mycotoxin mitigation (up to 20% of reduction) affects in a restrictedmanner the final acrylamide content (difference of the values of acrylamide expressed as predictedincrease, named “delta acrylamide” in the figure caption), without implications on the organolepticproperties and consumer safety.
As a major outcome of this study, this allows one to design proper synergistic mitigation strategiesfor multiple contaminants along the food production chain.
Figure 4. Contour Plot: delta-acrylamide (predicted increase) values of the cocoa biscuit-makingexperiments; Temperature vs. cooking time.
3. Materials and Methods
3.1. Chemicals
Methanol and formic acid (p.a.), both HPLC gradient grade, were obtained from BDH VWRInternational Ltd. (Poole, UK). Acetonitrile was purchased from J.T. Baker (Deventer, The Netherlands)
34

Toxins 2019, 11, 499
and ammonium acetate (MS grade) and glacial acetic acid (p.a.) were obtained from Sigma-Aldrich(Vienna, Austria). Standard acrylamide solution was purchased from Sigma-Aldrich (Milan, Italy).Acrylamide internal standard (13C3-acrylamide, 1 mg/mL in methanol) was obtained from CambridgeIsotope Laboratories, Inc. (Andover, MA, USA). Deionized water was used for all procedures. Waterwas purified successively by reverse osmosis and a Milli-Q plus system from Millipore (Molsheim,France). Deoxynivalenol standard was obtained from RomerLabs®Inc. (Tulln, Austria). OASIS® HLB3 cc (60 mg) extraction cartridges were purchased from Waters (Manchester, UK). Glass vials withseptum screw caps were purchased from Phenomenex (Torrance, CA, USA). Centrifugal filter units(Ultrafree MC 0.22 mm, diameter 10 mm) were obtained from Millipore (Billerica, MA, USA).
3.2. Biscuit-Making Production in Pilot-Plant Scale
Pilot-plant scale experiments were performed according to a previously published study [3].Briefly, three batches of wheat bran naturally infected with Fusarium spp. were analysed with afocus on DON, selected and mixed with a blank wheat flour for the wholegrain biscuit production.Concerning cocoa biscuit trials, the same three mix flours were employed and three different batchesof cocoa powder were selected.
Different doughs were prepared in order to obtain a final dough of about 1000 ± 30 g; regardingwholegrain biscuits, the ingredients were wheat flour (60%), bran (7%), cream of tartar, glucosesyrup, and salt. Eggs, margarine, and dextrose were added depending on the value reported inrecipes obtained from the experimental design (Table 3). Sodium bicarbonate was added in orderto reach the appropriate pH value. Water amount ranged from 1.6% to 5%, depending on thetechnological requirements.
Table 3. Experimental data set for screening variables effects on acrylamide levels within the wholegrainbiscuit-making process steps: full-factorial central composite design.
ExperimentNumber
DON in Bran(μg/kgd.m.) 1
Dextrose(%)
Margarine(%)
pHEggs(%)
Baking Stage
Time(min)
Temperature(◦C)
1 600 ± 16 15 10 5 4 5 1802 1500 ± 92 15 10 5 7 5 2003 600 ± 16 23 10 5 7 8 1804 1500 ± 92 23 10 5 4 8 2005 600 ± 16 15 20 5 7 8 2006 1500 ± 92 15 20 5 4 8 1807 600 ± 16 23 20 5 4 5 2008 1500 ± 92 23 20 5 7 5 1809 600 ± 16 15 10 8 4 8 200
10 1500 ± 92 15 10 8 7 8 18011 600 ± 16 23 10 8 7 5 20012 1500 ± 92 23 10 8 4 5 18013 600 ± 16 15 20 8 7 5 18014 1500 ± 92 15 20 8 4 5 20015 600 ± 16 23 20 8 4 8 18016 1500 ± 92 23 20 8 7 8 20017 1050 ± 48 19 15 6.5 6 6.5 19018 1050 ± 48 19 15 6.5 6 6.5 19019 1050 ± 48 19 15 6.5 6 6.5 190
1 Data expressed as mean value ± standard deviation.
In order to produce cocoa biscuits, 45% of wheat flour, 7% of bran, 4% of cocoa powder, margarine,glucose syrup, and salt were employed. Milk and dextrose amount were indicated in the modelgenerated by Design of Experiment (Table 4). Sodium bicarbonate was added in order to reach the
35

Toxins 2019, 11, 499
appropriate pH value. The optimal amount of water to be added to each dough sample was establishedon the basis of internal technological knowledge.
Table 4. Experimental data set for screening variables effects on acrylamide levels within the cocoabiscuit-making process steps: full-factorial central composite design.
ExperimentNumber
DON in Bran(μg/kgd.m.) 1
Dextrose(%)
Milk(%)
pHBaking Stage
Time(min)
Temperature(◦C)
1 600 ± 16 23 5 5 5 1802 600 ± 16 15 8 8 5 1803 1500 ± 92 15 5 5 8 1804 1500 ± 92 23 8 8 8 1805 600 ± 16 23 5 8 5 2006 1500 ± 92 23 8 5 5 2007 1500 ± 92 15 5 8 8 2008 600 ± 16 15 8 5 8 2009 1500 ± 92 23 5 8 5 18010 600 ± 16 23 8 5 5 18011 600 ± 16 15 5 8 8 18012 1500 ± 92 15 8 5 8 18013 600 ± 16 15 5 5 5 20014 1500 ± 92 15 8 8 5 20015 1500 ± 92 23 5 5 8 20016 600 ± 16 23 8 8 8 20017 1050 ± 48 19 6.5 6.5 6.5 19018 1050 ± 48 19 6.5 6.5 6.5 19019 1050 ± 48 19 6.5 6.5 6.5 190
1 Data expressed as mean value ± standard deviation.
The process for wholegrain and cocoa biscuit production consisted essentially of the followingsteps: creaming, dough preparation, and baking step. Firstly, wheat flour was mixed with all solidpowder ingredients using a test planetary kneader for 2 min. Dextrose and margarine were mixedseparately by using another test planetary kneader for 3 min (creaming step). At a later stage, creamand powders were mixed together for 3 min. Dough was shaped and rounded pieces of about 4 cmdiameter (approximately 10 g) were obtained from dough and rested for 10 min at room temperature.Baking step was performed in a pilot-scale dynamic oven (Tagliavini, Parma, Italy). The overallprocess is summarized in Figure 1. Nineteen different tests for each process were performed (Tables 3and 4, respectively).
Acrylamide content was examined in mix powders, before and after baking process. Before theacrylamide content analysis, samples were stored at −20 ◦C. Each sample was extracted and analyzedin duplicate.
3.3. Moisture Content Determination
The moisture contents of mix flours, doughs, and baked products were measured by taking a 5 gground sample and heating it in a thermostatic oven at 105 ◦C for 6 h. All the results were comparedon a dry matter (d.m.) basis.
3.4. Experimental Design and Statistical Evaluation
Design of Experiments (DoE) is used in many industrial issues, in the development andoptimization of manufacturing processes, making a set of experiments representative with regardsto a given question. DoE is a series of tests in which purposeful changes are made to the inputvariables of a system or process and the effects on response variables are measured: the analyst is
36

Toxins 2019, 11, 499
interested in studying the synergistic effects of some interventions (the “treatments”) to optimize thefinal process [28].
Among the wholegrain and cocoa biscuit-making parameters, several conditions were variedduring the experiments: DON contamination level on wheat bran; dextrose, margarine, egg and milkcontent (as percentage in recipes); pH value (as sodium bicarbonate content) and baking time andtemperature. Each selected treatment was varied within a range defined according to the technologicalrequirements to obtain an organoleptically appreciable product for consumers: the central experimentalvalues, indicated in Table 1, represent the optimal combination of ingredients/recipe and operativeconditions that permit to achieve the most appropriate finished product.
Experimental data were then analysed by a multi-variate analysis approach based on the partialleast-squares (PLS) technique, using a dedicated statistical package (MODDE software, version 9.1,2012; Umetrics, Umea, Sweden).
3.5. Sample Extraction and Instrumental Conditions—Deoxynivalenol
Concerning Deoxynivalenol, samples were extracted according to a previously publishedprocedure [3,25] with slight modifications. Briefly, a total of 10.00 g of flour or dough or biscuitsample were extracted with 100 mL of an acetonitrile/water (84:16, v/v) mixture by homogenization ata medium-to-high speed for 2 min using a mixer (Oster, New York, USA). The extract was allowed tosettle for 15 min. Afterwards, 5 mL were poured into a 10 mL vial, and evaporated to dryness under anitrogen stream. The extract was reconstituted with 100 mL of 13C-DON internal standard solution(100 ng/mL in methanol) and 900 mL of water. Each extraction cartridge column was activated using2 mL of methanol, and 2 mL of methanol:water (10:90, v/v). The sample extract was then slowly passedthrough the OASIS® HLB 3 cc (60 mg) (Waters, Manchester, UK) column using a vacuum chambersystem. A solution of methanol:water (20:80, v/v) was used for washing, followed by elution with1 mL of methanol. The eluate was evaporated under a gentle stream of nitrogen, and the residue wasdissolved in 200 mL of eluent A (methanol:water, 20:80 v/v, 0.5% acetic acid, and 1 mM ammoniumacetate) prior to UHPLCMS/MS analysis. Ultrahigh-performance liquid chromatography (UHPLC)was performed using a Dionex Ultimate® 3000 LC systems (Thermo Fisher Scientific Inc., Waltham,MA, USA) and a Kinetex Biphenyl column (2.6 mm; 100 × 2.10 mm; Phenomenex). The flow rate ofthe mobile phase was 400 mL/min, and the injection volume was 20 mL. The column oven was set to30 ◦C. A linear binary gradient composed of (A) water (0.5% acetic acid, 1 mM ammonium acetate)and (B) methanol (0.5% acetic acid, 1 mM ammonium acetate) was employed. The gradient was asfollows: 0–4 min to 40% B; 4–20 min to 80% B; 20–22 min, isocratic step 80% B; finally, a re-equilibrationstep at 10% B (the initial value) was performed for another 3 min, bringing the total analysis time to25 min. Before UHPLC-MS/MS analysis, all samples were filtered through centrifugal filter units forclarification. ESI-MS/MS was carried out by a Q-Exactive (Thermo Fisher Scientific Inc., Waltham,MA, USA) mass spectrometer. Experiments were performed in full MS data scan for quantificationand data-dependent scan with the following settings: the capillary temperature was set to 300 ◦C; thesheath gas and auxiliary gas flow rates were set to 40 and 10 units, respectively; the spray voltage wasset to 3500 kV; the S-lens RF level was set to 55 V. All equipment control and data processing wereperformed by Excalibur software (Thermo Fisher Scientific Inc., Waltham, MA, USA). Deoxynivalenolmeasurements in all the samples were performed using isotopically labeled standard and calibrationvs. matrix-matched standards.
3.6. Sample Extraction and Instrumental Conditions—Acrylamide
Sample extraction for acrylamide was performed according to a previously publishedprocedure [29] with slight modifications. Briefly, samples were finely ground in a blender tohomogeneity before extraction. 1 g of sample was weighed into a polypropylene graduated conicaltube and different volumes of a 300 μl ml-1 internal standard solution (13C3-labeled acrylamidein 0.1% (v/v) formic acid) followed by 10 mL 0.1% (v/v) formic acid were added on the base of the
37

Toxins 2019, 11, 499
acrylamide concentrations supposed to be present in the samples. After mixing for 10 min on avortexer the extract was centrifuged at 1,0000 rpm for 5 min. A 3-mL portion of clarified solution wasremoved avoiding to collect top oil layer when present and filtered through a 0.45 μm nylon syringefilter (Phenomenex, Torrance, CA, USA) before injection into the HPLC-MS/MS system (injectionvolume 10 μL). LC-ESI-MS/MS in positive ion mode analysis was achieved using a Surveyor LCquaternary pump separation system (Thermo Fisher Scientific Inc.) coupled to a linear ion trap LXQmass spectrometer (Thermo Fisher Scientific Inc., Waltham, MA, USA).
Chromatographic separation was performed using a Synergi Hydro-RP (150 × 2.0 mm) 4 μmanalytical column (Phenomenex, Torrance, CA, USA). Elution was carried out at a flow rate of0.2 mL/min, in isocratic conditions, at 30 ◦C using as mobile phase a mixture of 98.9% water, 1%methanol and a.1% formic acid (v/v/v). In these conditions, the retention time of acrylamide was about4 min. A time programmed valve was used to discard the eluate from the column for the first 2.5 minin order to eliminate the compounds with retention times shorter than acrylamide. At 8 min thecolumn flow was again diverted and the mobile phase changed to 100% methanol in order to cleanthe column from strongly retained compounds within a total run time of 10 min. MS/MS conditionswere set as follows: capillary temperature was set to 160 ◦C; the sheath gas was set to 35 units; thespray voltage was kept at 4500 V; capillary voltage was kept at 9 V. All parts of the equipment and dataprocessing were performed by the computer software Xcalibur (Thermo Fisher Scientific Inc.). MS/MSanalysis was carried out by selecting the ions at m/z 72 and m/z 75 as precursor ions for acrylamide and13C3-acrylamide respectively.
The area of the chromatographic peaks of the extracted ion at m/z 55, due to the transition 72 > 55,and at m/z 58, due to the transition 75 > 58 were used for the quantitative analysis. The quantitativeanalysis was carried out with the method of the internal standard. The relative response factor ofacrylamide with respect to 13C3-acrylamide was calculated daily by analysing a standard solution.
4. Conclusions and Outlook
Since precursors of acrylamide are present in the dough, modifications in recipe formulation andtime-temperature control during baking process could be actually used to reduce acrylamide contentin biscuits.
In the present study, the influence exerted by modifying ingredients and industrial conditions onacrylamide levels within a parallel mycotoxin mitigation strategy was investigated.
The obtained processing models showed a good fitting, robustness, and prediction capability,suggesting the most significant parameters. These can concretely contribute to the reduction ofacrylamide levels in the final food product.
Acrylamide formation is evidently baking time- and temperature-dependent, thereforeprolongation of heat treatments results in higher contents of acrylamide; however, when suchparameters are moved within the optimal range for DON mitigation, the actual increase affects, in alimited way, the final acrylamide content without significant implications on the organoleptic properties.
In conclusion, the present report demonstrates the effectiveness of a careful design of processparameters for the mitigation of multiple contaminants in the final product, thus remaining within theconsumer’s sensorial acceptance.
Author Contributions: Conceptualization, M.S. and C.D.; Data Elaboration and Validation, M.S., S.G., C.D.and M.C.; Pilot Plant Trials, S.G.; Formal analysis, S.G. and M.C.; Writing—original draft, S.G. and M.S.;Writing—review & editing, M.S., C.D. and M.C.
Funding: This research received no external funding.
Acknowledgments: The authors would like to thank Claudio Dall’Aglio (Barilla Pilot Plants) for his collaborationin the pilot plant trials, Nadia Morbarigazzi (Barilla Research & Development) for her suggestions and fruitfuldiscussions and Dante Catellani (Barilla Food Research Labs) for his time and availability.
Conflicts of Interest: The authors declare no conflict of interest.
38

Toxins 2019, 11, 499
References
1. Karlovsky, P.; Suman, M.; Berthiller, F.; De Meester, J.; Eisenbrand, G.; Perrin, I.; Oswald, I.P.; Speijers, G.;Chiodini, A.; Recker, T.; et al. Impact of food processing and detoxification treatments on mycotoxincontamination. Mycotoxin Res. 2016, 32, 179–205. [CrossRef] [PubMed]
2. European Food Safety Authority. Deoxynivalenol in food and feed: Occurrence and exposure. EFSA J. 2013,11, 3379–3435.
3. Generotti, S.; Cirlini, M.; Šarkanj, B.; Sulyok, M.; Berthiller, F.; Dall’Asta, C.; Suman, M. Formulation andprocessing factors affecting trichothecene mycotoxins within industrial biscuit-making. Food Chem. 2017,229, 597–603. [CrossRef] [PubMed]
4. European Food Safety Authority. Guidance on harmonised methodologies for human health, animal healthand ecological risk assessment of combined exposure to multiple chemicals. EFSA J. 2019, 17, 5634–5711.
5. Mottram, D.S.; Wedzicha, B.L.; Dodson, A.T. Acrylamide is formed in the Maillard reaction. Nature 2004, 419,448–449. [CrossRef] [PubMed]
6. Törnqvist, M. Acrylamide in food: The discovery and its implication. In M. Friedman & D. Mottram, Chemistryand Safety of Acrylamide in Food; Springer Science: New York, NY, USA; Business Media, Inc.: New York, NY,USA, 2005; pp. 1–9.
7. IARC (International Agency for Research on Cancer). IARC Monographs on the Evaluation of Carcinogenic Riskto Humans: Some Industrial Chemicals; pp. 39, 41 (1986); Suppl. 7, pp. 56 (1987); pp. 60, 389 (1994); IARC:Lyon, France, 1994; p. 60.
8. European Commission. Commission Recommendation 2013/647/EU of 8 November 2013 on investigationsinto the levels of acrylamide in food. Off. J. Eur. Union 2013, 301, 15–17.
9. Draft Commission Regulation (EU). Commission Reg. (EU) on the Application of Control & MitigationMeasures to Reduce the Presence of Acrylamide in Food Ref. Ares (2017)2895100-09/06/2017. Available online:https://ec.europa.eu/info/law/better-regulation/initiatives/ares-2017-2895100_en (accessed on 1 June 2019).
10. Claus, A.; Carle, R.; Schieber, A. Acrylamide in cereal products: A review. J. Cereal Sci. 2008, 47, 118–133.[CrossRef]
11. Konings, E.J.M.; Ashby, P.; Hamlet, C.G.; Thompson, G.A.K. Acrylamide in cereal and cereal products: Areview on progress in level reduction. Food Addit. Contam. 2007, 24, 47–59. [CrossRef]
12. Medeiros Vinci, R.; Mestdagh, F.; De Meulenaer, B. Acrylamide formation in fried potato products-presentand future, a critical review on mitigation strategies. Food Chem. 2012, 133, 1138–1154. [CrossRef]
13. Sadd, P.A.; Hamlet, C.G.; Liang, L. Effectiveness of methods for reducing acrylamide in bakery products. J.Agric. Food Chem. 2008, 50, 4998–5006. [CrossRef]
14. Stadler, R.H. The formation of acrylamide in cereal products and coffee. In Acrylamide and Other HazardousCompounds in Heat-Treated Foods; Skog, K., Alexander, J., Eds.; Woodhead Publishing: Cambridge, UK, 2006;pp. 23–40.
15. Anese, M.; Suman, M.; Nicoli, M.C. Technological strategies to reduce acrylamide levels in heated foods.Food Eng. Rev. 2009, 1, 169. [CrossRef]
16. Anese, M.; Suman, M.; Nicoli, M.C. Acrylamide removal from heated foods. Food Chem. 2010, 119, 791–794.[CrossRef]
17. Taeymans, D.; Wood, J.; Ashby, P.; Blank, I.; Studer, A.; Stadler, R.H.; Gondé, P.; Eijck, P.; Lalljie, S.; Lingnert, H.;et al. A review of acrylamide: An industry perspective on research, analysis, formation and control. Crit.Rev. Food Sci. Nutr. 2004, 44, 323–347. [CrossRef] [PubMed]
18. Biedermann, M.; Noti, A.; Biedermann-Brem, S.; Mozzetti, V.; Grob, K. Experiments on acrylamide formationand possibilities to decrease the potantial of acrylamide formation in potatoes. Mitt. Lebensm. Hyg. 2002, 93,668–687.
19. Elmore, J.S.; Koutsidis, G.; Dodson, A.T. Measurements of acrylamide and its precursors in potato, wheat,and rye model systems. J. Agric. Food Chem. 2005, 53, 1286–1293. [CrossRef] [PubMed]
20. Hedegaard, R.V.; Frandsen, H.; Granby, K.; Apostolopoulou, A.; Skibsted, L.H. Model studies on acrylamidegeneration from glucose/asparagine in aqueous glycerol. J. Agric. Food Chem. 2007, 55, 486–492. [CrossRef][PubMed]
21. Biedermann, M.; Grob, K. Model studies on acrylamide formation in potato, wheat flour and corn starch;ways to reduce acrylamide contents in bakery ware. Mitt. Lebensm. Hyg. 2003, 94, 406–422.
39

Toxins 2019, 11, 499
22. Bråthen, E.; Knutsen, S.H. Effect of temperature and time on the formation of acylamide in starch-based andcereal model systems, flat breads and bread. Food Chem. 2005, 92, 693–700. [CrossRef]
23. Surdyk, N.; Rosén, J.; Andersson, R.; Åman, P. Effects of asparagine, fructose and baking conditions onacrylamide content in yeasts-leavened wheat bread. J. Agric. Food Chem. 2004, 52, 2047–2051. [CrossRef]
24. Bergamini, E.; Catellani, D.; Dall’Asta, C.; Galaverna, G.; Dossena, A.; Marchelli, R.; Suman, M. Fate ofFusarium mycotoxins in the cereal product supply chain: The deoxynivalenol (DON) case within industrialbread-making technology. Food Addit. Contam. 2010, 27, 677–687. [CrossRef]
25. Generotti, S.; Cirlini, M.; Malachova, A.; Sulyok, M.; Berthiller, F.; Dall’Asta, C.; Suman, M. Deoxyivalenoland deoxynivalenol-3-glucoside mitigation strategies: Effective experimental design within industrialrusk-making technology. Toxins 2015, 7, 2773–2790. [CrossRef] [PubMed]
26. Suman, M.; Manzitti, A.; Catellani, D. A design of experiments approach to studying deoxynivalenol anddeoxynivalenol-3-glucoside evolution throughout industrial production of wholegrain crackers exploitingLC-MS/MS techniques. World Mycotoxin J. 2012, 5, 241–249. [CrossRef]
27. Generotti, S. Transformation of Regulated and Emerging Mycotoxins upon Food Processing: From Field toDigestion. Ph.D. Thesis, University of Parma, Parma, Italy, January 2016.
28. Telford, J.K. A brief introduction to design of experiments. John Hopkins APL Tech. Dig. 2007, 27, 224–232.29. Calbiani, F.; Careri, M.; Elviri, L.; Mangia, A.; Zagnoni, I. Development and single-laboratory validation of a
reversed-phase liquid chromatography-electrospray-tandem mass spectrometry method for the identificationand determination of acrylamide in foods. J. AOAC Int. 2004, 87, 107–115. [PubMed]
30. Gökmen, V.; Açar, O.C.; Köksel, H.; Acar, J. Effects of dough formula and baking conditions on acrylamideand hydroxymethylfurfural formation in cookies. Food Chem. 2007, 104, 1136–1142. [CrossRef]
31. Graf, M.; Amrein, T.M.; Graf, S.; Szalay, R.; Escher, F.; Amadò, R. Reducing the acrylamide content of asemi-finished biscuit on industrial scale. LWT-Food Sci. Technol. 2006, 39, 724–728. [CrossRef]
32. Vass, M.; Amrein, T.M.; Schönbächler, B.; Escher, F.; Amadò, R. Ways to reduce acrylamide formation incracker production. Czech J. Food Sci. 2004, 22, 19–21. [CrossRef]
33. Rydberg, P.; Eriksson, S.; Tareke, E.; Karlsson, P.; Ehrenberg, L.; Törnqvist, M. Investigations of factors thatinfluence the acrylamide content of heated foodstuffs. J. Agric. Food Chem. 2003, 51, 7012–7018. [CrossRef]
34. Vattem, D.A.; Shetty, K. Acrylamide in foods: A model for mechanism of formation and its reduction. Innov.Food Sci. Emerg. Technol. 2003, 4, 331–338. [CrossRef]
35. Wedzicha, B.L.; Mottram, D.S.; Elmore, J.S. Kinetic models as a route to control acrylamide formation infood. In Chemistry and Safety of Acrylamide in Food; Friedman, M., Mottram, D., Eds.; Springer: New York, NY,USA, 2015.
36. Farah, D.M.H.; Zaibunnisa, A.H.; Misnawi, J. Optimization of cocoa beans roasting process using ResponseSurface Methodology based on concentration of pyrazine and acrylamide. Int. Food Res. J. 2012, 19,1355–1359.
© 2019 by the authors. Licensee MDPI, Basel, Switzerland. This article is an open accessarticle distributed under the terms and conditions of the Creative Commons Attribution(CC BY) license (http://creativecommons.org/licenses/by/4.0/).
40

toxins
Article
Determination of Deoxynivalenol Biomarkers inItalian Urine Samples
Barbara De Santis 1,*, Francesca Debegnach 1, Brunella Miano 2, Giorgio Moretti 3, Elisa Sonego 1,
Antonio Chiaretti 4, Danilo Buonsenso 4 and Carlo Brera 1
1 Reparto di Sicurezza Chimica degli Alimenti, Istituto Superiore di Sanità, 00161 Rome, Italy2 Laboratorio di Chimica Sperimentale, Istituto Zooprofilattico Sperimentale delle Venezie,
35020 Legnaro (PD), Italy3 Istituto Zooprofilattico Sperimentale dell’Umbria e delle Marche, 06126 Perugia, Italy4 Dipartimento Scienze della Salute della Donna, del Bambino e di Sanità Pubblica, Fondazione Policlinico
Universitario Agostino Gemelli IRCCS, Roma-Italia-Università Cattolica del Sacro Cuore, 00168 Roma, Italia* Correspondence: [email protected]; Tel.: +39-06-499-02367
Received: 31 May 2019; Accepted: 18 July 2019; Published: 25 July 2019
Abstract: Deoxynivalenol (DON) is a mycotoxin mainly produced by Fusarium graminearum that cancontaminate cereals and cereal-based foodstuff. Urinary DON levels can be used as biomarker forexposure assessment purposes. This study assessed urinary DON concentrations in Italian volunteersrecruited by age group, namely children, adolescents, adults, and the elderly. In addition, vulnerablegroups, namely vegetarians and pregnant women, were included in the study. To determine theurinary DON, its glucuronide and de-epoxydated (DOM-1) forms, an indirect analytical approach wasused, measuring free DON and total DON (as sum of free and glucuronides forms), before and afterenzymatic treatment, respectively. Morning urine samples were collected on two consecutive days,from six different population groups, namely children, adolescent, adults, elderly, vegetarians andpregnant women. Total DON was measured in the 76% of the collected samples with the maximumincidences in children and adolescent age group. Urine samples from children and adolescent alsoshowed the highest total DON levels, up to 17.0 ng/mgcreat. Pregnant women had the lowest positivesamples per category (40% for day 1 and 43% for day 2, respectively), low mean levels of total DON(down to 2.84 ng/mgcreat) and median equal to 0 ng/mgcreat. Estimation of DON dietary intake revealsthat 7.5% of the total population exceeds the TDI of 1 μg/kg bw/day set for DON, with childrenshowing 40% of individuals surpassing this value (male, day 2).
Keywords: mycotoxins; deoxynivalenol; children; adolescents; pregnant women; vegetarians;biomonitoring
Key Contribution: This study showed that total DON was measured in 76% of the collected samples,with the maximum incidences in children and adolescent age groups. The outputs of the statisticalmodel associating food variables and urinary DON showed that an increase of total cereal consumptionsignificantly associated with total DON in urine. In particular, the increase of pasta consumptionaffects the urinary DON content, confirming the relevant role of pasta in the Italian diet.
1. Introduction
Mycotoxins are natural food and feed contaminants, mainly produced by filamentous fungiof genera Aspergillus, Penicillium, Fusarium and Alternaria [1]. Mycotoxin production is promotedby either environmental and agronomic factors, while strong weather variability is a key factor forfungal infection, fungal colonization, and mycotoxin loads [2,3]. Among mycotoxins, trichothecenesrepresent the main group of Fusarium toxins commonly found in cereal grains. Deoxynivalenol
Toxins 2019, 11, 441; doi:10.3390/toxins11080441 www.mdpi.com/journal/toxins41

Toxins 2019, 11, 441
(DON) is one of the most widely diffused natural-occurring trichothecene, is a sesquiterpenoid polarorganic compound, belonging to the type B trichothecenes since it contains carbonyl group in C-8.Fusarium graminearum and culmorum, two important causing agents of the Fusarium Head Blight(FHB), are the most important producers of DON [4]. Acting as a virulence factor for cereal infection(namely in wheat, maize, barley, oat and rye), DON jeopardizes cereal grain quantity and quality fromagriculture and health perspective [3] being persistent in cereal food derived products.
European Regulation (EC) 1881/2006 [5] has set maximum levels of DON in unprocessed cerealsand cereal foods products intended for direct human consumption in the range of 1750 to 200 μg/kg.The scaled down levels of the contamination from the milling products and the processed ones reflecta well-known reduction rate of about 30% because of the cleaning and processing [6,7] but it has alsoto be considered the DON degradation process that occurs during industrial baking [8]. The legislativeprovisions serve to control the levels in food. However, surveys carried out worldwide [2] and in Italy [9]confirmed DON occurrence in cereal samples like wheat and maize, including processed products,thereby suggesting an exposure assessment issue. The correlation between DON dietary exposure andDON presence in urine has already been reported and confirmed [10,11]; therefore, the biomonitoring ofDON and DON metabolites in urine may constitute a valuable indicator of the dietary exposure. On thebasis of the available information derived from the toxicity studies, a temporary tolerable daily intake(TDI) of 1 μg/kg body weight (bw)/day was established in 2002 [12]. On the basis of the more recentavailable scientific data, this TDI has been recently confirmed by the European Food Safety Authority(EFSA) as a group-TDI for the inclusion of 3-AcDON, 15-AcDON and DON-3-glucoside, as DON plantmetabolites [4]. In regards to acute risk, the Joint Expert Committee on Food and Additives (JECFA) [13]concluded that DON is a probable factor for acute pathologies in humans and derived an AcuteReference Dose (ARfD) of 8 μg/kg bw. In 2017, an extensive review on the presence of DON and itsmetabolites in human urine was carried out [14]. Authors showed that it is ubiquitous and highlightedgeographical differences. So far, the metabolic profile of DON in animals has already been established.DON is metabolized to 13-deepoxy (DOM-1) in animals and is excreted via the feces and urine [15,16].In addition to DOM-1, other conjugated products may be present as excreted metabolites, namelyDON-3-glucuronide (DON-3GlcA) and DON-15-glucuronide (DON-15GlcA), which seem to be themajor metabolites in humans, along with their iso forms and DON-8,15-hemiketal-8-GlcAc [17], sulfateand sulfonate forms [18,19]. More recently, DON-7-glucuronide (DON-7GlcA) has been tentativelyidentified and introduced as a new metabolite [20–22] in humans.
The analysis of urinary glucuronides is crucial for the study of trichothecene biomarkers, becauseapproximately 80% of DON excreted via urine is conjugated with glucuronic acid [4]. A number ofbiomonitoring studies of DON in urine is available, however, different analytical method approaches,different limits of quantification and different ways to express measured mycotoxin (total DONor free DON, not specified, creatinine corrected, etc.) may give difficulties in comparison results.When expressed in ng/mg of creatinine (ng/mgcreat), DON levels in urine ranged from 0.2 up to903.7 ng/mgcreat [23–28], with a worst case reported for a group of pregnant women from Croatia [21].
In the present study, morning urine samples were collected over two consecutive days from203 Italian volunteers; the participants were recruited by age group, namely children (3–9 years),adolescents (10–17 years), adults (18–64 years), and elderly (65 years or above). Vulnerable groups,namely vegetarians and pregnant women, were also included in the study. Each participant was askedto collect a first-morning urine sample on two consecutive days and to complete a Food FrequencyQuestionnaire (FFQ) reporting dietary habits over a 1-month period and a Food Diary (FD) withdetailed information about food items consumed on the day preceding the collection of urine samples.Associations between food consumption and urinary DON were assessed using ordered logisticregression models.
To determine the urinary total DON expressed as sum of free and glucuronides forms, an indirectanalytical approach, measuring free and total DON, before and after enzymatic treatment, respectively,was fully validated and applied to the collected urine samples [29,30].
42

Toxins 2019, 11, 441
This paper affords a distinctive data set detailing the DON exposure of Italian population in anurban setting, providing data on levels of DON in human urine samples collected, as analyzed byliquid chromatography coupled with mass spectrometry (LC-MS).
2. Results and Discussion
2.1. Analytical Method
The method used in this experimental study was previously published by Turner et al. [10] andapplied with minor modifications. In particular, in order to reduce the amount of methanol needed forthe elution of mycotoxins from the immunoaffinity column (IAC), three volumes were tested, 4 mLas recommended in the work of Turner et al., 2 mL and 1.5 mL. The performances were evaluated interms of the recovery factor (n = 3), the obtained results were 102 ± 5%, 99 ± 5% and 56 ± 10%, for 4,2 and 1.5 mL, respectively. The selected volume was 2 mL, for which a good recovery was achievedalso permitting the reduction of the amount of organic solvent used and of the time needed for dryingthe sample in the subsequent analytical step. Since the IAC was designed for DON analysis, the IACcross reactivity for DOM-1 was also tested (n = 3) with good results in terms of recovery (98 ± 1%).In regards to the determination step, a single injection for DON and DOM-1 was performed instead ofthe separated chromatographic run proposed in the reference paper [10].
2.2. In-House Validation
Before applying the method to the collected samples, an in-house validation was performed on4 different contamination levels; the results obtained for the investigated performance parametersare reported in Table 1. The limits of detection and quantification (LoD and LoQ) values set duringvalidation fit with the purpose of having an analytical method that is able to detect low amounts ofDON and DOM-1 for exposure assessment purposes. Recovery factors are in the ranges 95–109%and 81–93% for DON and DOM-1, respectively, and the precision, evaluated in terms of RelativeStandard Deviation of repeatability (RSDr), is always below 10%. Despite the absence of a specificofficial reference, the obtained values were considered satisfactory under the criteria of Regulation (EC)401/2006 [31], which apply to any DON analysis on food. The average values estimated for methoduncertainty ranged between 8 and 14% for DON and between 15 and 18% for DOM-1, being in bothcases well below the 44%, which is the maximum acceptable value when the Horwitz approach isapplied [31].
43

Toxins 2019, 11, 441
Table 1. Performance characteristics obtained during the in-house validation of the method.
Validation Parameter DON DOM-1
LoD; μg/L 0.25 0.25
Level 1 (LoQ); μg/Lurine 0.50 0.51
Mean value; μg/Lurine 0.54 0.43sr; μg/Lurine 0.03 0.03
RSDr; % 5.55 6.98Recovery; % 109 84
Uncertainty; % 14 15
Level 2; μg/Lurine 2.50 2.53
Mean value; μg/Lurine 2.63 2.11sr; μg/Lurine 0.10 0.14
RSDr; % 3.80 6.63Recovery; % 105 85
Uncertainty; % 8 18
Level 3; μg/Lurine 12.50 12.63
Mean value; μg/Lurine 12.16 11.65sr; μg/Lurine 0.33 0.37
RSDr; % 2.71 3.18Recovery; % 95 93
Uncertainty; % 8 17
Level 4; μg/Lurine 62.50 50.50
Mean value; μg/Lurine 63.35 40.49sr; μg/Lurine 3.86 0.48
RSDr; % 6.09 1.19Recovery; % 101 81
Uncertainty; % 9 14
2.3. Description of Study Population
In total, 406 first morning urine samples were collected from 203 volunteers belonging to sixpopulation groups, namely children, adolescents, adults, elderly, vegetarians and pregnant women.All samples were kept at −20 ◦C until analysis. The volunteers enrolled for the study are reported,with their anthropometric data, grouped by category, gender and age in Table 2.
The recruitment of subjects was subdivided between Istituto Superiore di Sanità (ISS) and thehospital “Agostino Gemelli (UCSC)”, with ISS responsible of the recruitment of adults, elderly andvegetarians and UCSC of children and adolescents by the clinics of Pediatric Unit and pregnant womenfrom the clinics of Gynecology and Obstetrics outpatients. The selection of different groups of thepopulation was specifically requested by EFSA while being considered as an asset for the study due tohaving different potential metabolic susceptibility, body weights, dietary habits, and consumptionrates. Pediatric biological systems and detoxification processes might be widely different, causingan amplification of children’s susceptibility to hazards that would have negative consequences [32].It should be noted that the cereal-based products consumption intakes figures of children in Italyare comparable with those of adults, showing, in addition, that children are consumers of a highervariety of those food products than adults (data from the FFQ and food diary, not shown). These twoaspects provide children with, at least, the same exposure risk to that of adults. As for pregnantwomen, due to a decreased immunocompetence as a consequence of hormone levels changes andtheir complex and multifactorial interplay [33], this population group is of special interest for itspossible susceptibility to DON, which has a recognized impact on the immune response system. As forvegetarians, they were included to attempt to verify and to measure if a special diet, which couldbe enriched by cereal based products, is a factor that may affect exposure estimates. However, theliterature shows that these subgroups were already enrolled as special populations in other DON
44

Toxins 2019, 11, 441
biomonitoring surveys. Piekkola et al., and Hepworth et al., [26,34] indicated the potential risk tomothers and their babies from DON exposure during pregnancy. Pestka highlighted the need to studythe relationship between DON consumption and possible growth effects in susceptible populationssuch as children and vegetarians [35].
During the recruitment, UCSC initially encountered difficulties for pregnant women relating to ageneral concern from potential participants regarding the possible outputs of the study, abandonmentof the study after initial recruitment, and incorrect collection of urine samples and compilation ofquestionnaires from participants. Therefore, ISS supported the UCSC hospital in its interactions withunder-recruited subgroups (pregnant women and vegetarians). In regards to vegetarians, it wasquite difficult to recruit male volunteers to the study since they constitute a low percentage of thevegetarian population.
The evaluation of the ethic aspects related to the study protocol and its approval by an EthicsCommittee was requested and obtained before the starting date of the study. The UCSC ethicalapproval was granted by the Local Ethics Committee on 23 March 2014 (for the Gynecology Unit) and7 April 2014 (for the Pediatric Unit). ISS ethical approval was granted by the ISS Ethic Committee on18 February 2014. Informed consent was provided by the participants during their first visit. Approvalcode: Prot. PRE 84/14 and Prot. CE 14/413.
Table 2. Anthropometric data and number of individuals recruited in Italy grouped by category, genderand age.
Group Category Gender a N b Weight, kg Height, cm BMI c, kg/m2
Children (3–9 years) F 20 27 124 17.3M 20 26 119 17.2
Adolescent (10–17 years) F 20 52 163 19.4M 20 63 173 20.7
Adults (18–64 years) F 15 63 167 22.4M 16 77 179 24.0
Elderly (>65 years) F 10 63 161 24.4M 9 70 170 24.3
Vegetarians F 15 61 166 21.9M 16 75 176 24.9
Pregnant women F 42 66 164 24.6a F, Female; M: Male; b N: number of subjects; c BMI, Body Mass Index.
2.4. DON Biomarker Levels in Urine Samples
For each collected urine sample three analyses were performed, one for free and one for totalDON and DOM-1, the first and second corresponding to before and after enzymatic treatment, withthe third for creatinine. The results obtained are reported in Table 3, namely mean values, median (P50)and interquartile (IQR) values are listed as non-adjusted and creatinine-adjusted total DON. In Table 3the percentage of samples above LOD for total DON is also reported for each category. Moreover, inTable 3 the percentage contribution of free DON and DON-GlcA to total DON is reported.
The mean DON level in urine for the total population studied was 7.67 and 7.93 ng/mL, butdifferences arose when the different categories were separately taken into account. Among the selectedgroup, pregnant women had the lowest positive samples per category (40% for day 1 and 43% forday 2, respectively), low mean levels of total DON (4.37 ng/mL and 2.70 ng/mL on day 1 and day 2,respectively), and a median equal to 0 ng/mL. Conversely, urine from children and adolescents showedthe highest concentrations of total DON, up to 75.9 ng/mL. The vegetarian group, apart from femaleson day 1, showed median values very close to the mean values, indicating that the values are close tonormal distribution.
The median values of total DON in the morning urine ranged from 0 ng/mL for pregnant womenon day 1 and day 2 to 12.60 ng/mL for adults male on day 2. However, when the creatinine adjustment
45

Toxins 2019, 11, 441
was taken into account the median values ranged from 0 ng/mgcreat for pregnant women (day 1 andday 2) to 13.0 ng/mgcreat for children male (day 2), while the median value for adults male on day 2decremented to 6.84 ng/mgcreat. These results emphasize the importance of creatinine adjustment forthe correct interpretation of results.
Regarding the DOM-1 content, only 6 samples out of the 406 analyzed urines (1.5%) had detectablelevels of this toxin (ranges <LOD-2.6 ng DOM-1/mgcreat and <LOD-1.7 ng DOM-1/mgcreat, for day 1and day 2, respectively), confirming that this is a minor route for DON in human metabolism.
In view of the ambiguous statistical differences among males and females’ DON levels found inliterature [11,30,36–38], DON ng/mgcreat content was checked between sexes in the general populationexcluding pregnant women. No statistical differences were highlighted for any of the age group(Mann-Whitney test). Conversely, a difference statistically significant was obtained comparing womenadult group with pregnant women pointing out that pregnant women showed DON ng/mgcreat levelslower than adult females in general (p-value 0.025).
Comparing the results obtained within the EFSA study [39], the median concentrations of totalDON adjusted for creatinine in morning urine in Italy and Norway were quite similar within similarpopulation groups, whereas the median concentrations in the corresponding population groups in theUK were approximately 3-fold higher than in Italy and Norway. The Italian results are also in line withthe values published by Solfrizzo et al. [30], which reported for total DON a median of 10.32 ng/mL.
Regarding the contribution of free DON and DON-GlcA to total DON, throughout all thepopulation groups, the DON-GlcA represented 66% and 71% of the total DON for day 1 and day 2respectively, confirming that the glucuronidation is an important route for DON excretion, as hasalready been reported in other studies [40].
46

Toxins 2019, 11, 441
Ta
ble
3.
Non
-adj
uste
dan
dcr
eati
nine
-adj
uste
dto
talD
ON
conc
entr
atio
nsin
urin
esa
mpl
esby
day
and
sex
insa
mpl
edpo
pula
tion
grou
ps,a
ndco
ntri
buti
onof
free
DO
Nan
dD
ON
-Glc
Ato
the
mea
nto
talD
ON
conc
entr
atio
n.
Ag
eG
rou
pD
ay
Ge
nd
er
aS
am
ple
sA
bo
ve
Lo
Q(%
)
To
tal
DO
N(n
g/m
Lu
rin
e)
To
tal
DO
N(n
g/m
gcr
ea
t)
Me
an
P5
0IQ
RF
ree
DO
N(%
)D
ON
-Glc
A(%
)M
ea
nP
50
IQR
Ch
ild
ren
(3–
9Y
ea
rs)
1F
(20)
9011
.45.
806.
9124
7613
.57.
3111
.20
M(2
0)95
10.3
9.46
13.1
127
7312
.49.
778.
16
2F
(20)
908.
706.
498.
6929
7112
.99.
4211
.65
M(2
0)95
14.0
11.9
12.6
036
6417
.013
.012
.05
Ad
ole
sce
nts
(10
–1
7Y
ea
rs)
1F
(20)
809.
835.
3611
.89
2476
9.38
6.20
11.3
7M
(20)
100
12.9
11.4
12.7
134
6615
.69.
3017
.54
2F
(20)
859.
195.
127.
4015
8512
.68.
069.
74M
(20)
9012
.311
.012
.17
3070
11.3
9.96
11.8
9
Ad
ult
s(1
8–
64
Ye
ars
)
1F
(15)
805.
344.
187.
4244
565.
333.
416.
83M
(16)
885.
355.
087.
1258
424.
303.
764.
20
2F
(15)
809.
015.
447.
6523
778.
355.
545.
87M
(16)
8111
.812
.613
.94
4555
7.60
6.84
11.8
1
Eld
erl
y(>
65
Ye
ars
)
1F
(10)
705.
073.
186.
0141
596.
695.
136.
10M
(10)
904.
934.
404.
1041
596.
376.
878.
79
2F
(10)
605.
514.
403.
2535
657.
795.
163.
84M
(10)
806.
165.
593.
4020
8012
.48.
093.
84
Ve
ge
tari
an
s1
F(1
5)80
10.6
9.74
14.7
419
8116
.110
.130
.75
M(1
5)73
4.10
3.30
5.22
3565
4.43
3.23
7.85
2F
(15)
805.
534.
175.
3423
778.
478.
2512
.73
M(1
5)73
5.88
3.03
7.79
3070
4.28
2.25
7.44
Pre
gn
an
tW
om
en
1F
(42)
404.
370.
008.
2028
726.
300.
006.
872
F(4
2)43
2.70
0.00
3.10
3367
2.84
0.00
4.91
To
tal
1(2
03)
767.
674.
588.
6334
669.
215.
059.
812
(203
)75
7.93
5.29
9.26
2971
9.03
6.07
10.4
1a
F:Fe
mal
e;M
:Mal
e;in
pare
nthe
sis,
num
ber
ofsu
bjec
ts.
47

Toxins 2019, 11, 441
2.5. Regression Analysis Between Food Consumption and DON Level in Urine Samples
The logistic regression model was applied to the dataset to assess the effect of the general variableson total DON concentration adjusted for creatinine. The output of the model refers to a unitaryvariation of the considered variable. With the aim to express the output of the food variable in a morecomprehensive way, an increment of 10 grams of cereal food intake (i.e. total food, food category oritem) was considered.
To assess the effect of the general variables, the mean values for the total DON content (ng/mgcreat)on day 1 and day 2 were calculated for each subject and then categorized in tertiles, resulting in onlyone dependent variable. In regards to the age groups, the odds ratio (OR) to have a higher level ofmean DON adjusted for creatinine in adults compared to children is 0.13 (p = 0.000), confirming thecritical scenario for the children age group. The OR to have a higher level of mean concentration oftotal DON adjusted for creatinine in pregnant women compared to non-pregnant women is 0.198(p = 0.001), in accordance with the very low DON levels in urine for this category. The gender, BMI,physical activity and vegetarian variables were not significant when added into the model.
Regarding the food variables, the analyses were performed by assessing the effect on total DONadjusted for creatinine on day 1 and day 2 of (i) total cereal food intake; (ii) each food group intake;(iii) single food items. While no statistically significant association between total food intake and DONlevels was observed for day 1, the increase of 10 g in the total cereal food intake raised the OR by about2.6% for day 2 (p = 0.027). The effects of the food groups provided significant results for pasta andpasta-like products, while for day 1 and day 2, an increased intake of 10 g caused the OR to have ahigher level of concentration of total DON adjusted for creatinine by about 4% (p = 0.047) and 5.5%(p = 0.052), respectively. Considering the food item variables, the increased intake of durum wheatpasta caused the OR to have a higher level of total DON adjusted for creatinine by about 6% (p = 0.023)and 7.9% (p = 0.008), respectively.
2.6. Estimated DON Daily Intake
Starting from the total DON concentration levels measured in the collected urine samples, theEstimated Dietary Intake (EDI) was calculated using the following formula [30]
EDIDON = C× Vbw× 100
E(1)
EDI (ng/kg bw/day);C = total DON concentration in the analyzed urine samples (ng/mLurine);V =mean 24 h human urine volume (1.0 mL per kg of bw per hour for adults [41]; 2.0 mL per kgof bw per hour for children [42]);bw = body weight reported in the questionnaire;E = urinary excretion rate of DON in 24 h, 72.3% [10]
The calculated individual exposure followed a non-normal distribution (Shapiro-Wilk test) hencea non-parametric approach has been used. In Table 4, the mean, median (P50), and 95th percentile(P95) are reported. The obtained EDI values were compared with the Tolerable Daily Intake (TDI) setby EFSA for DON at 1000 ng/kg bw [4], in the last column of Table 4, the number of individuals andthe percentage exceeding the TDI are reported.
48

Toxins 2019, 11, 441
Table 4. Mean, median (P50) and 95th percentile (P95) of EDI (ng/kg bw/day) calculated for DON arereported based on the category, gender and age group, together with the number and percentage ofindividuals exceeding the TDI.
Age Group Day Gender Mean P50 IQR P95 >TDI
Children (3–9 Years)1
F (20) 757 385 459 3265 4 (20%)M (20) 683 628 870 1975 6 (30%)
2F (20) 577 431 577 1765 3 (15%)M (20) 937 791 837 2457 8 (40%)
Adolescents (10–17 Years)1
F (20) 328 178 393 1261 2 (10%)M (20) 427 379 421 1359 1 (5%)
2F (20) 296 170 246 1019 1 (5%)M (20) 409 367 403 1030 1 (5%)
Adults (18–64 Years)1
F (15) 177 139 247 513 0M (16) 170 168 237 446 0
2F (15) 299 181 254 1172 1 (7%)M (16) 411 416 463 1685 1 (7%)
Elderly (>65 Years)1
F (10) 104 124 132 284 0M (10) 137 141 136 299 0
2F (10) 169 146 212 515 0M (10) 181 189 129 515 0
Vegetarians1
F (15) 360 323 472 1555 1 (7%)M (15) 186 112 194 561 0
2F (15) 181 138 174 549 0M (15) 235 119 259 815 0
Pregnant Women1 F (42) 154 0 271 630 02 F (42) 96 0 103 519 0
Total1 (203) 329 170 286 1144 14 (7%)2 (203) 343 181 310 1128 15 (8%)
The EDI mean values for the total population of the study are quite low, representing aroundthe 30% of the TDI reported by EFSA, and the percentage went down to 20% when the medianwas considered. The scenario was more differentiated when the single categories were considered.The highest EDI values were obtained for children and to a minor extent for the adolescent agegroup, with mean values ranging from 577 to 937, and from 296 to 427 ng/kg bw/day for childrenand adolescent, respectively. Also, the number of individuals exceeding the TDI was higher for thisage group, with the highest percentage being the 40% of the male children category on day 2. It isimportant to note that the two highest estimated EDI’s were obtained from female children on day 1(5036 ng/kg bw/day) and male children on day 2 (3193 ng/kg bw/day), both values were below theARfD (8000 ng/kg bw/day). As far as chronic exposure is concerned, all the values over the TDI shouldbe duly considered as possible concern for public health as reported by EFSA, especially for vulnerablegroups such as infants, toddlers and other children [4].
For a better visualization of the distribution of the obtained results, the calculated individualEDIs are reported in Figure 1. The depicted scenario for children and adolescent must be consideredwhile taking into consideration body weights, homeostasis water balance (i.e., average food andbeverage water input, urine feces, skin water output) and food consumption rates, especially for thechildren, that are not dissimilar when compared to the ones of the rest of the population, producing anunfavorable body weight/intake ratio.
The concentration values obtained in this study were also used by EFSA for exposure estimations.When comparing EFSA exposure estimates from biomarkers for adolescents, adult, elderly withcorresponding mean averaged values obtained in this study (data not shown), exposure scenariosare confirmed. Discrepancies arise for children, and in particular, EFSA [4] obtained lower exposureestimates from biomarkers. These differences are due to different urine volumes considered for the
49

Toxins 2019, 11, 441
24 h, since EFSA used 0.5 L of urine for children during the 24 h, while in this study, calculationswere made depending on the body weight of the subject [42], leading to a urine volume in the 24 hthat ranged from 0.71 L/day to 2.49 L/day (an average of 1.25 L/day). The estimation made for thetotal Italian population in this paper, 329 and 343 ng/kg bw/day for day 1 and day 2 respectively, isalso comparable with the probable daily intake (PDI) of 590 ng/kg bw/day reported by Solfrizzo [30],which was calculated considering a 50% excretion rate and 1.5 L for total urine in the 24 h for all of therecruited population.
Figure 1. Distribution of the calculated individual EDI around the median value (red small line) andcompared to the DON TDI (red line).
3. Conclusions
The high incidence of DON in urine confirms its ubiquitous presence in cereal food products inItaly. However, the results of this study showed moderate mean levels of DON in urine samples ofthe studied cohort, despite differences that emerged when the different categories were considered,with children being the most susceptible group. The critical scenario depicted for children was alsoconfirmed when the estimated daily intake was considered, showing the highest mean values forthis age group (close to TDI and over in the case of P95), and the highest percentage of individualsexceeding the TDI, while for the total population the mean EDI represented around the 30% of the TDI.The higher exposure estimated for children and, to a minor extent for adolescents, can be explained bytaking their unfavorable body weight/intake ratios into consideration.
In this study, the contribution of free DON and DON-GlcA to total urinary DON was alsoinvestigated and the results confirmed that DON-GlcA is the major DON metabolites for humans, onthe other hand the very limited number of samples with DOM-1 above LOD confirms that this is aminor route for DON in the human metabolism.
Statistical analysis confirmed that age significantly affected urinary DON concentration (thedifference between children and adults). Considering the outputs of the statistical model for foodvariables, increasing total cereal consumption was significantly associated with total DON in urineand in particular the increase of pasta consumption affected the urinary DON content more than theincreased intake of other studied food items, confirming the relevant role of pasta in the Italian diet.
The results obtained in this study underpin the need for other studies in order to collect data forproviding a more comprehensive exposure assessment of the Italian population. Moreover, support forthe biomarker approach in exposure assessment is represented by the availability of either validatedanalytical methods and harmonized references for those critical figures (such as urine outputs orexcretion rates), which sensibly influence the exposure scenarios.
50

Toxins 2019, 11, 441
4. Materials and Methods
4.1. Analytical Method
4.1.1. Chemicals and Reagents
Methanol HPLC grade (Carlo Erba Reagenti, Cornaredo, MI, Italy) and ultrapure water (Millipore,Burlington, MA, USA) were used for the LC-MS analysis.
In order to perform the planned validation study and the analytical work on collected urinesamples, the standard of DON (product number: D0156, 1mg), U-[13C15]-DON (99.0% 13C) and DOM-1(product number: 34135, 2 mL) were purchased from Sigma (Saint Louis, MI, USA). The enzymeβ-glucuronidase (Type IX-A from E. coli; product number: G7396—2MU) was purchased from Sigmatoo. The IAC DONtest WBTM (product number: G1066) were purchased from Vicam (Milford,MA, USA).
4.1.2. Sample Preparation
Urinary DON and metabolites concentrations were measured using a two-step process. Storedurine samples were allowed to thaw, and were then centrifuged (1790 g, +4 ◦C, 15 min). For eachparticipant, two aliquots (1 mL) were prepared by mixing 13C-DON internal standard solution, toprovide a final concentration of 20 ng/mL.
Aliquot 1 was used to determine total DON concentrations, defined as the sum of glucuronidemetabolites and free DON. To measure DON-glucuronides and free DON, each sample was adjustedto pH 6.8 with drop wise addition of KOH or HCl and digested using β-glucuronidase solution(23,000 U/mL, 250 μL) in a shaking water bath at 37 ◦C for 18 h, ensuring a gentle mixing. After thispre-treatment, the samples were diluted to a final 4 mL with phosphate buffered saline (PBS, pH 7.4).The diluted urine sample was passed through a wide bore DON IAC using a VisiprepTM vacuummanifold (Sigma-Aldrich, Saint Louis, MI, USA). DON was eluted from columns with methanol(2 mL) and extracts were dried at 40 ◦C under a gentle stream of nitrogen and reconstituted in 90%methanol (250 μL) before LC-MS analysis. DOM-1 was quantified on the same aliquot and analyzed forDON-GlcA. Aliquot 2 was used to assess free DON using the aforementioned procedure, but withoutany β-glucuronidase treatment.
Urine creatinine was assessed by the enzymatic method described by Mazzachi et al. [43].
4.1.3. LC-MS Determination
Chromatographic separation of DON and DOM-1 was performed using UHPLC (Ultra-High-Performance Liquid Chromatography) with Waters RP Acquity BEH C18 column (100 × 2.1 mm,1.7 μm, Milford, MA, USA) kept at 30 ◦C, and a mobile phase sequence of 10 minutes duration, startingwith 20% MeOH, changing to wash of 75% MeOH after 4.50 min and reverting to 20% MeOH after8 min (flow rate 0.350 mL/min with a volume injection of 10 μL). DON elutes at 2.5 minutes underthese conditions, while DOM-1 elutes at 4.5 min.
The mass spectrometric analysis was carried out with a Quattro Premier XE (Waters Milford,MA, USA) in SIR (Selective Ion Recording) acquisition mode with an ESI (ElectroSpray Ionization)interface. The analysis was performed in positive ion-mode. The following mass spectrometerconditions were optimized by direct infusion of DON and DOM-1 standard solutions: capillaryvoltage 4.0 kV, desolvation gas flow rate 500 L/h at 350 ◦C, source temperature 110 ◦C, cone voltage40 V. The monitored masses for DON were 319.2 and 334.2 m/z corresponding to [DON-Na]+ and[13C-DON-Na]+ respectively, and 303.2 m/z for [DOM-1-Na]+.
For quantification purposes, calibration curves with a labeled internal standard for DON, andan external standard approach for DOM-1 were used. The curves covered the range 2–250 ng/mL,corresponding to 0.50–62.5 μg/Lurine for DON, and 2–200 ng/mL corresponding to 0.50–50 μg/Lurine forDOM-1. An acceptability criterion of R2 > 0.995 was applied during routine analysis.
51

Toxins 2019, 11, 441
DON-GlcA values were estimated indirectly by subtracting free DON values from total DONvalues for each analyzed urine sample.
4.2. In-House Validation
The in-house validation was performed in accordance with the Eurachem guideline [44]. Selectivityand specificity were guaranteed by the clean-up step with the IAC containing specific antibodies forthe selected mycotoxins. LoD and LoQ were identified by the injection of diluted standard solutions,the requirements were a S/N = 3 for LOD and a S/N = 10 for LoQ. The LoQ was included in thevalidated contamination levels. The validation was performed on 4 different contamination levelsfor DON and DOM-1 by repeated analyses on spiked urine samples. Trueness was evaluated interms of recovery factors, while precision was estimated in terms of Relative Standard Deviationof repeatability (RSDr) calculated on repeated analyses for each contamination level. Expandeduncertainty was also estimated by a metrological approach in accordance with Eurachem guideline [45].The combined standard uncertainty was calculated by a metrological approach by summing up thestandard uncertainty contributions from repeatability (Type A), recovery (Type A), pipetting volumes(Type B), and calibration (Type A). By applying a coverage factor of 2, the expanded uncertaintyaccounted for the 95% confidence interval.
4.3. Study Design
The dataset in the present analysis represents a subset of data collected for a larger study entitled“Experimental study of deoxynivalenol biomarkers in urine” conducted for the European Food SafetyAuthority (EFSA) GP/EFSA/CONTAM/2013/04 [39]. In brief, this study explored the occurrence ofDON and its metabolites in urine from different population groups (children, adolescents, adults,elderly, and pregnant women; total n = 635) in three European countries (UK, Italy, and Norway) andthe relationships between urinary DON levels and its metabolites and self-reported dietary intake ofcereal-based food items.
Recruitment of Participants and Urine Sample Collection
A target sample size of at least 200 individuals was established. The population groups includedin the study were divided according to the age groups used within the EFSA ComprehensiveEuropean Food Consumption Database [46]. A relatively higher number of potentially more susceptiblepopulation groups such as children, adolescents, vegetarian and pregnant women was planned tobe included. The planned sampled population included six different subgroups for recruitment, i.e.,children (aged 3–9, 20%), adolescents (aged 10–17, 20%), adults (aged 18–64, 10%), elderly (aged above65, 15%), vegetarians (15%) and pregnant women (20%).
Exclusion criteria included subjects not being able to give informed consent or complete thequestionnaire, individuals affected by acute pathologies and any chronic illness (chronic renal, hepaticor cardiac problems, cancer), with chronic gastrointestinal conditions (e.g., celiac disease), glutensensitivity or eating disorders, such as food allergies and those subjects recently on a weight loss diet,depression and psychosis, or hospitalized subjects within 3 months of admission. Inclusion criteria atthe specialized recruitment centers (hospitals, clinics, institutions) required only healthy people, eithernot being on any medication or stable medication (for more than three months) that did not affectappetite (such as oral steroid use). As far as vegetarians, only people following the diet for >1 year andabove the age of 18 years were recruited.
Collection equipment and instructions on how to collect and store a first morning urine samplewere provided to participants. On two separate days, prior to urine sample collection, participants wererequired to complete a food diary, reporting food items consumed throughout those days. Participantsprovided a first morning urine sample the following morning. The urine samples (kept frozen at home)were returned to the clinical trial units after the second day of collection.
52

Toxins 2019, 11, 441
4.4. Regression Analysis Between Food Consumption and DON Levels in Urine Samples
4.4.1. Food Frequency Questionnaire and Food Diary
Since a rich cereal-based diet plays a key role in the DON exposure, a semi-quantitative FoodFrequency Questionnaire (FFQ) was designed. Type, frequency and quantity of the food consumedwere obtained by this FFQ which has been prepared based on a validated questionnaire used in aSpanish study targeted to pregnant women [47]. The adopted FFQ included information about portionsize and usual food frequency intake, with a recall period up to one month. In order to make thecompilation of the questionnaire easier, photographic examples of portion sizes were also provided toparticipants. The food list in the adopted FFQ included specific food categories containing all foodsources susceptible to DON contamination such as wheat, maize and barley products with emphasison breads (whole meal, white, soft grain, other), breakfast cereals (high-fiber and other), pasta, pizza,fruit pies, biscuits, buns/cakes and beer. The reported food items reflected the specific Italian foodhabits. Therefore, in order to get information on the dietary habits of each population group, the FFQwas designed for gathering information on the amount and type of cereals and cereal-based productscommonly more frequently consumed by the volunteers in the month prior the study and to captureand verify the most common food sources of DON in the diet. In order to capture such food categories,the EFSA’s Food Classification System FoodEx2 database was used [46].
Beside the FFQ, a Food Diary (FD) was also prepared with the aim of collecting information on theintake of the same food items as those included in the FFQ, but referred to the two days immediatelybefore the urine sampling.
A database collecting all the data related to the enrolled subjects concerning individual information(age, gender, BMI, and other information) and food intake was prepared.
4.4.2. Statistical Analysis
Statistical analyses were carried out using STATA/SE 12.0. For descriptive statistics measures(e.g. mean, median) a substitution method was applied. Values below LOD were substituted with 0.Shapiro-Wilk test was used for testing of normality distribution. Two sample Wilcoxon rank sum test(Mann-Whitney test) was used to compare within categories (e.g., Male/Female or Vegetarian Y/N).
To assess the effect of all the observed variables on the total DON content (expressed as ng/mgcreat)an ordered logistic regression model was used. As variables, the model used a selection of theinformation gathered from the questionnaires including general variables such as age, gender and BMI,and food variables, namely the different food items reported on the FFQ and the FD. The model wasrun matching independent variables with the dependent variable. The variables that were shown to besignificant were matched together to assess how much of the observed phenomenon is explained bythe variables considered. When variables were significant, also interactions were considered. In orderto apply the ordered logistic regression model, a categorization in tertiles (33th, 66th, 100th) of thedependent variable, namely the total DON content (ng/mgcreat) on day 1 and day 2 was performed.
The odds ratio (OR) is used to quantify the extent of the association of the examined variable onthe total DON (ng/mgcreat) values.
A variable is considered significant when the null hypothesis of the relative coefficient of thevariable is null with a significance level set to 0.95 (1-alpha). For this purpose, the p value wasused. When the p value is higher than 0.05, the examined variable is considered to not be significant,conversely if the p value is lower than 0.05 the examined variable is considered to be significant.
Author Contributions: Conceptualization, B.D.S. and C.B.; Data curation, B.D.S., F.D. and G.M.; Formal analysis,F.D., B.M., responsible for the biological sampling (urine samples collection), A.C. and D.B.; Validation, B.D.S.,F.D., B.M. and E.S.; Writing—original draft, B.D.S., F.D. and E.S.; Writing—review & editing, C.B.
Funding: The data presented in this study is extracted from a larger study funded by the European Food SafetyAuthority (EFSA) call GP/EFSA/CONTAM/2013/04 into the “Experimental Study of Deoxynivalenol Biomarkers in
53

Toxins 2019, 11, 441
Urine”. Sole responsibility lies with the author and the Authority is not responsible for any use that may be madeof the information contained therein.
Acknowledgments: Marco Finocchietti, Gabriele Moracci, Maria Cristina Barea Toscan and Giuliana Verrone areacknowledged for their technical assistance.
Conflicts of Interest: The authors declare no conflict of interest.
References
1. Puntscher, H.; Kütt, M.L.; Skrinjar, P.; Mikula, H.; Podlech, J.; Fröhlich, J.; Marko, D.; Warth, B. Trackingemerging mycotoxins in food: Development of an LC-MS/MS method for free and modified Alternariatoxins. Anal. Bioanal. Chem. 2018, 410, 4481–4494. [CrossRef] [PubMed]
2. Ferrigo, D.; Raiola, A.; Causin, R. Fusarium Toxins in Cereals: Occurrence, Legislation, Factors Promotingthe Appearance and Their Management. Molecules 2016, 21, 627. [CrossRef] [PubMed]
3. Audenaert, K.; Vanheule, A.; Höfte, M.; Haesaert, G. Deoxynivalenol: A Major Player in the MultifacetedResponse of Fusarium to Its Environment. Toxins 2014, 6, 1–19. [CrossRef] [PubMed]
4. European Food Safety Authority (EFSA). Risks to human and animal health related to the presence ofdeoxynivalenol and its acetylated and modified forms in food and feed. EFSA J. 2017, 15, 4718–5093.[CrossRef]
5. Commission Regulation (EC). No 1881/2006 setting maximum levels for certain contaminants in foodstuffs.Off. J. Eur. Union 2006, 364, 5–24.
6. Visconti, A.; Haidukowski, M.; Pascale, M.; Silvestri, M. Reduction of Deoxynivalenol during durum wheatprocessing and spaghetti cooking. Toxicol. Lett. 2004, 153, 181–189. [CrossRef] [PubMed]
7. Brera, C.; Peduto, A.; Debegnach, F.; Pannunzi, E.; Prantera, E.; Gregori, E.; De Giacomo, M.; De Santis, B.Study of the influence of the milling process on the distribution of Deoxynivalenol content from the caryopsisto cooked pasta. Food Control 2012, 32, 309–312. [CrossRef]
8. Stadler, D.; Lambertini, F.; Woelflingseder, L.; Schwartz-Zimmermann, H.; Marko, D.; Suman, M. The Influenceof Processing Parameters on the Mitigation of Deoxynivalenol during Industrial Baking. Toxins 2019, 11, 317.[CrossRef]
9. Amoriello, T.; Belocchi, A.; Quaranta, F.; Ripa, C.; Melini, F.; Aureli, G. Behaviour of durum wheat cultivarstowards deoxynivalenol content: A multi-year assay in Italy. Ital. J. Agron. 2017, 13, 12–20. [CrossRef]
10. Turner, P.C.; Hopton, R.P.; Lecluse, Y.; White, K.L.M.; Fisher, J.; Lebailly, P. Determinants of urinarydeoxynivalenol and de-epoxy deoxynivalenol in male farmers from Normandy, France. J. Agric. Food Chem.2010, 58, 5206–5212. [CrossRef]
11. Vidal, A.; Claeys, L.; Mengelers, M.; Vanhoorne, V.; Vervaet, C.; Huybrechts, B.; De Saeger, S.; DeBoevre, M. Humans significantly metabolize and excrete the mycotoxin deoxynivalenol and its modifiedform deoxynivalenol-3-glucoside within 24 hours. Sci. Rep. 2018, 27, 5255–5266. [CrossRef]
12. Scientific Committee on Food (SCF). Opinion of the Scientific Committee on Food on Fusarium toxins. Part6: Group Evaluation of T-2 Toxin, HT-2 Toxin, Nivalenol and Deoxynivalenol. 2002. Available online:https://ec.europa.eu/food/sites/food/files/safety/docs/sci-com_scf_out123_en.pdf (accessed on 30 May 2019).
13. Joint Expert Committee on Food and Additives (JECFA). Evaluation of certain food additives andcontaminants. In Report of the Seventy-Second Meeting of the Joint FAO/WHO Expert Committee on FoodAdditives; WHO: Geneva, Switzerland, 2010.
14. Chen, L.; Yu, M.; Wu, Q.; Peng, Z.; Wang, D.; Kuca, K.; Yao, P.; Yan, H.; Nussler, A.K.; Liu, L.; et al. Genderand geographical variability in the exposure pattern and metabolism of deoxynivalenol in humans: A review.J. Appl. Toxicol. 2017, 37, 60–70. [CrossRef]
15. Prelusky, D.B.; Hamilton, R.M.; Trenholm, H.L.; Miller, J.D. Tissue distribution and excretion of radioactivityfollowing administration of 14C-labeled deoxynivalenol to White Leghorn hens. Fundam. Appl. Toxicol. 1986,7, 635–645. [CrossRef]
16. Prelusky, D.B.; Trenholm, H.L. Tissue distribution of deoxynivalenol in swine dosed intravenously. J. Sci.Food Agric. 1991, 39, 748–751. [CrossRef]
54

Toxins 2019, 11, 441
17. Schwartz-Zimmermann, H.E.; Hametner, C.; Nagl, V.; Fiby, I.; Macheiner, L.; Winkler, J.; Dänicke, S.; Clark, E.;Pestka, J.J.; Berthiller, F. Glucuronidation of deoxynivalenol (DON) by different animal species: Identifcationof iso-DON glucuronides and iso-deepoxy-DON glucuronides as novel DON metabolites in pigs, rats, mice,and cows. Arch. Toxicol. 2017, 91, 3857–3872. [CrossRef]
18. Warth, B.; Del Favero, G.; Wiesenberger, G.; Puntscher, H.; Woelflingseder, L.; Fruhmann, P.; Sarkanj, B.;Krska, R.; Schuhmacher, R.; Adam, G.; et al. Identification of a novel human deoxynivalenol metaboliteenhancing proliferation of intestinal and urinary bladder cells. Sci. Rep. 2016, 6, 33854. [CrossRef]
19. Schwartz-Zimmermann, H.E.; Hametner, C.; Nagl, V.; Slavik, V.; Moll, W.-D.; Berthiller, F. Deoxynivalenol(DON) sulfonates as major DON metabolites in rats: From identification to biomarker method development,validation and application. Anal. Bioanal. Chem. 2014, 406, 7911–7924. [CrossRef]
20. Maul, R.; Warth, B.; Kant, J.S.; Schebb, N.H.; Krska, R.; Koch, M.; Sulyok, M. Investigation of the hepaticglucuronidation pattern of the Fusarium mycotoxin deoxynivalenol in various species. Chem. Res. Toxicol.2012, 25, 2715–2717. [CrossRef]
21. Sarkanj, B.; Warth, B.; Uhlig, S.; Abia, W.A.; Sulyok, M.; Klapec, T.; Krska, R.; Banjari, I. Urinary analysisreveals high deoxynivalenol exposure in pregnant women from Croatia. Food Chem. Toxicol. 2013, 62,231–237. [CrossRef]
22. Warth, B.; Sulyok, M.; Berthiller, F.; Schuhmacher, R.; Krska, R. New insights into the human metabolism ofthe Fusarium mycotoxins deoxynivalenol and zearalenone. Toxicol. Lett. 2013, 220, 88–94. [CrossRef]
23. Ali, N.; Blaszkewicz, M.; Degen, G.H. Assessment of deoxynivalenol exposure among Bangladeshi andGerman adults by a biomarker-based approach. Toxicol. Lett. 2016, 258, 20–28. [CrossRef]
24. Ali, N.; Blaszkewicz, M.; Al Nahid, A.; Rahman, M.; Degen, G.H. Deoxynivalenol Exposure Assessment forPregnant Women in Bangladesh. Toxins 2015, 7, 3845–3857. [CrossRef]
25. Gratz, S.W.; Richardson, A.J.; Duncan, G.; Holtrop, G. Annual variation of dietary deoxynivalenol exposureduring years of different Fusarium prevalence: A pilot biomonitoring study. Food Addit. Contam. Part AChem. Anal. Control Expo. Risk Assess. 2014, 31, 1579–1585. [CrossRef]
26. Hepworth, S.J.; Hardie, L.J.; Fraser, L.K.; Burley, V.J.; Mijal, R.S.; Wild, C.P.; Azad, R.; McKinney, P.A.;Turner, P.C. Deoxynivalenol exposure assessment in a cohort of pregnant women from Bradford, UK.Food Addit. Contam. Part A Chem. Anal. Control Expo. Risk Assess. 2012, 29, 269–276. [CrossRef]
27. Turner, P.C.; Ji, B.T.; Shu, X.O.; Zheng, W.; Chow, W.H.; Gao, Y.T.; Hardie, L.J. A biomarker survey of urinarydeoxynivalenol in China: The Shanghai Women’s Health Study. Food Addit. Contam. Part A Chem. Anal.Control Expo. Risk Assess. 2011, 28, 1220–1223. [CrossRef]
28. Wallin, S.; Gambacorta, L.; Kotova, N.; Lemming, E.W.; Nalsen, C.; Solfrizzo, M.; Olsen, M. Biomonitoringof concurrent mycotoxin exposure among adults in Sweden through urinary multi-biomarker analysis.Food Chem. Toxicol. 2015, 83, 133–139. [CrossRef]
29. Turner, P.C.; Burley, V.J.; Rothwell, J.A.; White, K.L.M.; Cade, J.E.; Wild, C.P. Deoxynivalenol: Rationale forthe development and application of urinary biomarker. Food Addit. Contam. Part A Chem. Anal. Control Expo.Risk Assess. 2008, 25, 864–871. [CrossRef]
30. Solfrizzo, M.; Gambacorta, L.; Visconti, A. Assessment of multi-mycotoxin exposure in southern Italy byurinary multi-biomarker determination. Toxins 2014, 6, 523–538. [CrossRef]
31. Commission Regulation (EC). No 401/2006 of 23 February 2006 laying down the methods of sampling andanalysis for the official control of the levels of mycotoxins in foodstuffs. Off. J. Eur. Union 2006, 70, 12–34.
32. Hines, R.N.; Sargent, D.; Autrup, H.; Birnbaum, L.S.; Brent, R.L.; Doerrer, N.G.; Cohen Hubal, E.A.;Juberg, D.R.; Laurent, C.; Luebke, R.; et al. Approaches for Assessing Risks to Sensitive Populations: LessonsLearned from Evaluating Risks in the Pediatric Population. Toxicol. Sci. 2010, 113, 4–26. [CrossRef]
33. Kourtis, A.P.; Read, J.S.; Jamieson, D.J. Pregnancy and infection. N. Engl. J. Med. 2014, 370, 2211–2218.[CrossRef]
34. Piekkola, S.; Turner, P.C.; Abdel-Hamid, M.; Ezzat, S.; El-Daly, M.; El-Kafrawy, S.; Savchenko, E.; Poussa, T.;Woo, J.C.S.; Mykkänen, H.; et al. Characterisation of aflatoxin and deoxynivalenol exposure among pregnantEgyptian women. Food Addit. Contam. Part A Chem. Anal. Control Expo. Risk Assess. 2012, 29, 962–971.[CrossRef]
35. Pestka, J.J. Deoxynivalenol: Mechanisms of action, human exposure, and toxicological relevance. Arch. Toxicol.2010, 84, 663–679. [CrossRef]
55

Toxins 2019, 11, 441
36. Turner, P.C.; White, K.L.; Burley, V.J.; Hopton, R.P.; Rajendram, A.; Fisher, J.; Cade, J.E.; Wild, C.P. A comparisonof deoxynivalenol intake and urinary deoxynivalenol in UK adults. Biomarkers 2010, 15, 553–562. [CrossRef]
37. Rodriguez-Carrasco, Y.; Molto, J.C.; Manes, J.; Berrada, H. Exposure assessment approach throughmycotoxin/creatinine ratio evaluation in urine by GC-MS/MS. Food Chem. Toxicol. 2014, 72, 69–75. [CrossRef]
38. Ediage, E.N.; Di Mavungu, J.D.; Song, S.Q.; Sioen, I.; De Saeger, S. Multimycotoxin analysis in urines toassess infant exposure: A case study in Cameroon. Environ. Int. 2013, 57–58, 50–59. [CrossRef]
39. Brera, C.; De Santis, B.; Debegnach, F.; Miano, B.; Moretti, G.; Lanzone, A.; Del Sordo, G.;Buonsenso, D.; Chiaretti, A.; Hardie, L.; et al. Experimental study of deoxynivalenol biomarkers inurine. EFSA Supporting Publ. 2015, 12, 818E. [CrossRef]
40. Turner, P.C.; Hopton, R.P.; White, K.L.M.; Fisher, J.; Cade, J.E.; Wild, C.P. Assessment of deoxynivalenolmetabolite profiles in UK adults. Food Chem. Toxicol. 2011, 49, 132–135. [CrossRef]
41. Klingensmith, M.E.; Aziz, A.; Bharat, A.; Fox, A. The Washington Manual of Surgery, 5th ed.; LippincottWilliams & Wilkins: Philadelphia, PA, USA, 2008.
42. Kliegman, R.M.; Geme, J.S. Nelson: Textbook of Pediatrics, 20th ed.; Elsevier: Philadelphia, PA, USA, 2015.43. Mazzachi, B.C.; Peake, M.J.; Ehrhardt, V. Reference range and method comparison studies for enzymatic and
Jaffé creatinine assays in plasma and serum and early morning urine. Clin. Lab. 2000, 46, 53–55.44. Magnusson, B.; Örnemark, U. (Eds.) Eurachem Guide: The Fitness for Purpose of Analytical Methods—A Laboratory
Guide to Method Validation and Related Topics, 2nd ed.; Eurachem: Torino, Italy, 2014; ISBN 978-91-87461-59-0.45. Ellison, S.L.R.; Williams, A. Eurachem/CITAC Guide: Quantifying Uncertainty in Analytical Measurement, 3rd ed.;
Eurachem: Torino, Italy, 2012.46. European Food Safety Authority (EFSA). Use of the EFSA Comprehensive European Food Consumption
Database in Exposure Assessment. EFSA J. 2011, 9, 2097–2131. [CrossRef]47. Vioque, J.; Navarrete-Muñoz, E.M.; Gimenez-Monzó, D.; García-de-la-Hera, M.; Granado, F.; Young, I.S.;
Ramón, R.; Ballester, F.; Murcia, M.; Rebagliato, M.; et al. Reproducibility and validity of a food frequencyquestionnaire among pregnant women in a Mediterranean area. Nutr. J. 2013, 19, 12–26. [CrossRef]
© 2019 by the authors. Licensee MDPI, Basel, Switzerland. This article is an open accessarticle distributed under the terms and conditions of the Creative Commons Attribution(CC BY) license (http://creativecommons.org/licenses/by/4.0/).
56

toxins
Article
Fluorescence Polarization Immunoassay for theDetermination of T-2 and HT-2 Toxins and TheirGlucosides in Wheat
Vincenzo Lippolis 1,*, Anna C. R. Porricelli 1, Erminia Mancini 1, Biancamaria Ciasca 1,
Veronica M. T. Lattanzio 1, Annalisa De Girolamo 1, Chris M. Maragos 2, Susan McCormick 2,
Peiwu Li 3, Antonio F. Logrieco 1 and Michelangelo Pascale 1
1 Institute of Sciences of Food Production (ISPA), National Research Council of Italy (CNR), 70126 Bari, Italy2 Mycotoxin Prevention and Applied Microbiology Research Unit, Agricultural Research Service,
U.S. Department of Agriculture, Peoria, IL 61604, USA3 Key Lab for Mycotoxins Detection, Oil Crops Research Institute of the Chinese Academy of Agricultural
Sciences, Wuhan 430062, China* Correspondence: [email protected]
Received: 30 April 2019; Accepted: 19 June 2019; Published: 1 July 2019
Abstract: T-2 and HT-2 toxins and their main modified forms (T-2 glucoside and HT-2 glucoside)may co-occur in cereals and cereal-based products. A fluorescence polarization immunoassay (FPIA)was developed for the simultaneous determination of T-2 toxin, HT-2 toxin and relevant glucosides,expressed as sum. The developed FPIA, using a HT-2-specific antibody, showed high sensitivity (IC50
= 2.0 ng/mL) and high cross-reactivity (100% for T-2 toxin and 80% for T-2 and HT-2 glucosides). TheFPIA has been used to develop two rapid and easy-to-use methods using two different extractionprotocols, based on the use of organic (methanol/water, 90:10, v/v) and non-organic (water) solvents,for the determination of these toxins in wheat. The two proposed methods showed analyticalperformances in terms of sensitivity (LOD 10 μg/kg) recovery (92–97%) and precision (relativestandard deviations ≤13%), fulfilling the criteria for acceptability of an analytical method for thequantitative determination of T-2 and HT-2 toxins established by the European Union. Furthermore,the methods were then validated in accordance with the harmonized guidelines for the validationof screening methods included in the Regulation (EU) No. 519/2014. The satisfactory analyticalperformances, in terms of intermediate precision (≤25%), cut-off level (80 and 96 μg/kg for the twomethods) and rate of false positives (<0.1%) confirmed the applicability of the proposed methodsas screening method for assessing the content of these toxins in wheat at the EU indicative levelsreported for T-2 and HT-2 toxins.
Keywords: fluorescence polarization immunoassay; T-2 toxin; HT-2 toxin; T-2 glucoside; HT-2glucoside; wheat; validation study; screening method
Key Contribution: This manuscript reports the first fluorescence polarization immunoassay for thedetermination of T-2 and HT-2 toxins and relevant glucosides in wheat. Two alternative extractionprotocols were proposed and methods were validated in accordance with the Commission Regulation(EU) No. 519/2014.
1. Introduction
T-2 toxin (T-2) and its deacetylated form HT-2 toxin (HT-2) are epoxy sesquiterpenoids, classifiedas type-A trichothecene mycotoxins, produced by several Fusarium species, mainly F. langsethiae andF. sporotrichioides, in cereal grains under cool and moist conditions in the field and after harvesting.
Toxins 2019, 11, 380; doi:10.3390/toxins11070380 www.mdpi.com/journal/toxins57

Toxins 2019, 11, 380
Several studies report the incidence of T-2 and HT-2 mainly in oats, but also in other grains includingbarley, wheat, maize, rice and soybean, as well as in cereal-based products [1–4]. Being potent inhibitorsof DNA, RNA and protein synthesis, T-2 and HT-2 can cause several adverse effects in both humans andanimals [3,5]. Due to their toxicity and co-occurrence, the Panel on Contaminants in the Food Chain(CONTAM Panel) of the European Food Safety Authority (EFSA) established a group tolerable dailyintake (TDI) of 100 ng/kg body weight per day for the sum of T-2 and HT-2 [3]. Although maximumpermitted levels were not established for T-2 and HT-2, the European Union provided indicative levelsfor the sum of these toxins in cereals and derived products ranging from 15 to 2000 μg/kg [6] from whichinvestigations should be performed to assess changes and trends in human and animal exposure. Forunprocessed wheat samples, the indicative level for T-2 and HT-2 was 100 μg/kg (expressed as sum).
Several modified forms of T-2 and HT-2 generated by fungi, plants and mammals were isolatedand characterized, as reported in the EFSA Scientific Opinion [7]. Among the possible modificationsfor these toxins, conjugation with sugars, mainly with glucose, as glucopyranosides play an importantrole leading to the formation of T-2 glucoside (T-2G) and HT-2 glucoside (HT-2G). Figure 1 reportsthe chemical structures of T-2, HT-2, T2-G and HT-2G. The presence of T-2G and HT-2G in naturallycontaminated cereals, including wheat, oat, maize and barley, have been reported by severalauthors [8–11] and recently reviewed [12]. Only limited toxicological data are available for T-2G andHT-2G, but they could also be toxic by releasing their aglycones, either during food processing or inthe gastrointestinal tract after ingestion [7]. Although the CONTAM Panel found it appropriate toestablish a group TDI for T-2 and HT-2 and their modified forms, they concluded that this assumptionwould determine an overestimation of risk for these toxins; therefore, based on new toxicity studies,the group TDI, only for T-2 and HT-2, was recently amended to 20 ng/kg body weight per day [7].Moreover, an estimation of human and animal dietary exposure to T-2 and HT-2 has been recentlycarried out by EFSA. However, due to lack of data, the potential presence of the T-2/HT-2 modifiedforms was not considered, which could determine an underestimation of the real exposure [4]. Forthese reasons, the collection of analytical data on T-2 and HT-2, including modified forms, in foodand feed commodities is highly needed using analytical methods with an appropriate sensitivityand accuracy [4,11]. Moreover, the availability of analytical methods able to detect simultaneouslymycotoxins and their modified forms, even though expressed as the sum, is very useful especially inview of possible future requirements of European Regulations.
Figure 1. Chemical structures of T-2 and HT-2 toxins and their main modified forms T-2 andHT-2 glucosides.
A large number of analytical methods are available for the determination of T-2 and HT-2 incereals and derived products, based on high- or ultrahigh-performance liquid chromatography (HPLC
58

Toxins 2019, 11, 380
and UHPLC) and gas chromatography (GC) [13–15]. Although these methods have high accuracyand sensitivity permitting the determination of T-2 and HT-2 at the indicative levels recommendedby the European Commission [6], they cannot be used for the determination of relevant glycosylatedforms. For this reason, LC-MS analysis is the most widely used approach for the simultaneousdetermination of T-2/HT-2 and relevant glucosides, which are also often detected together with otherco-occurring mycotoxins, as well as their modified forms [11,16]. However, these analytical methodsare expensive, time-consuming and require skilled personnel. For this reason, easy-to-use, rapid, cheap,high-throughput, robust and reliable analytical methods for the simultaneous monitoring of T-2 andHT-2 and relevant glucosides are in great demand for collecting more data and correctly evaluatingthe real exposure to these toxins. Moreover, in the development of rapid test kits for the detection ofmycotoxins the use of non-organic solvents is especially encouraged to provide kits for users who arenot familiar with the management and disposal of the organic solvents [17].
In the last decade, several rapid methods have been developed for the detection of T-2 and HT-2in cereals and derived products, mainly immunochemical methods [13], such as enzyme-linkedimmunosorbent assays [18–21], lateral flow devices or dipsticks [22], fluorescence polarizationimmunoassays (FPIAs) [23,24], biosensors and immunochips [25,26] and, more recently, also methodsbased on the use of aptamers as alternative receptors [27,28]. None of these methods were developedfor the simultaneous detection of T-2 and HT-2 and relevant glucosides. A monoclonal antibody wasspecifically designed and validated for T-2 and T-2G, and when used in ELISA, showed an IC50 in thelow ng/mL range, suggesting its potential use for their simultaneous detection [29].
Among screening methods, FPIAs have been widely shown to be a useful tool for mycotoxinscreening [30,31]. FPIAs are homogeneous immunoassays based on the competition between the analyteand tracer (fluorescent derivative of analyte) for a limited amount of antibody. The analyte content isdetermined by measuring the reduction of fluorescence polarization value, which is determined bythe reduction of tracer molecules able to bind antibody in solution [30]. Several FPIA methods havebeen developed as screening tools for the determination of major mycotoxins, including aflatoxins,ochratoxin A, zearalenone, fumonisins, deoxynivalenol and T-2 and HT-2, in food matrices [30–32].In particular, some FPIAs have been developed and validated for the determination of T-2 and HT-2,express as sum, in wheat, oats, barley and cereal-based products [23,24]. To date, no FPIAs and, moregenerally, no rapid methods are available for the simultaneous determination of T-2 and HT-2 andrelevant glucosides.
For this reason, the aim of this study was to develop and validate an FPIA for the simultaneousdetermination, expressed as sum, of T-2, HT-2, T-2G and HT-2G in wheat. Two different extractionprotocols, using organic (methanol/water) and non-organic (water) solvents, were optimized forthe FPIA. The two developed methods based on the FPIA and using the two protocols have beenvalidated in-house as quantitative methods, determining sensitivity, recovery and precision values.Furthermore, the two methods were validated through a single-laboratory validation protocol accordingto harmonized guidelines recently established by the Regulation (EU) No. 519/2014 [33]. Thefitness-of-purpose of the FPIA was evaluated by calculating the method precision profiles and settingthe screening target concentrations (STC) for false suspect rate and cut-off level to the EU’s indicativelevels of the sum of T-2 and HT-2 in wheat [33].
2. Results and Discussion
2.1. Development of the FPIA
The antibody specific to the mycotoxin of interest and the tracer are key reagents in the developmentof a competitive FPIA for mycotoxin analysis. The most important features of the FPIA, suchas incubation time, recovery, precision and sensitivity, are strictly related to the antibody/tracercombination used [30]. Binding experiments were performed, in buffer solution, by FP measurement toselect the best antibody/tracer combination. Specifically, 48 different combinations were tested, derived
59

Toxins 2019, 11, 380
from 12 monoclonal antibodies (i.e., ten specifics for T-2G, one for T-2 and one for HT-2) versus 4 differenttracers (i.e., one T-2 and three HT-2 fluorescent derivatives). Table 1 reports the maximum valuesof polarization shift (ΔPmax, maximum tracer-antibody binding) and optimized MAb concentrationsobtained for each antibody/tracer combination. Among all MAb/tracer combinations tested, the highestbindings were observed for the four combinations obtained with anti-T2 and anti-HT2 versus T2-FLand HT2-FL1a, with ΔPmax ranging from 205 to 282 mP, and for fifteen combinations composed ofanti-T2-glucoside antibodies and the four tracers with ΔPmax in the range of 133–280 mP (Table 1).
Table 1. Maximum value of polarization shift (ΔPmax) obtained at the optimized antibody concentrationsfor each antibody/tracer combination.
MAb Clone[MAb]
(μg/mL)
ΔPmax (mP) 1
T2-FL(Dilution 1:3600) 2
HT2-FL1a
(Dilution 1:3000) 2HT2-FL1b
(Dilution 1:400) 2HT2-FL2
(Dilution 1:3600) 2
Anti-T2G 1–2 190 138 3 - 59 571–3 40 280 3 39 262 3 159 3
1–4 104 225 3 28 253 3 176 3
2–5 89 116 53 246 2 272–11 118 144 3 18 50 182–13 134 191 3 23 28 192–16 90 200 3 37 82 212–17 120 129 27 156 3 182–21 132 159 3 22 14 162–44 155 176 3 133 3 246 3 49
Anti-T2 1 6 282 3 217 3 93 111
Anti-HT2 H10-A10 8 205 3 230 3 122 201 ΔPmax =mPMAb −mPtracer; −ΔPmax < 10mP; 2 Optimised dilution (v/v) of the stock solutions providing a totalfluorescence intensity equal to 3-fold the blank signal measured for PBS-A; 3 selected antibody/tracer combinations.
All these selected combinations in the optimized concentrations were tested for competitiveFPIAs with mixed T-2, HT-2, T-2G and HT-2G (ratio 1:1:0.5:0.5) standard solutions in different rangesof concentrations. Although all T2-glucoside MAbs exhibited suitable cross-reactivity for T-2, HT-2and HT-2G, the assays showed poor sensitivity, with IC50 ≥ 12.2 ng/mL. The FPIA performed byAnti-T2/T2-FL and Anti-T2/HT2-FL1a showed an acceptable sensitivity, with IC50 ≥ 4.0 ng/mL, buta low cross-reactivity for HT-2, T-2G and HT-2G ranging from 41 to 63%. On the other hand, theFPIA performed by using the Anti-HT2/HT2-FL1a combination showed good sensitivity, with IC50 =
2.0 ng/mL and a high cross-reactivity of 100% for T-2 and 80% for T-2G and HT-2G (Figures S1–S4 reportthe calibration curves for the single toxins). Figure 2 reports the calibration curve for mixed standardsolutions of T-2, HT-2 and their glucoside forms in the concentration range of 0.1–73.2 ng/mL (expressedas the sum of the toxins). An incubation time of 5 min was selected as optimal for this competitiveimmunoassay. The combination of Anti-HT2/HT-2FL1a was then selected as the antibody/tracercombination to use for further development and validation of the assay.
2.2. Testing of Extraction Protocols and Evaluation of Matrix Effects
Two rapid extraction protocols based on the use of organic (methanol/water, 90:10, v/v, Protocol A)and non-organic (water, Protocol B) solvents were tested for the FPIA. Preliminary experiments, basedon LC-MS analysis of raw extracts, were performed to assess the reliability in terms of accuracy of theprotocols for the simultaneous extraction of T-2, HT-2, T-2G and HT-2G from spiked wheat samples attwo levels: 300 and 600 μg/kg (expressed as sum). In the case of Protocol A, mean recoveries rangedfrom 110 to 119% for single toxins and from 112 to 115% for total toxins (expressed as sum). Relativestandard deviations were lower than 7% for all tested toxins. In the case Protocol B, mean recoveriesranged from 88 to 106% for T-2G and HT-2G and from 163 to 192% for HT-2, with RSD lower than18%. T-2 was not detected in any of the tested replicates at either spiking level. The absence of T2,together with the high recoveries for HT-2, was attributed to de-acetylation processes as a result of
60

Toxins 2019, 11, 380
cereal carboxylesterases inducing the complete conversion of T-2 into HT-2 in water-based extracts,as previously observed [34]. Moreover, recoveries obtained for total toxins, expressed as sum, werebetween 88% and 98%, with RSD lower than 9% for both protocols. These results show the potentialapplicability of the tested extraction protocols for the FPIA, aiming to determine the sum of these toxins.
Fluo
resc
ence
Pol
ariz
atio
n
[T-2+HT-2+T-2G+HT-2G] ng/mL[T-2+HT-2+T-2G+HT-2G] ng/mL
Nor
mal
ized
Pol
ariz
atio
n
r = 0.992
0.000.100.200.300.400.500.600.700.800.90
2.2 2.7 3.2 3.7 4.2
Nor
mal
ized
Pol
ariz
atio
n
Log [T-2+HT2+T-2G+HT-2G] pg/mL
Figure 2. Normalized calibration curve of the selected FPIA obtained with mixed standard solutionsof T-2, HT-2, T2-glucoside and HT2-glucoside (expressed as sum, ratio 1:1:0.5:0.5) in PBS-A solution([Anti-HT2] = 8 μg/mL; [HT2-FL1a] obtained after dilution 1:3000 (v/v) of the stock solution, see Table 1).The FP linearity range vs. log [T-2 + HT-2 + T-2G + HT-2G] is reported in the insert. Values of thex-axes are the toxin concentrations in the final test solution.
Studies to evaluate the presence of matrix interferences by FPIA using different amounts of matrixequivalent (5, 10 and 20 mg) indicated that no significant differences were observed between slopes(tcalc < 2.306; p < 0.05) and positions (tcalc < 2.262; p < 0.05) of the regression lines obtained withmixed standard solutions and those obtained with spiked diluted extracts for both optimized protocols(Protocol A and Protocol B, calibration curves were reported in Figure S5). These results indicated thetotal absence, up to the tested amounts, of detectable matrix effects for the developed FPIAs that couldproduce an overestimation of toxins content.
2.3. Validation of the Methods
To obtain a comprehensive analytical performance profile, the two methods based on the developedFPIA and using the two extraction protocols were validated in-house, both as quantitative methodsand as screening methods.
Limit of detection (LOD) and limit of quantification (LOQ) of 10 and 15 μg/kg, respectively, wereobtained for the FPIA using both extraction protocols (Protocol A and B) and analyzing 20 mg of matrixequivalent. These results indicated that the sensitivity of the methods was suitable for the quantitativedetermination of the target toxins at levels far below the indicative level suggested by the EuropeanCommission for the sum of T-2 and HT-2 in unprocessed wheat (i.e., 100 μg/kg). Recoveries (%) andrepeatability (relative standard deviation, RSD, %) for the FPIA using both extraction protocols fromwheat samples spiked with T-2, HT-2, T-2G and HT-2G in the range 50–200 μg/kg (expressed as sum)are reported in Table 2.
61

Toxins 2019, 11, 380
Table 2. Average recoveries for T-2, HT-2, T-2G and HT-2G (expressed as sum) and relative standarddeviations from spiked wheat obtained by FPIA using protocol A and B.
Spiking Levels (μg/kg)
FPIA
Protocol A Protocol B
Recovery RSD 1 (%) Recovery RSD 1 (%)
50 102 13 89 7100 92 5 98 6200 96 4 89 6
Overall average 97 9 92 71 RSD, relative standard deviation (n = 3 replicates).
Mean recoveries for the FPIA using Protocol A ranged from 92 to 102%, with RSDs lower than13%, whereas mean recoveries for FPIA using Protocol B were in the range 89–98%, with RSDs lowerthan 7%. Overall mean recoveries were 97 and 92% for FPIA using Protocols A and B, respectively. Thevalues of recoveries and precision obtained for the developed FPIAs fulfil the criteria of acceptabilityfor an analytical method for the quantitative determination of the native forms fixed by the EuropeanCommission [33].
Single-laboratory validation of the two developed methods was performed in-house over 5different days in accordance with the harmonized guidelines for screening methods established by theRegulation (EU) No. 519/2014 by determining the precision profile of the method, the cut-off level andthe false suspect rate. The summary results of the statistical assessment for blank samples and samplesartificially contaminated at screening target concentration (STC, 100 μg/kg as the sum of T-2, HT-2,T-2G and HT-2G) are presented in Table 3. The STC value was set at the EU indicative levels of thesum of T-2 and HT-2 in wheat. The mean values of the test responses for the sum of these toxins were115 and 104 μg/kg for samples at STC and 12 and 21 μg/kg for blank samples, for FPIA with ProtocolA and Protocol B, respectively. Depending on the method used, relative standard deviation of therepeatability (RSDr) and relative standard deviation of intermediate precision (RSDRI) ranged from 5to 13% for STC samples and from 14 to 25% for blank samples. The calculated cut-off levels were 96and 80 μg/kg, for FPIA with Protocol A and Protocol B, respectively, and the rate of suspect results forblank samples was in both cases less than 0.1%.
Table 3. Statistical performances of the single-laboratory validation over 5 days of the FPIA for thedetermination of T-2, HT-2, T-2G and HT-2G (expressed as sum) with blank and artificially contaminated(at the screening target concentration of 100 μg/kg) wheat samples. Cut-off levels and rate of falsesuspect results were calculated according to the Regulation (EU) No. 519/2014.
Performances
Protocol A Protocol B
BlankSTC 1
(100 μg/kg)Blank
STC 1
(100 μg/kg)
Mean value 2 (μg/kg) 12 115 21 104RSDr
3 (%) 16 5 14 9RSDRI
4 (%) 25 10 16 13Cut-off level 96 80
Rate of false suspect results (%) <0.1 <0.11 STC, screening target concentration; 2 The mean value of the total content of T-2, HT-2, T-2G and HT-2G (μg/kg,expressed as sum) (n = 20 replicates); 3 RSDr, relative standard deviation of the repeatability; 4 RSDRI, relativestandard deviation (intermediate precision).
Moreover, Figure 3 shows the graphical representation of the results, reporting the toxin contentsobtained for the 20 artificially contaminated samples at STC and the 20 blanks, analyzed over 5 differentdays together with the calculated cut-off levels for the FPIA using Protocol A (Figure 3a) and Protocol B
62

Toxins 2019, 11, 380
(Figure 3b). A complete separation between blanks and spiked samples at STC was observed for bothmethods, demonstrating their ability to discriminate between these two groups of samples. This aspectwas also confirmed by the low rate of suspect results (less than 0.1%). The overall results confirmedthe applicability of both methods for the simultaneous determination of T-2, HT-2, T-2G and HT-2G(expressed as sum) in wheat samples at the indicative level reported at EU level for the native formsT-2 and HT-2 from uncontaminated samples.
a
(b)
0
20
40
60
80
100
120
140
0 5 10 15 20
T-2+
HT-
2+T-
2G+H
T-2G
(μg/
kg)
Sample No
STC (100 μg/kg)
Blank
Cut off: 96 μg/kg
0
20
40
60
80
100
120
140
0 5 10 15 20
T-2+
HT-2+T
-2G+
HT-2G(μg/kg
)
Sample No
STC (100 μg/kg)
Blank
Cut off: 80 μg/kg
Figure 3. Contents of T-2, HT-2, T-2G and HT-2G (expressed as sum) of 20 artificially contaminatedwheat samples at STC (100 μg/kg) and of 20 blank wheat samples analyzed under repeatabilityconditions on 5 different days: (a) FPIA using protocol A; (b) FPIA using protocol B.
Moreover, there are several advantages to using a solvent-free extraction (Protocol B). Removalof organic solvents from the extraction is safer, because it reduces exposure of the analyst. It is alsoless expensive, because the cost associated with management of solvent waste (such as storage anddisposal) are eliminated. Finally, eliminating solvents facilitates use in a wider variety of settingsoutside of the traditional laboratory.
3. Conclusions
A rapid FPIA for the simultaneous determination of T-2, HT-2, T-2G and HT-2G, expressedas their sum, was developed for the first time, by testing 12 monoclonal antibodies and 4 tracers.Two alternative extraction protocols, using organic and non-organic solvents, were optimised for thequantitative determination of these toxins in wheat. The main advantages of the developed methodswere ease of use and speed (total time less than 15 min). The main disadvantage was the inability todetermine the content of the individual toxins. The methods when validated as quantitative methodsshowed analytical performances, in terms of recovery (92–97%) and precision (RSDs ≤ 13%) thatfulfilled the EU criteria for acceptability of an analytical method for the determination of native forms.Furthermore, the developed methods were also validated according to EU harmonized guidelines for
63

Toxins 2019, 11, 380
the single-laboratory validation of screening methods. The satisfactory analytical performances, interms of precision under repeatability (5–16%), intermediate precision (10–25%), cut-off level (80 and96 μg/kg for the two methods) and rate of false positives (<0.1%), confirmed the applicability of theproposed methods based on the FPIA as screening methods for assessing the content of T2, HT2, T2Gand HT2G in wheat at EU indicative levels reported for the native forms. Additional advantages of theFPIA methods were low-cost, portability, amenability to automation, and the use of environmentallyfriendly extraction procedures. These advantages make the developed FPIA methods useful androbust tools for high-throughput screening of these toxins in wheat, without the need for well equippedlaboratories or personnel with a high level of technical skill.
4. Materials and Methods
4.1. Chemicals and Reagents
Acetonitrile and methanol were reagent grade or better and were purchased from Carlo ErbaReagents (Milan, Italy). Ultrapure water was produced by a Milli-Q® Direct system (Merck KGaA,Darmstadt, Germany). T-2 and HT-2, sodium chloride (NaCl), sodium azide (NaN3), phosphate buffersaline (PBS) and ovalbumin (OVA) were purchased from Sigma-Aldrich (Milan, Italy). Ten monoclonalantibodies (MAbs) specific for T-2G (clones 1–2, 1–3, 1–4, 2–5, 2–11, 2–13, 2–16, 2–17, 2–21 and 2–44)were produced by US Department of Agriculture-Agricultural Research Center (USDA-ARS, Peoria,IL, USA) and have been described in Maragos et al. [29]. A Mab specific for T-2 (clone 1) was producedby Chinese Academy of Agricultural Sciences—Oil Crops Research Institute (Wuhan, China) andhas been described by Zhang et al. [35]. A Mab specific for HT-2 (clone H10-A10) was purchasedfrom University of Natural Resources and Life Science of Vienna—Department for AgrobiotechnologyIFA-Tulln (Tulln, Austria). T-2 glucoside and HT-2 glucoside, both as α-anomers, were produced byUSDA-ARS and have been described by McCormick et al. [36]. Glass culture tubes (10 × 75 mm) wereobtained from VWR International (Milan, Italy). Paper filters (No. 4) and glass microfiber filters (GF/A)were purchased from Whatman (Maidstone, UK).
4.2. Preparation of Immunoassay Reagent Solutions
T-2 and HT-2 stock solutions, at the concentration of 1 mg/mL, were prepared by dissolving solidcommercial toxins in acetonitrile. T-2G and HT-2G stock solutions were prepared at the concentrationof 1 mg/mL in acetonitrile. Diluted T-2, HT-2, T-2G and HT-2G solutions were prepared in acetonitrile atthe concentration of 20 μg/mL. Mixed standard solutions of T-2, HT-2, T-2G and HT-2G (ratio 1:1:0.5:0.5)were prepared in acetonitrile and PBS-A (PBS, 10 mM, pH = 7.4, containing 0.1% of NaN3) at theconcentration of 10 and 3 μg/mL, respectively. The mixed standard solution in acetonitrile was used forspiking experiments in the LC-MS analysis to evaluate the extraction efficiency of the two alternativeprotocols. The mixed standard solution in PBS-A was used to prepare FPIA calibration curves. T-2and HT-2 tracers (T2-FL: fluorescein-labelled T2 toxin; HT2-FL1a and HT2-FL1b: monosubstitutedfluorescein-labelled HT2 toxin, arbitrarily ascribed to each isomeric product; HT2-FL2: bi-substitutedfluorescein-labelled HT2 toxin tracers) were prepared according to the procedure reported by Lippoliset al. 2011 [23], who also reported their chemical structures. Tracer working solutions were prepareddaily by diluting the relevant stock solutions in methanol at the concentration providing a totalfluorescence intensity equal to 3-fold the blank signal measured for the assay buffer (PBS-A). In thecase of the selected tracer (HT2-FL1a) for the developed FPIA the dilution ratio was 1:3000 (v/v).Thetwelve monoclonal antibodies were diluted with PBS-OVA (PBS-A, containing 0.1% of OVA) accordingto the experiments reported in the Section 4.4 (FPIA analysis).
4.3. Sample Preparations
Durum wheat samples of different cultivars were collected from several fields in Italy. Sampleswere milled by the Ultra Centrifugal Mill ZM 200 (Retsch Technology GmbH, Hann, Germany)
64

Toxins 2019, 11, 380
equipped with a 500-μm sieve. Two different extraction protocols, using organic (methanol/water) andnon-organic (water) solvents, were tested. In particular, in the first approach (Protocol A), an aliquot(50 g) of wheat, added together with NaCl (1 g), was extracted with 100 mL of methanol/water (90/10,v/v) by blending at high speed for 3 min using a Steril Mixer 12 blender (VWR International). Afterfiltering extracts through the filter paper, they were diluted with a 4% NaCl solution (ratio 1:5, v/v)and left to rest for 5 min. The dilution with 4% NaCl solution was carried out in order to reduce thepercentage of methanol in solution and to precipitate interfering compounds, which may contribute toincreasing the matrix effect. The diluted extracts were filtered by glass microfiber filters and analyzedby FPIA. In the case of the second approach (Protocol B), an aliquot of ground wheat samples (10 g)was extracted with 100 mL of water by blending at high speed for 3 min by Steril Mixer 12 blender.To evaluate the performances of both protocols for the simultaneous extraction of the tested toxins,recovery experiments were performed in triplicate by spiking uncontaminated (blank) wheat sampleswith a mixed T-2, HT-2, T-2G and HT-2G (ratio 1:1:0.5:0.5) spiking solution in acetonitrile at levels of300 and 600 μg/kg. Extracts of both protocols (A and B) were filtered through a filter paper and aglass microfiber filter and subsequently analyzed by LC-MS analysis according to the experimentalconditions reported in Lattanzio et al. 2012 [8].
4.4. FPIA Analysis
All FP measurements were carried out in the glass culture tubes and using a portable reader(Sentry® 100, Diachemix Corporation, Milwaukee, WI, USA) with excitation and emission wavelengthsof 485 and 535, respectively. Preliminary FP measurements were performed in buffer solution inorder to find the best combination antibody/tracer to be used in the FPIA. In particular, the bindingability of the 12 MAbs was tested versus the 4 synthesized tracers by measuring the polarizationshift (ΔP = mPMAb − mPtracer) observed between the test PBS-A solution containing the tracer(at the optimized concentration, see Table 1) and the test solution after adding the MAb workingsolutions at different concentrations and incubating in the range 0–10 min. In particular, the MAbworking solution were 47.5–190 μg/mL for clone 1–2, 3.95–79 μg/mL for clone 1–3, 5.2–104 μg/mLfor clone 1–4, 17.8–89 μg/mL for clone 2–5, 29.5–118 μg/mL for clone 2–11, 33.5–134 μg/mL for clone2–13, 18.0–90 μg/mL for clone 2–16, 30.0–120 μg/mL for clone 2–17, 33.0–132 μg/mL for clone 2–21,15.5–155 μg/mL for clone 2–44, 0.20–200 μg/mL for anti-T2 clone 1, 1.48–39.4 μg/mL for anti-HT2clone H10-A10. For each Mab/tracer combination, the optimized MAb concentration correspondedto the lowest concentration providing the maximum value of ΔP (ΔPmax).Competitive FPIAs werecarried out with mixed (ratio 1:1:0.5:0.5) standard solutions, in different concentration ranges, byusing the nineteen selected antibody/tracer combinations (indicated in Table 1, using an arbitrarycut-off for the ΔPmax of 130 mP). In particular, the assays were carried out by adding 850 μL ofPBS-A, 100 μL of antibody working solution and 50 μL of mixed T-2, HT-2, T-2G and HT-2G standardsolution in a test tube. The polarization value of this test solution, previously mixed by vortex, wasmeasured and used as the blank. An aliquot (25 μL) of tracer working solution (at the optimizedconcentration, see Table 1) was added and the solution was gently mixed by vortex. After incubating(in the range 0–10 min) the polarization value, expressed in millipolarization units (mP), of the solutionwas measured. Competitive FPIAs were also performed using the selected antibody/tracer combination(clone H10-A10/HT2-FL1a) and standard solutions of the single toxins T-2, HT-2, T-2G and HT-2G todetermine their midpoint concentrations (IC50).The cross-reactivity of the selected monoclonal antibody(clone H10-A10) has already been tested for structurally related toxins (deoxynivalenol, 3-acetyl-DON,15-acetyl-DON, diacetoxyscirpenol, neosolaniol and nivalenol) and mycotoxins frequently occurringin wheat (ochratoxin A and zearalenone), showing a very low cross-reactivity for neosolaniol (CR% =0.12%) and no cross-reactivity for all other tested toxins [23].
The developed FPIA were carried out by adding and mixing 700 μL of PBS-A, 100 μL of antibodyworking solution (clone H10-A10, 8 μg/mL), 200 μL of filtered extract for both protocols (Protocol Aand Protocol B, equivalent to 20 mg of matrix) or 50 μL of mixed T-2, HT-2, T-2G and HT-2G standard
65

Toxins 2019, 11, 380
solution. After reading the blank using an FP reader, 25 μL of tracer working solution (HT2-FL1a,dilution 1:3000, v/v of the stock solution) was added, and the final solution was mixed and incubated for5 min. The polarization value after incubation was measured. The measured polarization values werenormalized to fit in the range 0–1, the equation Yobs = (mPobs −mP0)/(mP1 −mP0) was used, wheremPobs, mP0 and mP1 are the polarization of the test solution, of an antibody-free control solution andof a toxin-free control solution, respectively, and Yobs is the normalized result for the test solution [30].The content of T-2, HT-2, T-2G and HT-2G, expressed as sum, in the wheat extracts was determinedby using the measured normalized polarization values and the FPIA calibration curves in the toxinsconcentration range 5.85–187.5 ng/mL.
4.5. Evaluation of Matrix Effects
The presence of matrix effect on the developed FPIA was evaluated for both protocols (Protocol Aand Protocol B). In particular, diluted extracts of blank wheat were spiked at different T-2, HT-2, T-2Gand HT-2G levels in the concentration range 5.85–187.5 ng/mL (expressed as sum) at different amountof matrix equivalent analyzed, i.e., 5, 10 and 20 mg. Calibration curves determined by using eitherstandard solutions or spiked diluted extract of uncontaminated wheat samples were compared.
4.6. Validation as Quantitative Methods
The developed methods were validated in-house as quantitative methods, with their performancesbeing evaluated in terms of sensitivity, recovery and repeatability. Experiments were carried out todetermine the sensitivity of the FPIA using both protocols (A and B). In particular, limits of detection(LODs) of the FPIAs were calculated from the mean FP signals of representative uncontaminated wheatsamples (n = 10, wheat samples of different cultivars) minus 3 standard deviations of the mean signal.Limits of quantification (LOQs) were calculated by determining the lowest amount of measured toxins(expressed as sum) that was quantitatively determined by the calibration curve within the linearityrange of the FPIA.
Recovery experiments were performed by spiking, in triplicate, blank wheat samples at levelsof 50, 100 and 200 μg/kg and subsequently analyzing them by FPIA using both optimized extractionprotocols (Protocol A and Protocol B). This contamination range was selected in order to include theindicative level provided by the European Union for T-2 and HT-2 (100 μg/kg). Samples were leftovernight at room temperature to allow solvent evaporation prior to the FPIA analysis.
4.7. Validation as Screening Methods
The developed methods were also validated through single-laboratory validation accordingto harmonized guidelines for screening methods established by the European Commission in theRegulation (EU) No. 519/2014 [33]. The fitness-of-purpose of the FPIAs was evaluated by calculatingthe method precision profiles and setting the screening target concentrations [33] for the false suspectrate and the cut-off level to the EU’s regulatory/indicative levels of the relevant native forms in durumwheat. The validation design required 2 sample sets: (1) 20 positive control samples, namely, wheatsamples fortified with the mycotoxins at the STC (100 μg/kg for the sum of T-2, HT-2, T-2G and HT-2G),and (2) 20 negative samples (blank wheat samples). The measurements for each validation level (STCand blank) were evenly distributed over 5 different days, resulting in 4 independent analyses per day.Cut-off levels were calculated from the results obtained for the 20 samples spiked at the STC by usingthe equation provided in the Regulation (EU) No. 519/2014:
Cut-off = RSTC − t-value(0.05) × SDSTC (1)
where RSTC is the mean response of the spiked samples at STC; t-value(0.05) is the one tailed t-value fora rate of false negative results of 5% (i.e., 1.729 for 19 degrees of freedom and 20 replicates); the SDSTC
is the standard deviation of intermediate precision (which is the sum of repeatability and between-day
66

Toxins 2019, 11, 380
variability) at STC calculated by one-way ANOVA (p-value = 0.05). The false suspect rate is determinedon the base of the results obtained for 20 blanks and the calculated cut-off by calculating the t-valuefrom the following equation:
t-value = (meanblank − cut-off)/SDblank (2)
where meanblank is the mean response of the 20 blank samples; SDblank is the standard deviation of theintermediate precision of blank samples. From the calculated t-value, the rate of false suspect resultsfor a one-tailed distribution was calculated as indicated in Section 4.8.
4.8. Statistical Analysis
FPIA data were fit to linear or sigmoidal equations with Origin software version 6.0 (OriginLabCorporation, Northampton, MA, USA, 1999) using the unweighted least-square method. For thesigmoidal fit, the equation used was of the form y=A2 + [A1 −A2/1+ (x/x0)P]. Here, A1 and A2 representthe initial value (left horizontal asymptote) and the final value (right horizontal asymptote), respectively,while x0 represents the inflection point (center), and P represents the power. In the experiments tomeasure matrix effects, the linear regression curves were compared using parallelism and positionstatistical tests [37]. In the recovery experiments, which used three spiking levels, the homogeneities ofthe variances and the homogeneities of the means were compared using Barlett’s test and one-wayANOVA (p-value = 0.05), respectively. Results from experiments from the single-laboratory validationstudies were subjected to one-way ANOVA (p-value = 0.05) using the Microsoft Excel add-on. The rateof false suspect results relative to the calculated t-value from a one-tailed Student’s T Distribution wasobtained using the spreadsheet function “TDIST”.
Supplementary Materials: The following are available online at http://www.mdpi.com/2072-6651/11/7/380/s1,Figure S1: Normalized calibration curve of the selected FPIA obtained with mixed standard solutions of T-2toxin (T-2) in PBS-A solution ([Anti-HT2] = 8 μg/mL; [HT2-FL1a] obtained after dilution 1:3000 (v/v) of the stocksolution). Figure S2: Normalized calibration curve of the selected FPIA obtained with mixed standard solutions ofHT-2 toxin (HT-2) in PBS-A solution ([Anti-HT2] = 8 μg/mL; [HT2-FL1a] obtained after dilution 1:3000 (v/v) ofthe stock solution). Figure S3: Normalized calibration curve of the selected FPIA obtained with mixed standardsolutions of T-2 glucoside (T-2G) in PBS-A solution ([Anti-HT2] = 8 μg/mL; [HT2-FL1a] obtained after dilution1:3000 (v/v) of the stock solution). Figure S4: Normalized calibration curve of the selected FPIA obtained withmixed standard solutions of HT-2 glucoside (HT-2G) toxin in PBS-A solution ([Anti-HT2] = 8 μg/mL; [HT2-FL1a]obtained after dilution 1:3000 (v/v) of the stock solution). Figure S5: Calibration curves (concentration rangefrom 0.3 to 9.1 ng/mL) obtained with mixed standard solutions of T-2, HT-2, T2-glucoside and HT2-glucoside(expressed as sum, ratio 1:1:0.5:0.5) (black square) and spiked diluted extracts of wheat, obtained using Protocol A(a) and Protocol B (b), by analyzing 5 mg (multiplication sign), 10 mg (white triangle) and 20 mg (black circle) ofmatrix equivalent.
Author Contributions: Conceptualization, V.L., C.M.M., A.F.L. and M.P.; Formal analysis, A.C.R.P., E.M., B.C. andV.M.T.L.; Methodology, V.L., A.C.R.P., E.M., C.M.M., S.M., P.L. and M.P.; Supervision, M.P.; Validation, V.M.T.L.;and A.D.G.; Writing—original draft, V.L.; Writing—review & editing, V.L.; V.M.T.L.; A.D.G.; C.M.M., S.M., P.L.,A.F.L. and M.P.
Funding: This work has been supported by the MYCOKEY project “Integrated and innovative key actions formycotoxin management in the food and feed chain” (H2020-Grant Agreement No. 678781).
Conflicts of Interest: All authors declare no conflict of interest.
Disclaimer: Mention of trade names or commercial products in this publication is solely for the purpose ofproviding specific information and does not imply recommendation or endorsement by the U.S. Department ofAgriculture. USDA is an equal opportunity provider and employer.
References
1. Canady, R.A.; Coker, R.D.; Egan, S.K.; Krska, R.; Olsen, M.; Resnik, S.; Schlatter, J. T-2 and HT-2 toxins.In Safety Evaluation of Certain Mycotoxins in Food; WHO/FAO, Ed.; WHO Food Additives Series 47, FAOFood and Nutrition Paper 74; WHO: Geneva, Switzerland, 2001; pp. 557–638. Available online: http://www.fao.org/3/a-bc528e.pdf (accessed on 24 April 2019).
67
Toxins 2019, 11, 380
2. Schothorst, R.C.; van Egmond, H.P. Report from SCOOP task 3.2.10 “Collection of occurrence data ofFusarium toxins in food assessment of dietary intake by the population of EU member states” subtask:Trichothecenes. Toxicol. Lett. 2004, 153, 133–153. [CrossRef] [PubMed]
3. European Food Safety Authority (EFSA). Scientific opinion on the risks for animal and public health relatedto the presence of T-2 and HT-2 toxin in food and feed. EFSA J. 2011, 9, 2481. [CrossRef]
4. European Food Safety Authority (EFSA). Human and animal dietary exposure to T-2 and HT-2 toxin. EFSAJ. 2017, 15, 4972.
5. Pettersson, H. Toxicity and risks with T-2 and HT-2 toxins in cereals. Plant Breed. Seed Sci. 2011, 64, 65–74.[CrossRef]
6. European Commission (EC). Commission recommendation of 27 March 2013 on the presence of T-2 andHT-2 toxin in cereals and cereal products (2013/165/EU). Off. J. Eur. Union 2013, 91, 12–15.
7. European Food Safety Authority (EFSA). Appropriateness to set a group health based guidance value for T2and HT2 toxin and its modified forms. EFSA J. 2017, 15, 4655.
8. Lattanzio, V.M.T.; Visconti, A.; Haidukowski, M.; Pascale, M. Identification and characterization of newFusarium masked mycotoxins, T2 and HT2 glycosyl derivatives, in naturally contaminated wheat andoats by liquid chromatography-high-resolution mass spectrometry. J. Mass Spectrom. 2012, 47, 466–475.[CrossRef] [PubMed]
9. Veprikova, Z.; Vaclavikova, M.; Lacina, O.; Dzuman, Z.; Zachariasova, M.; Hajslova, J. Occurrence of mono-and di-glycosylated conjugates of T-2 and HT-2 toxins in naturally contaminated cereals. World Mycotoxin J.2012, 5, 231–240. [CrossRef]
10. Nakagawa, H.; Sakamoto, S.; Sago, Y.; Kushiro, M.; Nagashima, H. The use of LC-Orbitrap MS for thedetection of Fusarium masked mycotoxins: The case of type A trichothecenes. World Mycotoxin J. 2012, 5,271–280. [CrossRef]
11. Lattanzio, V.M.T.; Ciasca, B.; Terzi, V.; Ghizzoni, R.; McCormick, S.P.; Pascale, M. Study of the naturaloccurrence of T-2 and HT-2 toxins and their glucosyl derivatives from field barley to malt by high resolutionOrbitrap mass spectrometry. Food Addit. Contam. Part A 2015, 32, 1647–1655. [CrossRef]
12. Bryla, M.; Waskiewicz, A.; Ksieniewicz-Wozniak, E.; Szymczyk, K.; Jedrzejczak, R. Modified Fusariummycotoxins in cereals and their products-metabolism, occurrence, and toxicity: An updated review. Molecules2018, 23, 963. [CrossRef] [PubMed]
13. Meneely, J.P.; Ricci, F.; van Egmond, H.P.; Elliott, C.T. Current methods of analysis for the determination oftrichothecene mycotoxins in food. TrAC Trends Anal. Chem. 2011, 30, 192–203. [CrossRef]
14. Pascale, M.; Panzarini, G.; Visconti, A. Determination of HT-2 and T-2 toxins in oats and wheat byultra-performance liquid chromatography with photodiode array detection. Talanta 2012, 89, 231–236.[CrossRef] [PubMed]
15. Krska, R.; Malachova, A.; Berthiller, F.; Van Egmond, H.P. Determination of T-2 and HT-2 toxins in food andfeed: An update. World Mycotoxin J. 2014, 7, 131–142. [CrossRef]
16. Nathanail, A.V.; Syvähuoko, J.; Malachová, A.; Jestoi, M.; Varga, E.; Michlmayr, H.; Adam, G.; Sieviläinen, E.;Berthiller, F.; Peltonen, K. Simultaneous determination of major type A and B trichothecenes, zearalenoneand certain modified metabolites in Finnish cereal grains with a novel liquid chromatography-tandem massspectrometric method. Anal. Bioanal. Chem. 2015, 407, 4745–4755. [CrossRef]
17. Leslie, J.F.; Lattanzio, V.; Audenaert, K.; Battilani, P.; Cary, J.; Chulze, S.N.; De Saeger, S.; Gerardino, A.;Karlovsky, P.; Liao, Y.-C.; et al. Mycokey round table discussions on future directions in research on chemicaldetection methods, genetics and biodiversity of mycotoxins. Toxins 2018, 10, 109. [CrossRef] [PubMed]
18. Peng, D.; Chang, F.; Wang, Y.; Chen, D.; Liu, Z.; Zhou, X.; Feng, L.; Yuan, Z. Development of a sensitivemonoclonal-based enzyme-linkedimmunosorbentassay for monitoring T-2 toxin in food and feed. FoodAddit. Contam. A 2016, 33, 683–692. [CrossRef]
19. Li, Y.; Luo, X.; Yang, S.; Cao, X.; Wang, Z.; Shi, W.; Zhang, S. High specific monoclonal antibody productionand development of an ELISA method for monitoring T-2 toxin in rice. J. Agric. Food Chem. 2014, 62,1492–1497. [CrossRef]
20. Wang, J.; Duan, S.; Zhang, Y.; Wang, S. Enzyme-linked immunosorbent assay for the determination of T-2toxin in cereals and feedstuff. Microchim. Acta 2010, 169, 137–144. [CrossRef]
68

Toxins 2019, 11, 380
21. Yoshizawa, T.; Kohno, H.; Ikeda, K.; Shinoda, T.; Yokohama, H.; Morita, K.; Kusada, O.; Kobayashi, Y. Apractical method for measuring deoxynivalenol, nivalenol, and T-2+HT-2 toxin in foods by an enzyme-linkedimmunosorbent assay using monoclonal antibodies. Biosci. Biotechnol. Biochem. 2004, 68, 2076–2085.[CrossRef]
22. Molinelli, A.; Grossalber, K.; Führer, M.; Baumgartner, S.; Sulyok, M.; Krska, R. Development of qualitativeand semiquantitative immunoassay-based rapid strip tests for the detection of T-2 toxin in wheat and oat. J.Agric. Food Chem. 2008, 56, 2589–2594. [CrossRef] [PubMed]
23. Lippolis, V.; Pascale, M.; Valenzano, S.; Pluchinotta, V.; Baumgartner, S.; Krska, R.; Visconti, A. A rapidfluorescence polarization immunoassay for the determination of T-2 and HT-2 toxins in wheat. Anal. Bioanal.Chem. 2011, 401, 2561–2571. [CrossRef] [PubMed]
24. Porricelli, A.C.R.; Lippolis, L.; Valenzano, S.; Cortese, M.; Suman, M.; Zanardi, S.; Pascale, M. Optimizationand validation of a fluorescence polarization immunoassay for rapid detection of T-2 and HT-2 toxins incereals and cereal-based products. Food Anal. Methods 2016, 9, 3310–3318. [CrossRef]
25. Meneely, J.P.; Sulyok, M.; Baumgartner, S.; Krska, R.; Elliott, C.T. A rapid optical immunoassay for thescreening of T-2 and HT-2 toxin in cereals and maize-based baby food. Talanta 2010, 81, 630–636. [CrossRef][PubMed]
26. Wang, Y.; Liu, N.; Ning, B.; Liu, M.; Lv, Z.; Sun, Z.; Peng, Y.; Chen, C.; Li, J.; Gao, Z. Simultaneous and rapiddetection of six different mycotoxins using an immunochip. Biosens. Bioelectron. 2012, 34, 44–50. [CrossRef][PubMed]
27. Khan, I.M.; Zhao, S.; Niazi, S.; Mohsin, A.; Shoaib, M.; Duan, N.; Wu, S.; Wang, Z. Silver nanoclusters basedFRET aptasensor for sensitive and selective fluorescent detection of T-2 toxin. Sensor. Actuators B Chem. 2018,277, 328–335. [CrossRef]
28. Zhang, M.; Wang, Y.; Yuan, S.; Sun, X.; Huo, B.; Bai, J.; Peng, Y.; Ning, B.; Liu, B.; Gao, Z. Competitivefluorometric assay for the food toxin T-2 by using DNA-modified silver nanoclusters, aptamer-modifiedmagnetic beads, and exponential isothermal amplification. Microchim. Acta 2019, 186, 219. [CrossRef]
29. Maragos, C.M.; Kurtzman, C.; Busman, M.; Price, N.; McCormick, S. Development and evaluation ofmonoclonal antibodies for the Glucoside of T-2 Toxin (T2-Glc). Toxins 2013, 5, 1299–1313. [CrossRef][PubMed]
30. Lippolis, V.; Maragos, C. Fluorescence polarization immunoassays for rapid, accurate and sensitivedetermination of mycotoxins. World Mycotoxin J. 2014, 7, 479–489. [CrossRef]
31. Zhang, H.; Yang, S.; De Ruyck, K.; Beloglazova, N.; Eremin, S.A.; De Saeger, S.; Zhang, S.; Shen, J.; Wang, Z.Fluorescence polarization assays for chemical contaminants in food and environmental analyses. TrACTrends Anal. Chem. 2019, 114, 293–313. [CrossRef]
32. Lippolis, V.; Porricelli, A.C.R.; Cortese, M.; Suman, M.; Zanardi, S.; Pascale, M. Determination of ochratoxinA in Rye and Rye-Based products by Fluorescence polarization immunoassay. Toxins 2017, 9, 305. [CrossRef][PubMed]
33. European Commission (EC). Commission Regulation (EU) 519/2014 of 16 May 2014 amending Regulation(EC) No 401/2006 as regards methods of sampling of large lots, spices and food supplements, performancecriteria for T-2, HT-2 toxin and citrinin and screening methods of analysis. Off. J. Eur. Union 2014, 147, 29–43.
34. Lattanzio, V.M.T.; Solfrizzo, M.; Visconti, A. Enzymatic hydrolysis of T-2 toxin for the quantitativedetermination of total T-2 and HT-2 toxins in cereals. Anal. Bioanal. Chem. 2009, 395, 1325–1334.[CrossRef] [PubMed]
35. Zhang, Z.; Wang, D.; Li, J.; Zhang, Q.; Li, P. Monoclonal antibody–europium conjugate-based lateral flowtime-resolved fluoroimmunoassay for quantitative determination of T-2 toxin in cereals and feed. Anal.Methods 2015, 7, 2822–2829. [CrossRef]
36. McCormick, S.P.; Price, N.P.J.; Kurtzman, C.P. Glucosylation and other biotransformations of T-2 toxin byyeasts of the Trichomonascus Clade. Appl. Environ. Microbiol. 2012, 78, 8694–8702. [CrossRef] [PubMed]
37. Soliani, L. Statistica applicata per la ricerca e professioni scientifiche. In Manuale di Statistica Univariata eBivariata Parametrica e Non-Parametrica; Uninova-Gruppo Pegaso: Parma, Italy, 2007.
© 2019 by the authors. Licensee MDPI, Basel, Switzerland. This article is an open accessarticle distributed under the terms and conditions of the Creative Commons Attribution(CC BY) license (http://creativecommons.org/licenses/by/4.0/).
69


toxins
Article
Emerging Fusarium Mycotoxins Fusaproliferin,Beauvericin, Enniatins, and Moniliformin inSerbian Maize
Igor Jajic 1, Tatjana Dudaš 1,*, Saša Krstovic 1, Rudolf Krska 2,3, Michael Sulyok 2, Ferenc Bagi 1,
Zagorka Savic 1, Darko Guljaš 1 and Aleksandra Stankov 1
1 Faculty of Agriculture, University of Novi Sad, 21000 Novi Sad, Serbia; [email protected] (I.J.);[email protected] (S.K.); [email protected] (F.B.); [email protected] (Z.S.);[email protected] (D.G.); [email protected] (A.S.)
2 Institute of Bioanalytics and Agro-Metabolomics, Department IFA-Tulln, University of Natural Resourcesand Life Sciences Vienna (BOKU), A-3430 Tulln, Austria; [email protected] (R.K.);[email protected] (M.S.)
3 Institute for Global Food Security, School of Biological Sciences, Queens University Belfast, University Road,Belfast BT7 1NN, UK
* Correspondence: [email protected]; Tel.: +381-655-237-432-54
Received: 30 March 2019; Accepted: 17 June 2019; Published: 19 June 2019
Abstract: Emerging mycotoxins such as moniliformin (MON), enniatins (ENs), beauvericin (BEA),and fusaproliferin (FUS) may contaminate maize and negatively influence the yield and qualityof grain. The aim of this study was to determine the content of emerging Fusarium mycotoxinsin Serbian maize from the 2016, 2017, and 2018 harvests. A total of 190 samples from commercialmaize production operations in Serbia were analyzed for the presence of MON, ENs, BEA, andFUS using liquid chromatography-tandem mass spectrometry (LC-MS/MS). The obtained resultswere interpreted together with weather data from each year. MON, BEA, and FUS were majorcontaminants, while other emerging mycotoxins were not detected or were found in fewer samples(<20%). Overall contamination was highest in 2016 when MON and BEA were found in 50–80% ofsamples. In 2017 and 2018, high levels of MON, FUS, and BEA were detected in regions with highprecipitation and warm weather during the silking phase of maize (July and the beginning of August),when the plants are most susceptible to Fusarium infections. Since environmental conditions in Serbiaare favorable for the occurrence of mycotoxigenic fungi, monitoring Fusarium toxins is essential forthe production of safe food and feed.
Keywords: emerging mycotoxins; Fusarium; LC-MS/MS; maize; Serbia
Key Contribution: Up to present, little effort has been put forth in terms of quality control regardingemerging mycotoxins in Serbian maize. This article gives the first insight into the current situation ofemerging mycotoxin contaminations in Serbian maize and recommends further monitoring studiesnecessary for legislative purposes since climate conditions are favorable for the development ofmycotoxin-producing fungi that pose a threat to food and food quality.
1. Introduction
Mycotoxins have become one of the most important food contaminants in modern society.They are toxic secondary metabolites that are usually produced by Aspergillus, Penicillium, andFusarium fungi in favorable environmental conditions. Among these species, Fusarium are the mostprevalent mycotoxin-producing fungi in the northern temperate regions, and mainly Central andSoutheasternEurope [1]. Fusarium molds are known as producers of several mycotoxins, including
Toxins 2019, 11, 357; doi:10.3390/toxins11060357 www.mdpi.com/journal/toxins71

Toxins 2019, 11, 357
both “traditional” as trichothecenes, zearalenone, and the fumonisins [2] and “emerging toxins” asmoniliformin (MON), enniatins (ENs), beauvericin (BEA), and fusaproliferin (FUS) [3]. Additionally,Kovalsky et al. [3] found a co-occurrence of “traditional” toxins with EN, MON, and BEA. The mainproducers of emerging Fusarium mycotoxins in cereals are Fusarium avenacum, Fusarium verticillioides(moniliforme), Fusarium proliferatum, and Fusarium subglutinans [1].
MON is a sodium or potassium salt of 1-hydroxycyclobut-1-ene-3,4-dione [4]. It was discoveredby Cole et al. [5] while screening for toxigenic products of F. verticillioides isolated from southern leafblight-damaged maize seed. BEA and ENs belong to a group of cyclodepsipeptidesthat may haveantibiotic, insecticidal, and cytotoxic effects [6–9]. FUS is a toxic sesterterpene originally isolated byRitieni et al. [10] from F. proliferatum in autoclaved maize cultures.
BEA is known as a cholesterol acyltransferase inhibitor [11] and it is toxic to several humancell lines [12,13]. Additionally, BEA can induce apoptosis and DNA fragmentation [14]. FUS is asesterterpene identified from maize cultures of F. proliferatum isolated from maize [15]. FUS is toxic toArtemiasalina, to the lepidopteran cell line SF-9 and to the human nonneoplastic B-lymphocyte cell lineIARC/LCL 171 [16]. FUS can induce teratogenic effects in chicken embryos [17]. Kriek et al. [18] foundthat ducklings and rats fed diets containing MON led to muscular weakness, respiratory distress,cyanosis, coma, and death.
There is limited data on the toxicity and occurrence of “emerging” mycotoxins. These mycotoxinsare neither routinely determined nor legislatively regulated. Their presence has been reported incereals from several countries [19–23]. In a recent EFSA report [24], an opinion on the presence of ENNsand BEA in food and feed was made, but the lack of relevant toxicity data did not a risk assessment.Currently, maximum levels for emerging Fusarium mycotoxins are not been regulated.
Maize is one of the most susceptible cereals to the presence of Fusarium molds. Infection of maizemay lead to grain size and protein decreasing as well as harming germination. The final result is adecrease in yield and feed quality. Additionally, a consequential mycotoxin production is anotherhighly problematic outcome of Fusarium infection.
In Serbia, arable land covers approximately 75.5% of utilized agricultural land. In the structureof sown arable land areas, cereals comprised 67.9%, industrial crops comprised 15.7%, vegetablescomprised 2.6%, and fodder crops comprised 9.1% in 2016 [25]. However, cereals were grown on1,763,575 ha in 2016, which is lower compared to 2015 (1,782,010 ha), and 2014 (1,819,188 ha). In 2016,maize was harvested from 1,010,097 ha, with a total production of 73,767,371 t. The average yield in2016 was 7.3 t/ha, which was higher than in 2015 (5.4 t/ha), and slightly lower in comparison with 2014(7.5 t/ha) [25]. When compared to 2016, the total production of maize decreased by 45.5% in 2017,while the average yield was only 4.0 t/ha [26]. In 2018, expected production of maize was 6,965,000 t,which was 73.3% higher than in 2017, with an average yield ofapproximately 7.6 t/ha [27]. High maizeproduction in 2018 positioned Serbia among the top ten maize exporters [28] and among the top twentymaize producers in the world [29].
In considering these facts, the aim of this study was to determine the current state of the levelof emerging Fusarium mycotoxins in Serbian maize. Additionally, an effort was made to relate theobtained results with the weather conditions recorded during the trial period.
2. Results
2.1. Occurrence of Emerging Toxins in Maize Samples
Maize samples collected during the 2016 harvest were analyzed and the results are shown inTable 1. MON and BEA had the highest presence among emerging mycotoxins (>80%), except in theWest-Backa region (50%). Other emerging mycotoxins were not detected at all or were found in fewersamples (<20%). Overall, maize samples from the Middle-Banat region were the most contaminatedforall investigated emerging mycotoxins. MON, BEA, and FUS were present in all regions. Mean levelsof MON ranged from 189.97 μg/kg (West-Backa) to 920.10 μg/kg (Srem). BEA mean levels were
72

Toxins 2019, 11, 357
between 6.82 μg/kg (West-Backa) and 34.79 μg/kg (Srem). FUS levels were the highest among all testedmycotoxins. They ranged from 328.50 μg/kg in South-Backa to 12,272.00 μg/kg in a sample from theWest-Backa region. ENs were found in all regions except Srem, with the highest mean levels in samplesoriginating from Middle-Banat.
Table 1. Occurrence of emerging toxins in maize samples collected in the Republic of Serbia in 2016.
MON BEA EN A EN A1 EN B EN B1 FUS
South-Banat regionAverage ± SD (μg/kg) 237 ± 230 18.7 ± 30.3 - 0.59 7.55 4.86 328 ± 268
Range (μg/kg) 5.06–850 0.41–129 - - - - 85.4–1121Samples 21 21 21 21 21 21 21
Positive samples (%) 21 (100.0) 20 (95.2) 0 1 (4.8) 1 (4.8) 1 (4.8) 16 (76.2)
South-Backa regionAverage ± SD (μg/kg) 534 ± 410 13.7 ± 26.7 0.25 ± 0.19 0.24 ± 0.18 - - 827 ± 1032
Range (μg/kg) 15.3–1450 0.10–111 0.12–0.47 0.13–0.44 - - 91.3–4687Samples 29 29 29 29 29 29 29
Positive samples (%) 26 (89.7) 26 (89.7) 3 (10.3) 3 (10.3) 0 0 22 (75.9)
Middle-Banat regionAverage ± SD (μg/kg) 576 ± 391 7.06 ± 14.4 8.78 ± 11.8 9.30 ± 15.7 0.80 ± 1.01 8.27 ± 11.4 1018 ± 396
Range (μg/kg) 7.18–1228 0.23–49.7 0.41–17.1 0.11–27.4 0.08–1.52 0.20–16.3 450–1738Samples 12 12 12 12 12 12 12
Positive samples (%) 12 (100.0) 11 (91.7) 2 (16.7) 3 (25.0) 2 (16.7) 2 (16.7) 11 (91.7)
Srem regionAverage ± SD (μg/kg) 920 ± 1649 34.8 ± 67.8 - - - - 1736 ± 2384
Range (μg/kg) 3.03–3856 0.27–136 - - - - 312–4488Samples 5 5 5 5 5 5 5
Positive samples (%) 5 (100.0) 4 (80.0) 0 0 0 0 3 (60.0)
West-Backa regionAverage ± SD (μg/kg) 190 ± 192 6.82 ± 9.90 0.49 0.53 - 0.22 12272
Range (μg/kg) 34.8–405 0.03–18.2 - - - - -Samples 6 6 6 6 6 6 6
Positive samples (%) 3 (50.0) 3 (50.0) 1 (16.7) 1 (16.7) 0 1 (16.7) 1 (16.7)
The results of maize samples collected during 2017 are summarized in Table 2. ENs were not foundin any of the four regions. MON, BEA, and FUS were found in all regions, except for FUS, which was notfoundin the sample from North-Backa. All the samples from the South-Banat region were contaminatedwith MON and BEA. The highest mean levels of MON (499.00 μg/kg) and FUS (3415.88 μg/kg) wererecorded in the West-Backa region, while the highest mean level of BEA (12.26 μg/kg) was recorded inthe South-Banat region.
Table 2. Occurrence of emerging toxins in maize samples collected in the Republic of Serbia in 2017.
MON BEA EN A EN A1 EN B EN B1 FUS
South-Banat regionAverage ± SD (μg/kg) 404 ± 493 12.3 ± 18.9 - - - - 353 ± 414
Range (μg/kg) 10.4–1803 0.22–67.4 - - - - 63.1–1275Samples 17 17 17 17 17 17 17
Positive samples (%) 17 (100.0) 17 (100.0) 0 0 0 0 10 (58.8)
South-Backa regionAverage ± SD (μg/kg) 179 ± 255 6.30 ± 16.4 - - - - 468 ± 843
Range (μg/kg) 2.68–1071 0.04–75.9 - - - - 45.5–3018Samples 33 33 33 33 33 33 33
Positive samples (%) 20 (60.6) 21 (63.6) 0 0 0 0 12 (36.4)
West-Backa regionAverage ± SD (μg/kg) 499 ± 880 1.96 ± 3.88 - - - - 3416 ± 9786
Range (μg/kg) 1.66–2999 0.06–13.4 - - - - 40.6–29512Samples 21 21 21 21 21 21 21
Positive samples (%) 12 (57.1) 11 (52.4) 0 0 0 0 9 (42.9)
73

Toxins 2019, 11, 357
Table 2. Cont.
MON BEA EN A EN A1 EN B EN B1 FUS
North-Backa regionAverage ± SD (μg/kg) 221 18.3 - - - - -
Range (μg/kg) - - - - - - -Samples 1 1 1 1 1 1 1
Positive samples (%) 1 (100.0) 1 (100.0) 0 0 0 0 0
In 2018, MON was found in all three regions (South-Backa, North-Backa, and South-Banat), BEAand FUS were not found in samples from the South-Banat region and ENs were not present in anysample (Table 3). The mean levels of all tested mycotoxins were highest in the South-Backa region(MON 199.32 μg/kg, BEA 4.89 μg/kg and FUS 5793.79 μg/kg).
Table 3. Occurrence of emerging toxins in maize samples collected in the Republic of Serbia in 2018.
MON BEA EN A EN A1 EN B EN B1 FUS
South-Banat regionAverage ± SD (μg/kg) 39.5 ± 44.6 - - - - - -
Range (μg/kg) 5.19–89.9 - - - - - -Samples 6 6 6 17 6 6 6
Positive samples (%) 3 (50.0) 0 0 0 0 0 0
South-Backa regionAverage ± SD (μg/kg) 199 ± 238 4.89 ± 6.91 - - - - 5794 ± 14,479
xRange (μg/kg) 5.80–857 0.15–21.5 - - - - 63.2–38,610Samples 34 34 34 34 34 34 34
Positive samples (%) 16 (47.1) 9 (26.5) 0 0 0 0 7 (20.6)
North-Backa regionAverage ± SD (μg/kg) 34.4 ± 36.9 3.33 - - - - 72.4
Range (μg/kg) 55.82–88.7 - - - - - -Samples 5 5 5 5 5 5 5
Positive samples (%) 4 (80.0) 1 (20.0) 0 0 0 0 1 (20.0)
2.2. Climate Conditions
Reports from the Republic Hydrometeorological Service of Serbia [30] showed that the vegetationperiod of 2016 (April–September) in the territory of Serbia was warmer with somewhat higherprecipitation than the long-term average. The deviation of mean daily temperatures during thevegetation period showed positive values (0.8 ◦C to 1.6 ◦C). The standardized precipitation index(SPI-3), determined for the summer period from 1 June to 31 August, showed normal humidityconditions for most of the territory of Vojvodina. However, in some parts of Vojvodina, moderateto extremely humid conditions were recorded (Figure 1B). Such conditions were registered in theMiddle-Banat and West-Backa regions, and some parts of the South-Backa and South-Banat regions.In some production areas, strong winds and hail storms were recorded and certainly contributed to thedamage of the grains and the occurrence of fungi on crops. The moisture in deeper soil layers in themiddle of June was significantly reduced in Vojvodina as a result of a weaker inflow of precipitation inthese areas.
If the weather conditions were observed in more detail, warm but unstable weather prevailedduring the transition from May to June, and the agrometeorological conditions allowed the intensivedevelopment of maize. The trend of variable but warm weather continued in June. In the middle ofthe month, due to the influx of very hot air, the temperatures were considerably above the averagefor this period of the year. Maximum daily temperatures reached 36 ◦C on some days [30]. Thermalconditions were favorable for the intensive development of spring agricultural crops. By the end of thefirst decade of August, the weather was mostly dry and stable, but since the beginning of the seconddecade of August, the air temperatures moved around and were below average values. Maximum airtemperatures were up to 28 ◦C, while the minimum morning temperatures were significantly belowthe average values for this time of the year [30]. Significant precipitation, mostly rain showers, was
74

Toxins 2019, 11, 357
recorded on the territory of the entire country. During July and August, 2 to 3 times more rain wasregistered in the territory of Serbia compared to the average quantities.
Figure 1. Regions of sample origin: 1—West-Backa, 2—South-Backa, 3—Srem, 4—Middle-Banat,5—South-Banat, 6—North-Backa. (A) Humidity conditions in Serbia based on the StandardizedPrecipitation Index (SPI-3) determined for the summer period from 1 June to 31 August in 2016(B) Reproduced from Agrometeorološki uslovi u proizvodnoj 2015/2016 godini, 2017, RepublicHydrometeorological Service of Serbia [30], 2017 (C) Reproduced from Agrometeorološki usloviu proizvodnoj 2016/2017 godini, 2018, Republic Hydrometeorological Service of Serbia [31], and2018 (D) Reproduced from Agrometeorološki uslovi u proizvodnoj 2017/2018, 2019, RepublicHydrometeorological Service of Serbia [32].
Detailed data on precipitation and temperature obtained from Metos®automatic weather stations(Metos®, Pessl Instruments, Weiz, Austria) in the observed regions in 2016 were compared to themultiannual average for 1981–2010 [33].Precipitation data (Figure 2) show that the Middle-Banatregion, which overall was the most contaminated with emerging Fusarium toxins, and Srem, whichshowed the highest values of toxins, had precipitation values higher than the average in June, but theywere noticeably lower in July. Average daily air temperature data (Figure 2) show that the temperaturewas around or slightly above the long-term average until August, when the temperature decreased.Average daily air temperatures were similar in all regions.
Reports from the Republic Hydrometeorological Service of Serbia [31] showed that the vegetationperiod of 2017 (April–September) was warmer and dryer than the multiannual average. The meandaily temperatures were 0.9–1.7 ◦C higher than the average, while precipitation was 20% lower thanthe average. SPI-3 showed extreme drought in the South-Banat region, while other observed regionswere affected by high to moderate drought (Figure 1C).
The vegetation period started with unusually cold weather in April, but the weather conditionsquickly normalized and became optimal for plant development during May [31]. During June, meandaily temperatures were higher than the average [31]. Maximum daily temperatures reached over 35◦C on some days, especially during the first and the last decade of the month. Hot weather continuedduring July. In most regions, precipitation was below the multiannual average, especially in the
75

Toxins 2019, 11, 357
South-Banat region, where it was 50% lower than the average. The temperatures at the beginning ofAugust were extremely high (38–42 ◦C) and higher than the average during the whole month [31].Most regions were affected with drought, except the South-Banat region, which had 50% more rainfallthan the average.
Figure 2. Deviation of total rainfall amount (columns) and average daily air temperature (lines) fromthe multiannual average (1981–2010) in 2016.
Precipitation and average daily air temperature data obtained from Metos®automatic weatherstations (Metos®, Pessl Instruments, Weiz, Austria) in the observed regions during 2017 were comparedto the multiannual average from 1981–2010 [33]. Precipitation data (Figure 3) showed that all regionshad lower precipitation than the average during June. This trend continued through July for allregions except West-Backa, where high occurrences of MON and FUS were observed. The deviationof average daily air temperature (Figure 3) shows that temperature in April was lower than themultiannualaverage in all regions. During May, it was slightly above the multiannualaverage inall regions except South-Banat. In June the temperature was 1.4–2.4 ◦C higher than the average.Temperatures continued to be above the average until September.
Figure 3. Deviation of total rainfall amount (columns) and average daily air temperature (lines) frommultiannual average (1981–2010) in 2017.
76

Toxins 2019, 11, 357
According to reports from the Republic Hydrometeorological Service of Serbia [32], the vegetationperiod in 2018 (April–September) was 1.8–2.6 ◦C warmer than the multiannual average. SPI-3 showednormal to moderately humid weather conditions in all observed regions (Figure 1D).
The vegetation period started with unusually warm weather in April when the mean dailytemperature was 4–5 ◦C above the multiannualaverage [32]. During May, weather conditions wereoptimal for plant growth. In the beginning of June, maximum daily temperatures were high (28–34 ◦C),but temperature decreased in the last decade of the month when maximum daily temperatures were inthe range from 19 ◦C to 24 ◦C [32]. Frequent rain showers were recorded during June and continuedthrough July. Warm weather with temperatures above multiannualaverage continued through Augustand September [32].
The deviation of precipitation and average daily air temperature data collected fromMetos®automatic weather stations (Metos®, Pessl Instruments, Weiz, Austria) during 2018 fromthe multiannual average of 1981–2010 [33] was observed. Precipitation data (Figure 4) showed thatprecipitation was below average during the whole vegetation period in the North-Backa region.Precipitation was lower than the average in all three regions in April, May, August, and September.In June, precipitation was above average in the South-Backa and South-Banat regions. South-Backawas the only region where high precipitation continued in July.Average daily air temperature data(Figure 4) show that the temperature was above the long-term average in all regions during April andMay. Temperature decreased during June and in July, reaching the multiannualaverage value in theSouth-Backa region, while the North-Backa and South-Banat regionswere below average. In Augustand September, the temperature increased again above the multiannual average in all observed regions.
Figure 4. Deviation of total rainfall amount (columns) and average daily air temperature (lines) fromthe multiannual average (1981–2010) in 2018.
2.3. Statistical Analysis
The Kruskal–Wallis test (95% confidence level) found significant differences in MON levelsderiving from different years and different regions. Additionally, MON levels significantly differedwhen compared in terms of average seasonal temperature and precipitation. For FUS, significantdifferences were found between years, average seasonal temperatures and precipitation, but notbetween regions. Statistically significant differences in BEA levels were found between years andregions. Furthermore, the Spearman correlation determined a slightly moderate negative linear
77

Toxins 2019, 11, 357
correlation between average seasonal temperatures and mycotoxin contamination levels (r = −0.41for MON, r = −0.5 for BEA, and r = −0.45 for FUS). For monthly weather data, only temperaturesin May showed a moderate negative linear correlation (r = −0.5 for MON, r = −0.58 for BEA, andr = −0.48 for FUS), while precipitation in May showed a moderate positive linear correlation withcontamination levels of observed mycotoxins (r = 0.51 for MON, r = 0.59 for BEA, and r = 0.49 for FUS).Stepwise regression showed (with 95% confidence level) that air temperatures from May to Augusthad statistically significant differences in MON levels. For FUS, temperatures and precipitation in anymonth, as well as average values for the whole growing season, did not show statistically significantdifferences among contamination levels. May temperatures had a statistically significant differencein BEA levels. The adjusted R-squared values were between 0.101 and 0.2278 and showed that thesemodels cannot be used as prediction models; however, they gave insight about statistically significantvariables that influence mycotoxin contamination.
3. Discussion
Sutton [34] explained that for maize, Fusarium infection of the ear most frequently takes placethrough the tip of the ear when the fungi penetrate through the silk during maize flowering. Very humidweather during the period from silking to ripening enables ear contamination [35]. The ear is the mostsusceptible to contamination at the beginning of silking, while the susceptibility decreases with silkaging [36,37]. The silking period in the climatic region of Serbia takes place during July and the firsthalf of August.
According to the Republic Hydrometeorological Service of Serbia [30], most of the critical periodfor Fusarium infection of maize (July–August) in 2016 was characterized as dry and stable weather.However, since the beginning of the second decade of August, air temperatures ranged around andbelow average values [30]. Maximum air temperatures were up to a maximum of 28 ◦C, while theminimum morning temperatures were significantly below the average values for this time of theyear. However, moderate to extremely humid conditions occurred during the summer of 2016 in theMiddle-Banat and West-Backa regions and some parts of the South-Backa and South-Banat regions,which may have led to Fusarium fungi growth and the consequent production of mycotoxins. Moreover,cool, cloudy and humid weather during July and August did not favor agricultural crops and suchconditions probably caused plant stress and higher susceptibility to Fusarium infection.
In 2017, precipitation was lower than the multiannual average during summer months in allregions except South-Banat, where high levels of BEA were recorded. High precipitation in thesetwo regions during silking (July and beginning of August), when the maize is the most susceptible toFusarium infections were favorable for fungal development, may have led to high levels of emergingtoxins in samples from these regions.
High precipitation during June 2018 in the South-Backa and South-Banat regions and during July2018 in South-Backa resulted in South-Backa having the highest mean levels of MON, BEA, and FUS.Warm weather during July, together with high humidity in the South-Backa region enabled Fusariuminfection of the ears, which may be related to the high mycotoxin contamination of samples fromthis region.
Emerging fusariotoxins were mostly investigated in Mediterranean countries. Juan et al. [22]analyzed 93 samples of organic cereals and organic cereal products from several local markets in Italyfor the presence of different mycotoxins, including BEA, EN A, EN A1, EN B, EN B1. The authorsfound that levels of some emerging Fusarium mycotoxins ranged as follows: BEA 6.7–41 μg/kg, ENA 7.2–29.8 μg/kg, EN A1 5.3–64.3 μg/kg, EN B 5.5–102 μg/kg and EN B1 5.5–33.1 μg/kg. Amongthe commodities, the occurrence was the highest in wheat samples. Serrano et al. [21], investigatedfusariotoxins’ occurrence in the Mediterranean area. They found that BEA was present in 2 of 14maize samples and in 1 of 22 maize-based products. Obtained levels were 2.1 and 73.9 μg/kg formaize and 5.2 μg/kg for maize-based products, respectively. A high divergence among detected BEAlevels was also found in this study (0.03–136 μg/kg). Later, Serrano et al. compared levels of emerging
78

Toxins 2019, 11, 357
fusariotoxins between organic and conventional pasta in Spain [38]. They found that organic pastawas more contaminated than the conventional type. Contamination levels were 0.10–20.96 μg/kgfor BEA, and 0.05–8.02 μg/kg for FUS, while ENs levels were 0.25–979.56 μg/kg. Remarkably highlevels of emerging mycotoxins in raw cereals were found in Morocco by Zinedine et al. [39]. ENA1 was predominant among ENs with a presence in 39% of samples and levels ranging from 14 to445 mg/kg. BEA was found in 26.5% of samples, with levels ranging from 1 to 59 mg/kg, while FUSwas present in 7.8% of samples (levels from 0.6 to 2 mg/kg). Regarding maize samples, 42% containedENs with mean levels of 207 mg/kg (EN A1), 54 mg/kg (EN B), 8 mg/kg (EN B1), while EN A wasnot detected. A similar situation was observed in cereals from the Spanish market [40]. The authorsreported very a high presence of ENs (73.4%), wherein EN A1 was the most frequent with the highestlevels (33.36–814.42 mg/kg). BEA was found in 32.8% of samples in the range of 0.51–11.78 mg/kg, andFUS levels were between 1.01–6.63 mg/kg with the presence in 7.8% of samples. In maize samples, thepresence of ENs was 89%, BEA was found in 21% and FUS was in only one sample; on the other hand,ENs were found only during 2016 in this study, but not in any samples from 2017 and 2018, while BEAand FUS were detected every year. The highest mean level in maize was obtained for EN A1 of 813.01mg/kg, while in this survey the highest mean level of EN A1 was only 9.30 μg/kg. In another study inMorocco on maize-based breakfast cereals, Mahnine et al. [41] obtained mean levels of 113 mg/kg forEN A1 and 20.1 mg/kg for EN B1, respectively, while EN A, EN B, FUS, and BEA were below LOQ in allsamples. Tunisian cereals were highly contaminated as well. Maize-based cereals only contained ENA1 and ENB1 with mean levels of 113 mg/kg and 20.1 mg/kg. Oueslati et al. [20] obtained the presenceof ENs in 96% of samples, where once more EN A1 was predominant (92.1%). Mean values were thehighest in the case of EN A1 (up to 480 mg/kg). Only 3 samples of maize were analyzed. Two sampleswere positive, one with EN A1 (29.6 mg/kg) and another contained EN B1 (17.0 mg/kg). Notably, noneof these authors analyzed results along with the weather conditions. Emerging fusariotoxins were alsostudied in rice. In Morocco, considerable contamination with ENs and BEA was revealed, but not withFUS [19]. In rice samples from Iran, a significant presence was found only in the case of BEA (40%),but in very low amounts [23].
Emerging fusariotoxins were also studied in some non-Mediterranean European countries. Goertzet al. [42] investigated the contamination of different maize hybrids in Germany during 2006 and 2007.BEA was found in 52% of samples from 2006 and in 33% of samples from 2007. Mean levels were390 μg/kg and 240 μg/kg, respectively. MON was detected in 45% and 43% of samples, respectively,with mean values of 280 μg/kg and 110 μg/kg, respectively. Among EN, only EN B was investigated.Although its presence was relatively high (41% and 30%, respectively) the levels were the lowest (meanof 70 μg/kg and 160 μg/kg, respectively) among investigated emerging fusariotoxins. The authorsexplained that moderate temperatures and frequent precipitation recorded during early growth stagesin 2007 were favorable for Fusarium growth. This is in accordance with the results of correlationanalysis in this study, which showed a moderately negative correlation between May temperaturesand toxin contamination, together with a moderately positive correlation between May precipitationand toxin contamination. However, a higher mycotoxin presence and higher contamination levels inGermany were found in samples from 2006, which they associated with maize exposure to droughtstress in July and September 2006. In Norway, Uhlig et al. [43] investigated MON occurrence inNorwegian grain (oats, barley, and wheat) during a three-year period (2000–2002). MON was found in46% of samples and the obtained levels were between 43 and 950 μg/kg. The authors noted that thehighest prevalence of MON was found in the 2002 season (67%), along with the highest concentration.In Poland, Chelkowski et al. [44] detected ENs and BEA in 18 out of 27 maize samples (levels of0.8–46.0 mg/kg). Unfortunately, in both studies, the weather conditions were not discussed.
To the best of our knowledge, studies on emerging Fusarium toxins in Serbia have not beendone to date. On the other hand, some studies have occurred in surrounding countries. In Romania,Stanciu et al. [45] found that ENs were the most frequent (73%) mycotoxins in both wheat and wheatflour, while EN B was detected the most (71%). The highest observed concentration was 407 μg/kg in
79

Toxins 2019, 11, 357
wheat samples. Mean values were 19 μg/kg in wheat flour and 128 μg/kg in wheat. In neighboringCroatia, Jurjevic et al. [46] investigated BEA presence in 209 maize samples originating from the 1996and 1997 growing seasons. The authors found that 17.4% of samples from 1996 contained BEA at themean level of 393 μg/kg and maximum concentration of 1864 μg/kg. In samples from 1994, only one of104 samples contained BEA.
Based on the obtained results and available published data, the results from this study are inaccordance with those found in Croatia, Italy, and Germany, while results from Poland, Spain, Morocco,and Tunisia are one order of magnitude higher. Unfortunately, studies from Romania, Norway, andIran did not include maize or maize-based products and therefore a valid comparison cannot be made.
4. Conclusions
The main source of emerging Fusarium mycotoxins are cereals that are used in food and feedproduction, and they may thus pose a potential risk for human and animal health. Since environmentalconditions in Serbia are favorable for the occurrence of mycotoxigenic fungi, monitoring of “traditional”but also “emerging” Fusarium toxins is essential for producing safe food and feed. The results indicatedthat most attention should be paid to fusaproliferin (FUS) and moniliformin (MON). Additionally,monitoring studies for emerging Fusarium mycotoxins are necessary for legislative purposes, becausein the near future appropriate maximum contamination levels should be set for several mycotoxins byrelevant authorities [38].
5. Materials and Methods
5.1. Samples
In total, 190 representative samples from commercial fields in Serbia were analyzed. Sampleswere collected during harvest in the northern Serbian province of Vojvodina, which is the country’smost important agricultural area, over three years: 73 samples from 28 localities in 2016, 72 samplesfrom 12 localities in 2017 and 45 samples from 13 localities in 2018. Localities were clustered based ontheir administrative area into 6 regions: West-Backa, South-Backa, Srem, Middle-Banat, South-Banat,and North-Backa (Figure 1A).
Each sample was transported to the laboratory immediately after sampling and stored in a freezerat −20 ◦C until analysis. Prior to analysis, the samples were allowed to reach room temperature.All samples were milled on a laboratory mill so that >93% passed through a sieve with a pore diameterof 0.8 mm and a portion was taken for analysis.
5.2. Extraction and Mycotoxin Analysis in Maize Samples
Five grams of each milled sample were extracted using a 20 mL extraction solvent(acetonitrile–water–acetic acid (VWR, Vienna, Austria), 79:20:1, v/v/v) followed by a 1 + 1 dilutionusing acetonitrile–water–acetic acid (VWR, Vienna, Austria) (20:79:1, v/v/v) and a direct injection of5 μL diluted extract.
Liquid chromatography-tandem mass spectrometry (LC-MS/MS) screening of target fungalmetabolites was performed at theInstitute of Bioanalytics and Agro-Metabolomics, Department ofAgrobiotechnology (IFA-Tulln), University of Natural Resources and Life Sciences, Vienna, with a QTrap5500 LC-MS/MS System (Applied Biosystems, Foster City, CA, USA) equipped with a TurboIon Sprayelectrospray ionization (ESI) source and a 1290 Series HPLC System (Agilent, Waldbronn, Germany).Chromatographic separation was performed at 25 ◦C on a Gemini® C18-column, 150× 4.6 mm i.d., 5 μmparticle size, equipped with a C18 4× 3 mm i.d. security guard cartridge (all from Phenomenex, Torrance,CA, USA). The chromatographic method, chromatographic and mass spectrometric parameters, as wellas the method validation data, are described by Malachova et al. [47]. Electrospray ionization-tandemmass spectrometry (ESI-MS/MS) was performed in the time-scheduled multiple reaction monitoring(MRM) mode both in positive and negative polarities in two separate chromatographic runs per sample
80

Toxins 2019, 11, 357
by scanning two fragmentation reactions per analyte. The MRM detection window of each analytewas set to its expected retention time of ±27 sec and ±48 sec in the positive and the negative mode,respectively. Confirmation of a positive analyte identification was obtained by the acquisition of twoMRMs per analyte (excepting moniliformin, which exhibits only one fragment ion), which yielded 4.0identification points according to commission decision 2002/657/EC. In addition, the LC retention timeand the intensity ratio of the two MRM transitionswas in accordance with the related values of anauthentic standard within 0.1 min and 30% rel., respectively.
Quantification was based on an external calibration using a serial dilution of a multianalyte stocksolution, and results were corrected for apparent recoveries. The accuracy of the method is verifiedon a continuous basis by regular participation in proficiency testing schemes [47,48] organized byBIPEA (Gennevilliers, France). Based on the submitted results, a general expanded measurementuncertainty of 50% has been determined [49]. In the case of the 175 results already submitted for maizeand maize-based feed, 168 results were in the satisfactory range (z-score between −2 and 2).
5.3. Statistical Analysis
Statistical analysis (Supplementary Materials) was performed using the computing environmentR (R Core Team, Vienna, Austria) [50] on the data from regions where samples were collected duringall three years of research (South-Backa and South-Banat). The Shapiro–Wilk normality test was usedto check the distribution of the data. Since the data were not normally distributed, nonparametric testswere used for further analysis. The Kruskal–Wallis test was used to check whether the mean ranks ofthe mycotoxin levels were the same in all groups. Spearman’s correlation was used to determine thecorrelation between climate conditions and mycotoxin contamination levels. Furthermore, Stepwiseregression with backward steps was used to obtain the optimal model and significant months in termsof temperature and precipitation values that influence mycotoxin levels.
Supplementary Materials: The following are available online at http://www.mdpi.com/2072-6651/11/6/357/s1,Figure S1. Spearman Correlation Results (r).
Author Contributions: Conceptualization, I.J. and F.B.; Data curation, T.D., S.K., Z.S., and A.S.; Formal analysis,T.D., S.K., and D.G.; Funding acquisition, I.J., R.K., and F.B.; Investigation, R.K., M.S., Z.S., D.G., and A.S.;Methodology, R.K., M.S., and D.G.; Project administration, I.J. and F.B.; Resources, I.J. and F.B.; Software,T.D. and S.K.; Supervision, I.J., R.K., and F.B.; Validation, I.J., R.K. and M.S.; Visualization, T.D. and S.K.;Writing—originaldraft, T.D. and S.K.; Writing—review and editing, I.J., R.K., F.B., and Z.S.
Funding: This research was funded by MyToolBox (EU’s Horizon 2020 research and innovation programme,agreement No 678012), research project of the Ministry of Education, Science and Technological Development,Republic of Serbia (project III 46005) and Provincial Secretariat for Higher Education and Scientific Research of theAutonomous Province of Vojvodina through the project “Application of novel and conventional processes forremoval of most common contaminants, mycotoxins and salmonella, in order to produce safe animal feed intheterritory of AP Vojvodina”, Project No. 114-451-2505/2016-01.
Conflicts of Interest: The authors declare no conflict of interest.
References
1. Jestoi, M. Emerging Fusarium mycotoxins fusaproliferin, beauvericin, enniatins, and moniliformin: A review.Crit. Rev. FoodSci. Nutr. 2008, 48, 21–49. [CrossRef] [PubMed]
2. Kumar, V.; Basu, M.S.; Rajendran, T.P. Mycotoxin research and mycoflora in some commercially importantagricultural commodities. Crop Prot. 2008, 27, 891–905. [CrossRef]
3. Kovalsky, P.; Kos, G.; Nährer, K.; Schwab, C.; Jenkins, T.; Schatzmayr, G.; Sulyok, M.; Krska, R. Co-occurrenceof regulated, masked and emerging mycotoxins and secondary metabolites in finished feed and maize—Anextensive survey. Toxins 2016, 8, 363. [CrossRef] [PubMed]
4. Burmeister, H.R.; Ciegler, A.; Vesonder, R.F. Moniliformin, a metabolite of Fusarium moniliforme NRRL 6322:Purification and toxicity. Appl. Environ. Microbiol. 1979, 37, 11–13. [PubMed]
5. Cole, R.J.; Kirksey, J.W.; Cutler, H.G.; Doupnik, B.L.; Peckham, J.C. Toxin from Fusarium moniliforme: Effectson plants and animals. Science 1973, 179, 1324–1326. [CrossRef] [PubMed]
81

Toxins 2019, 11, 357
6. Calo, L.; Fornelli, F.; Ramiers, R.; Nenna, S.; Tursi, A.; Caiaffa, M.F.; Macchia, L. Cytotoxic effects of themycotoxin beauvericin to human cell lines of myeloid origin. Pharmacol. Res. 2004, 49, 73–77. [CrossRef][PubMed]
7. Ivanova, L.; Skjerve, E.; Eriksen, G.S.; Uhlig, S. Cytotoxicity of enniatins A, A1, B, B1, B2 and B3 fromFusarium avenaceum. Toxicon 2006, 47, 868–876. [CrossRef] [PubMed]
8. Jow, G.M.; Chou, C.J.; Chen, B.F.; Tsai, J.H. Beauvericin induces cytotoxic effects in human acute lymphoblasticleukemia cells through cytochrome c release, caspase 3 activation: The causative role of calcium. Cancer Lett.2004, 216, 165–173. [CrossRef]
9. Ferrer, E.; Juan-García, A.; Font, G.; Ruiz, M.J. Reactive oxygen species induced by beauvericin, patulin andzearalenone in CHO-K1 cells. Toxicol. In Vitro 2009, 23, 1504–1509. [CrossRef]
10. Ritieni, A.; Fogliano, V.; Randazzo, G.; Scarallo, A.; Logrieco, A.; Moretti, A.; Manndina, L.; Bottalico, A.Isolation and characterization of fusaproliferin, a new toxic metabolite from Fusarium proliferatum. Nat. Toxins1995, 3, 17–20. [CrossRef]
11. Tomoda, H.; Huang, X.H.; Nishida, J.; Cao, H.; Nagao, R.; Okuda, S.; Tanaka, H.; Omura, S.; Arai, H.; Inoue, K.Inhibition of acyl-CoA: Cholesterol acyltransferase activity by cyclodepsipeptide antibiotics. J. Antibiot. 1992,45, 1626–1632. [CrossRef] [PubMed]
12. Macchia, L.; Di Paola, R.; Fornelli, F.; Nenna, S.; Moretti, A.; Napoletano, R.; Logrieco, A.; Caiaffa, M.F.;Bottalico, A. Cytotoxicity of beauvericin to mammalian cells. In Abstracts of the International SeminaronFusarium: Mycotoxins, Taxonomyand Pathogenicity, Martina Franca, Italy, 9–13 May 1995; Stampasud: Mottola,Italy, 1995; pp. 72–73.
13. Fornelli, F.; Minervini, F.; Logrieco, A. Cytotoxicity of fungal metabolites to lepidopteran (Spodopterafrugiperda)cell line (SF-9). J. Invertebr. Pathol. 2004, 85, 74–79. [CrossRef] [PubMed]
14. Ojcius, D.M.; Zychlinsky, A.; Zheng, L.M.; Young, J.D.E. Ionophore induced apoptosis: Role of DNAfragmentation and calcium fluxes. Exp. Cell Res. 1991, 197, 43–49. [CrossRef]
15. Randazzo, G.; Fogliano, V.; Ritieni, A.; Mannina, L.; Rossi, E.; Scarallo, A.; Segre, A.L. Proliferin, a newsesterterpene from Fusarium proliferatum. Tetrahedron 1993, 49, 10883–10896. [CrossRef]
16. Logrieco, A.; Moretti, A.; Fornelli, F.; Fogliano, V.; Ritieni, A.; Caiaffa, M.F.; Randazzo, G.; Bottalico, A.;Macchia, L. Fusaproliferin production by Fusarium subglutinans and its toxicity to Artemia salina, SF-9 insectcells, and IARC/LCL 171 human B lymphocytes. Appl. Environ Microbiol. 1996, 62, 3378–3384. [PubMed]
17. Ritieni, A.; Monti, S.M.; Randazzo, G.; Logrieco, A.; Moretti, A.; Peluso, G.; Ferracane, R.; Fogliano, V.Teratogenic effects of fusaproliferin on chicken. J. Agric. Food Chem. 1997, 45, 3039–3043. [CrossRef]
18. Kriek, N.P.J.; Marasas, W.F.O.; Steyn, P.S.; Van Rensburg, S.J.; Steyn, M. Toxicity of a moniliformin-producingstrain of Fusarium moniliforme var. subglutinans isolated from maize. Food Cosmet. Toxicol. 1977, 15, 579–587.[CrossRef]
19. Sifou, A.; Meca, G.; Serrano, A.B.; Mahnine, N.; El Abidi, A.; Mañes, J.; El Azzouzi, M.; Zinedine, A.First report on the presence of emerging Fusarium mycotoxins enniatins (A, A1, B, B1), beauvericin andfusaproliferin in rice on the Moroccan retail markets. Food Control 2011, 22, 1826–1830. [CrossRef]
20. Oueslati, S.; Meca, G.; Mliki, A.; Ghorbel, A.; Mañes, J. Determination of Fusarium mycotoxins enniatins,beauvericin and fusaproliferin in cereals and derived products from Tunisia. Food Control 2011, 22, 1373–1377.[CrossRef]
21. Serrano, A.; Font, G.; Ruiz, M.; Ferrer, E. Co-occurrence and risk assessment of mycotoxins in food and dietfrom Mediterranean area. Food Chem. 2012, 135, 423–429. [CrossRef]
22. Juan, C.; Ritieni, A.; Mañes, J. Occurrence of Fusarium mycotoxins in Italian cereal and cereal products fromorganic farming. Food Chem. 2013, 141, 1747–1755. [CrossRef] [PubMed]
23. Nazari, F.; Sulyok, M.; Kobarfard, F.; Yazdanpanah, H.; Krska, R. Evaluation of emerging Fusarium mycotoxinsbeauvericin, enniatins, fusaproliferin and moniliformin in domestic rice in Iran. Iran. J. Pharm. Res. 2015,14, 505–512. [PubMed]
24. EFSA CONTAM Panel (EFSA Panel on Contaminants in the Food Chain). Scientific Opinion on the risks tohuman and animal health related to the presence of beauvericin and enniatins in food and feed. EFSA J.2014, 12, 3802. [CrossRef]
25. Statistical Office of the Republic of Serbia. Statistical Yearbook of Serbia 2017. Available online: http://publikacije.stat.gov.rs/G2017/Pdf/G20172022.pdf (accessed on 6 September 2018).
82

Toxins 2019, 11, 357
26. Statistical Office of the Republic of Serbia. Statistical Yearbook of Serbia 2018. Available online: http://publikacije.stat.gov.rs/G2018/Pdf/G20182051.pdf (accessed on 12 February 2019).
27. Statistical Office of the Republic of Serbia. Production of Wheat and Early Fruit and the Expected Yield ofLate Crops, Fruit and Grape 2018. Available online: http://publikacije.stat.gov.rs/G2018/Pdf/G20181261.pdf(accessed on 26 September 2018).
28. Index Mundi: Corn Exports by Country 2018. Available online: http://www.indexmundi.com/agriculture/?commodity=corn&graph=exports (accessed on 8 March 2019).
29. Index Mundi: Corn Production by Country 2018. Available online: http://www.indexmundi.com/agriculture/?commodity=corn&graph=production (accessed on 8 March 2019).
30. Republic Hydrometeorological Service of Serbia. Agrometeorološki uslovi u proizvodnoj 2015/2016 godini nateritoriji Republike Srbije. Available online: http://www.hidmet.gov.rs/podaci/agro/ciril/AGROveg2016.pdf(accessed on 23 September 2017).
31. Republic Hydrometeorological Service of Serbia. Agrometeorološki uslovi u proizvodnoj 2016/2017 godini nateritoriji Republike Srbije. Available online: http://www.hidmet.gov.rs/podaci/agro/ciril/AGROveg2017.pdf(accessed on 1 November 2018).
32. Republic Hydrometeorological Service of Serbia. Agrometeorološki uslovi u proizvodnoj 2017/2018 godinina teritoriji Republike Srbije. Available online: http://www.hidmet.gov.rs/podaci/agro/godina.pdf (accessedon 20 February 2019).
33. Republic Hydrometeorological Service of Serbia. Multiannual Average of Meteorological Parameters(1981–2010). Available online: http://www.hidmet.gov.rs/ciril/meteorologija/klimatologija_srednjaci.php(accessed on 20 February 2019).
34. Sutton, J.C. Epidemiology of wheat head blight and maize ear rot caused by Fusarium graminearum. Can. J.Plant Pathol. 1982, 4, 195–209. [CrossRef]
35. Vigier, B.; Reid, L.M.; Seifert, K.A.; Stewart, D.W.; Hamilton, R.I. Distribution and prediction of Fusariumspecies associated with maize ear rot in Ontario. Can. J. Plant Pathol. 1997, 19, 60–65. [CrossRef]
36. Reid, L.M.; Bolton, A.T.; Hamilton, R.I.; Woldemariam, T.; Mather, D.E. Effect of silk age on resistance ofmaize to Fusarium graminearum. Can. J. Plant Pathol. 1992, 14, 293–298. [CrossRef]
37. Reid, L.M.; Hamilton, R.I. Effect of inoculation position, timing, macrocondial concentration, and irrigation onresistance of maize to Fusarium graminearum infection through kernels. Can. J. Plant Pathol. 1996, 18, 279–285.[CrossRef]
38. Serrano, A.B.; Font, G.; Mañes, J.; Ferrer, E. Emerging Fusarium mycotoxins in organic and conventionalpasta collected in Spain. Food Chem. Toxicol. 2013, 51, 259–266. [CrossRef] [PubMed]
39. Zinedine, A.; Meca, G.; Mañes, J.; Font, G. Further data on the occurrence of Fusarium emerging mycotoxinsenniatins (A, A1, B, B1), fusaproliferin and beauvericin in raw cereals commercialized in Morocco. FoodControl2011, 22, 1–5. [CrossRef]
40. Meca, G.; Zinedine, A.; Blesa, J.; Font, G.; Mañes, J. Further data on the presence of Fusariumemerging mycotoxins enniatins, fusaproliferin and beauvericin in cereals available on the Spanish markets.Food Chem. Toxicol. 2010, 48, 1412–1416. [CrossRef] [PubMed]
41. Mahnine, N.; Meca, G.; Elabidi, A.; Fekhaoui, M.; Saoiabi, A.; Font, G.; Mañes, J.; Zinedine, A. Further dataon the levels of emerging Fusarium mycotoxins enniatins (A, A1, B, B1), beauvericin and fusaproliferin inbreakfast and infant cereals from Morocco. Food Chem. 2011, 124, 481–485. [CrossRef]
42. Goertz, A.; Zuehlke, S.; Spiteller, M.; Steiner, U.; Dehne, H.W.; Waalwijk, C.; de Vries, I.; Oerke, E.C. Fusariumspecies and mycotoxin profiles on commercial maize hybrids in Germany. Eur. J. Plant Pathol. 2010,128, 101–111. [CrossRef]
43. Uhlig, S.; Torp, M.; Jarp, J.; Parich, A.; Gutleb §, A.C.; Krska, R. Moniliformin in Norwegian grain. Food Addit.Contam. 2004, 21, 598–606. [CrossRef] [PubMed]
44. Chelkowski, J.; Ritieni, A.; Wisniewska, H.; Mulé, G.; Logrieco, A. Occurrence of toxic hexadepsipeptides inpreharvest maize ear rot infected by Fusarium poae in Poland. J. Phytopathol. 2007, 155, 8–12. [CrossRef]
45. Stanciu, O.; Juan, C.; Miere, D.; Loghin, F.; Mañes, J. Occurrence and co-occurrence of Fusarium mycotoxinsin wheat grains and wheat flour from Romania. Food Control 2017, 73, 147–155. [CrossRef]
46. Jurjevic, Ž.; Solfrizzo, M.; Cvjetkovic, B.; De Girolamo, A.; Visconti, A. Occurrence of beauvericin in cornfrom Croatia. Food Technol. Biotech. 2002, 40, 91–94.
83

Toxins 2019, 11, 357
47. Malachova, A.; Sulyok, M.; Beltran, E.; Berthiller, F.; Krska, R. Optimization and validation of a quantitativeliquid chromatography—Tandem mass spectrometric method covering 295 bacterial and fungal metabolitesincluding all regulated mycotoxins in four model food matrices. J. Chromatogr. A 2014, 1362, 145–156.[CrossRef] [PubMed]
48. Malachova, A.; Sulyok, M.; Beltrán, E.; Berthiller, F.; Krska, R. Multi-toxin determination in food - the powerof “Dilute and Shoot” approaches in LC-MS-MS. LCGC Eur. 2015, 28, 542–555.
49. Stadler, D.; Sulyok, M.; Schuhmacher, R.; Berthiller, F.; Krska, R. The contribution to lot-to-lot variationto the measurement uncertainty of an LC-MS-based multi-mycotoxin assay. Anal. Bioanal. Chem. 2018,410, 4409–4418. [CrossRef]
50. R Core Team. R: A Language and Environment for Statistical Computing; R Foundation for Statistical Computing:Vienna, Austria, 2013; ISBN 3-900051-07-0. Available online: http://www.R-project.org/ (accessed on 30 April2019).
© 2019 by the authors. Licensee MDPI, Basel, Switzerland. This article is an open accessarticle distributed under the terms and conditions of the Creative Commons Attribution(CC BY) license (http://creativecommons.org/licenses/by/4.0/).
84

toxins
Article
Occurrence of the Ochratoxin A Degradation Product2′R-Ochratoxin A in Coffee and Other Food:An Update
Franziska Sueck 1, Vanessa Hemp 1, Jonas Specht 1, Olga Torres 2,3, Benedikt Cramer 1,* and
Hans-Ulrich Humpf 1,*
1 Institute of Food Chemistry, Westfälische Wilhelms-Universität Münster, Corrensstraße 45, 48149 Münster,Germany; [email protected] (F.S.); [email protected] (V.H.); [email protected] (J.S.)
2 Laboratorio Diagnostico Molecular S.A, Guatemala City, Guatemala; [email protected] Centro de Investigaciones en Nutrición y Salud, Guatemala City, Guatemala* Correspondence: [email protected] (B.C.); [email protected] (H.-U.H.)
Received: 18 April 2019; Accepted: 3 June 2019; Published: 8 June 2019
Abstract: Food raw materials can contain the mycotoxin ochratoxin A (OTA). Thermal processingof these materials may result in decreased OTA levels but also in the formation of the thermalisomerization product 2′R-ochratoxin A (2′R-OTA). So far, only 2′R-OTA levels reported from15 coffee samples in 2008 are known, which is little when compared to the importance of coffee as afood and trading good. Herein, we present results from a set of model experiments studying the effectof temperatures between 120 ◦C and 270 ◦C on the isomerization of OTA to 2′R-OTA. It is shown thatisomerization of OTA starts at temperatures as low as 120 ◦C. At 210 ◦C and above, the formationof 25% 2′R-OTA is observed in less than one minute. Furthermore, 51 coffee samples from France,Germany, and Guatemala were analyzed by HPLC-MS/MS for the presence of OTA and 2′R-OTA.OTA was quantified in 96% of the samples, while 2′R-OTA was quantifiable in 35% of the samples.The highest OTA and 2′R-OTA levels of 28.4 μg/kg and 3.9 μg/kg, respectively, were detected in coffeefrom Guatemala. The OTA:2′R-OTA ratio in the samples ranged between 2.5:1 and 10:1 and was onaverage 5.5:1. Besides coffee, 2′R-OTA was also for the first time detected in a bread sample and maltcoffee powder.
Keywords: Ochratoxin A; 2′R-ochratoxin A; 14(R)-ochratoxin A; coffee; degradation; processing;roasting; modified mycotoxins; masked mycotoxins
Key Contribution: 2′R-OTA occurs in most of the tested coffee samples in levels up to 3.9 μg/kg.Other food might also contain significant amounts of 2′R-OTA as the isomerization of OTA to 2′R-OTAstarts at 120 ◦C.
1. Introduction
The mycotoxin ochratoxin A (OTA, Figure 1) can be found in a broad spectrum of food rawmaterials infested with fungi of the genera Aspergillus and Penicillium as well as in food products derivedfrom these commodities [1]. Considering exposure within the European Union, cereals and cerealproducts, such as pasta, bread, and beer, are the most relevant OTA sources due to the high consumptionrates of these food items. In Germany, for instance, these products are on average responsible for about67% of the OTA intake in adults. Besides this, approximately 12% of the total OTA exposure occursfrom coffee drinking and a further 6% from cocoa, 6% from meat, and 5% from wine [1].
Toxins 2019, 11, 329; doi:10.3390/toxins11060329 www.mdpi.com/journal/toxins85

Toxins 2019, 11, 329
Figure 1. Structures of ochratoxin A (OTA), its thermal isomerization product 2′R-ochratoxin A(2′R-OTA), and the degradation products 2′-decarboxy-ochratoxin A (DC-OTA) and ochratoxinα-amide (OTamide).
Most food items undergo food processing, such as milling, baking, roasting, frying, or fermentation.All of these steps can have an impact on the mycotoxin burden of the product, for instance by physicalremoval or chemical modification [2,3]. To what extent mycotoxins are modified during these processingsteps depends on the parameters but also on the chemical structure of the compound. Chemicalmodifications can result in the formation of mycotoxin conjugates, such as the deoxynivalenol (DON)glucosides formed during the fermentation of dough [4–6], binding to food-matrix components asshown for fumonisins [7], or the formation of degradation products, such as the norDON series [8].
Depending on the commodity, OTA undergoes different types of processing, such as baking,extrusion cooking, roasting, and fermentation. The reduction of OTA levels during these processes hasbeen found to range between no impact and almost a 100% decrease [3,9–12]. A strong OTA decrease wasobserved during coffee roasting, where up to a 90% reduction was reported in most of the studies [13–17].On the other hand, in some other coffee-roasting experiments, only a slight reduction of less than12% was noted [18,19]. Several efforts have been made to identify the chemical reaction that leads tolower OTA levels in roasted coffee. Bittner et al. (2013) showed that OTA binds to polysaccharidesof the coffee bean during roasting [20]. The high temperatures present during coffee roasting alsolead to a decarboxylation to form decarboxy-ochratoxin A (DC-OTA) as well as to racemization of thephenylalanine moiety to yield 2′R-ochratoxin A (2′R-OTA, previously reported as 14(R)-OTA) and tothe formation of ochratoxin α-amide (OTamide) as shown in Figure 1 [20–22]. A quantitative analysis of15 coffee samples from the German market indicated that DC-OTA is only formed in minor amounts,while the concentration of 2′R-OTA was up to 0.63 μg/kg. A ratio of OTA and 2′R-OTA lower than 4:1was determined [21]. OTamide was not analyzed in this study.
OTA has been shown to be nephrotoxic, hepatotoxic, teratogenic, and immunotoxic in variousspecies and was classified by the International Agency for Research on Cancer (IARC) as possiblycarcinogenic to humans (group 2B) in 1993 [23,24]. The mode of action is still not clear and controversiallydiscussed [25,26]. In comparison to OTA, only very little information on the toxicity of the degradationproduct 2′R-OTA is available: 2′R-OTA shows in a Cell Counting Kit-8 (CCK-8) assay a 10-fold lowercytotoxic effect on IHKE-cells compared to OTA [21,27]. Several studies have shown that OTA isdetectable in blood of humans and animals [28], with human plasma concentrations ranging roughlybetween 0.05 ng/mL and 5 ng/mL [29,30]. The thermal isomerization product 2′R-OTA is also ofrelevance, as it was recently found in humans in comparable levels as OTA [31].
Little is known on the kinetics of the isomerization of OTA to 2′R-OTA, and the minimumtemperature required for the thermal conversion of OTA to 2′R-OTA has not been elucidated [21].Depending on these data, bakery products and breakfast cereals might also be potential sources of2′R-OTA exposure.
Herein, we report the analysis of 51 coffee samples from Germany, France, and Guatemala toextend the database on 2′R-OTA levels in food. Furthermore, the kinetics of the isomerization ofOTA to 2′R-OTA were studied in a model system covering temperatures between 120 and 270 ◦C.As isomerization of OTA to 2′R-OTA has already been observed at 120 ◦C, further thermally treatedfood samples were analyzed on the occurrence of OTA and 2′R-OTA.
86

Toxins 2019, 11, 329
2. Results
2.1. Degradation of OTA in Model Heating Experiments
The isomerization of OTA to 2′R-OTA as well as the formation of other degradation products werestudied in model heating experiments. To that end, OTA was heated at temperatures of 120, 150, 180,210, 240, and 260 ◦C without solvent for 1 to 30 min, respectively. The observed degradation curves ofOTA are shown in Figure 2. Subsequent analysis by HPLC-FLD for the known degradation products2′R-OTA and DC-OTA resulted in the curves shown in Figure 3. At the lowest tested temperature of120 ◦C, OTA remained almost stable over the entire heating period with only 3% 2′R-OTA formedwithin 30 min. After the same time, but heating at 150 ◦C, approximately 20% of OTA was converted to2′R-OTA. At 180 ◦C, a fast racemization of OTA towards 2′R-OTA was observed with an equilibriumbetween both compounds reached after approximately 20 min. Above this temperature, racemizationof OTA towards 2′R-OTA was achieved after 1 to 5 min of heating, followed by further degradation ofboth diastereomers. After 30 min at 210, 240, and 260 ◦C, only 80%, 35%, and 20%, respectively, of thesum of OTA and 2′R-OTA were detectable. Screening for DC-OTA and OTamide revealed only smallquantities of less than 1% (data not shown), and were not further considered.
Figure 2. Degradation curves of ochratoxin A (OTA) at temperatures between 120 and 260 ◦C for 1–30 min.
Figure 3. Formation of 2′R-ochratoxin A (2′R-OTA) during heating of OTA at temperatures between120 and 260 ◦C for 1–30 min.
87

Toxins 2019, 11, 329
2.2. Coffee Powder: Current Situation of OTA and 2′R-OTA Content
The published dataset on 2′R-OTA contamination in food and the OTA:2′R-OTA ratio is limited todata from the analysis of 15 coffee samples in 2008 [21]. Therefore, in order to extend the database andto evaluate the current situation, we analyzed in total a set of 51 coffee samples from France, Germany,and Guatemala. Among the 14 commercially available roasted coffee samples from the French andGerman market, five were categorized as espresso powder and nine samples as coffee powder packages.Three of the coffee samples were labelled as organically grown and two as decaffeinated. The resultsare presented in Figure 4. In all coffee samples except two from Guatemala, OTA was quantifiable in arange between 0.26 and 28.4 μg/kg with a mean contamination of 1.98 μg/kg. No sample from Europe,but three samples from Guatemala (Figure 4, coffee samples 1-3) showed OTA levels above the legallimit of 5 μg/kg OTA set by the European Union [32]. Among these three, two samples exceeded thelimit by factors of 5 and 4, respectively.
Figure 4. OTA and 2′R-OTA contents of the coffee powder samples from Germany (red), Guatemala(black), and France (blue). a decaffeinated, b espresso, c organically grown. The standard deviation isgiven for duplicate analysis.
In two decaffeinated coffee samples (Figure 4, samples 11 and 24), OTA concentrations of 1.30and 0.88 μg/kg were detected. Interestingly, the three analyzed organic coffee powders, including oneespresso sample (Figure 4, samples 32, 34, and 42), with OTA concentrations of 0.64, 0.62, and 0.38 μg/kgwere among the coffee samples with the lowest detected OTA levels. The four other analyzed espressosamples (Figure 4, samples 12, 18, 26, and 38) contained 1.27, 1.09, 0.79, and 0.51 μg/kg OTA, whichwas comparable to the OTA contents of the other coffee samples from Europe.
The isomer 2′R-OTA was quantifiable in 18 of the 51 coffee samples (35%) with a mean concentrationof 0.27 μg/kg. The highest 2′R-OTA level of 3.9 μg/kg was determined in the coffee sample fromGuatemala containing 28 μg/kg OTA (Figure 4, sample 1). Among the European coffee samples, anespresso coffee powder (Figure 3, sample 12) with a 2′R-OTA concentration of 0.52 μg/kg and anOTA level of 1.27 μg/kg showed the highest 2′R-OTA contamination and, furthermore, the highestOTA:2′R-OTA ratio of 2.5:1. However, there was no indication that espresso coffee production favors2′R-OTA formation, as the other analyzed espresso coffee samples contained no, or a low amount of,2′R-OTA and showed OTA:2′R-OTA ratios between 4:1 and 10:1. In both decaffeinated coffee samples(Figure 3, samples 11 and 24), the 2′R-OTA concentration was below the limit of quantification (LOQ).Taking all coffee samples into account that were positive for 2′R-OTA, a OTA:2′R-OTA ratio between10:1 and 2.5:1 with an average OTA:2′R-OTA-ratio of 5.5:1 was observed.
88

Toxins 2019, 11, 329
2.3. Evaluation of Other Thermally Processed Food Materials as Sources of 2′R-OTA Exposure
The data from the heating experiment with pure OTA suggest that, at a comparatively lowtemperature of 120 ◦C, a slow isomerization of OTA to 2′R-OTA can be observed. Such temperaturescan be reached during different kinds of baking processes, and the conditions might be sufficient for theformation of significant quantities of 2′R-OTA. To that end, different thermal processed food sampleswere screened (Table 1). The choice of the analyzed food samples was based on thermal processingconditions and the overall contribution to OTA exposure [1]. Consequently, 30 samples of cocoa (8) andcereal products (22) were analyzed for OTA and 2′R-OTA. Details on the samples are given in Table 1.
Table 1. Results of a survey screening for the presence of OTA and 2′R-OTA in thermally processedfood. (n: numbers of food samples; n.d.: not detectable).
Group Food Sample n OTA (LOD, LOQ) 2′R-OTA (LOD, LOQ)
CocoaProducts
beans (roasted and unroasted) 2 1 sample > LOD n.d.nibs (roasted and unroasted) 2 n.d. n.d.
Powder 2 1 sample > LOD n.d.chocolate cream 2 1 sample > LOD n.d.
Cereals
coffee likeinstant malt coffee
powder 5 4 samples > LOD1 sample: 0.62 ± 0.04 μg/kg
3 samples > LOD1 sample: 0.22 ± 0.02 μg/kg
malt coffee powder 1 1 sample > LOD 1 sample > LOD
expandedpuffed wheat 1 n.d. n.d.
rye puffed waffles 1 n.d. n.d.rice puffed waffles 2 n.d. n.d.
Roastedpopcorn 2 n.d. n.d.
Breakfast cereals 2 1 samples > LOD n.d.coloring malt 5 1 samples > LOD n.d.
baking pumpernickel 4 3 samples > LOD1 sample: 0.11 ± 0.02 μg/kg 1 sample > LOD
Generally, OTA contamination of the analyzed food samples was low, resulting in only two sampleswith OTA levels above the LOQ and 13 samples above the limit of detection (LOD). However, despite thelow OTA contamination, six food samples were found to be positive for 2′R-OTA. In particular, coffeesurrogates, such as instant malt coffee powder and malt coffee powder, were all found to be positivefor this compound. With an OTA concentration of 0.62 ± 0.04 μg/kg and a 2′R-OTA concentration of0.22 ± 0.02 μg/kg, comparable racemization rates as for roasted coffee were observed. Additionally, onebread sample (pumpernickel) contained detectable amounts of 2′R-OTA. Pumpernickel is a long-termheated bread. To produce this type of bread, a loaf of rye is baked for 16–24 h at an oven temperatureof approximately 110 ◦C.
3. Discussion
The thermal instability of the mycotoxin OTA has been reported for several food processingtechnologies. However only for roasted coffee have the degradation products 2′R-OTA and DC-OTAbeen described and quantified so far, and in a limited number of samples. In this study, it was shownin model heating experiments that a slow racemization of OTA to 2′R-OTA occurs at temperatures aslow as 120 ◦C. Above these temperatures, a fast racemization of OTA was observed, with 25% 2′R-OTAbeing formed after 30 min at 150 ◦C, after 5 min at 180 ◦C, and after 1 min or less at 210 ◦C and above.Longer heating periods at temperatures of 240 ◦C and above resulted in a fast degradation of OTA and2′R-OTA, which can be explained by other reactions, such as pyrolysis or polymerization. Comparedwith previously reported data, these results confirm the importance of 2′R-OTA as the main OTAdegradation product. A slow conversion of OTA to 2′R-OTA occurring at temperatures as low as120 ◦C has not yet been reported [21,22].
Thus, food samples, processed at temperatures far lower than those applied for coffee roasting,might be additional sources of 2′R-OTA exposure. However, to date, 2′R-OTA has only been detected
89

Toxins 2019, 11, 329
in blood samples from 34 coffee drinkers in concentrations between 0.021 and 0.411 ng/mL (mean:0.21 ± 0.066 ng/mL) compared to 0.071–0.383 ng/mL (mean: 0.11 ± 0.093 ng/mL) for OTA. An averageOTA:2′R-OTA ratio of 2:1 was determined and in some cases, the concentration of 2′R-OTA evenexceeded that of OTA. No 2′R-OTA was detected in the set of 14 samples from non-coffee drinkers,suggesting that 2′R-OTA is predominantly present in roasted coffee. Nevertheless, the number ofnon-coffee drinkers participating in that study was low, and no correlation between the 2′R-OTA levelsand overall coffee consumption was observed, making further sources of 2′R-OTA plausible [31,33].
Screening of a set of 51 coffee samples confirmed the role of roasted coffee as the key sourceof 2′R-OTA exposure, with 2′R-OTA levels of up to 3.9 μg/kg in highly contaminated coffee fromGuatemala and up to 0.52 μg/kg in European coffee samples. No systematic differences betweenespresso coffee and other coffee with respect to the 2′R-OTA levels could be observed. For decaffeinatedcoffee, moderate OTA levels were detected, but no 2′R-OTA in concentrations above the LOQ. Althoughno information on the OTA content before roasting was available, the reported reductive effect ofdecaffeination on OTA levels seems to be limited [34]. These results are in good agreement withpreviously reported 2′R-OTA levels but also show that, in certain samples, such as one specific espressopowder, relatively high 2′R-OTA levels and OTA:2′R-OTA ratios as low as 2.5:1 can occur. In a previousstudy, for roasted coffee, OTA:2′R-OTA ratios between 10:1 and 4:1 (mean: 5:1) were determined froma set of 15 coffee samples. The variation of these ratios between different coffee samples also suggesteda dependency of 2′R-OTA formation on the roasting process. Traditionally, green beans are roastedfor between 8 and 20 min at temperatures between 160 and 240 ◦C using a drum roaster, a hot-airroaster, or a combination of both systems [35]. Oliveira et al. (2013) reported a correlation betweenroasting level and OTA degradation, while Castellanos-Onorio et al. (2011) observed for the tworoasting techniques (drum roaster and hot-air roaster) a similar OTA reduction. In both cases, theformation or 2′R-OTA was unfortunately not studied [16,17]. In contrast to the traditional temperatureregimes, to increase throughput, some companies have established a coffee-roasting process based onhigh temperatures of around 400 ◦C and roasting times of less than one minute [36].
To confirm the results from the model experiments, other thermally processed food samples,known to contribute to OTA exposure, were analyzed for the presence of 2′R-OTA, the most abundantthermal degradation product of OTA. Besides coffee, quantities of 2′R-OTA were detected in maltcoffee as well as in traditionally baked rye bread (Pumpernickel). The latter is of special importance asit confirms the results from the model experiments, showing that OTA can be converted to 2′R-OTA atlow temperatures between 100 and 120 ◦C. However, it has to be considered that this type of bread hasa minimum baking time of 16 h, which makes a comparison with other bread and bakery productsrather difficult. Other analyzed food samples contained no detectable amounts of 2′R-OTA but werealso low for OTA.
The most relevant sources of OTA exposure are cereals, followed by coffee, cocoa, meat, and wine.For the cereal products biscuits and muesli, baking times are usually short and temperatures insidethe product are mostly at 100 ◦C or below [37]. For roasted and expanded cereals, the situation isdifferent; however, due to the low availability of industrially processed and naturally contaminatedproducts, we were not able to prove whether a racemization of OTA during these processes may occur.Considering other typical food-processing procedures, wine can be excluded as potential source of2′R-OTA due to low fermentation and processing temperatures. In the case of meat, temperaturesabove 100 ◦C are rarely reached in the inner part of the product (e.g., sausage). A different situationmight be the manufacturing of canned meat, such as corned beef, where temperatures of up to 121 ◦Care applied for sterilization. Here, additional studies investigating the racemization of OTA in aqueoussolutions are necessary. Thus, there is a need for more data on the occurrence of 2′R-OTA in thesefoods and on the toxic properties of this compound to allow for an adequate risk assessment.
4. Materials and Methods
Methanol (MeOH), acetonitrile (ACN), and toluene were obtained in gradient grade from FisherScientific (Schwerte, Germany). NaCl, formic acid, hexane, and Na2HCO3 were in pro analysi (p.a.)
90

Toxins 2019, 11, 329
quality from Merck KGaA (Darmstadt, Germany). Potato dextrose agar (PDA), potato dextrose broth,and KH2PO4 were from Carl Roth (Karlsruhe, Germany), Xylene in p.a. quality was obtained fromHoneywell (Seelze, Germany), NaHCO3 in p.a. quality was obtained from Grüssing (Filsum, Germany),and KCl in p.a. quality was obtained from VWR (Langenfeld, Germany). Purified water of ASTM type1 quality was prepared with a Purelab Flex 2 system from Veolia Water Technologies (Celle, Germany).
4.1. Biosynthesis of Standards
OTA was isolated from cultures of Aspergillus westerdijkiae BFE 1115, provided by the Max RubnerInstitute (Karlsruhe, Germany), which were activated for 2 days in liquid potato dextrose broth at roomtemperature and then incubated for two weeks at 27 ◦C on autoclaved durum wheat adjusted to awater content of 62.5% (w/w) and supplemented with 2.5% sodium chloride (w/w). OTA was extractedfrom the durum wheat cultures using tBME containing 0.5% formic acid, purified by liquid–liquidextraction with water at different pH levels and silica column chromatography with the solvent systemtoluene/tBME/formic acid (8/1.5/0.5 (v/v/v)). Finally, residual impurities were removed by crystallizationfrom xylene/hexane (7/3 (v/v)). The purity of OTA was >99% as determined by HPLC-UV (220 nm) andNMR. 2′R-OTA, DC-OTA, OTα-amide, d5-OTA, and d5-2′R-OTA were prepared in-house as describedelsewhere [21,22].
4.2. Model Heating Experiments with OTA
For the model heating experiments, a stock solution with a concentration of 274 μg/mL inacetonitrile was prepared. Aliquots of the solution (36.5 μL, 10 μg) were transferred into 1.5 mL vialsand the solvent was evaporated to dryness under a stream of nitrogen at 40 ◦C. The dried thin filmof OTA was heated for 1–30 min at temperatures of 120, 150, 180, 210, 240, and 260 ◦C, respectively.Subsequently, the samples were dissolved in 1 mL methanol/water/formic acid (63/37/0.15, (v/v/v)) andanalyzed by HPLC-FLD for OTA and 2′R-OTA.
4.3. Sample Collection
European coffee samples were obtained from retail markets in France and Germany (and producedby industrial coffee roasting companies). The coffee samples originating from Guatemala were collectedfrom small local markets and produced by local coffee roasters. Cocoa beans and nibs were providedas a gift from August Storck KG, Berlin, Germany. Other food samples reported in Table 1 werecommercial products bought from retail markets in Germany.
4.4. Sample Preparation
Food samples were analyzed as described in literature with slight modifications [21,38]. To 5.00 gof homogenized ground coffee sample, 100 mL methanol/3% NaHCO3-solution (1/1, v/v) and 50 μLof a solution containing 100 ng/mL d5-OTA and 50 ng/mL d5-2′R-OTA in methanol were added.The mixture was extracted for three minutes using an Ultra-Turrax T25 mixer (IKA, Staufen, Germany)at a rotation speed of 9500 min−1. The obtained suspension was filtered through a 150 mm 3 HWfolded filter (Sartorius-Stedim Biotech, Göttingen, Germany) and 5.00 mL of the filtrate were dilutedwith 45 mL phosphate-buffered saline (PBS) pH 7.4 (8 g NaCl, 1.2 g Na2HPO4, 0.2 g KCl, and 0.2 gKH2PO4 dissolved in 1 L H2O) before purification using an OchraTest WB (VICAM, available via KlausRuttmann, Hamburg, Germany) immunoaffinity column (IAC). After loading the IAC with the sample,the column was washed with 10 mL PBS and 10 mL water. OTA, 2′R-OTA, and DC-OTA were elutedwith 2 mL methanol according to the protocol of the IAC manufacturer. The eluate was evaporated todryness under a stream of nitrogen at 40 ◦C and reconstituted in 250 μL methanol/water/formic acid(60/40/0.1, v/v/v).
4.5. Recovery Rate
For the determination of the recovery rate, a coffee sample containing only traces of OTA and2′R-OTA was fortified with three different concentrations of OTA (0.5, 2, and 8 μg/kg) and 2′R-OTA
91

Toxins 2019, 11, 329
(0.4, 0.7, and 1.4 μg/kg) before analysis. To that end, aliquots of a standard solution of OTA and 2′R-OTAin acetonitrile were added to the homogenized sample and the solvent was allowed to evaporatefor 2 h before extraction. The recovery rates were determined in duplicate and were 104.4 ± 4.0%,102.9 ± 4.5%, and 103.9 ± 3.8% for 0.5, 2, and 8 μg/kg OTA and 106.0 ± 0.0%, 109.9 ± 11.2%, and 99.4 ±3.8% for 0.4, 0.7, and 1.4 μg/kg 2′R-OTA, respectively.
4.6. Calibration
For HPLC-MS/MS experiments, an external seven-point calibration of OTA and 2′R-OTA withinternal standards d5-OTA (1 ng/mL) and d5-2′R-OTA (0.5 ng/mL) in a concentration range from 0.1 to10 ng/mL was used for quantification. The limit of detection (LOD) and the limit of quantification(LOQ) were determined by the signal-to-noise ratios 3 and 9, respectively. For OTA and 2′R-OTA, theLOQ was 0.1 ng/mL and the LOD was 0.03. For the HPLC-FLD experiments, a five-point calibration ofOTA, 2′R-OTA (concentration range from 0.10 to 10.0 ng/mL), DC-OTA, and OTα-amide (concentrationrange from 0.05 to 2.00 ng/mL) was used for quantification. Samples exceeding the calibration rangewere diluted with methanol/water/formic acid (60/40/0.1, v/v/v) by an appropriate factor and reanalyzed.For all samples, calibration curves with correlation coefficient r2 > 0.95 were calculated.
4.7. HPLC-MS/MS
An Agilent 1100 series HPLC (Agilent Technologies, Waldbronn, Germany) was coupled with anAPI 4000 QTRAP mass spectrometer (Sciex, Darmstadt, Germany) operated in electrospray ionization(ESI) positive mode with an ionization voltage of 5500 V. Data acquisition and quantification wascarried out with the Analyst 1.6.2 software (Sciex). Chromatographic separation was achieved on aNucleodur C18 Isis (150 × 2.0 mm; 5 μm) column with a 5 x 2 mm guard column of the same material(Macherey-Nagel, Düren, Germany) using a binary gradient at a flow rate of 0.3 mL/min. Methanolcontaining 0.1% formic acid was used as solvent A and water containing 0.1% formic acid as solvent B.The following linear gradient was used: 0 min 60% A, 1 min 60% A, 10 min 100% A, 10 min 100% A.The injection volume was 50 μL. The mass spectrometer was operated in selected reaction monitoringmode (SRM) with Gas 1 (nebulizer) set to 35 psi and Gas 2 (drying gas) set 350 ◦C and 45 psi. Nitrogenserved as the Curtain gas (20 psi). The following transition reactions were monitored for 100 mseach (declustering potential (DP), collision energy voltage (CE), and collision cell exit potential (CXP)are given in brackets): OTA and 2′R-OTA: quantifier m/z 404.2→239.1 (DP 60 V, CE 33 V, CXP 14 V)and qualifier m/z 404.2→221.0 (DP 60 V, CE 50 V, CXP 15 V); d5-OTA and d5-2′R-OTA: quantifier m/z409.2→239.1 (DP 60 V, CE 33 V, CXP 14 V), and quantifier m/z 409.2→221.0 (DP 60 V, CE 50 V, CXP 15 V).
4.8. HPLC-FLD
Samples of the degradation experiments were analyzed with HPLC Germany coupled to afluorescence detector (X-LC, FP-2020 Plus, Jasco GmbH, Groß-Umstadt). Separation was achievedat 40 ◦C on a ReproSil-Pur C18-AQ (150 × 4.0 mm; 3 μm) column (Dr. Maisch GmbH, Ammerbuch,Germany) under isocratic conditions using a solvent mixture of methanol/water/formic acid (63/37/0.1,v/v/v) at a flow rate of 0.7 mL/min. The fluorescence detector was operated at an excitation wavelengthof 330 nm and emission wavelength of 460 nm. The injection volume was 5 μL.
Author Contributions: Conceptualization, B.C., F.S. and H.-U.H.; investigation, F.S., O.T., V.H. and J.S.; resources,O.T. and H.-U.H.; writing—original draft preparation, F.S.; writing—review and editing, B.C. and H.-U.H.;supervision, B.C. and H.-U.H.; project administration, H.-U.H.; funding acquisition, B.C. and H.-U.H.
Funding: This research was funded by Deutsche Forschungsgemeinschaft (HU 730/10-2).
Acknowledgments: The authors thank Rolf Geisen for providing A. westerdijkiae BFE 1115.
Conflicts of Interest: The authors declare no conflict of interest.
92

Toxins 2019, 11, 329
References
1. European Commission. Assessment of dietary intake of ochratoxin A by the population of EU MemberStates. Report of the Scientific Cooperation, Task 3.2.7 Directorate-General Health and ConsumerProtection, European Commission. Available online: https://ec.europa.eu/food/sites/food/files/safety/docs/cs_contaminants_catalogue_ochratoxin_task_3-2-7_en.pdf (accessed on 5 June 2019).
2. Karlovsky, P.; Suman, M.; Berthiller, F.; De Meester, J.; Eisenbrand, G.; Perrin, I.; Oswald, I.P.; Speijers, G.;Chiodini, A.; Recker, T.; et al. Impact of food processing and detoxification treatments on mycotoxincontamination. Mycotoxin Res. 2016, 32, 179–205. [CrossRef] [PubMed]
3. Caridi, A.; Sidari, R.; Pulvirenti, A.; Meca, G.; Ritieni, A. Ochratoxin A adsorption phenotype: An inheritableyeast trait. J. Gen. Appl. Microbiol. 2012, 58, 225–233. [CrossRef] [PubMed]
4. Vidal, A.; Sanchis, V.; Ramos, A.J.; Marín, S. Stability of DON and DON-3-glucoside during baking as affectedby the presence of food additives. Food Add. Contam. A 2018, 35, 529–537. [CrossRef]
5. Vidal, A.; Marín, S.; Morales, H.; Ramos, A.J.; Sanchis, V. The fate of deoxynivalenol and ochratoxin A duringthe breadmaking process, effects of sourdough use and bran content. Food Chem. Toxicol. 2014, 68, 53–60.[CrossRef] [PubMed]
6. Wu, Q.; Kuca, K.; Humpf, H.U.; Klímová, B.; Cramer, B. Fate of deoxynivalenol and deoxynivalenol-3-glucoside during cereal-based thermal food processing: a review study. Mycotoxin Res. 2017, 33, 79–91.[CrossRef] [PubMed]
7. Seefelder, W.; Knecht, A.; Humpf, H.U. Bound fumonisin B-1: Analysis of fumonisin-B-1 glyco and aminoacid conjugates by liquid chromatography-electrospray ionization-tandem mass spectrometry. J. Agric.Food Chem. 2003, 51, 5567–5573. [CrossRef] [PubMed]
8. Bretz, M.; Beyer, M.; Cramer, B.; Knecht, A.; Humpf, H.-U. Thermal degradation of the Fusarium mycotoxindeoxynivalenol. J. Agric. Food Chem. 2006, 54, 6445–6451. [CrossRef] [PubMed]
9. Scudamore, K.A.; Banks, J.; Macdonald, S.J. Fate of ochratoxin A in the processing of whole wheat grainsduring milling and bread production. Food Addit. Contam. 2003, 20, 1153–1163. [CrossRef] [PubMed]
10. Scudamore, K.A.; Banks, J.N.; Guy, R.C.E. Fate of ochratoxin A in the processing of whole wheat grain duringextrusion. Food Addit. Contam. 2004, 21, 488–497. [CrossRef]
11. Castells, M.; Pardo, E.; Ramos, A.J.; Sanchis, V.; Marín, S. Reduction of ochratoxin A in extruded barley meal.J. Food Prot. 2006, 69, 1139–1143. [CrossRef] [PubMed]
12. Lee, H.J.; Kim, S.; Suh, H.J.; Ryu, D. Effects of explosive puffing process on the reduction of ochratoxin A inrice and oats. Food Control 2019, 95, 334–338. [CrossRef]
13. Blanc, M.; Pittet, A.; Munoz-Box, R.; Viani, R. Behavior of ochratoxin A during green coffee roasting andsoluble coffee manufacture. J. Agric. Food Chem. 1998, 46, 673–675. [CrossRef] [PubMed]
14. Suarez-Quiroz, M.; de Louise, B.; Gonzalez-Rios, O.; Barel, M.; Guyot, B.; Schorr-Galindo, S.; Guiraud, J.-P.The impact of roasting on the ochratoxin A content of coffee. Int. J. Food. Sci. Technol. 2005, 40, 605–611.[CrossRef]
15. Van der Stegen, G.H.D.; Essens, P.J.M.; van der Lijn, J. Effect of roasting conditions on reduction of ochratoxinA in coffee. J. Agric. Food Chem. 2001, 49, 4713–4715. [CrossRef] [PubMed]
16. Castellanos-Onorio, O.; Gonzalez-Rios, O.; Guyot, B.; Fontana, T.A.; Guiraud, J.P.; Schorr-Galindo, S.;Durand, N.; Suárez-Quiroz, M. Effect of two different roasting techniques on the ochratoxin A (OTA)reduction in coffee beans (Coffea arabica). Food Control 2011, 22, 1184–1188. [CrossRef]
17. Oliveira, G.; da Silva, D.M.; Alvarenga Pereira, R.G.; Paiva, L.C.; Prado, G.; Batista, L.R. Effect of differentroasting levels and particle sizes on ochratoxin A concentration in coffee beans. Food Control 2013, 34, 651–656.[CrossRef]
18. Studer-Rohr, I.; Dietrich, D.R.; Schlatter, J.; Schlatter, C. The occurrence of ochratoxin A in coffee. Food Chem.Toxicol. 1995, 33, 341–355. [CrossRef]
19. Tsubouchi, H.; Yamamoto, K.; Hisada, K.; Sakabe, Y.; Udagawa, S. Effect of roasting on ochratoxin A level ingreen coffee beans inoculated with Aspergillus ochraceus. Mycopathologia 1987, 97, 111–115. [CrossRef]
20. Bittner, A.; Cramer, B.; Humpf, H.U. Matrix binding of ochratoxin A during roasting. J. Agric. Food Chem.2013, 61, 12737–12743. [CrossRef]
21. Cramer, B.; Königs, M.; Humpf, H.-U. Identification and in vitro cytotoxicity of ochratoxin A degradationproducts formed during coffee roasting. J. Agric. Food Chem. 2008, 56, 5673–5681. [CrossRef]
93

Toxins 2019, 11, 329
22. Bittner, A.; Cramer, B.; Harrer, H.; Humpf, H.U. Structure elucidation and in vitro cytotoxicity of ochratoxinα amide, a new degradation product of ochratoxin A. Mycotoxin Res. 2015, 31, 83–90. [CrossRef] [PubMed]
23. IARC. Some Naturally Occurring Substances: Food Items and Constituents, Heterocyclic Aromatic Amines andMycotoxins; Monographs on the Evaluation of Carcinogenic Risks to Humans; IARC: Lyon, France, 1993.
24. Malir, F.; Ostry, V.; Pfohl-Leszkowicz, A.; Malir, J.; Toman, J. Ochratoxin A: 50 years of research. Toxins 2016,8, 191. [CrossRef] [PubMed]
25. Ostry, V.; Malir, F.; Toman, J.; Grosse, Y. Mycotoxins as human carcinogens—the IARC Monographsclassification. Mycotoxin Res. 2017, 33, 65–73. [CrossRef] [PubMed]
26. Rottkord, U.; Röhl, C.; Ferse, I.; Schulz, M.C.; Rückschloss, U.; Gekle, M.; Schwerdt, G.; Humpf, H.U.Structure–activity relationship of ochratoxin A and synthesized derivatives: Importance of amino acid andhalogen moiety for cytotoxicity. Arch. Toxicol. 2017, 91, 1461–1471. [CrossRef] [PubMed]
27. Cramer, B.; Harrer, H.; Nakamura, K.; Uemura, D.; Humpf, H.-U. Total synthesis and cytotoxicity evaluationof all ochratoxin A stereoisomers. Bioorg. Med. Chem. 2010, 18, 343–347. [CrossRef] [PubMed]
28. Valenta, H. Chromatographic methods for the determination of ochratoxin A in animal and human tissuesand fluids. J. Chromatogr. A 1998, 815, 75–92. [CrossRef]
29. Duarte, S.C.; Pena, A.; Lino, C.M. Human ochratoxin A biomarkers-from exposure to effect. Crit. Rev. Toxicol.2011, 41, 187–212. [CrossRef]
30. Studer-Rohr, I.; Schlatter, J.; Dietrich, D.R. Kinetic parameters and intraindividual fluctuations of ochratoxinA plasma levels in humans. Arch. Toxicol. 2000, 74, 499–510. [CrossRef]
31. Cramer, B.; Osteresch, B.; Munoz, K.A.; Hillmann, H.; Sibrowski, W.; Humpf, H.U. Biomonitoring usingdried blood spots: Detection of ochratoxin A and its degradation product 2′R-ochratoxin A in blood fromcoffee drinkers. Mol. Nutr. Food Res. 2015, 59, 1837–1843. [CrossRef]
32. European Commission. Commission Regulation (EC) No 1881/2006 of 19 December 2006 setting maximumlevels for certain contaminants in foodstuffs. Off. J. Eur. Union 2006, L 364, 5–24.
33. Viegas, S.; Osteresch, B.; Almeida, A.; Cramer, B.; Humpf, H.U.; Viegas, C. Enniatin B and ochratoxin A inthe blood serum of workers from the waste management setting. Mycotoxin Res. 2018, 34, 85–90. [CrossRef][PubMed]
34. Eggers, R.; Pietsch, A. Technology I: Roasting. Coffee—Recent developments. In Coffee Recent Developments;Clarke, R.J., Vietzthum, O.G., Eds.; Blackwell Science: London, UK, 2001; pp. 90–116.
35. Durand, N.; Duris, D.; Fontana, A.; Castellanos-Onorio, O.; Suarez-Quiroz, M.; Schorr-Galindo, S. Effects ofpost-harvest and roasting treatments on Ochratoxine A levels in coffee: A review paper. Cahiers Agric. 2013,22, 195–201. [CrossRef]
36. Prince, S.; Kussin, R.; Fruhling, R.; Harris, M. Ultrafast Roasted Coffee. U.S. Patent 4,988,590, 29 January 1991.37. Kuchenbuch, H.S.; Becker, S.; Schulz, M.; Cramer, B.; Humpf, H.-U. Thermal stability of T-2 and HT-2
toxins during biscuit- and crunchy muesli-making and roasting. Food Add. Contam. A 2018, 35, 2158–2167.[CrossRef] [PubMed]
38. Pittet, A.; Tornare, D.; Huggett, A.; Viani, R. Liquid chromatographic determination of ochratoxin A in pureand adulterated soluble coffee using an immunoaffinity column cleanup procedure. J. Agric. Food Chem.1996, 44, 3564–3569. [CrossRef]
© 2019 by the authors. Licensee MDPI, Basel, Switzerland. This article is an open accessarticle distributed under the terms and conditions of the Creative Commons Attribution(CC BY) license (http://creativecommons.org/licenses/by/4.0/).
94

toxins
Article
The Influence of Processing Parameters on theMitigation of Deoxynivalenol duringIndustrial Baking
David Stadler 1, Francesca Lambertini 2, Lydia Woelflingseder 3, Heidi Schwartz-Zimmermann 1,
Doris Marko 3, Michele Suman 2, Franz Berthiller 1,* and Rudolf Krska 1,4
1 Institute of Bioanalytics and Agro-Metabolomics, Department of Agrobiotechnology (IFA-Tulln), Universityof Natural Resources and Life Sciences, Vienna (BOKU), Konrad-Lorenz-Str. 20, 3430 Tulln, Austria;[email protected] (D.S.); [email protected] (H.S.-Z.); [email protected] [email protected] (R.K.)
2 Barilla G. R. F.lli SpA, Advanced Laboratory Research, via Mantova 166, 43122 Parma, Italy;[email protected] (F.L.); [email protected] (M.S.)
3 Department of Food Chemistry and Toxicology, University of Vienna, Währingerstraße 38, 1090 Vienna,Austria; [email protected] (L.W.); [email protected] (D.M.)
4 Institute for Global Food Security, School of Biological Sciences, Queens University Belfast, University Road,Belfast BT7 1NN, Northern Ireland, UK
* Correspondence: [email protected]; Tel.: +43-1-47654-97371
Received: 13 May 2019; Accepted: 30 May 2019; Published: 4 June 2019
Abstract: Deoxynivalenol (DON), a frequent contaminant of flour, can be partially degraded bybaking. It is not clear: (i) How the choice of processing parameter (i.e., ingredients, leavening, andbaking conditions) affects DON degradation and thus (ii) how much DON can be degraded duringthe large-scale industrial production of bakery products. Crackers, biscuits, and bread were producedfrom naturally contaminated flour using different processing conditions. DON degradation duringbaking was quantified with the most accurate analytical methodology available for this Fusariumtoxin, which is based on liquid chromatography tandem mass spectrometry. Depending on theprocessing conditions, 0–21%, 4–16%, and 2–5% DON were degraded during the production ofcrackers, biscuits, and bread, respectively. A higher NaHCO3 concentration, baking time, and bakingtemperature caused higher DON degradation. NH4HCO3, yeast, vinegar, and sucrose concentrationas well as leavening time did not enhance DON degradation. In vitro cell viability assays confirmedthat the major degradation product isoDON is considerably less toxic than DON. This proves for thefirst time that large-scale industrial baking results in partial detoxification of DON, which can beenhanced by process management.
Keywords: mycotoxins; trichothecenes; thermal degradation; decontamination; mass spectrometry;food processing; detoxification; design of experiment; LC-MS/MS
Key Contribution: Deoxynivalenol (DON) can be partially detoxified during the industrial productionof bakery products. The detoxification of DON can be enhanced by process management.
1. Introduction
Deoxynivalenol (DON) is along with aflatoxins, fumonisins, ochratoxin A, and zearalenone, oneof the main mycotoxins of significance for human disease [1]. DON frequently contaminates cerealsand cereal-based products [2]. The population of the European Union (EU) is frequently exposed toDON mainly due to the consumption of bread and other bakery wares [2]. Therefore, the EuropeanCommission (EC) has set maximum levels for DON in milling products and bread/bakery wares of
Toxins 2019, 11, 317; doi:10.3390/toxins11060317 www.mdpi.com/journal/toxins95

Toxins 2019, 11, 317
750 μg/kg and 500 μg/kg, respectively [3]. This legislation follows the rationale that it is feasibleto reduce DON from flour during the production of bakery products by 33%. This assumption issupported by the recent report on the risk associated with DON in food by the European Food SafetyAuthority (EFSA) [2]. From 2007 to 2014, EFSA gathered occurrence data for the concentration of DONpresent in different food groups. For milling products, bread and rolls, and fine bakery wares, 4609,2837, and 975 data points, respectively, were collected from the EU member states. The mean and 95thpercentile concentrations of DON were 20–30% lower in bread and bakery wares (bread and rolls, finebakery wares) than in flour (milling products).
During baking, DON was found to degrade mainly to isoDON, but also to norDON B and norDONC [4–6]. norDON B and norDON C were found to be considerably less cytotoxic than DON [5]. isoDONwas found to have much lower inhibitory potency on the ribosome than DON, which is stronglyindicative of its overall lower toxicity [6].
The reduction of the DON concentration during baking can be due to formulation (i.e., the dilutioneffect due to mixing contaminated flour with non-contaminated ingredients) or due to degradation ofDON. The reduction due to formulation can be easily calculated from the percentage of flour of thefinished bakery product, assuming no additional sources of DON. The extent of the DON degradationduring baking, however, was reported to be very variable [2,7,8]. This high variation can be explainedby errors in the calculation of the amount of DON that was degraded (e.g., by not considering thedilution with other ingredients) and by not performing baking trials with a suitable number of replicates.Recently, we identified all degradation products of DON, formed during baking of crackers, biscuits,and bread, using a stable isotope labelling approach combined with high resolution mass spectrometryanalysis. After quantifying DON and all of its formed degradation products, we were able to providethe first comprehensive mass balance for those commodities [6].
In this current study, DON degradation during the production of crackers, biscuits, and bread fromflour fortified with DON was determined to be 6%, 5%, and 2%, respectively, based on the increase ofdegradation products. As this study was aimed at the elucidation of the degradation products that areformed during baking, the experiments were carried out under standard baking conditions. As a stepforward, the influence of the processing conditions should be evaluated. Furthermore, experimentswith naturally contaminated flour need to be conducted in order to reproduce the actual industrialstarting conditions in place during the large-scale production of bakery products.
The influence of different processing parameters on DON degradation during the production ofcrackers, biscuits, bread, and rusks was determined in previous studies [9–12]. Statistical evaluation ofthe DON concentration showed that baking temperature, baking time, and the concentration of theraising agent NaHCO3 influence the amount of DON in the final products. However, the statisticalmodels as well as the determination of the DON degradation may have suffered from the high analyticalvariability of the determination of the DON concentration.
We hypothesized that DON degradation during industrial baking is influenced by the choice ofprocessing parameter (i.e., ingredients, leavening, and baking conditions). Hence, the objectives of thisstudy were to: (i) Produce bakery products (crackers, biscuits, and bread) from naturally contaminatedflour using different processing conditions, (ii) determine DON degradation by LC-MS/MS basedquantification of the DON degradation products and iii) develop a statistical model which shows theinfluence of the processing parameters on the DON degradation. Due to the comprehensive bakingtrials in combination with the highly sensitive LC-MS/MS analysis and the consideration of all formeddegradation products, this study presents the most accurate report on the effect of industrial baking onDON degradation to date. Moreover, a first characterization of the cytotoxicity of isoDON, comparedto DON, is presented.
2. Results
To study the main processing factors affecting the mitigation of DON during industrial baking,crackers, biscuits, and bread were chosen as representative commodities of the main bakery categories
96

Toxins 2019, 11, 317
produced with very different technologies. A Design of Experiments (DoE) approach was appliedto set up the experimental trials. In agreement with results previously obtained by our researchgroup [9,10,12], the main technological parameters monitored were: (i) Baking conditions (i.e., timeand temperature), (ii) pH modifying agents (NaHCO3, NH4HCO3, and other minor ingredients) and(iii) leavening conditions (time, temperature, presence, and type of leavening agents). Each factor wasmodified within a range according to technological feasibility. Some conditions stressed the processover the organoleptic acceptability of the final product. These processing conditions were chosen topromote significant changes of the DON concentration in order to understand the impact of the appliedprocessing conditions. In the present work, all the food commodities were produced at a pilot plantlevel. As a starting point of the DoE approach, the same processing parameters as those on commonindustrial processing lines were chosen. Figure 1 exemplifies the influence of the baking conditions onthe final appearance of biscuits, bread and crackers.
Figure 1. Display of the influence of baking conditions on the appearance of biscuits (top), bread(middle) and crackers (bottom).
2.1. Incluence of Processing Parameters on DON Degradation during the Production of Bakery Products
For all three baking commodities, the results of the experimental trials were evaluated andpresented in two sub-chapters. First, the sum of the DON degradation products, which is the measurefor DON degradation, was shown as a bar graph. The individual experiments were listed according tothe processing parameters that were found to be important for DON degradation based on a visualassessment. In this way, Figures 2, 4, and 6 show the DON degradation that was achieved underthe specified processing conditions ranked from high to low DON degradation. These bar graphsgive a first impression of the DON degradation and the influence of the processing parameter forthe individual commodities. Second, to confirm and refine the conclusions of the visual assessment,a DoE model was built using the MODDE software tool. The outcome of this statistical analysis is
97

Toxins 2019, 11, 317
visualized by an effects plot which displays the change of the sum of the DON degradation productswhen a processing factor is varied from its lowest to its highest value (Figures 3, 5, and 7, top).The data set obtained from the DoE model was used to build a prediction model for the influence of theprocess parameter that led to a statistically significant increase of DON degradation. These predictivefactor plots show how DON degradation can be enhanced by the design of the production process(Figures 3, 5, and 9, bottom). To allow for the easy comparability of the results between the threebaking commodities, the same scaling was chosen for the individual graphs.
2.1.1. Biscuits
Biscuits, from the technological point of view, represent a quite simple bakery preparationcharacterized by a baking step and the use of raising agents. In order to monitor the impact of thesetwo factors on the DON content in the final products, a very basic recipe was chosen, containing onlyflour, oil, sugar, and water, with the addition of NaHCO3 and NH4HCO3 as leavening agents. Severalbatches of biscuits were prepared at different conditions according to the DoE inputs based on theScreening Interaction model. In the present study, the processing parameters NaHCO3 concentration,NH4HCO3 concentration, baking time, baking temperature, and sugar content were varied (Table S1).Due to the different production conditions, DON degradation varied between 4–16% (Figure 2).
Figure 2. Increase of the deoxynivalenol (DON) degradation products isoDON and norDONs A-Cduring the production of biscuits using different processing conditions. The increase was determined asa ratio of the molal concentration of the DON degradation products to the molal concentration of DONresulting from the natural contamination of the flour. The experimental trials were listed according tothe NaHCO3 concentration, baking temperature, and baking time. Error bars represent the processstandard deviation.
A higher DON degradation was observed in batches with a higher concentration of NaHCO3,baking temperature, and baking time. The variation of the processing parameter also led to a changedratio of the degradation products with the main degradation products being norDON B and C, insteadof isoDON, for experiments with a higher baking temperature and baking time. norDON A, whichwas not found to be a degradation product in our previous study [6], was found only at processingconditions that lead to higher DON degradation.
The DoE model confirmed that the main factors affecting DON degradation were: (i) The quantityof NaHCO3 used, (ii) the baking temperature, and (iii) the baking time (Figure 3, top). In addition, thestatistical model indicates that a synergistic effect of baking temperature and time exists. Changesin NH4HCO3 and sucrose concentration did not significantly influence DON degradation products.
98

Toxins 2019, 11, 317
The prediction model for the influence of the processing parameter on DON degradation revealedthat by increasing the NaHCO3 concentration from 0.2 to 0.6%, DON degradation is increased by5% (Figure 3, bottom). An increase in baking temperature and time is predicted to enhance DONdegradation by about 2%.
Figure 3. Top: Effects plot, which shows the change of the sum of the DON degradation products whena processing factor is varied from its lowest to its highest value and all other factors are kept at theiraverages, which was obtained for the design of the experiment (DoE) data set in pilot-scale biscuitmaking experiments. Error bars represent the confidence interval corresponding to a 95% confidencelevel. “*” between two processing factors indicates a synergistic effect, which cannot be explainedsolely by addition of degradation caused by the two parameters individually. Bottom: Predictive factoreffect plots, which show the influence of the following processing parameters on the deoxynivalenol(DON) degradation during the biscuit production: (i) NaHCO3 (left), (ii) baking temperature (middle),and (iii) baking time (right). The dotted lines represent the confidence interval corresponding to a 95%confidence level.
2.1.2. Bread
Bread is surely the most representative and most studied commodity of soft bakery products.Its production workflow implies dough fermentation before baking. Both fermentation and subsequentbaking can be managed for time and temperature. The fermentation phase can also be modulated
99

Toxins 2019, 11, 317
for relative humidity conditions, yeast, bakery improvers, raising agents, and pH. As a consequence,the number of factors to investigate for assessing potential DON mitigation effects was quite high.Therefore, in comparison to biscuits and crackers, more pilot plant trials had to be carried out. Based onliterature data and our experience, the following variables were taken into account for the DoE approach:Baking temperature, baking time, leavening time, yeast, sucrose, and cider vinegar concentration. Eachfactor was varied within a range defined according to technological feasibility (Table S4). Dependingon the processing parameter, DON degradation varied from 2–5% (Figure 4).
Figure 4. Increase of the deoxynivalenol (DON) degradation products isoDON and norDONs B-Cduring the production of bread using different processing conditions. The increase was determinedas a ratio of the molal concentration of the DON degradation products to the molal concentrationof DON resulting from the natural contamination of the flour. The experimental trials were listedaccording to baking temperature, baking time, and sucrose concentration. Error bars represent theprocess standard deviation.
During the bread production, the achievable DON degradation was found to be low compared tothe biscuit and cracker production. Although the influence was small, we found that the baking timeand temperature as well as the sucrose concentration impacted the DON concentrations. The DoEmodel confirmed that the main factors influencing DON degradation were: (i) Baking time, (ii) baking
100

Toxins 2019, 11, 317
temperature, and (iii) sucrose concentration (Figure 5, top). Changes in cider vinegar and yeastconcentration as well as the leavening time did not influence DON degradation. The prediction modelconfirmed that changes in the processing parameter have only a minor effect of approximately 2% onDON degradation (Figure 5, bottom).
Figure 5. Top: Effects plot, which shows the change of the sum of the DON degradation productswhen a processing factor is varied from its lowest to its highest value and all other factors are kept attheir averages, which was obtained for the design of the experiment (DoE) data set in pilot-scale breadmaking experiments. Error bars represent the confidence interval corresponding to a 95% confidencelevel. Bottom: Predictive factor effect plots, which show the influence of the following processingparameters on the deoxynivalenol (DON) degradation during the biscuit production: (i) Baking time(left), (ii) baking temperature (middle), and (iii) sucrose concentration (right). The dotted lines representthe confidence interval corresponding to a 95% confidence level.
2.1.3. Crackers
Crackers were chosen as being representative of a complex baking commodity involving differenttechnological aspects and combining several factors which were demonstrated to affect DON mitigationin the previous experiments carried out on biscuits and bread. Among the cracker making parameters,the following conditions were considered as factors in the experimental design: Baking time, bakingtemperature, acidic mother content, and NaHCO3 concentration. For this trial, each factor was varied
101

Toxins 2019, 11, 317
within a range defined according to technological feasibility (Table S7). During the cracker production,the DON degradation varied from 0–21%, depending on the choice of processing parameters (Figure 6).
Figure 6. Increase of the deoxynivalenol (DON) degradation products isoDON and norDONs A-Cduring the production of crackers using different processing conditions. The increase was determinedas a ratio of the molal concentration of the DON degradation products to the molal concentrationof DON resulting from the natural contamination of the flour. The experimental trials were listedaccording to the NaHCO3 concentration, baking time, and baking temperature. Error bars representthe process standard deviation.
A high DON degradation was observed in experiments with a high NaHCO3 concentration,baking time, and baking temperature. Similar to the biscuit production, the variation of the processingparameter caused a change in the ratio of the degradation products. The DoE model revealed thatNaHCO3 concentration and baking time were the main factors affecting DON degradation (Figure 7,top). In addition, the statistical model indicated that a synergistic effect of baking time and NaHCO3
concentration exists. The acidic mother concentration, leavening time, and baking temperature didnot affect DON degradation. The prediction model revealed the potential DON reduction that can beachieved by process management (Figure 7, bottom). An increase of the NaHCO3 concentration from 0to 1% is predicted to increase DON degradation by 10%. Similarly, the increase of baking time from 1to 6 min is predicted to increase DON degradation by 10%.
102

Toxins 2019, 11, 317
Figure 7. Top: Effects plot, which shows the change of the sum of the DON degradation productswhen a processing factor is varied from its lowest to its highest value and all other factors are kept attheir averages, which was obtained for the design of the experiment (DoE) data set in pilot-scale breadmaking experiments. Error bars represent the confidence interval corresponding to a 95% confidencelevel. “*” between two processing factors indicates a synergistic effect, which cannot be explainedsolely by addition of degradation caused by the two parameters individually. Bottom: Predictive factoreffect plots, which show the influence of the following processing parameters on the deoxynivalenol(DON) degradation during the biscuit production: (i) NaHCO3 concentration (left) and (ii) baking time(right). The dotted lines represent the confidence interval corresponding to a 95% confidence level.
2.2. Cytotoxic Effects of isoDON
The cytotoxic potential of isoDON in direct comparison to DON was evaluated in two differenthuman colon cell lines (Figure 8).
103

Toxins 2019, 11, 317
Figure 8. Cell viability of human colorectal adenocarcinoma cells (HT-29) (left) and non-tumorigenichuman colon epithelial cells (HCEC) (right) after 24 h of incubation with different concentrations ofdeoxynivalenol (DON) and isoDON. The concentration at which cell viability was reduced by 30%(IC30) was calculated from a dose response curve fitted to the individual data points (×).
Usually, the half maximal inhibitory concentration (IC50) is used to compare the potency of twosubstances. As the highest tested isoDON concentrations did not reduce cell viability by 50% underall tested conditions, IC30 values where cell viability was reduced by 30% were used instead. For thehuman colorectal adenocarcinoma cell line HT-29 the following IC30 values were determined: 1.9 μM(DON) and 91 μM (isoDON), whereas for the non-tumorigenic human colon epithelial cells (HCEC)the following IC30 values were identified: 0.4 μM (DON) and 53 μM (isoDON). In both cell viabilityassays, isoDON was much less potent (factor 48 and 133 for HT-29 and HCEC, respectively) in reducingcellular viability compared to DON.
3. Discussion
3.1. Influence of Different Processing Parameters on DON Degradation in Bakery Products
3.1.1. The pH Value of the Dough
As DON has been reported to be unstable in alkaline solutions, the pH of the dough is clearly animportant processing factor to consider when designing a production process that is optimized for ahigh DON degradation [13]. For the production of biscuits and crackers, the pH of the dough wasregulated primarily by chemical raising agents. We found that the type of the chemical raising agent aswell as its concentration was crucial regarding DON degradation. Whereas the use of NaHCO3 ledto higher DON degradation, the use of NH4HCO3 did not influence DON concentration. This canbe explained by the different pH values of the dough resulting from the different chemical natureof the raising agents. Gökmen et al. prepared cookies from two different doughs containing 0.7%NaHCO3 and NH4HCO3, respectively [14]. When NaHCO3 was used, the pH was initially 8.5 andincreased slightly during baking to pH 9. In the absence of acidic compounds, NaHCO3 is thermallyconverted to Na2CO3, H2O and CO2 (Equation (1)). As CO3
2− is a stronger base than HCO3−, the
thermal degradation of NaHCO3 leads to an increase of the ph. The use of NH4HCO3 as a leaveningagent led to a decrease of the pH from 8 in the dough to 6–7 in the baked cookies. The decrease of pHcan be explained by the degradation of NH4HCO3 to NH3, CO2 and H2O, which evaporate duringbaking (Equation (2)).
2 NaHCO3 → Na2CO3 + H2O + CO2 (1)
NH4HCO3 → NH3 + H2O + CO2 (2)
104

Toxins 2019, 11, 317
Besides chemical raising agents, further ingredients were shown to affect the pH of the dough.High pH values due to the presence of NaHCO3 were only observed when sucrose was used assugar. At a higher pH, sucrose was not hydrolyzed and thereby did not cause a change in pH [14].When glucose was used, it was partially hydrolyzed to fructose resulting in a decrease of the pH from8.5 in the dough to 6–7 in the baked cookies. This can be rationalized by the report of Feng et al. whocalculated the pKa values for glucose and fructose [15]. Fructose was shown to be considerably moreacidic (pKa 12) compared to glucose (pKa 14). In the presence of an acid, NaHCO3 was converted toCO2 which caused a decrease of the pH (Equation (3)).
NaHCO3 + H+→ Na+ + H2O + CO2 (3)
For the biscuit production, our results confirm the outcome of a previous study, where theNaHCO3 concentration was the main factor that enhanced DON degradation [9]. For the crackerproduction, our results contradict a previous report in which baking temperature and time were foundto be of higher importance compared to the NaHCO3 concentration. However, in the previous study,fewer experimental trials were carried out and the accuracy of the analytical methodology was lower.
3.1.2. Baking Conditions
For all three commodities, the baking conditions (i.e., temperature and/or time) influenced DONdegradation. However, for the production of biscuits and crackers, baking conditions were lessimportant compared to the pH of the dough. For the production of crackers and bread, baking timewas found to be more important than baking temperature. The contrary was observed for biscuitproduction. The reason for this observation might relate to differences in moisture content and surfaceto volume ratio of the individual baking commodities.
3.1.3. Ratio of the DON Degradation Products
For the production of biscuits and crackers, the ratio of the DON degradation products shiftedfrom isoDON to norDON B and C in the experiments that led to high DON degradation. This supportsthe proposed mechanism, that isoDON is further converted to norDON B and C [13]. Some bakingconditions led to the formation of norDON A. Most likely, the reason why norDON A was not detectedin a previous study was a higher limit of detection (LOD) and limit of quantification (LOQ) for norDONA compared to isoDON, norDON B and C in the analytical method used [6]. Interestingly, the formationof norDON A was not observed in the experiments with the highest DON degradation (i.e., biscuits:N4, N16; crackers: N11, N12, N15, N16) in total. This might have been due to an initial formation ofisoDON, which was further degraded into norDON A and finally to norDON B or norDON C.
3.2. Toxicity of the DON Degradation Products
For a comprehensive assessment of the health risks of eating bakery products produced from DONcontaminated flour, the toxicity of all degradation products has to be determined. So far, norDONsA–C were shown to be considerably less cytotoxic than DON [5]. In comparison to DON, isoDON wasfound in in vitro translation assays to have a considerably lower potency (factor 94 and 60 in wheatand rabbit ribosomes, respectively) to inhibit translation, known to be the major mechanism of toxicityof trichothecenes [6]. As the 60S subunit binding site of ribosomes is the main molecular target ofDON, the results of the translation assay were indicative of considerably lower cytotoxicity [16,17].However, various aspects, such as different cellular absorption, changes in distribution, and especiallydifferences in fitting into the pockets of the ribosomal A-site due to changes in polarity might lead tosignificant differences in cytotoxicity of isoDON and DON. Therefore, the cytotoxic effects of isoDONin comparison to DON were evaluated.
105

Toxins 2019, 11, 317
Cytotoxic Effects of isoDON
Performing cell viability assays in two different human colon cell lines, we found that isoDONinduced significantly less cytotoxicity compared to DON in HCEC and HT-29 cells. In Figure 9, thestructures of DON and isoDON, showing structural differences at the carbon atoms C-7 to C-10 of thetrichothecene backbone, are displayed.
Figure 9. Structure of iso-deoxynivalenol (isoDON) (left) and DON (right). The C-7 to C-10 atoms ofthe trichothecene backbone are highlighted.
Our findings are supported by structure activity relationships which have been conducted forvarious trichothecenes [18–20]. The absence of a double bond at the C-9 and C-10 position, which is thecase for isoDON, led to a significant decrease in both inhibition of protein biosynthesis and cytotoxicity.Although the toxicity of DON is often ascribed to the epoxide moiety, we could provide additionalproof that a double bond between C-9 and C-10 is an essential structural feature for ribosomal inhibitionand thus, for trichothecene-induced toxicity.
4. Conclusions
Depending on the processing conditions, 0–21%, 4–16%, and 2–5% of DON were degradedduring the production of crackers, biscuits, and bread, respectively. For biscuits and crackers, DONdegradation can be increased by 10–20% by process management. For bread, process managementcan lead to a minor increase in DON degradation of about 3%. DON degradation was enhanced by ahigh NaHCO3 concentration, baking time, and temperature. The processing parameters NH4HCO3,yeast, cider vinegar, acidic mother content, and sucrose concentration as well as leavening time did notinfluence DON concentration.
To put our findings in context to the results reported in recent literature, a graphical summary ispresented in Figure 10.
Figure 10. Comparison between the deoxynivalenol (DON) degradation reported in recent literaturestudies [10–12,21–29] and the DON degradation values determined in this study under differentprocessing conditions. Each dot represents one baking experiment.
106

Toxins 2019, 11, 317
Compared to previous studies found in the literature, we achieved a much narrower range ofDON degradation, which was most pronounced for bread. The reason for that is most likely that weapplied the currently most accurate analytical methodology to determine DON degradation [6].
To gain further knowledge about the toxicity of DON degradation products, the cytotoxicityof isoDON was evaluated by performing in vitro cell viability assays. isoDON was found to beconsiderably less cytotoxic (factor 48 and 133 for HT-29 and HCEC cells, respectively) compared toDON. As all DON degradation products are considerably less cytotoxic than DON, we conclude thatDON degradation during baking results in a lower toxicity. Thus, for the first time, we have presentedproof that baking under real industrial conditions can lead to a partial detoxification of DON.
5. Materials and Methods
5.1. Chemicals and Reagents
Acetonitrile (ACN, gradient grade) was purchased from VWR International GmbH (Vienna,Austria). Acetic acid (LC–MS gradient grade) was obtained from Sigma Aldrich (Vienna, Austria).In all experiments, ultra-pure water (purified by a Purelab Ultra system ELGA LabWater, Celle,Germany) was used. Liquid calibrant solutions of DOM-1, DON-3-Glc, DON, and U-[13C15]-DON weresupplied by Romer Labs GmbH (Tulln, Austria). Reference standards of the DON degradation productsisoDON and norDONs A, B and C were synthesized according to published procedures [5,6,21,30].
5.2. Preparation of Bakery Products
The food commodities used in the present study were produced from naturally contaminatedflour according to the procedure previously described by our group by applying a suitable scaling upfactor of the starting ingredients that fits with the production under pilot plant facilities [6].
Biscuits: The final dough (3000 g, 14% moisture content (MC)) was used to form the individualbiscuits (approximately 11 g each) which consisted of 56 wt % flour, 40 wt % fat and sugar, and4 wt % water.
Bread: The final dough (8000 g, 14% MC) was used to form the individual loafs of 450 g each (40%MC), that reached a final weight of 400 g and consisted of 65 wt % flour, yeast, oil, and salt and 35 wt %water after baking.
Crackers were shaped (approximately 10 g each) from the final dough (4127 g, 26% MC) and theyconsisted of 97 wt % flour, yeast, and malt extract and 3 wt % water.
5.3. Design of Experiment (DoE) Setup and Statistical Evaluation
Design of Experiments (DoE) was used to determine the influence of processing parameters onthe degradation of DON and the increase of its degradation products during the baking of crackers,biscuits, and bread from naturally contaminated flour. The screening interaction model was chosenand processing parameters that we hypothesized to influence DON degradation were used as modelquantitative factors. Table 1 provides a list of the processing parameters that were investigated in ourstudy. For more detailed information on the processing parameters used in the individual experiments,the reader is referred to Tables S1, S4, and S7.
To focus the attention on the increase of DON degradation products during baking, multivariatedata analysis was performed on the concentration (μg/kg) obtained by LC/MS-MS analysis in thefinished products of the sum of DON degradation products. DoE set up and data elaboration werecarried out by using MODDE software 11 (Umetrics, Umea, Sweden).
107

Toxins 2019, 11, 317
Table 1. Processing parameters that were investigated for their impact on the degradation ofdeoxynivalenol during the production of bakery products from naturally contaminated flour underpilot plant conditions.
Condition Biscuits Bread Crackers
Sucrose concentration [%] 12.5 to 17.5 0.41 to 1.41 -NH4HCO3 concentration [%] 0.21 to 0.61 - -NaHCO3 concentration [%] 0.19 to 0.59 - 0.00 to 0.96Vinegar concentration [%] - 0.00 to 0.36 -
Yeast concentration [%] - 0.83 to 1.33 -Leavening time [%] - 70 to 100 -Acidity Mother [%] - - 0.65 to 1.65Baking time [min] 7 to 11 15 to 29 1 to 6
Baking temperature [◦C] 160 to 200 185 to 225 230 to 250
Total experiments 19 38 20
5.4. Analysis of the Samples
To determine DON degradation during the industrial baking process, the concentrations of DONand its degradation products (i.e., isoDON, norDON B, and norDON C) were analyzed in naturallycontaminated flour and the products made thereof. Additionally, the concentration of the suspectedDON degradation and conversion products DON-3-glucoside, DOM-1 and norDON A was monitored.Sample preparation and analysis are discussed in detail elsewhere [6]. In brief, 5.00 ± 0.01 g of groundand homogenized sample was extracted with 20.0 mL of ACN:H2O, 84:16, v:v. A total of 200 μL ofsample extract were dried down and reconstituted in 100 μL of water. Subsequently, the concentratedsample extracts were centrifuged at 10 ◦C and 4500 rpm for 10 min. Four μL aliquots of the concentratedsample extract were injected together with 0.4 μL of internal standard into the HPLC system. Eachsample was worked-up once and injected in duplicate. The analytical method used for the analysiswas based on LC-MS/MS and was validated for recovery, repeatability, LOD, and LOQ. All resultswere corrected for the recovery factor determined in the validation study [6]. The concentration ofthe analytes that was found in naturally contaminated flour and in the finished bakery products canbe found in Table S2 and S3 (biscuits), Table S5 and S6 (bread), and Table S8 and S9 (crackers) of theSupplementary Material, respectively.
5.5. Calculation of the DON Degradation
The sum of the DON degradation products was shown to be a much more accurate measure ofthe DON degradation than the change of the DON content itself [6]. Therefore, the DON degradationwas calculated based on the increase of its degradation products isoDON and norDONs A–C. As theflour used for the production of the bakery products was naturally contaminated with the degradationproducts at different concentration levels, the increase of the degradation products was calculatedseparately before being summed up to obtain the final DON degradation.
5.6. Calculation of the Increase of the DON Degradation Products Due to Baking
For the production of bakery products from naturally contaminated flour, the increase of thedegradation products was calculated according to:
dilution f actor =m f lour
mbakery product
banalyte,dilution o f nat.cont. f lour = banalyte, f lour ∗ dilution f actor
Change due to baking =banalyte, bakery product − banalyte,dilution o f nat.cont. f lour
bDON,dilution o f nat.cont. f lour
108

Toxins 2019, 11, 317
First, the dilution factor, which describes the mass ratio of naturally contaminated flour present inthe finished bakery product, was determined. The dilution factor was 0.97 (crackers), 0.56 (biscuits),and 0.65 (bread), respectively. Second, the theoretical molal concentration b (mol/kg) of the analyteresulting from the dilution of the flour by the addition of other ingredients (banalyte,dilution o f nat.cont. f lour)was determined. Finally, the molal concentration of an analyte resulting from the natural contaminationof the flour was subtracted from the molal concentration of the analyte in the bakery product(banalyte, bakery product) and expressed as a fraction of the molal concentration of DON resulting from thenatural contamination of the flour. The result was the fraction of DON that is converted to DONdegradation products during the production of bakery products.
5.7. Estimation of the Process Standard Deviation
In each DoE, three center points were set, which means that three experiments were carried outunder identical processing conditions: Experiment number 17, 18 and 19 (crackers), 17, 18 and 19(biscuits) and 33, 34, 35 (bread), respectively. The process standard deviation was calculated for the sumof the change of the degradation products of the three replicates which were produced using the sameprocessing parameter. The process standard deviation was 0.9%, 1.4%, and 0.8% for crackers, biscuits,and bread, respectively, and thus considerably higher than the analytical standard deviation for thedetermination of the sum of the DON degradation products which was in the range of 0.2–0.4% [6].
5.8. Human Cell Culture
Human colorectal adenocarcinoma cells, HT-29, were purchased from the German Collectionof Microorganisms and Cell Cultures (DSMZ, Braunschweig, Germany). For cell culture Dulbecco’sModified Eagle’s Medium (DMEM) supplemented with 10% (v/v) heat inactivated fetal calf serum and50 U/mL penicillin and 50 μg/mL streptomycin was used. The non-tumorigenic human colon epithelialcell line, HCEC [31], was kindly provided by Prof. Jerry W. Shay (UT Southwestern Medical Center,Dallas, TX, USA). HCEC cells were cultivated in DMEM (high glucose) supplemented with 2% (v/v)Medium 199 (10×), 2% (v/v) cosmic calf serum, 20 mM 4-(2-hydroxyethyl)-1-piperazineethanesulfonicacid (HEPES), 50 μg/mL gentamicin, insulin-transferrin-selenium-G (10 μg/mL; 5.5 μg/mL; 6.7 μg/mL),recombinant human epidermal growth factor (18.66 ng/mL), and hydrocortisone (1 μg/mL). Bothcell lines were cultivated in humidified incubators at 37 ◦C and 5% CO2. Media, supplements, andfurther material for cell culture were purchased from GIBCO Invitrogen (Karlsruhe, Germany), LonzaGroup Ltd. (Basel, Switzerland), Sigma-Aldrich Chemie GmbH (Munich, Germany), Sarstedt AG &Co. (Nuembrecht, Germany), and Fisher Scientific GmbH (Vienna, Austria).
5.9. Cytotoxicity of isoDON
Per well, 1500 HCEC or 5500 HT-29 cells were seeded in a 200 μL culture medium in 96-wellplates and allowed to grow for 48 h. Then, the culture medium was withdrawn and cells were treatedwith different concentrations of isoDON and DON in the respective cell culture medium for 24 h.As a solvent control, 1% water (LC–MS grade) was incubated and 1% (v/v) Triton X-100 served asa positive control. After the treatment period, the medium was withdrawn and cells were rinsedonce with phosphate buffered saline (100 μL/well) and incubated with DMEM containing 10% (v/v)alamarBlue® reagent (Invitrogen™ Life Technologies, Karlsruhe, Germany) for 75 min. Subsequently,fluorescence intensity was measured (excitation: 530 nm; emission: 600 nm) on a Cytation 3 ImagingMulti Mode Reader (BioTek, Bad Friedrichshall, Germany). For quantification, blank-values weresubtracted and measured data were referred to solvent control. Data are presented as a mean of atleast five independent experiments, each performed in technical triplicates.
Supplementary Materials: The following are available online at http://www.mdpi.com/2072-6651/11/6/317/s1,Table S1: Processing parameters used for the production of biscuits in different experiments (Exp. No.).Ingredients are given as the weight percentage of the dough; Table S2: Concentration of the analytes in thenaturally contaminated flour, dilution factor by which the flour gets diluted in the final biscuits, and the resulting
109

Toxins 2019, 11, 317
concentration (assuming 0% degradation). <LOQ: concentration was below the limit of quantification (LOQ) of theanalytical methodology. Table S3: Concentration of deoxynivalenol (DON) and related compounds in the biscuitsamples. <LOQ: concentration was below the limit of quantification (LOQ) of the analytical methodology; TableS4: Processing parameters used for the production of bread in different experiments (Exp. No.). Ingredients aregiven as the weight percentage of the dough; Table S5: Concentration of the analytes in the naturally contaminatedflour, dilution factor by which the flour gets diluted in the final bread, and the resulting concentration (assuming0% degradation). n.d. (not detected): Concentration was below the limit of quantification of the analyticalmethodology; Table S6: Concentration of deoxynivalenol (DON) and related compounds in bread samples. n.d.(not detected): Concentration was below the limit of quantification of the analytical methodology; Table S7:Processing parameters used for the production of crackers in different experiments (Exp. No.). Ingredients aregiven as the weight percentage of the dough; Table S8: Concentration of the analytes in the naturally contaminatedflour, dilution factor by which the flour gets diluted in the final crackers, and the resulting concentration (assuming0% degradation). n.d. (not detected): Concentration was below the limit of quantification of the analyticalmethodology; Table S9: Concentration of deoxynivalenol (DON) and related compounds in cracker samples. n.d.(not detected): Concentration was below the limit of quantification of the analytical methodology.
Author Contributions: Conceptualization, D.S., F.L., M.S., F.B. and R.K.; methodology, D.M., M.S. and R.K.; datacuration, D.S., F.L. and L.W.; toxicity study, L.W and D.M.; visualization, D.S. and F.L.; writing-original draftpreparation, D.S., F.L. and L.W.; writing—review and editing, all authors; supervision, D.M., M.S., F.B. and R.K.;project administration and funding acquisition, D.M., M.S. and R.K.
Funding: This project has received funding from the European Union’s Horizon 2020 research and innovationprogramme under grant agreement No. 678012 for the MyToolBox project, also covering the APC. We alsoacknowledge financial support from the Austrian Science Fund (FWF) via the special research project Fusarium(F3718).
Acknowledgments: The authors would like to thank the colleagues for the pilot plant trials execution support:Dante Catellani, Marta Filomeno, Gennaro Cangiano, Sergio Cerasti and Umberto Tanzi.
Conflicts of Interest: The authors declare no conflict of interest. The funders had no role in the design of thestudy; in the collection, analyses, or interpretation of data; in the writing of the manuscript, or in the decision topublish the results.
References
1. Pitt, J.I.; Wild, C.P.; Baan, R.A.; Gelderblom, W.C.A.; Miller, J.D.; Riley, R.T.; Wu, F. Improving Public Healththrough Mycotoxin Control; IARC Scientific Publications Series, No. 158; International Agency for Research onCancer: Lyon, France, 2012.
2. Knutsen, H.K.; Alexander, J.; Barregård, L.; Bignami, M.; Brüschweiler, B.; Ceccatelli, S.; Cottrill, B.;Dinovi, M.; Grasl-Kraupp, B.; Hogstrand, C.; et al. Risks to human and animal health related to the presenceof deoxynivalenol and its acetylated and modified forms in food and feed. EFSA J. 2017, 15. [CrossRef]
3. European Commission. European Commission Commission Regulation (EC) No 1881/2006 of 19 December2006 setting maximum levels for certain contaminants in foodstuff. Off. J. Eur. Union 2006, 364, 5–24.
4. Greenhalgh, R.; Gilbert, J.; King, R.R.; Blackwell, B.A.; Startin, J.R.; Shepherd, M.J. Synthesis, characterization,and occurrence in bread and cereal products of an isomer of 4-deoxynivalenol (vomitoxin). J. Agric. Food Chem.1984, 32, 1416–1420. [CrossRef]
5. Bretz, M.; Beyer, M.; Cramer, B.; Knecht, A.; Humpf, H.U. Thermal degradation of the Fusarium mycotoxindeoxynivalenol. J. Agric. Food Chem. 2006, 54, 6445–6451. [CrossRef] [PubMed]
6. Stadler, D.; Lambertini, F.; Bueschl, C.; Wiesenberger, G.; Hametner, C.; Schwartz-zimmermann, H.;Hellinger, R.; Sulyok, M.; Lemmens, M.; Schuhmacher, R.; et al. Untargeted LC-MS based 13C labellingprovides a full mass balance of deoxynivalenol and its degradation products formed during baking ofcrackers, biscuits and bread. Food Chem. 2019, 279, 303–311. [CrossRef] [PubMed]
7. Schaarschmidt, S.; Fauhl-Hassek, C. The fate of mycotoxins during the processing of wheat for humanconsumption. Compr. Rev. Food Sci. Food Saf. 2018, 17, 556–593. [CrossRef]
8. Khaneghah, M.A.; Fakhri, Y.; Sant’Ana, A.S. Impact of unit operations during processing of cereal-basedproducts on the levels of deoxynivalenol, total a fl atoxin, ochratoxin A, and zearalenone: A systematicreview and meta-analysis. Food Chem. 2018, 268, 611–624. [CrossRef] [PubMed]
9. Generotti, S.; Cirlini, M.; Šarkanj, B.; Sulyok, M.; Berthiller, F.; Dall’Asta, C.; Suman, M. Formulation andprocessing factors affecting trichothecene mycotoxins within industrial biscuit-making. Food Chem. 2017,229, 597–603. [CrossRef] [PubMed]
110

Toxins 2019, 11, 317
10. Suman, M.; Manzitti, A.; Catellani, D. A design of experiments approach to studying deoxynivalenol anddeoxynivalenol-3-glucoside evolution throughout industrial production of wholegrain crackers exploitingLC-MS/MS techniques. World Mycotoxin J. 2012, 5, 241–249. [CrossRef]
11. Generotti, S.; Cirlini, M.; Malachova, A.; Sulyok, M.; Berthiller, F.; Dall’Asta, C.; Suman, M. Deoxynivalenol &deoxynivalenol-3-glucoside mitigation through bakery production strategies: Effective experimental designwithin industrial rusk-making technology. Toxins 2015, 7, 2773–2790. [PubMed]
12. Bergamini, E.; Catellani, D.; Dall’Asta, C.; Galaverna, G.; Dossena, A.; Marchelli, R.; Suman, M. Fate offusarium mycotoxins in the cereal product supply chain: The deoxynivalenol (DON) case within industrialbread-making technology. Food Addit. Contam. 2010, 27, 677–687. [CrossRef] [PubMed]
13. Young, J.C.; Blackwell, B.A.; ApSimon, J.W. Alkaline degradation of the mycotoxin 4-deoxynivalenol.Tetrahedron Lett. 1986, 27, 1019–1022. [CrossRef]
14. Gökmen, V.; Açar, Ö.Ç.; Serpen, A.; Morales, F.J. Effect of leavening agents and sugars on the formation ofhydroxymethylfurfural in cookies during baking. Eur. Food Res. Technol. 2008, 226, 1031–1037. [CrossRef]
15. Feng, S.; Bagia, C.; Mpourmpakis, G. Determination of proton affinities and acidity constants of sugars.J. Phys. Chem. A 2013, 117, 5211–5219. [CrossRef] [PubMed]
16. Cundliffe, E.; Cannon, M.; Davies, J. Mechanism of inhibition of eukaryotic protein synthesis by trichothecenefungal toxins. Proc. Natl. Acad. Sci. USA 1974, 71, 30–34. [CrossRef] [PubMed]
17. Ueno, Y.; Nakajima, M.; Sakai, K.; Ishii, K.; Sato, N. Comparative toxicology of trichothec mycotoxins:Inhibition of protein synthesis in animal cells. J. Biochem. 1973, 74, 285–296.
18. Anderson, D.W.; Black, R.M.; Lee, C.G.; Pottage, C.; Rickard, R.L.; Sandford, M.S.; Webber, T.D.; Williams, N.E.Structure-Activity Studies of Trichothecenes: Cytotoxicity of Analogues and Reaction Products Derived fromT-2 Toxin and Neosolaniol. J. Med. Chem. 1989, 32, 555–562. [CrossRef]
19. Wu, Q.; Dohnal, V.; Kuca, K.; Yuan, Z. Trichothecenes: Structure-toxic activity relationships. Curr. Drug Metab.2013, 14, 641–660. [CrossRef] [PubMed]
20. Wei, C.; Mclaughlin, S. Structure-function relationship in the 12,13-epoxytrichothecenes.Biochem. Biophys. Commun. 1974, 57, 838–844. [CrossRef]
21. Scudamore, K.A.; Hazel, C.M.; Patel, S.; Scriven, F. Deoxynivalenol and other Fusarium mycotoxins inbread, cake, and biscuits produced from uk-grown wheat under commercial and pilot scale conditions.Food Addit. Contam. 2009, 26, 1191–1198. [CrossRef]
22. Voss, K.A.; Snook, M.E. Stability of the mycotoxin deoxynivalenol (DON) during the production of flour-basedfoods and wheat flake cereal. Food Addit. Contam. 2010, 27, 1694–1700. [CrossRef] [PubMed]
23. Vidal, A.; Sanchis, V.; Ramos, A.J.; Marín, S. Thermal stability and kinetics of degradation of deoxynivalenol,deoxynivalenol conjugates and ochratoxin A during baking of wheat bakery products. Food Chem. 2015, 178,276–286. [CrossRef] [PubMed]
24. De Angelis, E.; Monaci, L.; Pascale, M.; Visconti, A. Fate of deoxynivalenol, T-2 and HT-2 toxins and theirglucoside conjugates from flour to bread: An investigation by high-performance liquid chromatographyhigh-resolution mass spectrometry. Food Addit. Contam. Part A 2013, 30, 345–355. [CrossRef] [PubMed]
25. Kostelanska, M.; Dzuman, Z.; Malachova, A.; Capouchova, I.; Prokinova, E.; Skerikova, A.; Hajslova, J.Effects of milling and baking technologies on levels of deoxynivalenol and its masked formdeoxynivalenol-3-glucoside. J. Agric. Food Chem. 2011, 59, 9303–9312. [CrossRef] [PubMed]
26. Lancova, K.; Hajslova, J.; Kostelanska, M.; Kohoutkova, J.; Nedelnik, J.; Moravcova, H.; Vanova, M. Fate oftrichothecene mycotoxins during the processing: Milling and baking. Food Addit. Contam. Part A 2008, 25,650–659. [CrossRef] [PubMed]
27. Valle-Algarra, F.M.; Mateo, E.M.; Medina, Á.; Mateo, F.; Gimeno-Adelantado, J.V.; Jiménez, M. Changesin ochratoxin A and type B trichothecenes contained in wheat flour during dough fermentation andbread-baking. Food Addit. Contam. Part A Chem. Anal. Control. Expo. Risk Assess. 2009, 26, 896–906.[CrossRef] [PubMed]
28. Vidal, A.; Morales, H.; Sanchis, V.; Ramos, A.J.; Marín, S. Stability of DON and OTA during the breadmakingprocess and determination of process and performance criteria. Food Control. 2014, 40, 234–242. [CrossRef]
29. Wu, L.; Wang, B. Evaluation on levels and conversion profiles of DON, 3-ADON, and 15-ADON duringbread making process. Food Chem. 2015, 185, 509–516. [CrossRef]
111

Toxins 2019, 11, 317
30. Schwartz-Zimmermann, H.E.; Hametner, C.; Nagl, V.; Fiby, I.; Macheiner, L.; Winkler, J.; Dänicke, S.; Clark, E.;Pestka, J.J.; Berthiller, F. Glucuronidation of deoxynivalenol (DON) by different animal species: Identificationof iso-DON glucuronides and iso-deepoxy-DON glucuronides as novel DON metabolites in pigs, rats, mice,and cows. Arch. Toxicol. 2017, 91, 3857–3872. [CrossRef]
31. Roig, A.I.; Eskiocak, U.; Hight, S.K.; Kim, S.B.U.M.; Delgado, O.; Souza, R.F.; Spechler, S.J.; Wright, W.E.;Shay, J.W. Immortalized epithelial cells derived from human colon biopsies express stem cell markers anddifferentiate in vitro. Gastroenterology 2010, 138, 1012–1021. [CrossRef]
© 2019 by the authors. Licensee MDPI, Basel, Switzerland. This article is an open accessarticle distributed under the terms and conditions of the Creative Commons Attribution(CC BY) license (http://creativecommons.org/licenses/by/4.0/).
112

toxins
Article
Fate of Ergot Alkaloids during Laboratory ScaleDurum Processing and Pasta Production
Sheryl A. Tittlemier *, Dainna Drul, Mike Roscoe, Dave Turnock, Dale Taylor and Bin Xiao Fu
Grain Research Laboratory, Canadian Grain Commission, 1404-303 Main Street, Winnipeg, MB R3C 3G8,Canada; [email protected] (D.D.); [email protected] (M.R.);[email protected] (D.T.); [email protected] (D.T.);[email protected] (B.X.F.)* Correspondence: [email protected]; Tel.: +1-204-984-3456
Received: 6 March 2019; Accepted: 29 March 2019; Published: 31 March 2019
Abstract: The fate of ergot alkaloids during the milling of durum and subsequent production andcooking of pasta was examined. Durum samples containing varying amounts of ergot sclerotia(0.01–0.1% by mass) were milled, and all milling product was analyzed for 10 ergot alkaloids usingliquid chromatography with tandem mass spectrometry. Spaghetti was prepared from the semolinaobtained during milling. Ergocristine, ergocristinine, and ergotamine were the predominant ergotalkaloids observed in the milling fractions and spaghetti. Approximately 84% of the total ergotalkaloid mass of the whole grain durum resided in the milling product fractions associated with theouter kernel layers (bran, shorts, feeds). No consistent loss of ergot alkaloids was observed during theproduction or cooking of spaghetti. However, changes in the ratio of R- to S-enantiomers occurredduring the milling and cooking of spaghetti. Products containing bran, shorts, and feeds, as wellas cooked spaghetti, contained a higher proportion of the less biologically active S-enantiomers.The results of this study emphasize the need to monitor R- and S-enantiomers, and to considerfood and feed products, as opposed to whole grain, when assessing any exposure of consumers toergot alkaloids.
Keywords: mycotoxin; milling; bran; semolina; cooking; dietary exposure
Key Contribution: No substantial losses of ergot alkaloids were associated with boiling pasta.However, cooking pasta resulted in epimerization and a shift towards higher concentrations of theless biologically active S-enantiomers.
1. Introduction
Ergot alkaloids (EAs) are a group of mycotoxins produced during the fungal infection ofcereals. In Canada, the fungus Claviceps purpurea causes ergot infection of rye, barley, oats, wheat,and durum [1]. During C. purpurea infection, healthy kernels are replaced by dark-colored sclerotiathat contain high concentrations of various EAs [2–4]. The incidence of ergot infection of durum grownin Canada is variable amongst growing years, but appears to be increasing since the early 2000s [5].This increase suggests that the potential for EAs occurring in durum, and durum-based food products,is also increasing. A number of EAs have been measured in Canadian cereals [5], as well as thosegrown in western [6] and eastern Europe [7], and Australia [3].
The EAs most commonly associated with cereal grains are amide-like derivatives of lysergicacid [8]. These compounds contain a stereogenic center, and can exist in R- (indicated by an “ine”suffix in their names) and S- (indicated by an “inine” suffix in their names) enantiomeric forms.The enantiomers can undergo reversible epimerization, which can reach equilibrium. Epimerizationhas been reported to occur in solution under alkaline conditions and lengthy periods of storage [9].
Toxins 2019, 11, 195; doi:10.3390/toxins11040195 www.mdpi.com/journal/toxins113

Toxins 2019, 11, 195
Consumption of ergot alkaloids has been long known to cause ergotism in both humans andlivestock [10,11]. Symptoms of ergotism include gangrene, gastrointestinal effects, reduced lactation,as well as effects on the central nervous system.
Current practices to avoid or minimize exposure to ergot alkaloids in food and feed involve grainhandling and milling procedures to exclude ergot sclerotia from entering food and feed channels.Tolerances are also used to regulate the amount of ergot sclerotia in grain. For example, the Canadianmaximum level for ergot sclerotia in durum is 0.02% on a mass basis for the higher quality grades ofNo.1 Canada Western Amber Durum (CWAD) and No.2 CWAD [12], and the Codex AlimentariusCommission maximum level of ergot sclerotia in wheat is 0.05% [13].
Currently, no jurisdictions have set maximum levels (MLs) for ergot alkaloids in grain, food,or feed. However, regulatory agencies are exploring the use of MLs as a tool to manage healthrisk from exposure to EAs. The Canadian Food Inspection Agency (CFIA) consulted stakeholderson proposed limits for a number of contaminants, including ergot alkaloids, in livestock feeds [14].The complexity of EA exposure and hazard assessments due to processing effects on EA concentrations,toxicity of individual EAs, and synergistic or antagonistic effects in EA mixtures, as well as variablesusceptibilities due to age, sex, and physiological state, coupled with limited published scientificinformation in these areas, led the CFIA to revisit setting MLs for EAs in the future [15].
There are limited published studies on the fate of ergot alkaloids in food or feed products duringthe processing of grain. Most of the studies focus on rye-based food and feed. Fajardo et al. [16]investigated the fate of six EAs in milling products of red spring wheat. Flour containing EAs wasalso used to prepare pasta, Asian noodles, and bread. Overall, EAs were concentrated in the millingproducts associated with reduction streams, and some losses were noted in cooked noodles. However,a limitation of this work is the inclusion of only R-enantiomers in the EA analyses. Merkel et al. [17]studied the fate of twelve EAs in cookies baked with rye flour and subjected to in vitro digestion.The authors reported degradation of EAs during baking, as well as a shift from R- to S-enantiomersfor all EAs. A feeding study conducted by Dänicke [18] included an assessment of the fate of twelveEAs in rye-based feed for laying hens, which had been processed under heat and pressure. Substantialepimerization of EAs was noted after processing, with an increase in concentration of S-enantiomersfor all EAs.
The objective of this work was to take advantage of ongoing pasta quality and functionalitystudies, and examine the fate of EAs in milled durum, as well as during the processing and cooking ofspaghetti. This study used durum, a cereal grain important in the production of pasta. The fate of EAsduring the processing of durum has not been well studied. This study also monitored the fate of fourR/S enantiomeric pairs, as well as two additional EA R-enantiomers for which the S-enantiomer wasnot readily available at the time of the study. The outcomes of this study are valuable for use in exposureassessments to ensure that consumers’ exposure to EAs in food, or feed, is accurately determined.
2. Results
2.1. Ergot Alkaloids in Whole Grain and Milling Products
Table 1 lists the EA concentrations measured in the comminuted whole grain and milling productsfor the six samples of CWAD containing varying amounts of ergot sclerotia. Concentrations areprovided as the sum of 10 ergot alkaloid analyte concentrations. Milling yields from the two mill runsof 2 kg each are also listed in Table 1.
Total EA concentrations for whole grain and all milling products increased as the percentage ofergot sclerotia in the original durum sample increased. The correlation between the percentage ofergot sclerotia and total EA concentration was statistically significant for whole grain and all millingproducts (Pearson Product Moment Correlation, p < 0.0025), aside from bran (p < 0.111). The total EAconcentration of bran increased from 1112 to 5695 μg/kg as the ergot sclerotia content increased from0.01% to 0.1%, and reached a maximum of 5715 μg/kg at an ergot sclerotia content of 0.04%.
114

Toxins 2019, 11, 195
Table 1. Total ergot alkaloids concentration (μg/kg) in whole grain durum and milling products.Average ± standard deviation (2 × 2 kg mill runs for each of the 6 samples) milling yields are providedfor the milling products.
WholeGrain
Bran Shorts Feeds Semolina 1 Semolina 2 Semolina 3 Flour3rd Break
Flour
Milling yield(%, m/m) 12.4 ± 0.1 5.5 ± 0.1 5.3 ± 0.1 61.3 ± 0.1 5.2 ± 0.1 2.39 ± 0.04 3.49 ± 0.07 4.46 ± 0.05
No ERG <2 <2 <2 12 16 <2 <2 <2 <2ERG 0.01% 446 1112 241 946 23 337 406 177 188ERG 0.02% 601 1392 2267 2231 173 368 836 376 313ERG 0.03% 681 2996 2298 3173 186 461 1005 506 412ERG 0.04% 936 5715 3482 4532 279 1358 1300 618 530ERG 0.1% 2147 5695 8002 9955 579 1603 3750 1493 1165
EAs were observed in all fractions from the five samples that contained ergot sclerotia. Only feedsand the first semolina fraction from the CWAD sample with no visible ergot sclerotia containedmeasurable EAs. Total EA concentrations in these fractions were low, ranging from 12 to 16 μg/kg.Total EA concentrations from the other samples were highest in bran, shorts, and feeds and the lowestwas in the first semolina fraction. The concentrations in this semolina fraction were approximately20–40× lower than the maximum measured in bran, shorts, or feeds.
Ergocristine and ergocristinine, followed by ergotamine, were the most predominant EAsobserved in whole grain and milling products. The mean percentage of total EAs on a molar(as opposed to mass-based concentration) basis for each EA in the five samples containing ergotsclerotia was determined; these are presented in Figure 1.
whole
grain
bran
short
sfee
ds
semoli
na 1
semoli
na 2
semoli
na 3
flour
3rd br
eak f
lour
% to
tal m
oles
of E
As
0
10
20
30
40
50
60
70
80ergonovine ergosine ergotamine ergocornine ergocrpytine ergocristine ergosinine ergocorninine ergocryptinine ergocristinine
Figure 1. Mean ± standard deviation percentage of total moles of ergot alkaloids present in wholegrain and milling products. Means and standard deviations were calculated from whole grain andmilling products from the five durum samples with ergot sclerotia ranging from 0.01–0.1% by mass.
In bran, shorts, and feeds, ergocristinine was the predominant EA at 29–35% of total EAs.The molar percentage of ergocristinine in bran and shorts were significantly different from thoseof the semolina and flour fractions (p < 0.05). Ergocristine was predominant in whole grain and othermilling products, ranging from 37–55% of total EAs. The mean molar percentage of ergocristine wassignificantly different between semolina 1 and bran, shorts, and feeds (p < 0.05).
No other significant differences were noted amongst the other milling products. Ergotamineranged from 10–14% of total EAs in whole grain and all milling products.
115
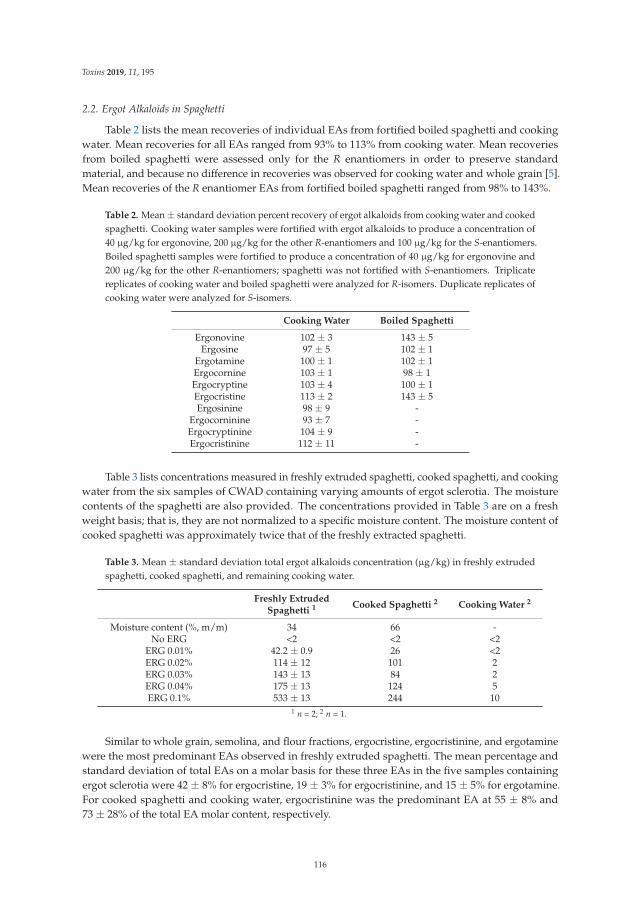
Toxins 2019, 11, 195
2.2. Ergot Alkaloids in Spaghetti
Table 2 lists the mean recoveries of individual EAs from fortified boiled spaghetti and cookingwater. Mean recoveries for all EAs ranged from 93% to 113% from cooking water. Mean recoveriesfrom boiled spaghetti were assessed only for the R enantiomers in order to preserve standardmaterial, and because no difference in recoveries was observed for cooking water and whole grain [5].Mean recoveries of the R enantiomer EAs from fortified boiled spaghetti ranged from 98% to 143%.
Table 2. Mean ± standard deviation percent recovery of ergot alkaloids from cooking water and cookedspaghetti. Cooking water samples were fortified with ergot alkaloids to produce a concentration of40 μg/kg for ergonovine, 200 μg/kg for the other R-enantiomers and 100 μg/kg for the S-enantiomers.Boiled spaghetti samples were fortified to produce a concentration of 40 μg/kg for ergonovine and200 μg/kg for the other R-enantiomers; spaghetti was not fortified with S-enantiomers. Triplicatereplicates of cooking water and boiled spaghetti were analyzed for R-isomers. Duplicate replicates ofcooking water were analyzed for S-isomers.
Cooking Water Boiled Spaghetti
Ergonovine 102 ± 3 143 ± 5Ergosine 97 ± 5 102 ± 1
Ergotamine 100 ± 1 102 ± 1Ergocornine 103 ± 1 98 ± 1Ergocryptine 103 ± 4 100 ± 1Ergocristine 113 ± 2 143 ± 5Ergosinine 98 ± 9 -
Ergocorninine 93 ± 7 -Ergocryptinine 104 ± 9 -Ergocristinine 112 ± 11 -
Table 3 lists concentrations measured in freshly extruded spaghetti, cooked spaghetti, and cookingwater from the six samples of CWAD containing varying amounts of ergot sclerotia. The moisturecontents of the spaghetti are also provided. The concentrations provided in Table 3 are on a freshweight basis; that is, they are not normalized to a specific moisture content. The moisture content ofcooked spaghetti was approximately twice that of the freshly extracted spaghetti.
Table 3. Mean ± standard deviation total ergot alkaloids concentration (μg/kg) in freshly extrudedspaghetti, cooked spaghetti, and remaining cooking water.
Freshly ExtrudedSpaghetti 1 Cooked Spaghetti 2 Cooking Water 2
Moisture content (%, m/m) 34 66 -No ERG <2 <2 <2
ERG 0.01% 42.2 ± 0.9 26 <2ERG 0.02% 114 ± 12 101 2ERG 0.03% 143 ± 13 84 2ERG 0.04% 175 ± 13 124 5ERG 0.1% 533 ± 13 244 10
1 n = 2; 2 n = 1.
Similar to whole grain, semolina, and flour fractions, ergocristine, ergocristinine, and ergotaminewere the most predominant EAs observed in freshly extruded spaghetti. The mean percentage andstandard deviation of total EAs on a molar basis for these three EAs in the five samples containingergot sclerotia were 42 ± 8% for ergocristine, 19 ± 3% for ergocristinine, and 15 ± 5% for ergotamine.For cooked spaghetti and cooking water, ergocristinine was the predominant EA at 55 ± 8% and73 ± 28% of the total EA molar content, respectively.
116

Toxins 2019, 11, 195
3. Discussion
3.1. Fate of Ergot Alkaloids in Milling Products and Spaghetti
Most of the EAs associated with sclerotia were in the by-products of semolina milling, i.e., bran,shorts, and feeds from outer kernel layers. Higher amounts of EAs were associated with bran, shorts,feeds (Figure 2), which are milling products containing material from the outer kernel. These threemilling products contained 84% of the total EA mass in the durum.
Figure 2. Distribution of total ergot alkaloids mass amongst durum milling products. Pie slicesrepresent the mean fraction of total ergot alkaloid mass across the five durum samples with ergotsclerotia ranging from 0.01–0.1% by mass.
The presence of the EAs predominantly in these milling fractions is consistent with the observationby Franzmann et al. [19] that the amounts of EAs in rye flour increased with a higher amount ofbran in the flour. Franzmann et al.’s work attributed this EA distribution on rye kernels to thecoincidental contact and abrasion between sound rye and ergot sclerotia during ordinary grainhandling and movement.
Even though EAs will be transferred to sound kernels from ergot sclerotia during movement,the fate of ergot sclerotia during the milling process will be the most important factor affecting EAcontent of milling products because the concentration of EAs in ergot sclerotia are orders of magnitudegreater than in sound grain. Total EA concentrations in rye ergot sclerotia were approximately 300×greater than concentrations in rye that had been mixed with ground ergot sclerotia and subject tocleaning [19]. Mean concentrations of the 10 EAs included in the current study ranged from 500 to1000 mg/kg in ergot sclerotia obtained from infected durum plants [4].
The predominance of EAs in the bran, shorts, and feeds milling products fractions is also consistentwith the path taken by ergot sclerotia through a wheat milling procedure reported by Farjado et al. [16].The aforementioned Farjado et al. [16] milled wheat containing various amounts of ergot sclerotia.They noted that the sclerotia congregated in the reduction system because they did not flake whenpassing through the break rolls. This led to approximately 75% of EAs present in the whole grainwheat residing in bran and shorts milling fractions in their study.
The fate of the individual EAs was also examined over the milling process. Interestingly,there were differences in the EA profiles amongst the milling products associated with the outerkernel layers (bran, shorts, and feeds) and endosperm (semolina, flour), in addition to the variationin concentration.
These differences in EA profiles are illustrated in Figure 3. The ratio of R- to S-enantiomerswas lower in milling products associated with the outer kernel layers as compared to whole grain,indicating a predominance of the S-enantiomers. The R-enantiomers were predominant in semolinaand flour, and were present in these fractions to greater extent than in whole grain.
117

Toxins 2019, 11, 195
Figure 3. Difference in ratios of R-enantiomer to S-enantiomer concentrations between whole graindurum, milling products, and pasta matrices. The difference in ratios was calculated using mean R/Sconcentration ratios determined from the five groups containing 0.01–0.1% ergot sclerotia by mass.
The work in this study does not directly address or examine the cause of the differencesin occurrence amongst individual EAs. However, past research has investigated or noted theepimerization of EAs. Epimerization of EAs is reported to be promoted by exposure to light [20],therefore EAs in the outer kernel layers may be subject to more light and subsequent epimerizationthan EAs in the inner kernel layers. Even though heat also appears to facilitate epimerization [17,18],it is unlikely that the milling process used in this study promoted epimerization in the bran, shorts,and feeds fractions, as temperatures generated during the roller milling of wheat are around 35 ◦C [21].
The cooking of spaghetti did not appear to considerably affect the presence of EAs. No substantiallosses of EAs were consistently evident after the preparation of spaghetti by extrusion, nor after boilingthe spaghetti. Figure 4 provides a comparison of the amount of EAs in freshly extruded spaghetti,cooked spaghetti, and the cooking water, to semolina. The comparison is on the basis of EA mass,therefore the impact from varying moisture content of the products is avoided. Across the five durumsamples with varying ergot sclerotia contents, freshly extruded spaghetti and cooked spaghetti samplescontained 77 ± 14% and 93 ± 18% of the total EA content observed in semolina, respectively. Cookingwater contained a negligible amount of EAs (0.04 ± 0.02%) of the total semolina EA content.
Overall, the results observed do not indicate a consistent and extensive loss of EAs duringprocessing. While the amounts of EAs observed in the freshly extruded spaghetti seem to suggestsome loss, the amounts of EAs observed in cooked spaghetti do not demonstrate similar losses.The apparently lower EA amounts measured in the freshly extruded spaghetti may reflect differencesin the ability of the analytical method to extract and/or measure EAs in this matrix.
Merkel et al. [17] reported small losses of 2–30% in cookies due to degradation of EAs duringbaking. Dänicke noted an average loss of 11% for EAs in heat treated rye [18], but the changes inconcentrations across the five chicken diets examined, ranged from a loss of 26%, to an increase of 15%.This inconsistency suggests that the heterogeneous nature of ergot contamination of whole grain mayhave contributed to the apparent loss of EAs in the heat treated rye.
118

Toxins 2019, 11, 195
0%
20%
40%
60%
80%
100%
120%
140%
ERG 0.01% ERG 0.02% ERG 0.03% ERG 0.04% ERG 0.1%
Perc
enta
ge o
f tot
al E
As m
ass i
n se
mol
ina
semolina
freshly extruded spaghetti
cooked spaghetti
cooking water (x100)
Figure 4. Amount of total ergot alkaloids in processed spaghetti and cooking water relative to semolina.The mean of duplicates is reported for freshly extruded spaghetti. Single analyses were performed forthe other matrices.
Fajardo et al. [16] also reported losses of EAs during the cooking of Asian noodles and spaghettimade with wheat flour. However the analytical method used in that study only included theR-enantiomers as analytes. Any occurrence of S-enantiomers formed by epimerization during cookingwould not be observed. Therefore changes in concentrations of EAs due to epimerization wouldappear instead as losses of EAs.
Even though no substantial losses of EAs were observed during the processing and cooking ofspaghetti, the EA profile did change during cooking. As seen in Figure 3, the EA content of semolinaand freshly extruded spaghetti is dominated by R-enantiomers, which changed to a predominanceof S-enantiomers in cooked spaghetti and cooking water. The changes in the EA profile observedsuggest that the heat of extrusion (45 ◦C) used to prepare the fresh spaghetti is not enough to promoteepimerization, whereas the heat of boiling water can facilitate epimerization.
The enrichment of S-enantiomers after observed after cooking spaghetti is consistent with changesobserved in other research. Merkel et al. reported the epimeric ratio shifted toward the S-enantiomerfor all EAs in baked cookies [17]. Dänicke [18] also noted a consistent increase in the proportion ofS-enantiomers (and concomitant decrease in R-enantiomers) in rye with varying ergot sclerotia contentafter heat treatment.
3.2. Implications of Ergot Alkaloid Fate in Milling Products and Spaghetti
The wider implications of this work relate to the distribution of EAs amongst the durum millingproducts and the epimerization of EAs observed. The association of EAs with the bran, shorts, and feedsfractions after durum milling will lower the exposure for populations consuming food products, such aspasta, made from semolina, as compared to whole grain durum. In turn, any incorporation of bran,shorts, and feeds fractions into animal feed will increase exposure of livestock, as compared to use ofwhole grain durum.
The epimerization observed from cooking and milling durum indicate that feed products andcooked pasta will contain a higher proportion of the less biologically active S-enantiomers. Overall,the deleterious health effects of EAs are associated with the ability of EAs to act as ligands for avariety of receptors. The ligand activity is reported to be greater for R-enantiomers, compared toS-enantiomers [18,20].
The fractionation of EAs amongst milling products and the epimerization observed during millingand cooking highlights the need for exposure assessments to consider concentrations in food products,
119

Toxins 2019, 11, 195
or to use a processing factor, as opposed to using whole grain durum EA concentrations to estimateconsumers’ exposure. The results of this study also indicate that both R- and S-enantiomers should bemonitored and assessed, in order to obtain an accurate view of consumers’ exposure to EAs.
4. Materials and Methods
4.1. Samples
A No.1 Canada Western Amber Durum sample (CWAD, 30 kg) was cleaned and hand-pickedto remove ergot bodies and any kernels with dark discoloration. The cleaned CWAD wheat that didnot contain ergot sclerotia was divided into 6 × 5 kg sub-samples. Sclerotia hand-picked out of othernaturally-infected CWAD samples were added back to five of the sub-samples in order to preparegrain with 0.01, 0.02, 0.03, 0.04, and 0.1% (m/m) ergot sclerotia. The sixth 5 kg sub-sample was kept at0% ergot sclerotia. The 5 kg sub-samples were divided into 2 × 2 kg and 1 × 1 kg portions using arotary sample divider (Materials Sampling Solutions, Southport, Australia). The 2 × 2 kg portionswere milled as described below. The 1 kg whole grain portion was comminuted using a Retsch SR 300rotor beater mill fitted with a 750 μm screen and coupled with a Retsch DR 100 vibratory feeder.
4.2. Milling and Processing into Spaghetti
Durum wheat samples were milled on a four stand Allis-Chalmers laboratory mill coupled with asmall-scale semolina purifier previously described by Dexter et al. [22]. The mill flow consists of fourcorrugated break roll passages, five corrugated sizing roll passages, and 10 purification steps. The millroom was controlled at 21 ◦C and 60% relative humidity. Durum wheat samples were tempered to 16%moisture for 16 h before milling. Particles retained on a 425 μm screen after the four break passageswere collected as bran. After each break passage, coarse material retained on a 630 μm screen waspassed through sizing rolls. After sizing passages, flour was collected by combining materials with fineparticles passing through the 180 μm sieve, and particles retained on a 700 μm screen were collectedas shorts. The remaining milling streams were passed through a purifier. After each purificationstep, streams with particles passing through the 571 μm screens, but retained on the 183 μm screens,were collected as semolina. Particles retained on the 630 μm screens on purifiers 7–10 were collectedas feed.
Following the method of Fu et al. [23], spaghetti was produced from semolina using a customizedmicro-extruder (Randcastle Extrusion Systems Inc., Cedar Grove, NJ, USA). For dough preparation,semolina was mixed with water in a high speed asymmetric centrifugal mixer (DAC 400 FVZSpeedMixer, FlackTec, Landum, SC, USA) at constant water absorption of 31.5%. Vacuum wasapplied to eliminate the introduction of air bubbles, after which the dough crumbs were extrudedthrough a four-hole Teflon coated spaghetti die (1.8 mm).
The fresh pasta was subsequently dried in a pilot pasta dryer (Bühler, Uzwil, Switzerland) coupledwith a 325 min drying cycle and maximum temperature of 85 ◦C.
4.3. Cooking and Moisture Content Determination
Spaghetti (10 g) was added to 100 g of water brought to boil. The spaghetti was cooked uncoveredfor 10 min. After 10 min, cooked spaghetti was immediately removed from the cooking water withtongs, excess adhered water was left to evaporate for 1 min, and the mass of cooked spaghetti wasdetermined. A 10 g portion of boiled spaghetti was then placed into a polyethylene sample bottle,which was closed and stored for approximately 2 h until extraction and EA analysis. The remainder ofthe boiled spaghetti was re-weighed, stored in sealed plastic bags, and frozen until moisture contentdetermination. The remaining cooking water was cooled in a refrigerator and stored for approximately4 h until extraction and EA analysis.
The moisture content of cooked spaghetti was determined gravimetrically. The remainders ofthe boiled spaghetti that were weighed immediately after cooking were placed on sieves and air
120

Toxins 2019, 11, 195
dried for 24 h. The air dried samples were ground using a Brabender MLI-204 break mill, and thendried for 1 h in an oven held at 130 ◦C. The moisture content of the cooked spaghetti was calculatedfrom the decrease between the post-cooking and air dried masses as well as the pre- and post-ovendried masses.
Moisture content of freshly extruded spaghetti was calculated based on the amount of water addedand originally present in the semolina, minus 0.5% during to moisture loss during pasta processing.
4.4. Determination of Ergot Alkaloids
Samples were analyzed for 10 ergot alkaloids according to the liquid chromatography tandemmass spectrometry method described by Tittlemier et al. [5]. The 10 ergot alkaloid analytes arelisted in Table 2. Four of the alkaloids were S-epimers of R-enantiomers. The two S-epimers thatwere not included in the method (ergonovinine and ergotaminine) were not easily obtained at thetime of analysis. In order to correct for variations in final extract volume and injection volume,dihydroergotamine was used as an internal standard.
Milling products and spaghetti (10 g) were extracted with 50 mL 84:16 (v/v) acetonitrile/3.03 mMaqueous ammonium carbonate. The slurries of milling products were shaken on a flatbed shaker for30 min, and spaghetti was comminuted in extraction solvent using a handheld laboratory homogenizerfor 3 min at 12,000 rpm. After extraction, sample extracts were then centrifuged, and an aliquotof supernatant was diluted with 3.03 mM aqueous ammonium carbonate. Internal standard wasadded to all samples prior to analysis. Post-extraction fortified calibration standards were prepared inwheat matrix.
Water (1 g) was transferred from the cooled cooking water, combined with 1 mL acetonitrile,and vortex mixed for 10 s. The solution was left to sit for 2 min prior to a 1 mL aliquot being takenand combined with 1.5 mL of 3.03 mM aqueous ammonium carbonate. Internal standard was added,final sample extracts were then vortex mixed and filtered using PTFE filters prior to analysis.
Sample extracts were chromatographed on a C18 column followed by analysis in the positiveelectrospray ionization mode using multiple reaction monitoring. Two transitions were monitored foreach analyte. In order to avoid epimerization of ergot alkaloids, the exposure of sample extracts to lightwas minimized by covering samples and extracts during processing, and by keeping the illuminationoption off on the liquid chromatograph sample manager.
Analytes were considered to be positively identified and quantitated if their retention times werewithin 0.1 min of the average retention time of the corresponding analyte in the external calibrationstandards; the peak had a signal-to-noise ratio greater than 9:1, and the ratio of qualification toquantitation ions was within acceptable tolerances [24]. Analyte peak areas were normalized to thedihydroergotamine peak area in samples during calculation of concentrations.
Blank wheat samples fortified with a solution of standards and an in-house rye reference materialwere analyzed with each batch of samples and were used to monitor the performance of the analyticalmethod during the study.
4.5. Evaluation of Method for Analysis of Cooking Water and Boiled Spaghetti
Because water and boiled spaghetti were different matrices than the grain used in the initialvalidation of the EA analytical method [5], additional method evaluation was performed for thesetwo matrices. Boiled commercially-available durum spaghetti, and the cooking water used to boil thespaghetti, were fortified with ergot alkaloids, and analyzed as described above.
The boiled spaghetti was fortified with the R-enantiomers only; fortification concentrations were200 μg/kg for each alkaloid aside from ergonovine, which was fortified at 40 μg/kg. The boiledspaghetti was drained, and as much water adhering to the cooked pasta as possible was removed byshaking. The cooked spaghetti was then weighed within a minute after boiling to obtain a relevantcooked mass, and 10 g was transferred to a 250 mL centrifuge bottle, capped, and stored in darknessfor 30 min to cool prior to fortification. After fortification, samples sat for 20 min in darkness at room
121

Toxins 2019, 11, 195
temperature prior to extraction. Extraction and analysis was performed as described above, using aratio of 5:1 (v/m) extraction solvent to mass of boiled spaghetti.
The cooking water was fortified with both R- and S-enantiomers. After the cooked spaghettiwas removed, the water was placed in a refrigerator for 30 min. After cooling, two portions of10 mL were removed. One portion was fortified with R-enantiomers, and the other was fortified withS-enantiomers. Concentrations of ergot alkaloids in both portions were as mentioned above for boiledspaghetti. Three aliquots were taken from the R-enantiomers fortified 10 mL, and two aliquots weretaken from the S-enantiomers fortified 10 mL. Extraction and analysis was performed as describedabove. All aliquots were analyzed for all ergot alkaloids in order to examine if epimerization hadoccurred during sample processing.
4.6. Statistical Analyses
Statistical analyses were performed using SigmaPlot 13.0 (Systat Software Inc., Chicago, IL,USA). The mean molar percentages of ergocristine and ergocristinine were compared amongst millingproducts using a Kruskal-Wallis One Way Analysis of Variance on Ranks. The Tukey Test was used toisolate milling products whose mean molar percentages differed from others. Statistical tests werelimited to these two EAs because they were the predominant compounds in the milling products.
Author Contributions: Conceptualization, S.A.T.; Methodology, B.X.F and S.A.T.; Formal Analysis, S.A.T.;Investigation, D.D., M.R., D.T. (Dave Turnock), and D.T. (Dale Taylor); Resources, B.X.F. and S.A.T.;Writing-Original Draft Preparation, S.A.T.; Supervision, B.X.F. and S.A.T.; Project Administration, S.A.T.
Funding: This research received no external funding.
Conflicts of Interest: The authors declare no conflict of interest.
References
1. Menzies, J.G.; Turkington, T.K. An overview of the ergot (Claviceps purpurea) issue in western Canada:Challenges and solutions. Can. J. Plant Pathol. 2015, 37, 40–51. [CrossRef]
2. Appelt, M.; Ellner, F.M. Investigations into the occurrence of alkaloids in ergot and single sclerotia from the2007 and 2008 harvests. Mycotoxin Res. 2009, 25, 95–101. [CrossRef] [PubMed]
3. Blaney, B.J.; Molloy, J.B.; Brock, I.J. Alkaloids in australian rye ergot (Claviceps purpurea) sclerotia: Implicationsfor food and stockfeed regulations. Animal Product. Sci. 2009, 49, 975–982. [CrossRef]
4. Tittlemier, S.A.; Drul, D.; Roscoe, M.; Menzies, J.G. The effects of selected factors on measured ergot alkaloidcontent in Claviceps purpurea-infected hexaploid and durum wheat. World Mycotoxin J. 2016, 9, 555–564.[CrossRef]
5. Tittlemier, S.A.; Drul, D.; Roscoe, M.; McKendry, T. Occurrence of ergot and ergot alkaloids in westernCanadian wheat and other cereals. J. Agricult. Food Chem. 2015, 63, 6644–6650. [CrossRef] [PubMed]
6. Orlando, B.; Maumené, C.; Piraux, F. Ergot and ergot alkaloids in French cereals: Occurrence, pattern andagronomic practices for managing the risk. World Mycotoxin J. 2017, 10, 327–338. [CrossRef]
7. Topi, D.; Jakovac-Strajn, B.; Pavšic-Vrtac, K.; Tavcar-Kalcher, G. Occurrence of ergot alkaloids in wheat fromAlbania. Food Addit. Contamin A 2017, 34, 1333–1343. [CrossRef] [PubMed]
8. Stoll, A.; Hoffmann, A. The chemistry of the ergot alkaloids. In Chemistry of the Alkaloids; Pelletier, S.W., Ed.;Van Nostrand Reinhold Company: New York, NY, USA, 1970; pp. 267–301.
9. Krska, R.; Stubbings, G.; Macarthur, R.; Crews, C. Simultaneous determination of six major ergot alkaloidsand their epimers in cereals and foodstuffs by LC–MS–MS. Anal. Bioanal. Chem. 2008, 391, 563–576.[CrossRef] [PubMed]
10. Richard, J.L. Some major mycotoxins and their mycotoxicoses—An overview. Int. J. Food Microbiol. 2007, 119,3–10. [CrossRef] [PubMed]
11. Belser-Ehrlich, S.; Harper, A.; Hussey, J.; Hallock, R. Human and cattle ergotism since 1900: Symptoms,outbreaks, and regulations. Toxicol. Ind. Health 2012, 29, 307–316. [CrossRef] [PubMed]
12. Canadian Grain Commission. Official Grain Grading Guide. Available online: https://www.grainscanada.gc.ca/oggg-gocg/ggg-gcg-eng.htm (accessed on 27 February 2019).
122

Toxins 2019, 11, 195
13. Codex Alimentarius Commission. Codex Standard for Wheat and Durum Wheat. Codex Stan 199-1995.Available online: http://www.fao.org/fao-who-codexalimentarius/sh-proxy/en/?lnk=1&url=https%253A%252F%252Fworkspace.fao.org%252Fsites%252Fcodex%252FStandards%252FCODEX%2BSTAN%2B199-1995%252FCXS_199e.pdf (accessed on 27 February 2019).
14. Canadian Food Inspection Agency. Proposal-Contaminant Standards for Aflatoxins, Deoxynivalenol,Fumonisins, Ergot Alkaloids and Salmonella in Livestock Feeds. Available online: http://www.inspection.gc.ca/animals/feeds/consultations/contaminant-standards-for-aflatoxins-deoxynivaleno/eng/1500908795245/1500908795965 (accessed on 27 February 2019).
15. Canadian Food Inspection Agency. What We Heard Report-Consultations on Contaminant Standardsfor Aflatoxins, Deoxynivalenol, Fumonisins, Ergot Alkaloids and Salmonella in Livestock Feeds.Respondent Comments and Cfia Responses. Available online: http://www.inspection.gc.ca/animals/feeds/consultations/contaminant-standards-for-aflatoxins-deoxynivaleno/consultation-summary/eng/1544482075311/1544482140088 (accessed on 27 February 2019).
16. Fajardo, J.E.; Dexter, J.E.; Roscoe, M.M.; Nowicki, T.W. Retention of ergot alkaloids in wheat duringprocessing. Cereal Chem. 1995, 72, 291–298.
17. Merkel, S.; Dib, B.; Maul, R.; Köppen, R.; Koch, M.; Nehls, I. Degradation and epimerization of ergot alkaloidsafter baking and in vitro digestion. Anal. Bioanal. Chem. 2012, 404, 2489–2497. [CrossRef] [PubMed]
18. Dänicke, S. Toxic effects, metabolism, and carry-over of ergot alkaloids in laying hens, with a special focuson changes of the alkaloid isomeric ratio in feed caused by hydrothermal treatment. Mycotoxin Res. 2016, 32,37–52. [CrossRef] [PubMed]
19. Franzmann, C.; Schröder, J.; Mϋnzing, K.; Wolf, K.; Lindhauer, M.; Humpf, H.-U. Distribution of ergotalkaloids and ricinoleic acid in different milling fractions. Mycotoxin Res. 2011, 27, 13–21. [CrossRef][PubMed]
20. European Food Safety Authority. Scientific opinion on ergot alkaloids in food and feed. EFSA J. 2012, 10,2798–2956.
21. Prabhasankar, P.; Haridas Rao, P. Effect of different milling methods on chemical composition of wholewheat flour. Eur. Food Res. Technol. 2001, 213, 465–469. [CrossRef]
22. Dexter, J.E.; Matsuo, R.R.; Kruger, J. The spaghetti-making quality of commercial durum wheat samples withvariable α-amylase activity. Cereal Chem. 1990, 67, 405–412.
23. Fu, B.; Schlicting, L.; Pozniak, C.; Singh, A. Pigment loss from semolina to dough: Rapid measurement andrelationship with pasta colour. J. Cereal Sci. 2013, 57, 560–566. [CrossRef]
24. European Commission. Commission decision implementing council directive 96/23/EC concerning theperformance of analytical methods and the interpretation of results. Off. J. Eur. Com. 2002, 221, 8–36.
© 2019 by the authors. Licensee MDPI, Basel, Switzerland. This article is an open accessarticle distributed under the terms and conditions of the Creative Commons Attribution(CC BY) license (http://creativecommons.org/licenses/by/4.0/).
123


toxins
Review
Mycotoxins during the Processes of Nixtamalizationand Tortilla Production
Sara Schaarschmidt * and Carsten Fauhl-Hassek
German Federal Institute for Risk Assessment (BfR), Department Safety in the Food Chain, Max-Dohrn-Str. 8-10,D-10589 Berlin, Germany; [email protected]* Correspondence: [email protected]
Received: 28 March 2019; Accepted: 11 April 2019; Published: 16 April 2019
Abstract: Tortillas are a traditional staple food in Mesoamerican cuisine, which have also becomepopular on a global level, e.g., for wraps or as snacks (tortilla chips). Traditional tortilla productionincludes alkaline cooking (nixtamalization) of maize kernels. This article summarizes the currentknowledge on mycotoxin changes during the nixtamalization of maize and tortilla production.Upon nixtamalization, mycotoxins can be affected in different ways. On the one hand, the toxinscan be physically removed during steeping and washing. On the other hand, mycotoxins might bedegraded, modified, or released/bound in the matrix by high pH and/or high temperature. This alsoapplies to the subsequent baking of tortillas. Many studies have shown reduced mycotoxin levels inalkali-cooked maize and in tortillas. Most of the available data relate to aflatoxins and fumonisins.The reduction (and detoxification) of aflatoxins during nixtamalization might, however, be partiallyreversed in acidic conditions. The loss of fumonisin concentrations is to some extent accompanied byhydrolyzation and by lower toxicity. However, some studies have indicated the potential formationof toxicologically relevant modified forms and matrix-associated fumonisins. More data are requiredto assess the influence of alkaline cooking regarding such modified forms, as well as mycotoxinsother than aflatoxins/fumonisins.
Keywords: aflatoxins; alkaline; hydrolyzed fumonisins; fumonisins; food processing; maize; masa;matrix-associated mycotoxins; modified mycotoxins; tortillas
Key Contribution: The paper provides a critical overview of the effect of masa and tortilla productionon mycotoxin concentrations considering the potential degradation and transformation of mycotoxinsand matrix–toxin interactions.
1. Introduction
Mycotoxins are secondary fungal metabolites that are produced in the field and/or during thestorage of crops and raise health concerns for humans and animals due to their toxic potential. Typically,several mycotoxins occur in parallel in crops. They can be produced by different fungal species,but single species are also usually capable of producing a distinct set of toxins [1]. Aflatoxins aremainly produced by Aspergillus and Pencillium species, with aflatoxin B1 (AFB1) being the most toxicand carcinogenic. Aflatoxins—including AFB1, aflatoxin B2 (AFB2), aflatoxin G1 (AFG1), and aflatoxinG2 (AFG2)—are particularly common in maize and other crops produced in warmer climates and are aserious health threat in many regions worldwide (for more information see e.g., [2,3]). Fumonisinsbelong to a large group of toxins referred to as Fusarium toxins that are produced by several Fusariumspecies, such as Fusarium verticillioidies. Moreover, fumonisins can be produced by some species ofthe Aspergillus niger complex. Fumonisins B1, B2, and B3 (FB1, FB2, FB3) are frequently found in rawmaize and can exhibit liver and kidney toxicity [4]. Other Fusarium toxins, which are often presentin maize, include zearalenone (ZEN [5]) and trichothecenes, such as deoxynivalenol (DON) [6,7].
Toxins 2019, 11, 227; doi:10.3390/toxins11040227 www.mdpi.com/journal/toxins125

Toxins 2019, 11, 227
In addition to such ‘traditional’ mycotoxins, which have been assessed and monitored in relative depth,so called ‘emerging’ mycotoxins have been identified. Similar to traditional mycotoxins, emergingmycotoxins are directly produced by fungi. Although some have been known for several decadesalready, emerging mycotoxins are still, however, less investigated and understood. One example ofemerging mycotoxins is moniliformin (MON), which is also produced by some Fusarium species [8].
In addition to the free mycotoxins produced by toxigenic fungi (free parent compounds),mycotoxins can be modified in their chemical structure by biological or chemical processes [9–11].Further, mycotoxins can be connected to the matrix, either by being physically entrapped or bycovalent binding to matrix molecules. A proposal for a harmonized terminology of modified andmatrix-associated mycotoxins was provided by Rychlik et al. [11]. Such forms can raise analyticalchallenges, which is particularly true for matrix-associated mycotoxins. For those, special treatmentsof the matrix, after extraction of free mycotoxins, are required to be able to extract the boundforms. However, free modified forms are, similar to emerging mycotoxins, often not covered byroutine analysis.
Food processing, in general, is capable of affecting mycotoxins present in the raw materials.A reduction in mycotoxin concentrations might be caused by fractionation or (partial) degradationof the toxins, leading also to lower toxicity. However, often, lower mycotoxin levels (also) involvemodification or binding mechanisms. In such cases, the resulting structures might still harbor unknowntoxicity or might be (re)converted into a toxic form. Further, concentrations of free toxins can evenincrease during food processing by releasing mycotoxins from matrix components (if matrix-associatedmycotoxins are present in the raw material and depending on the processing conditions). Tortillas area traditional staple food for the Mesoamerican population and are increasing in popularity throughoutthe world [12], which also applies to related products, such as tostadas, tortilla chips, and maizechips. Their unique flavor is caused by an alkaline cooking of maize—a special processing procedurecalled nixtamalization. This process can cause several physicochemical changes in maize kernelsand is capable of affecting mycotoxins. This review presents the current knowledge on mycotoxinchanges during the process of tortilla production with a particular focus on the nixtamalization step.In doing so, changes in the concentration of free parent forms are considered, as well as their potentialmodification and the putative toxicological impacts.
2. Processes Involved in Nixtamalization and Tortilla Production
Nixtamalization describes an ancient food processing procedure developed and applied byindigenous Mesoamerican (e.g., Aztec and Mayan) civilizations [13], which is still used nowadays.It represents alkaline cooking of maize kernels. Traditionally, this is done using lime, which mainlyconsists of Ca(OH)2. Classic nixtamalization also makes use of wood ash. In traditional nixtamalization(Figure 1), maize kernels are cooked in lime water followed by steeping at room temperature, whichtypically takes place overnight. During nixtamalization, the elevated pH and high temperaturefacilitate the softening of the endosperm and the release of the pericarp. After steeping, the cookingand steeping liquid, the so-called nejayote, is removed. The alkaline-cooked kernels (nixtamal) are thenwashed with water to remove excessive lime, as well as (part of) the loosened pericarp. The aleuronelayer, i.e., the outermost layer of the endosperm that is rich in protein and vitamin B1–3, stays attachedto the starchy endosperm. The aleurone layer also contributes to a reduction of protein and starchlosses during cooking, steeping, and washing [14]. After washing, the nixtamal is stone-ground uponthe addition of water to form a maize dough called masa. Small portions of masa are formed intoballs that are flattened into thin discs. The so-formed tortillas are baked on a hot plate or in an oven.By frying, tortillas and tortilla strips can be further processed into tostadas and tortilla chips (or similarproducts). Additionally, masa can also be used to prepare maize chips. With respect to storage, masacan be dried and later remoistened for further processing. Moreover, a dry masa flour can be producedfrom low-moisture nixtamal by fine grinding under dry conditions. In this process, due to the lowmoisture, no release of starch granules from the protein matrix occurs compared with fresh masa
126

Toxins 2019, 11, 227
production, in which nixtamal is ground at a high moisture level. Dry masa flour is often used incommercial tortilla production.
Figure 1. Scheme of typical steps and (by)products in traditional nixtamalization and tortilla production.The industrial production of tortillas often makes use of dry masa flour, which is made from driednixtamal by fine grinding (not shown).
Alkaline cooking of maize causes several physical, as well as (bio)chemical, changes [14,15]. Someof those are associated with the enhanced nutritional value of the grain and are of particular importancein diets mainly relying on maize. The improved bioaccessibility of calcium and niacin (vitamin B3) arelikely the most important of these changes. Thanks to the latter, pellagra—a niacin-deficiency diseasetypically related to maize- and sorghum-based nutrition—is not common in tortilla-eating countries.Moreover, nixtamalization can improve protein digestibility and can positively affect the protein qualityof maize by partially adjusting the leucine-to-isoleucine disproportion [16]. In tortillas, few amino acidswere found to be reduced—including leucine, which can act as an antagonist of isoleucine. Nonetheless,maize protein is, in general, deficient in lysine and tryptophan but relatively rich in the sulfur-containingamino acids methionine and cystine. Nixtamalization furthermore enhances the content of resistantstarch, which is accompanied by a lower glycemic index [17,18]—a factor that is nowadays of specialinterest. Furthermore, traditional tortilla production is capable of lowering mycotoxin contaminations,as outlined below, which is of particular significance for a healthy cereal-based diet. Lime-cookedmaize and products thereof are, moreover, characterized by a unique flavor, which contributes to theincreasing popularity of such foods on a global level [12,19].
3. Aflatoxins during Nixtamalization and Tortilla Production
3.1. Impact on Aflatoxin Concentrations by Traditional Nixtamalization
Because aflatoxins, particularly AFB1, are a severe health threat and are often found in maizeproduced in warmer climates, strategies for reducing aflatoxin contaminations are of special importance.Interestingly, traditional nixtamalization is in several studies described to have a high potential for
127
Toxins 2019, 11, 227
lowering aflatoxin concentrations (for details, see Table 1). The nejayote, the main waste byproduct,which typically also contains a solid fraction that mainly consists of maize tip cap, pericarp, and germ,can in return show a certain accumulation of aflatoxins.
The loss in aflatoxins and potential transfer to the lime water is also dependent on the type ofaflatoxin [20,21]. In a study by Ulloa-Sosa et al. [21], AFB1 + AFB2 were less reduced (by around40%–50% in nixtamal and masa) compared with AFG1 + AFG2 (by around 75%). The total aflatoxinconcentration in nixtamal and masa was approximately reduced by 60%–65%. Remarkably, whereasmost of the AFB1 + AFB2 were detected in the nejayote, no AFG1 or AFG2 could be detected inthis matrix, pointing to a degradation or transformation into undetectable form(s) upon exposure toalkaline pH. Tortillas showed approximate reductions in total aflatoxins, AFB1 + AFB2, and AFG1 +AFG2 levels of 70%, 60%, and 80%, respectively. Additionally, de Arriola et al. [20] found AFG1 andAFG2 to be somewhat more reduced during nixtamalization than AFB1 and AFB2 (average reductionof AFB1, AFB2, AFG1, and AFG2 in masa approximately 93%, 90%, 98%, and 97%, respectively).Both studies were performed with fungal-inoculated kernels. Abbas et al. [22] analyzed the impactof the entire tortilla production process (covering nixtamalization using a 2% Ca(OH)2 solution) onnatural aflatoxin contaminations. Here, the AFB1 content was on average reduced by 40%, and theAFB2 content was reduced by only 28%. AFG1 and AFG2 were not detected in unprocessed maize (orin tortillas).
Enhancing the concentrations of Ca(OH)2 for cooking and steeping would not necessarily causea more pronounced aflatoxin reduction in tortillas [20,23]. Lime concentrations of >2% are evendescribed to produce tortillas with organoleptic characteristics unsuitable for human consumption [20].De Arriola et al. [20] found average reductions of total aflatoxin concentrations in masa and tortillasof 94% and 95%, respectively, at 0.6% lime without significant difference compared with the useof 1.87% lime. The experiments were done on highly aflatoxin-contaminated maize obtained byfungal inoculation. Moreover, the cooking procedure (i.e., cooking in an open kettle versus pressurecooking in an autoclave) made no significant difference regarding the change in total aflatoxinconcentration [20]. When comparing the impact of five different nixtamalization processes on aflatoxinconcentrations (see Table 1), Price et al. [23] found cooking, prolonged steeping, and washing ofnixtamal to facilitate aflatoxin reductions in nixtamal, masa, and tortillas. Here, aflatoxin levels werereduced by approximately 50%–70% in tortillas compared with the naturally contaminated unprocessedmaize (initial aflatoxin level of around 140 μg/kg). When using AFB1-spiked kernels (100 μg/kg) inprevious experiments, the authors mentioned that the toxin was almost not detected after tortillaproduction [23].
Based on their experimental data, Moreno-Pedraza et al. [24] proposed a (traditional) process fornixtamalization and tortilla production, which is supposed to completely reduce AFB1 contaminations.The key steps are as follows: (i) cooking kernels in 1% lime at 90 ◦C for 45 min; (ii) further steepingin the alkaline solution at 25 ◦C for 18 h; (iii) removal of the nejayote followed by only one washingstep to remove the pericarp but to preserve the alkaline conditions (approximately pH 10) of thenixtamal; (iv) resting the masa, which has been obtained by grinding the washed nixtamal and stillfeatures the high pH value at room temperature for 40 min; and (v) flattening and cooking of thetortillas. The authors found that the nixtamalization step, the resting of the alkaline masa for ≥30 min,and/or the tortilla baking completely or almost completely eliminated AFB1 levels (either low naturalcontamination or a 115–125 μg/kg spike in the masa). In this study, the alkaline treatment lead tothe formation of at least two unidentified degradation or transformation products: one of 301.25 Da(molecular formula: C17H16O15) and another of 325.33 Da (molecular formula: C17H18O5) [24].
To follow the fate of aflatoxin during traditional nixtamalization, radio-labeled AFB1 was used [25].Natural AFB1 contamination (at low and high levels) was found to be lowered by 97%–100% aftertraditional nixtamalization using a chromatographic method. When radio-labeled AFB1 was spiked inunprocessed maize, the loss in radioactivity amounted to 84% in the masa. The remaining radioactivitywas detected in the nejayote and the washing liquids (with decreasing levels in later washings).
128

Toxins 2019, 11, 227
Whereas the aflatoxin retained in the masa appeared intact (detectable by an antibody-based method),aflatoxin in the liquid waste fractions was undetectable by means of chromatography [25].
3.2. Aflatoxin Reductions by Alternative Nixtamalization Processes
The abovementioned studies point to a high potential of traditional nixtamalization to lower aflatoxinconcentrations. However, traditional nixtamalization is a time-consuming process characterized bya relatively high input of water and energy. Moreover, the nejayote is considered to be a highlyproblematic byproduct due to its excessive pH, its high content of organic and insoluble matter, andother factors [26], and it is usually disposed in landfills, not utilized [27]. Thus, to reduce water andenergy inputs and the amount of wastewater, alternative processing procedures were considered. Suchmethods were not only tested regarding organoleptic and nutritional characteristics, but also in viewof aflatoxin reductions as outlined below.
One promising alternative method for masa and tortilla production might be the extrusion of maizemeal upon the addition of lime. At a lime concentration of 0.2%, based on maize meal, organolepticproperties were found to be comparable to traditionally produced masa/tortillas (using a 0.33% limesolution, which represented 1% lime based on maize meal). Total protein and lysine contents weresimilar (or only slightly lowered), but the tryptophan loss was much lower in extruded masa comparedwith traditional masa [28]. A higher nutritional value, accompanied by an elevated weight gainand protein efficiency ratio in a rat feeding trial, was, in addition, shown for tortillas produced withmaize meal extruded at 0.15%–0.25% lime (relative to maize meal mass) compared with traditionaltortillas produced with masa prepared with 2% lime based on kernel mass (= 0.67% lime solution) [29].Elias-Orozco et al. [30] evaluated the alkaline extrusion process regarding aflatoxin reductions innaturally contaminated maize. Astonishing, in the highly contaminated batch, they found a high levelof aflatoxin M1 (AFM1) in the raw maize, which was only around 20% less than the AFB1 level. It hadbeen previously described that Aspergillus spp. are capable of producing AFM1 (and aflatoxin M2);however, usually relatively low amounts of AFM1, compared with AFB1 or total aflatoxins, are foundin maize or in culture media [31–34]. Furthermore, they detected AFB1-dihydrodiol in the raw maize,which is formed via enzymatic oxidation of AFB1 followed by non-enzymatic hydrolysis. Tortillasproduced after extrusion of maize meal lacking any lime showed reductions in AFB1, AFB1-dihydrodiol,and AFM1 levels of approximately 46%, 54%, and 20%, respectively. When lime was added at 0.3%relative to maize meal mass, reductions increased to approximately 74%, 70%, and 52%, respectively.At 0.5% lime, they amounted to 83%–89%. Moreover, the authors tested extrusion upon the addition of0.75%–3% H2O2, alone or in combination with 0.3% lime. Similar to lime, adding H2O2 to the extrusionprocess can increase aflatoxin reductions in tortillas. However, the combination of lime and H2O2
showed no or minor benefits compared with lime alone, except regarding AFM1 reduction. Here,reduction was enhanced from approximately 52% (0.3% lime, only) to 61%–73% (0.3% lime + 0.75%–3%H2O2 based on maize meal). To compare, traditional nixtamalization of the highly contaminated maizeresulted in AFB1, AFB1-dihydrodiol, and AFM1 reductions of 92%–94%. Similar results on the effect ofextrusion treatments and traditional nixtamalization were found for a maize batch contaminated withAFB1 at a lower level; other aflatoxins were here not detected [30] (see Table 1 for details).
Pérez-Flores et al. [26] tested the use of a microwave for the nixtamalization process. For that,maize grits (obtained from fungal-inoculated kernels) were cooked in a minimized amount of limewater (0.5% Ca(OH)2) in a microwave (for details, see Table 1). After steeping (3 h), no water removalor washing, which could have caused fractionation of mycotoxins, was indicated by the authors.The so-produced masa had 36%–82% lower aflatoxin concentrations than the maize kernels, with higherreduction at higher initial contamination levels. In tortillas, aflatoxin levels were lowered by 68%–84%of the initial amount. Tortillas produced by such microwave nixtamalization showed comparablephysicochemical (moisture, pH, color) and technological properties (puffing, rollability, weight loss) asdescribed for traditionally produced tortillas.
129

Toxins 2019, 11, 227
Minimization of water and energy input was also tested with a so-called ecological nixtamalizationprocess [35]. Here, maize meal was mixed with a minimum amount of hot (92 ◦C) 0.375% lime solutionfor only 10 min. After steeping (2 h), the nixtamal was ground into masa without any waterremoval or washing steps. With such a process, AFB1 + AFB2 levels were lowered by 25%–40%,13%–25%, and 61%–78% in the nixtamal, masa, and tortillas, respectively. Higher percentage reductionswere, however, detected at lower initial contamination levels. Although applied to milled maize,the ecological nixtamalization was overall less effective in reducing aflatoxins compared with atraditional nixtamalization process applied to kernels of the same (fungal-inoculated) batch. The testedtraditional nixtamalization covered a higher concentration of the lime water (1% lime), longer incubationtimes (70 min cooking, 12 h steeping), removal of the nejayote, and washing of the nixtamal (whichtypically also removes the loosened pericarp). Here, aflatoxin reductions amounted to 83%–92%,87%–89%, and 90%–92% in nixtamal, masa, and tortillas [35].
Torres et al. [36] compared a traditional process (that included the cooking of kernels in limewater) with a commercial one. In the latter, whole maize kernels were mixed with lime and boilingwater without further cooking (similar as described to the aforementioned ecological nixtamalizationof maize meal [35]). In both processes tested by Torres et al. [36], the nejayote was removed after a14 h steeping, and the nixtamal was washed twice. In the commercial process, the pH levels of thenixtamal, masa, and tortillas were lower compared with those in the traditional one (5.8–5.9 comparedto 6.7–6.8). Moisture content was also slightly lower. Further, the loss of solids was reduced (4.1% inthe commercial versus 6.8% in the traditional process). These factors likely contributed to the lowerefficiency of aflatoxin reduction: The commercial processing reduced the level of total aflatoxins intortillas by 30%, whereas the traditional tortilla production was more efficient (52% aflatoxin loss).Maize chips and tortilla chips showed aflatoxin reductions of 71% when using traditionally producedmasa and 79%–85% upon use of masa produced with the tested commercial process. However, maizeat different initial aflatoxin concentrations was applied to the two processes, which might also haveaffected the aflatoxin reduction efficiency. In this study, samples were acidified upon extraction(before filtration of suspended samples) to cause a reconversion of potential transiently transformedaflatoxins [36] (see below).
3.3. Potential Reconversion of Modified Aflatoxins
In general, besides the leaching of aflatoxins into liquid fractions, alkaline conditions can causethe opening of the lactone ring of aflatoxins (including AFB1), resulting in a loss of fluorescence of themolecules and thus a loss of fluorescence-based detection. Further, a strongly reduced toxicity andmutagenicity after cleavage of the lactone ring was described [37]. In nixtamalized maize (products),the lowered aflatoxin concentrations were found to be accompanied by lower mutagenicity andoxidative stress in vitro [23,38]. Vázquez-Durán et al. [38] showed that for extracts of raw maize,a more pronounced lipid peroxidation in kidney Vero cells occurred than for extracts of tortillas,which were produced from the raw maize by a microwave nixtamalization process (as describedby Pérez-Flores et al. [26]) and had a 84% lower aflatoxin level. Further, no mutagenic toxicity wasdetected in the tortillas in the Ames test, but it was present in the unprocessed maize. Similarly, Priceand Jorgensen [23] observed a reduced mutagenic potential for masa and tortilla samples comparedwith raw maize when testing different nixtamalization processes (although the number of revertantsin the Ames test did not always correlate with the detected aflatoxin level regarding the extentof reductions).
The modification of aflatoxins during alkaline treatment is not necessarily permanent, however,and might be reversed upon exposure to acidic conditions, as present in monogastric digestive systems.Price and Jorgensen addressed this issue by acidifying the suspended samples in the course of aflatoxinextraction (original pH around 11; acidified: 5–6), mimicking acidification in the human stomach.In fact, in doing so, part of the undetectable modified aflatoxin(s) was reconverted into fluorescentform(s). After acidification, the total aflatoxin reduction in the tortillas amounted to only 20%–46%,
130

Toxins 2019, 11, 227
instead of 48%–73% when lacking such a step. For masa, the reduction in fluorescent aflatoxin(s) wasapproximately 14%–56% without and 4%–29% with acidification. Additionally, Méndez-Albores etal. [39] showed that the reduction in aflatoxin concentrations by nixtamalization is partly reversible.After acidification, aflatoxins became, to some extent (approximately 5% of the concentration in rawmaize), detectable in the dried nejayote, which originally had a pH of 12. When the extracts ofthe samples were acidified (initial pH of samples: 8.2–8.3), aflatoxin concentrations were around57% and 34% higher compared with those in the alkaline extracts of masa and tortilla, respectively.However, compared with the raw maize, the aflatoxin levels were still very low with reductions of78% in masa and 91% in tortillas (for the alkaline extracts, reductions amounted to 86% and 93%,respectively). Pérez-Flores et al. [26] found that only very low amounts of aflatoxins in the extractsof masa and tortillas were recovered by an acidification step. Here, the pH of masa and tortillas wasagain around 8.2 prior acidification (and adjusted to 3). Different from Price and Jorgensen [23], in thetwo latter studies [26,39], not the suspended samples, but the sample extracts were acidified. However,when treated with weak bases and during ammoniation, AFB1 was found to interact with matrixmacromolecules, including non-protein fractions [40,41]. Hence, it is tempting to speculate that theextraction efficiency of the modified aflatoxin(s) is dependent on the pH of the matrix and that itis higher under acidic conditions. If this is true, matrix-associated aflatoxins potentially present intortillas could be also released in the stomach.
In the study by Price and Jorgensen [23], acidification of the samples was found to be furthercapable of restoring mutagenicity in the Ames test. The mutagenic effects for the tortilla sampleswere even somewhat higher than for raw maize, which, however, contradicted the reduced aflatoxinconcentrations that were observed in the acidified tortilla samples [23]. This might indicate theformation of additional mutagenic form(s) during tortilla production, which could also explain therather low correlation between mutagenicity and aflatoxin concentration determined by the authors.In general, the efficiency and persistency of aflatoxin transformation/detoxification by elevated pHis dependent on several factors. Positive effects of temperature, time, and kernel moisture on AFB1reduction under alkaline conditions were shown for ammoniation at atmospheric pressure [42]and under elevated pressure [43]. Differences in aflatoxin reductions depending on the processingprocedures were also found for nixtamalization and tortilla production (Table 1). Further, initialcontamination levels and type of contamination (contamination in the field, post-harvest contamination,spiking with pure standard) might affect mycotoxin reduction efficiencies. Such factors should beconsidered when assessing the aflatoxin loss in view of toxicity in alkaline-processed maize andproducts thereof, such as tortillas.
131

Toxins 2019, 11, 227
Ta
ble
1.
Effec
tofa
lkal
ine
cook
ing
(nix
tam
aliz
atio
n)of
mai
zeke
rnel
san
dof
enti
reto
rtill
a(c
hips
)pro
duct
ion
onafl
atox
inco
nten
ts.
Stu
dy
No
.in
Fig
ure
2
Nix
tam
ali
za
tio
nT
ort
illa
Ba
kin
go
nH
ot
Pla
te
Afl
a-
tox
in(s
)
Init
ial
Le
ve
lin
Ra
wM
aiz
e(μ
g/k
g)
aC
orr
ect
ed
Ch
an
ge
(%)
bC
om
me
nt(
s)R
efe
ren
ceA
lka
lin
eS
olu
tio
nA
dd
itio
ns
on
Ori
g.
Ma
ize
Ma
ssB
asi
sC
oo
kin
gS
tee
pin
gW
ash
ing
of
Nix
tam
al
1ca
.7.5
%lim
eso
luti
on
167%
wat
er,c
a.12
.5%
lime
60m
inO
nly
cool
dow
naf
ter
cook
ing
Not
indi
cate
d
Perf
orm
ed(f
urth
erde
tails
not
prov
ided
)
Tota
lAFs
Not
prov
ided
(ino
cula
ted)
Nix
tam
al:c
a.−6
5c
Nej
ayot
e:ac
cum
.M
asa:
~−60
c
Tort
illas
:~−7
4c
Ove
rall:
Rel
ativ
equ
anti
ficat
ion
only
and
very
appr
oxim
ate
data
[21]
AFB
1+
AFB
2N
otpr
ovid
ed(i
nocu
late
d)
Nix
tam
al:~−5
1c
Nej
ayot
e:ac
cum
.M
asa:
~−38
c
Tort
illas
:~−6
1c
Mos
toft
helo
stA
FBw
asfo
und
inth
ene
jayo
te
AFG
1+
AFG
2N
otpr
ovid
ed(i
nocu
late
d)
Nix
tam
al:~−7
5c
Nej
ayot
e:n.
d.M
asa:
~−74
c
Tort
illas
:~−8
3c
AFG
1+
AFG
2w
ere
larg
ely
deco
mpo
sed
22%
Ca(
OH
) 2so
luti
onN
otsp
ecifi
ed5
min
(inc
l.st
irri
ng)
12h
Thor
ough
rins
ew
ith
dist
illed
wat
er
110–
120◦ C
,7–
8m
inon
each
side
AFB
141
7–47
6To
rtill
as:−
28to−4
9(m
ean:
−40)
-[2
2]
AFB
254
–59
Tort
illas
:−17
to−4
0(m
ean:
−28)
-
30.
6%–1
.87%
lime
solu
tion
1480
%w
ater
,1–3
%lim
e
95◦ C
,40
min
or12
1◦ C
,0.3
4ba
r,30
min
O/N
Seve
ral
was
hes
wit
hta
pw
ater
180–
250◦ C
(int
erna
lte
mp.
:94◦ C
),1.
5m
in
Tota
lAFs
5245
–60,
478
(ino
cula
ted)
Mas
a:~−
85to−9
8To
rtill
as:~−9
2to−9
9
No
sign
ifica
ntdiff
eren
ces
betw
een
diff
eren
ttre
atm
ents
[20]
AFB
132
65–3
7,69
6(i
nocu
late
d)M
asa:
~−89
to−9
6To
rtill
as:~−9
4to−9
8
AFB
251
2–95
13(i
nocu
late
d)M
asa:
~−83
to−9
7To
rtill
as:~−8
8to−9
8
AFG
112
36–1
1,13
1(i
nocu
late
d)M
asa:
~−97
to−9
9To
rtill
as:~−9
7to−1
00
AFG
222
6–16
39(i
nocu
late
d)M
asa:
~−93
to−1
00To
rtill
as:~−9
6to−1
00
132
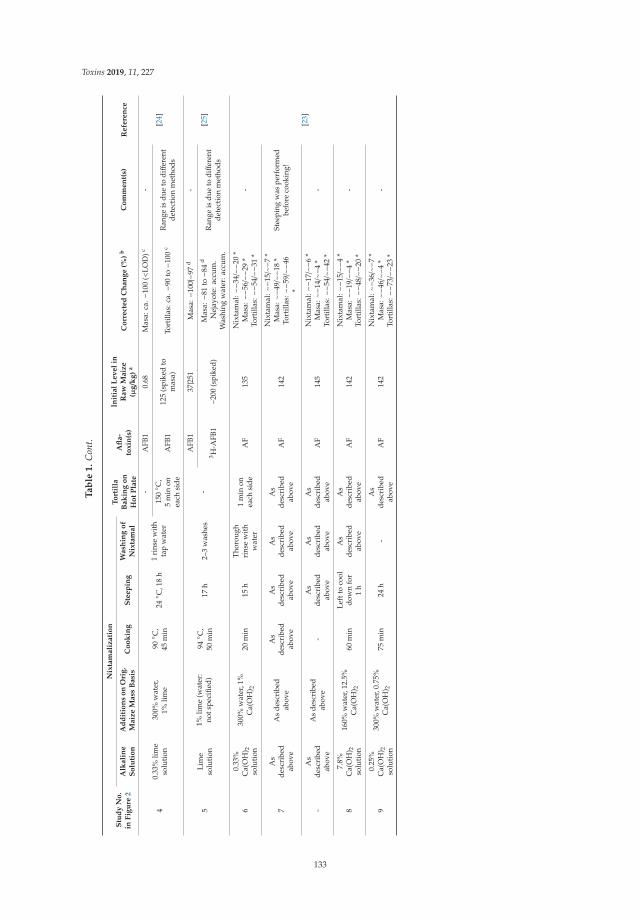
Toxins 2019, 11, 227
Ta
ble
1.
Con
t.
Stu
dy
No
.in
Fig
ure
2
Nix
tam
ali
za
tio
nT
ort
illa
Ba
kin
go
nH
ot
Pla
te
Afl
a-
tox
in(s
)
Init
ial
Le
ve
lin
Ra
wM
aiz
e(μ
g/k
g)
aC
orr
ect
ed
Ch
an
ge
(%)
bC
om
me
nt(
s)R
efe
ren
ceA
lka
lin
eS
olu
tio
nA
dd
itio
ns
on
Ori
g.
Ma
ize
Ma
ssB
asi
sC
oo
kin
gS
tee
pin
gW
ash
ing
of
Nix
tam
al
40.
33%
lime
solu
tion
300%
wat
er,
1%lim
e90◦ C
,45
min
24◦ C
,18
h1
rins
ew
ith
tap
wat
er
-A
FB1
0.68
Mas
a:ca
.−10
0(<
LOD
)c-
[24]
150◦ C
,5
min
onea
chsi
deA
FB1
125
(spi
ked
tom
asa)
Tort
illas
:ca.−9
0to−1
00c
Ran
geis
due
todiff
eren
tde
tect
ion
met
hods
5Li
me
solu
tion
1%lim
e(w
ater
:no
tspe
cifie
d)94◦ C
,50
min
17h
2–3
was
hes
-
AFB
137|2
51M
asa:−1
00|−9
7d
-
[25]
3 H-A
FB1
~200
(spi
ked)
Mas
a:−8
1to−8
4d
Nej
ayot
e:ac
cum
.W
ashi
ngw
ater
:acc
um.
Ran
geis
due
todiff
eren
tde
tect
ion
met
hods
60.
33%
Ca(
OH
) 2so
luti
on
300%
wat
er,1
%C
a(O
H) 2
20m
in15
hTh
orou
ghri
nse
wit
hw
ater
1m
inon
each
side
AF
135
Nix
tam
al:~−3
4/~−
20*
Mas
a:~−
56/~−2
9*
Tort
illas
:~−5
4/~−
31*
-
[23]
7A
sde
scri
bed
abov
e
As
desc
ribe
dab
ove
As
desc
ribe
dab
ove
As
desc
ribe
dab
ove
As
desc
ribe
dab
ove
As
desc
ribe
dab
ove
AF
142
Nix
tam
al:~−1
5/~−
7*
Mas
a:~−
49/~−1
8*
Tort
illas
:~−5
9/~−
46*
Stee
ping
was
perf
orm
edbe
fore
cook
ing!
-A
sde
scri
bed
abov
e
As
desc
ribe
dab
ove
-A
sde
scri
bed
abov
e
As
desc
ribe
dab
ove
As
desc
ribe
dab
ove
AF
145
Nix
tam
al:~−1
7/~−
6*
Mas
a:~−
14/~−4
*To
rtill
as:~−5
4/~−
42*
-
87.
8%C
a(O
H) 2
solu
tion
160%
wat
er,1
2.5%
Ca(
OH
) 260
min
Left
toco
oldo
wn
for
1h
As
desc
ribe
dab
ove
As
desc
ribe
dab
ove
AF
142
Nix
tam
al:~−1
5/~−
4*
Mas
a:~−
19/~−4
*To
rtill
as:~−4
8/~−
20*
-
90.
25%
Ca(
OH
) 2so
luti
on
300%
wat
er,0
.75%
Ca(
OH
) 275
min
24h
-A
sde
scri
bed
abov
eA
F14
2N
ixta
mal
:~−3
6/~−
7*
Mas
a:~−
46/~−4
*To
rtill
as:~−7
3/~−
23*
-
133

Toxins 2019, 11, 227
Ta
ble
1.
Con
t.
Stu
dy
No
.in
Fig
ure
2
Nix
tam
ali
za
tio
nT
ort
illa
Ba
kin
go
nH
ot
Pla
te
Afl
a-
tox
in(s
)
Init
ial
Le
ve
lin
Ra
wM
aiz
e(μ
g/k
g)
aC
orr
ect
ed
Ch
an
ge
(%)
bC
om
me
nt(
s)R
efe
ren
ceA
lka
lin
eS
olu
tio
nA
dd
itio
ns
on
Ori
g.
Ma
ize
Ma
ssB
asi
sC
oo
kin
gS
tee
pin
gW
ash
ing
of
Nix
tam
al
100.
33%
lime
solu
tion
300%
wat
er,1
%lim
e98◦ C
,40
min
14h
2w
ashe
sw
ith
300%
wat
er(b
ased
onor
ig.m
aize
mas
s)
Baki
ngin
ath
ree-
tiere
d,ga
s-fir
edov
enfo
r39
s.A
vera
gete
mp.
atth
eth
ree
leve
ls:
177◦ C
,23
3◦ C
,45
3◦ C
Tota
lAFs
ca.1
10
Nix
tam
al:~−2
8*
Nej
ayot
e:n.
d.*
Mas
a:~−
44*
Tort
illas
:−52
*M
aize
chip
s:−7
9*
Tort
illa
chip
s:−8
5*
Both
proc
esse
s:C
orn
chip
san
dto
rtill
ach
ips
wer
epr
epar
edby
fryi
ngm
asa
and
tort
illa
stri
psin
oila
t190◦ C
for
2an
d3
min
,res
pect
ivel
y
[36]
11A
sde
scri
bed
abov
e
As
desc
ribe
dab
ove
No
cook
ing,
butm
anua
lm
ixin
gof
mai
zean
dlim
ew
ith
boili
ngw
ater
As
desc
ribe
dab
ove
As
desc
ribe
dab
ove
As
desc
ribe
dab
ove
Tota
lAFs
ca.4
3
Nix
tam
al:~−1
2*
Nej
ayot
e:ac
cum
.*M
asa:
~−23
*To
rtill
as:−
30*
Mai
zech
ips:−7
1*
Tort
illa
chip
s:−7
1*
121%
lime
solu
tion
200%
dist
illed
wat
er,
2%lim
e
85◦ C
,70
min
22◦ C
,12
h
1w
ash
wit
h20
0%ta
pw
ater
(bas
edon
orig
.mai
zem
ass)
270◦ C
,in
tota
l50–
54s
onea
chsi
de
AFB
1+
AFB
229|9
3(i
nocu
late
d)N
ixta
mal
:−92|−8
3c
Mas
a:−8
9|−8
7c
Tort
illas
:−92|−9
0c
—
[35]
130.
375%
lime
solu
tion
80%
dist
illed
wat
er,
0.3%
lime
No
cook
ing,
butm
anua
lm
ixin
gof
mai
zean
dho
tlim
ew
ater
(92◦ C
)for
10m
in
22◦ C
,2h;
nore
mov
alof
wat
erin
dica
ted
-A
sde
scri
bed
abov
e
AFB
1+
AFB
229|9
3(i
nocu
late
d)N
ixta
mal
:−40|−2
5c
Mas
a:−2
5|−1
3c
Tort
illas
:−78|−6
1c
Use
ofm
aize
mea
l(p
arti
cle
size
:800
μm
)
134

Toxins 2019, 11, 227
Ta
ble
1.
Con
t.
Stu
dy
No
.in
Fig
ure
2
Nix
tam
ali
za
tio
nT
ort
illa
Ba
kin
go
nH
ot
Pla
te
Afl
a-
tox
in(s
)
Init
ial
Le
ve
lin
Ra
wM
aiz
e(μ
g/k
g)
aC
orr
ect
ed
Ch
an
ge
(%)
bC
om
me
nt(
s)R
efe
ren
ceA
lka
lin
eS
olu
tio
nA
dd
itio
ns
on
Ori
g.
Ma
ize
Ma
ssB
asi
sC
oo
kin
gS
tee
pin
gW
ash
ing
of
Nix
tam
al
141%
lime
solu
tion
300%
dist
illed
wat
er,
3%lim
e
85◦ C
,35
min
22◦ C
,14
h
1w
ash
200%
wit
hta
pw
ater
(bas
edon
orig
.mai
zem
ass)
270◦ C
,in
tota
l50–
54s
onea
chsi
de
AFB
1+
AFB
267
8/68
0**
(ino
cula
ted)
Nej
ayot
e:n.
d./s
light
accu
m.*
*M
asa:
~−86/~−7
8**
Tort
illas
:−93/~−9
1**
Mos
tafla
toxi
nsap
pear
tobe
degr
aded
[39]
150.
5%C
a(O
H) 2
solu
tion
100%
wat
er,0
.5%
Ca(
OH
) 2
Mic
row
ave
(165
0W
,24
50H
z),
5.5
min
22◦ C
,3h;
now
ater
rem
oval
-
270◦ C
,in
tota
l54–
55s
onea
chsi
de
AFB
1+
AFB
222
–141
(inoc
ulat
ed)
Mas
a:−3
6to−8
2/~−
34to−8
1**
Tort
illas
:−68
to−8
4/~−
67to
−83
**
Use
ofm
aize
grit
s.H
ighe
rre
duct
ion
athi
gher
init
ial
conc
entr
atio
n
[26]
161%
lime
solu
tion
300%
wat
er,3
%lim
e90
–96◦ C
,30
min
O/N
Seve
ral
rins
esw
ith
tap
wat
er
290◦ C
,in
tota
l40–
80s
onea
chsi
de
AFB
149
5|29
Tort
illas
:−94|~−9
2
-
[30]
AFB
1-di
ol30|-
Tort
illas
:~−9
3|-
AFM
140
2|-
Tort
illas
:−92|-
-W
ater
,onl
y75
%w
ater
Extr
uder
(low
shea
r,si
ngle
-sc
rew
,35
rpm
scre
wsp
eed,
87◦ C
barr
elte
mp.
)
--
As
desc
ribe
dab
ove
AFB
149
5|29
Tort
illas
:~−4
6|~−
68
All
extr
usio
ntr
eatm
ents
:U
seof
mai
zem
eal
(par
ticl
esi
ze:8
00μ
m)
AFB
1-di
ol30|-
Tort
illas
:−54|-
AFM
140
2|-
Tort
illas
:−20|-
170.
4%–0
.67%
lime
solu
tion
75%
wat
er,
0.3%
–0.5
%lim
e
Extr
uder
(for
deta
ilsse
eab
ove)
--
As
desc
ribe
dab
ove
AFB
149
5|29
Tort
illas
:−74
to−8
5|~−
100
Hig
her
redu
ctio
nat
high
erlim
eco
ncen
trat
ion
AFB
1-di
ol30|-
Tort
illas
:~−7
0to−8
9|-
AFM
140
2|-
Tort
illas
:~−5
2to−8
3|-
135

Toxins 2019, 11, 227
Ta
ble
1.
Con
t.
Stu
dy
No
.in
Fig
ure
2
Nix
tam
ali
za
tio
nT
ort
illa
Ba
kin
go
nH
ot
Pla
te
Afl
a-
tox
in(s
)
Init
ial
Le
ve
lin
Ra
wM
aiz
e(μ
g/k
g)
aC
orr
ect
ed
Ch
an
ge
(%)
bC
om
me
nt(
s)R
efe
ren
ceA
lka
lin
eS
olu
tio
nA
dd
itio
ns
on
Ori
g.
Ma
ize
Ma
ssB
asi
sC
oo
kin
gS
tee
pin
gW
ash
ing
of
Nix
tam
al
-
0.4%
lime,
1%–4
%H
2O2
solu
tion
75%
wat
er,0
.3%
lime,
0.75
%–3
%H
2O2
Extr
uder
(for
deta
ilsse
eab
ove)
--
As
desc
ribe
dab
ove
AFB
149
5|29
Tort
illas
:~−6
7to−7
8|~−
100
Hig
her
redu
ctio
nat
high
erH
2O2
conc
entr
atio
n.A
t0.3
%lim
e+
3%H
2O2:
affec
tion
ofta
ste
AFB
1-di
ol30|-
Tort
illas
:~−6
8to−8
4|-
AFM
140
2|-
Tort
illas
:~−6
9to−8
1|-
a :Ifn
otm
entio
ned
othe
rwis
e,m
aize
was
natu
rally
cont
amin
ated
.b:U
nles
sin
dica
ted
othe
rwis
e,th
ech
ange
inth
em
ycot
oxin
conc
entr
atio
nis
corr
ecte
dfo
rch
ange
inm
oist
ure
cont
ent.
Neg
ativ
eva
lues
:red
uct
ion;
posi
tive
valu
es:i
ncre
ase.
c :H
ere,
itis
notc
lear
ifth
ech
ange
inth
em
ycot
oxin
conc
entr
atio
nis
corr
ecte
dfo
rch
ange
inm
oist
ure
.d:H
ere,
chan
gein
the
myc
otox
inco
ncen
trat
ion
issu
ppos
edto
beco
rrec
ted
for
chan
gein
moi
stur
e.*:
Her
e,afl
atox
inde
tect
ion
invo
lved
acid
ifica
tion
ofth
esu
spen
ded
sam
ple.
Val
ues
befo
reth
efo
rwar
dsl
ash
(ifpr
esen
t)ar
ede
rive
dfr
oman
alyz
ing
sam
ples
with
outa
cidi
ficat
ion.
**:H
ere,
aflat
oxin
dete
ctio
nin
volv
edac
idifi
catio
nof
the
extr
acts
.Val
ues
befo
reth
efo
rwar
dsl
ash
are
deri
ved
from
anal
yzin
gex
trac
tsbe
fore
acid
ifica
tion
.~:A
ppro
xim
ate
valu
esth
atw
ere
calc
ulat
edfo
rth
isov
ervi
ewby
usin
gth
eda
tapr
ovid
edin
the
cite
dlit
erat
ure.|:
Her
e,in
divi
dual
data
oftw
oba
tche
sar
egi
ven
and
sepa
rate
dby
this
sym
bol.
AFB
1:afl
atox
inB1
;AFB
1-di
ol:a
flato
xin
B1di
hydr
odio
l;A
F:afl
atox
in(s
)not
furt
her
spec
ified
inth
eci
ted
stud
ybu
tlik
ely
tota
lafla
toxi
nsB1+
B2+
G1+
G2;
tota
lAFs
:afla
toxi
nsB1+
B2+
G1+
G2.
accu
m.:
accu
mul
atio
n;LO
D:l
imit
ofde
tect
ion;
n.d.
:not
dete
cted
;O/N
:ove
rnig
ht;o
rig.
:ori
gina
l.
136

Toxins 2019, 11, 227
4. Fumonisins during Nixtamalization and Tortilla Production
4.1. General Impact on Fumonisin Concentrations and Fumonisin Hydrolyzation
Fumonisins are very water-soluble mycotoxins, which can thus leach into the liquid fraction duringcooking and steeping procedures. Furthermore, an alkaline treatment can result in a hydrolysis of theO-acyl bonds of fumonisins, leading to the formation of hydrolyzed fumonisins. Sydenham et al. [44]found, upon steeping of maize kernels and maize meal in 0.1 M Ca(OH)2 (at room temperature, undercontinuous stirring), a reduction in FB1 concentrations and an accumulation of fully hydrolyzed FB1(HFB1; also referred to as aminopentol). For maize meal naturally contaminated with FB1, almost allof the mycotoxin was lost. Here, around 78%–89% of the FB1 was converted into HFB1, with 68%–72%being transferred into the steeping liquid and 11%–17% remaining in the alkali-treated maize meal.The latter contained only up to 9% of the FB1 level of untreated maize meal. In total, around 11%–25%of the FB1 was retained as FB1 or HFB1 in the maize meal. When treating whole kernels (also naturallycontaminated) in the same manner, the reduction in FB1 concentration amounted to 76%–99%. Aftertreatment, kernels were manually sorted by the extent of pericarp loss. Kernels with fully removedpericarp showed almost no FB1 left, and only approximately 4% of the FB1 was detected to be presentas HFB1. In kernels with partly removed pericarp, approximately 7% of the initial FB1 was presentas HFB1, and 24% remained in the parent form [44]. Accordingly, the removal of the nejayote and ofmaize pericarp would contribute to fumonisin reduction in nixtamalized maize.
Pilot-scale processing of naturally contaminated maize simulating commercial nixtamalizationand tortilla (chips) production showed significant reductions in concentrations of FB1 and FB2 [45,46].Although having a similar pattern, the extent of fumonisin reduction varied in both studies amongindividual runs, independent of initial concentration. Voss et al. [45] used different maize batchesfor five runs. Dombrink-Kurtzman et al. [46] examined the same maize batch in two runs but foundnonetheless strong variations, particularly for FB2 (for details, see Table 2). FB1 reduction in nixtamalwas in both studies accompanied by an accumulation of HFB1 in the steeping and washing liquids.Voss et al. [45] detected, besides HFB1, some partially hydrolyzed FB1 (PHFB1) in the raw maize.However, this compound did not accumulate in the nejayote but, if present, decreased over time.The decrease in FB1 and PHFB1 was accompanied by an increase in the fully hydrolyzed form.In general, hydrolyzation particularly takes place in the nejayote, which typically has a pH of ≥11.Palencia et al. [47] found the molar ratio of HFB1 to FB1 to be 21 in the nejayote but around 1 in washwater, masa, and tortillas. The overall transfer of fumonisins to the nejayote amounted in the studyof Voss et al. [45] to approximately 45% of the total initial amount (on a molar basis) of FB1, PHFB1,and HFB1. Additional amounts were detected in the washing water. Dombrink-Kurtzman et al. [46]described the liquid fractions to contain on average of 76% of the initial FB1: 72.5% of FB1 wasconverted into HFB1 and 3.5% remained as FB1. The study also indicated the potential for furtherlowering of FB1 and FB2 levels during masa/tortilla production, in case they were somewhat lessreduced in the nixtamal. FB1 and FB2 reductions in tortillas amounted in both runs to 88%–92% and71%–91% compared with the levels in unprocessed maize, respectively. However, in one of the runs,the nixtamal showed reductions of around 75% for FB1 and only 20%–30% for FB2 [46] (Table 2).
The potential impact of tortilla baking on fumonisin reductions also became obvious in a studythat tested a microwave nixtamalization process using maize grits. Here, total fumonisin levels werenot significantly lowered in masa. This was in accordance with the tested processing procedure,because no removal of nejayote or washing of nixtamal was indicated by the authors. Different frommasa production, the baking of tortilla lowered fumonisins by approximately one half. The reductionduring the heat treatment was likely facilitated by the high pH of masa and tortillas (i.e., around8.1–8.3). The tested physicochemical and technological characteristics were similar to those describedfor traditionally produced tortillas [48].
The fate of fumonisins was also investigated during commercial processing into tortilla(chips) [49,50]. Scudamore et al. [49] analyzed industrial tortilla chip production in United Kingdom
137

Toxins 2019, 11, 227
(UK) plants, involving mixing of a maize flour dough followed by sheeting, cutting, baking, and frying.Alkaline conditions were, however, not indicated. However, because nixtamalization contributes to thetypical flavor of tortillas and tortilla chips, we assume that dry masa flour or a similar ingredient wasinvolved in the commercial production process. When analyzing 11 runs (that comprised two differentcompositions of maize flour mixtures), FB1 + FB2 were lowered by 32%–78% on the product ‘as is’basis (average: 59%). Because the moisture content of the chips is usually more or less comparable tothat of dry maize ingredients, a similar fumonisin reduction would apply when related to dry weight.Commercial tortilla production in Texas was studied by De La Campa et al. [50]. Here, the reduction inFB1 levels was high overall and ranged from 80% to 100% in masa and from 83% to 100% in tortillas.Production conditions strongly differed between the four processing plants, regarding, for example,lime concentration and cooking time.
In experimental studies, De La Campa et al. [50] further investigated the impact of these factors atdifferent initial FB1 levels using fungal-inoculated maize. In doing so, they found a positive impact oflime concentration (when testing lime solutions of around 0.25%–1.6%) on FB1 reduction. This effectwas independent of the initial FB1 concentration, which also had a significant effect on FB1 half-life.Regarding boiling time (15 versus 60 min), the authors mentioned that this factor had no apparenteffect, but data were not shown [50]. Additionally, De Girolamo et al. [51] described the low effectof cooking time on the hydrolyzation of fumonisins, when comparing cooking times of 15, 30, and60 min. In this study, which tested lime solutions with concentrations of around 0.33% and 1.67%,nixtamalization lowered mean FB1 + FB2 levels in masa by 26%–48%. Interestingly, the same processlacking lime resulted in a somehow stronger FB1 + FB2 reduction. Here, PHFB (PHFB1 + PHFB2)levels in masa were also lowered, but the loss was not accompanied by the formation of HFBs (HFB1 +HFB2). Reductions are likely solely caused by the leaching of fumonisins into the liquid fractions.By contrast, the use of lime provoked the formation of (partially) hydrolyzed forms of FB1 and FB2.Hydrolyzation was again more pronounced at higher lime concentration [51].
4.2. Potential Further Transformations of Fumonisins
On the one hand, De Girolamo et al. [51] discovered that alkaline cooking can somehow facilitatethe release of bound fumonisins. In their study, the total mass of FB1 + FB2, PHFBs, and HFBsrecovered after nixtamalization (also including the liquid waste fractions) exceeded the initial mass byaround 50%–80%. In the course of nixtamalization, (part of) the released matrix-associated fumonisinswere suggested to be hydrolyzed. Although the water-cooked maize showed a higher reduction in(free) FB1 + FB2 than the alkali-cooked maize, matrix-associated fumonisins would still be present.Moreover, bound fumonisins in food (and feed) products can, in general, increase health concerns,because free toxins might be released during digestion. Promoting the release from the matrix followedby hydrolyzation of fumonisins could contribute to a detoxification by nixtamalization. Different fromFB1 and FB2, no (liver) cancer-promoting activity or weight loss was found for HFB1 and HFB2 inrats [52]. In contrast, in vitro tests showed a higher toxicity on primary rat hepatocytes in this study.Hence, it was concluded that the hydrolyzed fumonisins are not adsorbed from the gut [52]. A loweror lacking hepatic, intestinal, and neural toxicity of the hydrolyzed form compared with the parentcompound was also shown in pigs and mice [53,54], although an impact on sphingolipid metabolismsin vivo was demonstrated at a high dose of HFB1 [54]. Inhibition of ceramide synthase and disruptionof sphingolipid metabolism is the critical biochemical effect underlying fumonisin cytotoxicity.
On the other hand, hydrolyzation might also favor interaction with other compounds, includingmatrix macromolecules. Interestingly, Park et al. [55] were able to detect matrix-associated fumonisinsin some retail tortilla chip samples. However, when analyzing retail samples, it cannot be excluded thatthe forms were already present in the raw material. To address this question, Burns [56] investigateda nixtamalization process by applying the detection method developed by Park et al. [55]. In doingso, a significant increase in protein-bound and other matrix-associated FB1 during nixtamalizationwas demonstrated. When maize kernels were processed in the same manner, but lacking lime,
138

Toxins 2019, 11, 227
no significant change was observed in the concentration of total matrix-associated FB1 [56]. A reductionin recoverable (H)FB1 was described for experimentally produced and extruded masa flour [57].However, here, the underlying mechanisms (degradation, binding, or modification to undetected freeforms) remained unknown.
N-(carboxymethyl)-FB1 was previously shown to be formed under alkaline conditions at elevatedtemperatures by using pure FB1 incubated overnight with D-glucose [58] and also when heatingHFB1 with D-glucose [59]. Interaction with glucose during extrusion cooking of maize resulted in astrong reduction in fumonisin-induced toxicity in rats [60]. However, when analyzing nixtamalizationand tortilla chip production mimicking commercial processing, no indications were given for a(relevant) formation and accumulation of fumonisin–sugar adducts, namely N-(carboxymethyl)-FB1and N-(1-deoxy-D-fructos-1-yl)-FB1 [45]. By contrast, Park et al. [61] could detect N-fatty acylfumonisins in a tortilla chip sample (in 1 out of 38 retail samples), indicating a potential formation ofthose modified fumonisins in alkali-treated and fried maize products. In vitro studies implicate a hightoxicity of several N-fatty acyl fumonisins. In addition, such modified forms can be more rapidly takenup and accumulated in human/animal cells than FB1 (for an overview, see [4]). However, further studiesare required to obtain more information on the toxicity of N-acetylated fumonisins and their occurrencein foods. The same is true for the interaction of fumonisins with other molecules that potentially takesplace during nixtamalization and the possible contribution to fumonisin-related toxicity.
Using bioassays and feeding trials, several studies indicate a reduced toxicity of FB1-contaminatedmaize raw material after being processed by nixtamalization [47,62–64]. To analyze (potential)kidney damage, in addition to histological analysis, sphinganine can be used as a biomarker forfumonisin-induced ceramide synthase inhibition. Palencia et al. [47] detected reduced accumulation ofsphinganine in cell lines treated with extracts of tortillas compared with those treated with extracts ofraw maize. This was in conjunction with lowered FB1 levels. Here, the sum of FB1 and HFB1 in tortillas(on molar basis) was half of the initial FB1 level detected in the raw maize. The toxic potential wasfound to be lowered by 60% for extracts of tortillas compared with extracts of unprocessed maize [47].Similarly, in feeding trials on rats, kidney sphinganine and sphingosine concentrations were notincreased or less increased in rats fed a diet containing nixtamalized maize (meal) compared with thosefed non-nixtamalized maize (meal) [62,63]. In both studies, nixtamalization was performed with a 1.2%lime solution. Voss et al. [63] used raw maize with three different FB1 contamination levels. Rats thatate a diet containing nixtamalized maize showed no or only week symptoms of nephropathy. This wasmuch different from when the diet contained uncooked maize. Burns et al. [62] additionally includeda mock-nixtamalization control (i.e., cooking of maize meal without lime). Similar to the findingsof De Girolamo et al. [51], this procedure also lowered the FB1 level, but much less hydrolyzationtook place compared with cooking with lime (for details, see Table 2). Both nixtamalization andmock-nixtamalization strongly reduced kidney damage, as well as renal toxicity (evaluated by numberof apoptotic tubule cells), compared with uncooked maize meal [62]. Due to the clearly reducedtoxic effects caused by nixtamalized maize (products), a significant formation of matrix-associatedFB1 or unknown free fumonisin forms that contributed to toxicity was not indicated in these twostudies. This differed from a former rat feeding trial performed by Hendrich et al. [64] using highlyFB1-contaminated maize (obtained by fungal inoculation). Here, although nixtamalization was ableto lower toxicity in some cases, a more pronounced effect would be expected in view of the highloss in FB1 (approximately 98%–100%). When considering the molecular weights, the formed HFB1amounted to approximately 60%–72% of the initial FB1. In this study, it became further obvious thatthe nutritional status was capable of impacting toxicological effects caused by fumonisins presentin the non-nixtamalized and nixtamalized maize. Hence, more research is needed regarding thepotential formation and occurrence of so far undetected and/or unknown toxic fumonisin form(s) inalkali-cooked maize.
139

Toxins 2019, 11, 227
Ta
ble
2.
Effec
tofa
lkal
ine
cook
ing
(nix
tam
aliz
atio
n)of
mai
zeke
rnel
san
dof
enti
reto
rtill
a(c
hips
)pro
duct
ion
onfu
mon
isin
cont
ents
.
Stu
dy
No
.in
Fig
ure
2
Nix
tam
ali
za
tio
n
To
rtil
laB
ak
ing
on
Ho
tP
late
Fu
mo
-n
isin
(s)
Init
ial
lev
el
inR
aw
Ma
ize
(μg/k
g)
aC
orr
ect
ed
Ch
an
ge
(%)
bC
om
me
nt(
s)R
efe
ren
ceA
lka
lin
eS
olu
tio
n
Ad
dit
ion
so
nO
rig
.M
aiz
eM
ass
Ba
sis
Co
ok
ing
Ste
ep
ing
Wa
shin
go
fN
ixta
ma
l
18~0
.37%
lime
solu
tion
~129
0%w
ater
,~4
.8%
lime
100◦ C
,5m
inin
ast
eam
kett
le(i
na
perf
orat
edny
lon
bag)
15h
Was
hw
ith
wat
er
Baki
ngin
aga
s-fir
edov
enw
ith
thre
em
ovin
gti
ers
(fur
ther
deta
ilsno
tpro
vide
d)
FB1
8790
Nix
tam
al,u
nwas
hed:
~−76|~−9
7N
ixta
mal
,was
hed:
~−73|~−9
6N
ejay
ote:
n.d.|s
light
accu
m.
Was
hing
wat
er:n
.d.|s
light
accu
m.
Mas
a:~−
87|~−9
2To
rtill
as:~−8
8|~−
92To
rtill
ach
ips:
n.a.|~−9
4
Ove
rall:
Dat
aof
two
prod
ucti
onru
nsar
egi
ven;
tort
illa
chip
sw
ere
prod
uced
inon
lyon
eru
nby
fryi
ngin
oila
t190◦ C
for
60s.
Oft
hein
itia
lFB1
,ato
talo
f62
%–9
0%w
asre
cove
red
asFB
1or
HFB
1e
from
the
neja
yote
,mos
tly
asH
FB1
[46]
HFB
1Pr
obab
lyn.
d.
(Slig
ht)a
ccum
.in
all
inte
rmed
iate
prod
ucts
and
(by)
prod
ucts
,hig
hest
accu
m.i
nne
jayo
te
FB1+
HFB
1~1
2,00
0nm
ol/k
g
Nix
tam
al,u
nwas
hed:
~−48|~−8
5f
Nix
tam
al,w
ashe
d:~−
48|~−8
7f
Mas
a:~−
70|~−7
8f
Tort
illas
:~−7
2|~−
82f
Tort
illa
chip
s:n.
a.|~−8
6f
FB2
1,97
0
Nix
tam
al,u
nwas
hed:
~−32|~−9
7N
ixta
mal
,was
hed:
~−21|~−9
2N
ejay
ote:
n.d.|n
.d.
Was
hing
wat
er:n
.d.|n
.d.
Mas
a:~−
78|~−9
4To
rtill
as:~−7
1|~−
91To
rtill
ach
ips:
n.a.|~−9
0
-
140

Toxins 2019, 11, 227
Ta
ble
2.
Con
t.
Stu
dy
No
.in
Fig
ure
2
Nix
tam
ali
za
tio
n
To
rtil
laB
ak
ing
on
Ho
tP
late
Fu
mo
-n
isin
(s)
Init
ial
lev
el
inR
aw
Ma
ize
(μg/k
g)
aC
orr
ect
ed
Ch
an
ge
(%)
bC
om
me
nt(
s)R
efe
ren
ceA
lka
lin
eS
olu
tio
n
Ad
dit
ion
so
nO
rig
.M
aiz
eM
ass
Ba
sis
Co
ok
ing
Ste
ep
ing
Wa
shin
go
fN
ixta
ma
l
19Pr
oces
sing
ina
pilo
tpla
ntac
cord
ing
toco
mm
erci
alpr
oced
ures
incl
udin
gal
kalin
eco
okin
g,st
eepi
ng,a
ndw
ashi
ngof
mai
zeke
rnel
s,as
wel
las
baki
ngan
dde
epfr
ying
ofm
asa
topr
oduc
eto
rtill
ach
ips
(det
ails
not
prov
ided
)
FB1
220–
46,5
00
Nej
ayot
e:sl
ight
accu
m.
Mas
a:−8
8to−9
4d
Bake
dto
rtill
ach
ips:−7
6to−9
0d
Frie
dto
rtill
ach
ips:−3
6to−7
8d
Ca.
34%
and
45%
ofth
ein
itia
lFB1
fw
asde
tect
edas
FB1,
PHFB
1,or
HFB
1in
the
mas
aan
dne
jayo
te,
resp
ecti
vely
.N
oin
dica
tion
sfo
rsi
gnifi
cant
fum
onis
in–s
ugar
addu
ctfo
rmat
ion/
accu
mul
atio
n
[45]
PHFB
1n.
d.−1
340
Nej
ayot
e:n.
d.or
slig
htac
cum
.M
asa:
~−33
dto
slig
htac
cum
.
HFB
1n.
d.−9
50N
ejay
ote:
accu
m.
Mas
a:no
chan
geto
slig
htac
cum
.
FB2
(Not
prov
ided
)M
asa:
ca.−
89to−9
4d
Bake
dto
rtill
ach
ips:
ca.−
89to
−94
d-
--
--
--
Baki
ngin
ato
rtill
aov
enat
260◦ C
,20
sFB
1+
FB2
100–
281
Tort
illa
chip
s:‘a
sis
’:−3
2to−7
8(m
ean:−5
9)
Use
ofm
aize
flour
mix
ture
s.C
omm
erci
alpr
oces
sing
.To
rtill
ach
ips
wer
epr
epar
edby
fryi
ngto
rtill
ast
rips
at17
0–17
5◦ C
for
40s
[49]
20~1
%lim
eso
luti
on~7
7%w
ater
,~0
.8%
lime
7m
in18
hN
oin
form
atio
n25
0◦ C
FB1
1001
Coo
ked
mai
ze:−
56c
Nix
tam
al:−
83c
Mas
a:−8
0c
Tort
illas
:−83
c
Com
mer
cial
proc
essi
ng.
Coo
ked
mai
zew
assa
mpl
edbe
fore
stee
ping
[50]
21~0
.7%
lime
solu
tion
~200
%w
ater
,~1
.5%
lime
150
min
16h
No
info
rmat
ion
250◦ C
FB1
681
Coo
ked
mai
ze:−
73c
Nix
tam
al:−
80c
Mas
a:−8
5c
Tort
illas
:−89
c
22~0
.56%
lime
solu
tion
~160
%w
ater
,~0
.9%
lime
10m
in16
hN
oin
form
atio
n37
5◦ C
FB1
1441
Coo
ked
mai
ze:−
83c
Nix
tam
al:−
88c
Mas
a:−1
00c
Tort
illas
:−10
0c
23~1
.1%
lime
solu
tion
~70%
wat
er,
~0.8
%lim
e12
0m
in18
hN
oin
form
atio
n23
2◦ C
FB1
1653
Coo
ked
mai
ze:−
78c
Nix
tam
al:−
88c
Mas
a:−1
00c
Tort
illas
:−10
0c
141

Toxins 2019, 11, 227
Ta
ble
2.
Con
t.
Stu
dy
No
.in
Fig
ure
2
Nix
tam
ali
za
tio
n
To
rtil
laB
ak
ing
on
Ho
tP
late
Fu
mo
-n
isin
(s)
Init
ial
lev
el
inR
aw
Ma
ize
(μg/k
g)
aC
orr
ect
ed
Ch
an
ge
(%)
bC
om
me
nt(
s)R
efe
ren
ceA
lka
lin
eS
olu
tio
n
Ad
dit
ion
so
nO
rig
.M
aiz
eM
ass
Ba
sis
Co
ok
ing
Ste
ep
ing
Wa
shin
go
fN
ixta
ma
l
24~0
.25%
lime
solu
tion
200%
wat
er;
~0.5
%lim
e60
min
18h
Rin
sein
430%
wat
er(b
ased
onor
ig.m
aize
mas
s)
Baki
ngov
eran
iron
grill
at19
0–20
0◦ C
for
ca.
4m
in
FB1
150–
11,8
00(i
nocu
late
d)M
asa:−4
6to−9
9c
Tort
illas
:−26
to−9
8c
Hig
her
redu
ctio
nat
high
erin
itia
lFB1
leve
l
-~0
.25–
1.6%
lime
solu
tion
200%
wat
er;
~0.5
–3.2
%lim
e15
or60
min
18h
As
desc
ribe
dab
ove
As
desc
ribe
dab
ove
FB1
150–
11,8
00(i
nocu
late
d)M
asa/
Tort
illas
:up
to−1
00c
Hig
her
redu
ctio
nat
high
erlim
eco
ncen
trat
ion
(and
athi
gher
init
ialF
B1le
vel)
250.
33or
1.67
%lim
eso
luti
on
300%
dist
illed
wat
er,1
%or
5%lim
e
90◦ C
,15
–60
min
17h
2ri
nses
wit
h20
0%ta
pw
ater
(bas
edon
orig
.m
aize
mas
s)
-
FB1+
FB2
6,48
0–8,
930
Mas
a:−2
6to−4
8c
Oft
hein
itia
lFB1+
FB2f ,a
tota
lof6
4%–8
6%re
tain
edas
pare
ntfo
rm,P
HFB
,or
HFB
inth
em
asa
[51]
PHFB
1+
PHFB
211
0–26
0M
asa:
noch
ange
toac
cum
.In
crea
seat
high
erlim
eco
ncen
trat
ion
HFB
1+
HFB
2n.
d.M
asa:
accu
m.
Hig
her
accu
m.a
thig
her
lime
conc
entr
atio
n
-D
isti
lled
wat
er,o
nly
300%
dist
illed
wat
er
As
desc
ribe
dab
ove
As
desc
ribe
dab
ove
As
desc
ribe
dab
ove
-
FB1+
FB2
5230
–20,
380
Mai
zedo
ugh:−4
5to−7
8c
Her
e,a
tota
lof2
1%–5
5%of
the
init
ialF
B1+
FB2f
reta
ined
aspa
rent
form
,PH
FB,o
rH
FBin
the
mai
zedo
ugh
PHFB
1+
PHFB
214
0–51
0M
aize
doug
h:−2
9to−7
5c
HFB
1+
HFB
2n.
d.M
aize
doug
h:n.
d.
260.
5%C
a(O
H) 2
solu
tion
100%
wat
er,0
.5%
Ca(
OH
) 2
Mic
row
ave
(165
0W
,24
50H
z),
3.75
min
25◦ C
,3.5
h;no
rem
oval
ofw
ater
indi
cate
d
-27
0◦ C
,in
tota
l54
–55
son
each
side
FB1+
FB2+
FB3
2137
(ino
cula
ted)
Mas
a:−6
(n.s
.)c
Tort
illas
:−54
cU
seof
mai
zegr
its
[48]
271.
2%lim
eso
luti
onN
otsp
ecifi
ed95
–100◦ C
,55
min
14h
Was
hw
ith
ca.
300%
tap
wat
er-
FB1
239,
000
(ino
cula
ted)
Nix
tam
al:−
83c
Nej
ayot
e:sl
ight
accu
m.
Peri
carp
rem
oval
duri
ngw
ashi
ngw
asav
oide
d[5
7]H
FB1
n.d.
Nix
tam
al:a
ccum
.N
ejay
ote:
accu
m.
FB1+
HFB
1e23
9,00
0N
ixta
mal
:−39
c
Nej
ayot
e:ac
cum
.
28~1
.3%
lime
solu
tion
325%
wat
er,
~4.1
%lim
eca
.105
min
15h
3ri
nses
wit
h27
5%w
ater
(bas
edon
orig
.m
aize
mas
s)
170–
212◦ C
,ca.
3.5
min
FB1+
HFB
1e
ca.3
8,10
0To
rtill
as:−
46f
-[4
7]
142

Toxins 2019, 11, 227
Ta
ble
2.
Con
t.
Stu
dy
No
.in
Fig
ure
2
Nix
tam
ali
za
tio
n
To
rtil
laB
ak
ing
on
Ho
tP
late
Fu
mo
-n
isin
(s)
Init
ial
lev
el
inR
aw
Ma
ize
(μg/k
g)
aC
orr
ect
ed
Ch
an
ge
(%)
bC
om
me
nt(
s)R
efe
ren
ceA
lka
lin
eS
olu
tio
n
Ad
dit
ion
so
nO
rig
.M
aiz
eM
ass
Ba
sis
Co
ok
ing
Ste
ep
ing
Wa
shin
go
fN
ixta
ma
l
291.
2%C
a(O
H) 2
solu
tion
750%
wat
er,9
%lim
e90
–100◦ C
,60
min
O/N
3ri
nses
wit
h75
0%w
ater
(bas
edon
orig
.m
aize
mas
s)
-
FB1
~23,
314
Nix
tam
al:~−9
0c
Oft
hein
itia
lFB1
f ,ato
talo
f~4
7%re
tain
edas
FB1,
HFB
1,or
boun
d(H
)FB1
inth
eni
xtam
al
[56]
HFB
1~3
29N
ixta
mal
:ca.+
1400
c
Prot
ein-
boun
d(H
)FB1
~69
(rec
over
edas
HFB
1)N
ixta
mal
:~+
476
c
Tota
lbo
und
(H)F
B1~8
9(r
ecov
ered
asH
FB1)
Nix
tam
al:~+
673
c
-W
ater
,onl
y75
0%w
ater
As
desc
ribe
dab
ove
As
desc
ribe
dab
ove
As
desc
ribe
dab
ove
-
FB1
~23,
314
‘Moc
k-ni
xtam
al’:
~−53
(n.s
.)c
Her
e,a
tota
lof~
44%
ofth
ein
itia
lFB1
fre
tain
edas
FB1,
HFB
1,or
boun
d(H
)FB1
inth
e‘m
ock-
nixt
amal
’
HFB
1~3
29‘M
ock-
nixt
amal
’:~−
60(n
.s.)
c
Prot
ein-
boun
d(H
)FB1
~69
(rec
over
edas
HFB
1)‘M
ock-
nixt
amal
’:no
chan
gec
Tota
lbo
und
(H)F
B1~8
9(r
ecov
ered
asH
FB1)
‘Moc
k-ni
xtam
al’:
~+9
(n.s
.)c
301.
2%C
a(O
H) 2
solu
tion
1,20
0%w
ater
,14
.4%
lime
90–1
00◦ C
,60
min
O/N
3w
ashe
sw
ith
1200
%di
still
edw
ater
(bas
edon
orig
.mai
zem
ass)
-
FB1
9080
(ino
cula
ted)
Nix
tam
al:−
77
Raw
mat
eria
l:gr
ound
mai
zeus
edas
fung
algr
owth
med
ium
.Nix
tam
alw
aspr
epar
edfo
ra
feed
ing
tria
l.C
once
ntra
tions
and
chan
ges
are
give
nfo
rth
em
ixed
diet
[62]
HFB
125
0N
ixta
mal
:~+
408
FB1+
HFB
113
,200
nmol/k
gN
ixta
mal
:~−5
4f
-W
ater
,onl
y1,
200%
wat
erA
sde
scri
bed
abov
e
As
desc
ribe
dab
ove
As
desc
ribe
dab
ove
-FB
190
80(i
nocu
late
d)‘M
ock-
nixt
amal
’:−8
7
HFB
125
0‘M
ock-
nixt
amal
’:~+
120
FB1+
HFB
113
,200
nmol/k
g‘M
ock-
nixt
amal
’:~−
77f
311.
2%C
a(O
H) 2
solu
tion
300%
wat
er,3
.6%
lime
80–1
00◦ C
,60
min
O/N
One
was
hw
ith
ca.3
00%
wat
er(b
ased
onor
ig.
mai
zem
ass)
-
FB1
45,2
00–4
8,00
0(i
nocu
late
d)N
ixta
mal
:~−9
8to−1
00N
ixta
mal
was
prep
ared
for
afe
edin
gtr
ial.
Con
cent
ratio
nsan
dch
ange
sar
egi
ven
for
the
mix
eddi
et
[64]
HFB
1n.
d.N
ixta
mal
:acc
um.
FB1+
HFB
1~6
2,60
0–66
,500
nmol/k
gN
ixta
mal
:~−5
8to−7
0f
a :Ifn
otm
entio
ned
othe
rwis
e,m
aize
was
natu
rally
cont
amin
ated
.b:U
nles
sin
dica
ted
othe
rwis
e,th
ech
ange
inth
em
ycot
oxin
conc
entr
atio
nis
corr
ecte
dfo
rch
ange
inm
oist
ure
cont
ent.
Cha
nges
ona
prod
uct‘
asis
’(w
etw
eigh
t)ba
sis
are
indi
cate
d.N
egat
ive
valu
es:r
educ
tion
;pos
itiv
eva
lues
:inc
reas
e.c :H
ere,
chan
gein
the
myc
otox
inco
ncen
trat
ion
issu
ppos
edto
beco
rrec
ted
for
chan
gein
moi
stur
e.d
:Her
e,it
isno
tcle
arif
the
chan
gein
the
myc
otox
inco
ncen
trat
ion
isco
rrec
ted
for
chan
gein
moi
stur
e.e :A
seq
uiva
lent
topa
rent
form
.f :On
mol
arba
sis.
~:A
ppro
xim
ate
valu
esth
atw
ere
calc
ulat
edfo
rth
isov
ervi
ewby
usin
gth
ed
ata
prov
ided
inth
eci
ted
liter
atur
e.|:
Her
e,in
div
idua
ldat
aof
two
prod
ucti
onru
nsar
egi
ven
and
sepa
rate
dby
this
sym
bol.
FB1/
2:fu
mon
isin
B1/2
;HFB
1/2:
hydr
olyz
edfu
mon
isin
B1/2
;PH
FB1/
2:pa
rtia
llyhy
drol
yzed
FB1/
2.ac
cum
.:ac
cum
ulat
ion;
n.a.
:not
anal
yzed
;n.d
.:no
tdet
ecte
d;n.
s.:n
otsi
gnifi
cant
;O/N
:ove
rnig
ht;o
rig.
:ori
gina
l.
143

Toxins 2019, 11, 227
5. Other Mycotoxins during Nixtamalization and Tortilla Production
Little data were found on mycotoxins other than aflatoxins and fumonisins during nixtamalizationand tortilla production (Table 3). Abbas et al. [65] experimentally produced tortillas (includingtraditional nixtamalization with 2% Ca(OH)2) using two batches of maize naturally contaminated withthe Fusarium toxins ZEN and DON, as well as maize spiked with the purified toxins (by injection intothe embryos). Here, no difference in the percentage reduction of mycotoxin was obvious depending onthe type of contamination. For ZEN, the initial levels that were present as trans-ZEN were lowered by59%–100%. For the two maize samples with the highest concentrations (one spiked and one naturallycontaminated one), some ZEN (<0.4% of the total amount) could be detected in the nejayote. Further,some isomerization from trans-ZEN to cis-ZEN took place for these maize samples. However, most ofthe ZEN was degraded into undetectable form(s), and it was supposed that the alkaline treatmentattacked the lactone ring of ZEN. Whether this transformation would be stable under acidic conditionswas not addressed [65]. For DON, reductions amounted to 72%–82%. The naturally contaminatedmaize batches contained, in addition, the acetylated form 15-acetyl-DON, which was completelydestroyed in tortillas. Neither DON nor 15-acetyl-DON could be detected in the nejayote.
The potential to lower ZEN and DON by alkaline steeping of maize was also shown when using0.1 M sodium carbonate. Here, steeping of raw maize kernels at 22 ◦C for 24 h lowered ZEN and DONby around 45% and 70%, respectively. An extended steeping over 72 h reduced the concentrations by88% and 95%, respectively [66]. The baking and frying steps in commercial tortilla chip productionwere analyzed by Scudamore et al. [49] regarding mycotoxin changes on a product ‘as is’ basis. In the(probably alkaline) maize flour mixture(s) used to prepare the dough for tortillas, ZEN was present atlow levels only, and the change during processing was very variable. However, if the initial ZEN levelwas higher than 13 μg/kg, the reduction amounted to 35%–64%. If the initial level was below 9 μg/kg,the detected change ranged from a 7% reduction to a 116% increase. This was probably caused bydifficulties in representative sampling of industrial processes. DON levels in the tortilla chips wereon average lowered by 32%, with the highest reductions at the highest initial levels. The sensitivityof DON towards food production processes that involve alkaline additives was also observed in theproduction of bakery wares and during the cooking of noodles (for an overview, see [67]).
The reduction of the emerging mycotoxin MON during tortilla production was studied byPineda-Valdes et al. [68]. In pilot-scale experiments, MON was reduced by 97% after cooking of maizekernels in a 0.25% lime solution. After steeping or further processing, MON could not be detectedanymore. When determining laboratory-scale processing using fungal-inoculated maize with anaround 10-fold higher initial concentration, MON was lowered by 54% during cooking. After steepingand washing, MON reduction accounted for 64% and 69%, respectively. In masa and tortillas, the losswas around 70%. MON was not detected in any of the liquid fractions [68], although it is characterizedby low molecular size and high water solubility [8]. Thus, MON might have been either modifiedinto undetected form(s) during the 20 min alkaline cooking step or was degraded due to the action ofhigh temperature and/or high pH. In a former study, Pineda-Valdes and Bullerman [69] demonstratedan affection of MON at elevated pH and temperature. Heating to 100 ◦C in an aqueous environmentwith pH 10 for 60 min lowered MON by around one half. However, after 20 min of cooking, the MONloss amounted to less than 20%. Therefore, nixtamalization of MON-contaminated maize showed arelatively high efficiency in reducing the concentration of this emerging mycotoxin, probably by a pHof >10 of the lime water.
144

Toxins 2019, 11, 227
Ta
ble
3.
Effec
tofa
lkal
ine
cook
ing
(nix
tam
aliz
atio
n)of
mai
zeke
rnel
san
dof
entir
eto
rtill
apr
oduc
tion
onco
nten
tsof
myc
otox
ins
othe
rtha
nafl
atox
ins
and
fum
onis
ins.
Stu
dy
No
.in
Fig
ure
2
Nix
tam
ali
za
tio
n
To
rtil
laB
ak
ing
on
Ho
tP
late
My
co-
tox
in(s
)
Init
ial
Le
ve
lin
Ra
wM
aiz
e(μ
g/k
g)
aC
orr
ect
ed
Ch
an
ge
(%)
bC
om
me
nt(
s)R
efe
ren
ceA
lka
lin
eS
olu
tio
n
Ad
dit
ion
so
nO
rig
.M
aiz
eM
ass
Ba
sis
Co
ok
ing
Ste
ep
ing
Wa
shin
go
fN
ixta
ma
l
322%
Ca(
OH
) 2so
luti
onN
otsp
ecifi
ed5
min
(inc
l.st
irri
ng)
12h
Thor
ough
rins
ew
ith
dist
illed
wat
er
110–
120◦ C
,7–8
min
onea
chsi
de
ZEN
230|
4,23
0N
ejay
ote:
n.d.|w
eak
accu
m.
Tort
illas
:−10
0|−5
9
-
[65]
DO
N3,
280|
12,2
60N
ejay
ote:
n.d.|n
.d.
Tort
illas
:−82|−7
2
15-a
cety
l-DO
N1,
490|
9,83
0N
ejay
ote:
n.d.|n
.d.
Tort
illas
:−10
0|−1
00
ZEN
750|
3,62
0(s
pike
d)N
ejay
ote:
n.d.|w
eak
accu
m.
Tort
illas
:−71|−7
4M
ycot
oxin
sw
ere
inje
cted
into
the
mai
zeem
bryo
sD
ON
850|
4460|8
250
(spi
ked)
Nej
ayot
e:n.
d.|n
.d.|n
.d.
Tort
illas
:−82|−7
2|–7
4
--
--
--
Baki
ngin
ato
rtill
aov
enat
260◦ C
,20
s
ZEN
4.5–
8.7|
19–2
4To
rtill
ach
ips:
‘as
is’:+
116
to−7
(mea
n:+
32)|−
35to−6
4(m
ean:
−49)
Use
ofm
aize
flour
mix
ture
s.C
omm
erci
alpr
oces
sing
.To
rtill
ach
ips
wer
epr
epar
edby
fryi
ngto
rtill
a
[49]
DO
N47
–466
Tort
illa
chip
s:‘a
sis
’:+
28to−7
6(m
ean:−3
2)
330.
25%
lime
solu
tion
400%
wat
er,1
%lim
e88◦ C
,20
min
16h
Two
rins
esw
ith
250%
wat
er(b
ased
onor
ig.
mai
zem
ass)
Baki
ngin
aga
s-fir
edov
enat
ca.3
65◦ C
for
ca.
3m
in
MO
N14
20
Coo
ked
mai
ze:−
97c
Nix
tam
al:−
100
c
Nej
ayot
e:n.
d.W
ash
wat
er:n
.d.
Mas
a:−1
00c
Tort
illas
:−10
0c
Pilo
t-sc
ale
proc
ess
[68]
340.
25%
lime
solu
tion
400%
wat
er,1
%lim
e88◦ C
,20
min
16h
Two
rins
esw
ith
125%
wat
er(b
ased
onor
ig.
mai
zem
ass)
ca.2
50◦ C
,3m
inon
each
side
MO
N17
,640
(ino
cula
ted)
Coo
ked
mai
ze:−
54c
Nix
tam
al(b
efor
ew
ashi
ng):−6
4c
Nix
tam
al(w
ashe
d):~−6
9c
Nej
ayot
e:n.
d.W
ash
wat
er:n
.d.
Mas
a:~−
71c
Tort
illas
:~−7
0c
Labo
rato
ry-s
cale
a :Ifn
otm
entio
ned
othe
rwis
e,m
aize
was
natu
rally
cont
amin
ated
.b:U
nles
sin
dica
ted
othe
rwis
e,th
ech
ange
inth
em
ycot
oxin
conc
entr
atio
nis
corr
ecte
dfo
rch
ange
inm
oist
ure
cont
ent.
Cha
nges
ona
prod
uct‘
asis
’(w
etw
eigh
t)ba
sis
are
indi
cate
d.N
egat
ive
valu
es:r
educ
tion;
posi
tive
valu
es:i
ncre
ase.
c :Her
e,it
isno
tcle
arif
the
chan
gein
the
myc
otox
inco
ncen
trat
ion
isco
rrec
ted
for
chan
gein
moi
stur
e.|:
Her
e,da
taof
diff
eren
tbat
ches
are
sepa
rate
dby
this
sym
bol.
~:A
ppro
xim
ate
valu
esth
atw
ere
calc
ulat
edfo
rth
isov
ervi
ewby
usin
gth
eda
tapr
ovid
edin
the
cite
dlit
erat
ure.
DO
N:d
eoxy
niva
leno
l,M
ON
:mon
ilifo
rmin
;ZEN
:zea
rale
none
.acc
um.:
accu
mul
atio
n;n.
d.:n
otde
tect
ed;o
rig.
:ori
gina
l.
145

Toxins 2019, 11, 227
6. Conclusions and Outlook
Nixtamalization and tortilla baking can affect mycotoxins in different ways, including physicaland chemical action: (1) Water-soluble mycotoxins can leach into the liquid fractions during cooking,steeping, and washing. (2) Mycotoxins present in the pericarp, tip cap, and germ are removed whenthese tissues are (partly) separated by thorough washing of the nixtamal. (3) Action of high pH andelevated temperature during cooking and baking can result in degradation, modification, and/orbinding or release of mycotoxins.
For traditional nixtamalization, a high potential to lower free parent forms of mycotoxins isdescribed (see also Figure 2). Aflatoxin concentrations of raw maize were found to be lowered byaround 15%–85% and 20%–100% in the nixtamal and masa, respectively. Tortillas mostly showedaflatoxin reductions of 50%–100%. For FB1, the reduction mainly amounted to around 75%–100% innixtamal, masa, and tortillas. For ZEN, DON, and MON, reductions of around 60%–100%, 70%–80%,and 70%–100% are described. However, only very limited data is available regarding maize mycotoxinsother than aflatoxins and fumonisins. More data on such toxins would help to evaluate the benefits ofalkali-processed maize in more detail.
Besides reduction in the free parent forms, modification of mycotoxins can occur, and interactionwith matrix compounds can be altered. To analyze such processes during nixtamalization, intenseefforts have already been undertaken to establish and optimize appropriate detection methods.Although it must be noted that, when analyzing food matrices, which can harbor several challenges,analytical recovery must in general be taken into account, and data should be corrected accordingly(which was often not done or at least not mentioned for the data presented in the current review).Careful conclusions on the reduction factors of mycotoxins must certainly also take a reasonablecontribution of variability and uncertainty into account. Furthermore, the stability of the present formsand their bioavailability need to be considered when analyzing toxicological impacts. In addition,precise knowledge on the critical parameters in nixtamalization and tortilla production is importantto optimize production procedures to furthermore reduce potential health risks to the consumers,e.g., by reconversion of aflatoxins after consumption.
In general, further research is needed to evaluate possible modifications and matrix–mycotoxininteractions during nixtamalization, as well as the occurrence and potential toxicity of the formedstructures in the final food items. In doing so, a possible reconversion and/or release of parent forms inthe gastrointestinal tract, as well as by activity of the gut microflora, need to be considered. Reliableanalytical data would be the basis for precise understanding of the processes and the factors inmycotoxin reduction. Moreover, knowledge on the fate of mycotoxins and their toxicity is required toevaluate possible utilization strategies for the nejayote.
146

Toxins 2019, 11, 227
Figure 2. Graphical overview of mycotoxin changes during nixtamalization and tortilla production.(a) Free parent mycotoxins. (b) Sum of free parent form(s) and detected modified/matrix-associatedform(s). Columns indicate (approximate) ranges; lines represent (approximate) mean values of changesin mycotoxin concentrations from raw maize material to tortillas or intermediate products. The numberson the x-axis refer to studies described in the literature, which are listed in Tables 1–3. More than onenumber can refer to the same reference if different process conditions or technologies were compared.For details on the studies (including references, processing parameters, and mycotoxin content inraw maize material), see Tables 1–3. *: Only mixing of kernels with hot lime water, without furthercooking. **: Microwave cooking. ***: Extrusion cooking. Total AFs: aflatoxins B1 + B2 + G1 + G2;Total AFs (acid): aflatoxins B1 + B2 + G1 + G2 detected in acidified samples/extracts; AFB1/2: aflatoxinB1/2; AFB1 + 2 (acid): aflatoxin B1 + B2 detected in acidified samples/extracts; AFB1-diol: aflatoxinB1 dihydrodiol; AFG1/2: aflatoxin G1/2; AFM1: aflatoxin M1; FB1/2/3: fumonisin B1/2/3; (P)HFBs:partly + fully hydrolyzed fumonisins B1 + B2; (P)HFB1: partly + fully hydrolyzed fumonisin B1; ZEN:zearalenone; DON: deoxynivalenol; 15-ac-DON: 15-acetyl-deoxynivalenol; MON: moniliformin.
Funding: This work was performed as part of the MyToolBox project (www.mytoolbox.eu), which has receivedfunding from the European Union’s Horizon 2020 research and innovation program under grant agreement no.678012. The article reflects only the authors’ view, and the European Commission is not responsible for any usethat may be made of the information it contains.
Acknowledgments: We appreciate the work of all colleagues on this topic and apologize to those whose studieswere not cited here.
Conflicts of Interest: The authors declare no conflicts of interest.
References
1. Pitt, J.; Wild, C.; Baan, R.; Gelderblom, W.; Miller, J.; Riley, R.; Wu, F. Improving Public Health through MycotoxinControl. Chapter 1: Fungi Producing Significant Mycotoxins; International Agency for Research on Cancer,WHO Press: Geneva, Switzerland, 2012; pp. 1–30.
147

Toxins 2019, 11, 227
2. Taniwaki, M.H.; Pitt, J.I.; Magan, N. Aspergillus species and mycotoxins: Occurrence and importance in majorfood commodities. Curr. Opin. Food Sci. 2018, 23, 38–43. [CrossRef]
3. EFSA CONTAM. Opinion of the scientific panel on contaminants in the food chain [CONTAM] related tothe potential increase of consumer health risk by a possible increase of the existing maximum levels foraflatoxins in almonds, hazelnuts and pistachios and derived products. EFSA J. 2007, 446, 1–127.
4. EFSA Panel on Contaminants in the Food Chain; Knutsen, H.-K.; Barregård, L.; Bignami, M.; Brüschweiler, B.;Ceccatelli, S.; Cottrill, B.; Dinovi, M.; Edler, L.; Grasl-Kraupp, B.; et al. Appropriateness to set a grouphealth-based guidance value for fumonisins and their modified forms. EFSA J. 2018, 16, e05172.
5. Metzler, M. Proposal for a uniform designation of zearalenone and its metabolites. Mycotoxin Res. 2011, 27,1–3. [CrossRef] [PubMed]
6. EFSA CONTAM. Scientific Opinion on the risks for public health related to the presence of zearalenone infood. EFSA J. 2011, 9, 2197. [CrossRef]
7. EFSA. Deoxynivalenol in food and feed: Occurrence and exposure. EFSA J. 2013, 11, 3379.8. Jestoi, M. Emerging Fusarium-mycotoxins fusaproliferin, beauvericin, enniatins, and moniliformin—A review.
Crit. Rev. Food Sci. Nutr. 2008, 48, 21–49. [CrossRef] [PubMed]9. Kovac, M.; Šubaric, D.; Bulaic, M.; Kovac, T.; Šarkanj, B. Yesterday masked, today modified; what do mycotoxins
bring next? Arh. Hig. Rada Toksikol. 2018, 69, 196–214. [CrossRef] [PubMed]10. Dall’Asta, C.; Berthiller, F. Masked Mycotoxins in Food: Formation, Occurrence and Toxicological Relevance; Royal
Society of Chemistry: Cambridge, UK, 2016.11. Rychlik, M.; Humpf, H.-U.; Marko, D.; Dänicke, S.; Mally, A.; Berthiller, F.; Klaffke, H.; Lorenz, N. Proposal
of a comprehensive definition of modified and other forms of mycotoxins including “masked” mycotoxins.Mycotoxin Res. 2014, 30, 197–205. [CrossRef] [PubMed]
12. Rooney, L.W.; Serna-Saldivar, S.O. Tortillas. In Reference Module in Food Science; Elsevier: Amsterdam,The Netherlands, 2016. [CrossRef]
13. Serna-Saldivar, S.O. Chapter 1—History of corn and wheat tortillas. In Tortillas; Rooney, L.W., Serna-Saldivar, S.O.,Eds.; AACC International Press: St. Paul, MN, USA, 2015; pp. 1–28.
14. Santiago-Ramos, D.; Figueroa-Cárdenas, J.d.D.; Mariscal-Moreno, R.M.; Escalante-Aburto, A.; Ponce-García, N.;Véles-Medina, J.J. Physical and chemical changes undergone by pericarp and endosperm during cornnixtamalization—A review. J. Cereal Sci. 2018, 81, 108–117. [CrossRef]
15. Serna-Saldivar, S.O. Chapter 2—Nutrition and fortification of corn and wheat tortillas. In Tortillas;Rooney, L.W., Serna-Saldivar, S.O., Eds.; AACC International Press: St. Paul, MN, USA, 2015; pp. 29–63.
16. Bressani, R.; Scrimshaw, N.S. Lime-heat effects on corn nutrients, effect of lime treatment on in vitroavailability of essential amino acids and solubility of protein fractions in corn. J. Agric. Food Chem. 1958, 6,774–778. [CrossRef]
17. Rendon-Villalobos, R.; Bello-Pérez, L.A.; Osorio-Díaz, P.; Tovar, J.; Paredes-López, O. Effect of storage timeon in vitro digestibility and resistant starch content of nixtamal, masa, and tortilla. Cereal Chem. 2002, 79,340–344. [CrossRef]
18. Mariscal-Moreno, R.M.; de Dios Figueroa Cárdenas, J.; Santiago-Ramos, D.; Rayas-Duarte, P.; Veles-Medina, J.J.;Martínez-Flores, H.E. Nixtamalization process affects resistant starch formation and glycemic index oftamales. J. Food Sci. 2017, 82, 1110–1115. [CrossRef]
19. Pilcher, J. Taste, Smell, and Flavor in Mexico. In Oxford Research Encyclopedia of Latin American History; OxfordUniversity Press: New York, NY, USA, 2016. Available online: http://oxfordre.com/latinamericanhistory/(accessed on 5 April 2019).
20. de Arriola, M.d.C.; de Porres, E.; de Cabrera, S.; de Zepeda, M.; Rolz, C. Aflatoxin fate during alkalinecooking of corn for tortilla preparation. J. Agric. Food Chem. 1988, 36, 530–533. [CrossRef]
21. Ulloa-Sosa, M.; Schroeder, H.W. Note on aflatoxin decomposition in the process of making tortillas fromcorn. Cereal Chem. 1969, 46, 397–400.
22. Abbas, H.K.; Mirocha, C.J.; Rosiles, R.; Carvajal, M. Effect of tortilla-preparation process on aflatoxins B1 andB2 in corn. Mycotoxin Res. 1988, 4, 33–36. [CrossRef] [PubMed]
23. Price, R.L.; Jorgensen, K.V. Effects of processing on aflatoxin levels and on mutagenic potential of tortillasmade from naturally contaminated corn. J. Food Sci. 1985, 50, 347–349. [CrossRef]
148

Toxins 2019, 11, 227
24. Moreno-Pedraza, A.; Valdés-Santiago, L.; Hernández-Valadez, L.J.; Rodríguez-Sixtos Higuera, A.; Winkler, R.;Guzmán-de Peña, D.L. Reduction of aflatoxin B1 during tortilla production and identification of degradationby-products by direct-injection electrospray mass spectrometry. Salud Pública de México 2015, 57, 50–56.[CrossRef]
25. Guzman-de-Pena, D.; Trudel, L.; Wogan, G.N. Corn “nixtamalización” and the fate of radiolabelled aflatoxinB1 in the tortilla making process. Bull. Environ. Contam. Toxicol. 1995, 55, 858–864. [CrossRef]
26. Pérez-Flores, G.C.; Moreno-Martínez, E.; Méndez-Albores, A. Effect of microwave heating duringalkaline-cooking of aflatoxin contaminated maize. J. Food Sci. 2011, 76, T48–T52. [CrossRef]
27. Rosentrater, K.A. A review of corn masa processing residues: Generation, properties, and potential utilization.Waste Manag. 2006, 26, 284–292. [CrossRef]
28. Bazúa, C.D.; Guerra, R.; Sterner, H. Extruded corn flour as an alternative to lime-heated corn flour for tortillapreparation. J. Food Sci. 1979, 44, 940–941. [CrossRef]
29. Gómez-Aldapa, C.; Martínez-Bustos, F.; Figueroa, C.J.D.; Ordorica, F.C.A. A comparison of the quality ofwhole corn tortillas made from instant corn flours by traditional or extrusion processing. Int. J. Food Sci.Technol. 1999, 34, 391–399. [CrossRef]
30. Elias-Orozco, R.; Castellanos-Nava, A.; Gaytán-Martínez, M.; Figueroa-Cárdenas, J.D.; Loarca-Piña, G.Comparison of nixtamalization and extrusion processes for a reduction in aflatoxin content. Food Addit.Contam. 2002, 19, 878–885. [CrossRef]
31. Lutz, W.K.; Jaggi, W.; Lüthy, J.; Sagelsdorff, P.; Schlatter, C. In vivo covalent binding of aflatoxin B1 andaflatoxin M1 to liver DNA of rat, mouse and pig. Chem.-Biol. Interact. 1980, 32, 249–256. [CrossRef]
32. Pallavi, R.M.V.; Vidyasagar, T.; Rao, B. Production of aflatoxin M1 by Aspergillus parasiticus (AP 456) in asemisynthetic medium. Indian J. Exp. Biol. 1997, 35, 735–741.
33. Pai, M.R.; Bai, N.J.; Venkitasubramanian, T.A. Production of aflatoxin M in a liquid medium. Appl. Microbiol.1975, 29, 850–851. [PubMed]
34. Vesonder, R.; Haliburton, J.; Stubblefield, R.; Gilmore, W.; Peterson, S. Aspergillus flavus and aflatoxins B1, B2,and M1 in corn associated with equine death. Arch. Environ. Contam. Toxicol. 1991, 20, 151–153. [CrossRef][PubMed]
35. Méndez-Albores, J.A.; Arámbula-Villa, G.; Loarca-Piña, M.G.; González-Hernández, J.; Castaño-Tostado, E.;Moreno-Martínez, E. Aflatoxins’ fate during the nixtamalization of contaminated maize by two tortilla-makingprocesses. J. Stored Prod. Res. 2004, 40, 87–94. [CrossRef]
36. Torres, P.; Guzmán-Ortiz, M.; Ramírez-Wong, B. Revising the role of pH and thermal treatments in aflatoxincontent reduction during the tortilla and deep frying processes. J. Agric. Food Chem. 2001, 49, 2825–2829.[CrossRef]
37. Lee, L.S.; Dunn, J.J.; DeLucca, A.J.; Ciegler, A. Role of lactone ring of aflatoxin B1 in toxicity and mutagenicity.Experientia 1981, 37, 16–17. [CrossRef]
38. Vázquez-Durán, A.; Díaz-Torres, R.; Ramírez-Noguera, P.; Moreno-Martínez, E.; Méndez-Albores, A.Cytotoxic and genotoxic evaluation of tortillas produced by microwave heating during alkaline-cooking ofaflatoxin-contaminated maize. J. Food Sci. 2014, 79, T1024–T1029. [CrossRef]
39. Méndez-Albores, J.; Villa, G.; Del Rio-García, J.; Martínez, E. Aflatoxin-detoxification achieved with Mexicantraditional nixtamalization process (MTNP) is reversible. J. Sci. Food Agric. 2004, 84, 1611–1614. [CrossRef]
40. Beckwith, A.C.; Vesonder, R.F.; Ciegler, A. Action of weak bases upon aflatoxin B1 in contact withmacromolecular reactants. J. Agric. Food Chem. 1975, 23, 582–587. [CrossRef]
41. Lee, L.S.; Conkerton, E.J.; Ory, R.L.; Bennett, J.W. [14C]Aflatoxin B1 as an indicator of toxin destruction duringammoniation of contaminated peanut meal. J. Agric. Food Chem. 1979, 27, 598–602. [CrossRef]
42. Brekke, O.L.; Peplinski, A.J.; Lancaster, E.B. Aflatoxin inactivation in corn by aqua ammonia. Trans. ASAE1977, 20, 1160–1168. [CrossRef]
43. Weng, C.Y.; Martinez, A.J.; Park, D.L. Efficacy and permanency of ammonia treatment in reducing aflatoxinlevels in corn. Food Addit. Contam. 1994, 11, 649–658. [CrossRef]
44. Sydenham, E.W.; Stockenstrom, S.; Thiel, P.G.; Shephard, G.S.; Koch, K.R.; Marasas, W.F.O. Potential ofalkaline hydrolysis for the removal of fumonisins from contaminated corn. J. Agric. Food Chem. 1995, 43,1198–1201. [CrossRef]
45. Voss, K.A.; Poling, S.M.; Meredith, F.I.; Bacon, C.W.; Saunders, D.S. Fate of fumonisins during the productionof fried tortilla chips. J. Agric. Food Chem. 2001, 49, 3120–3126. [CrossRef]
149

Toxins 2019, 11, 227
46. Dombrink-Kurtzman, M.A.; Dvorak, T.J.; Barron, M.E.; Rooney, L.W. Effect of nixtamalization (alkalinecooking) on fumonisin-contaminated corn for production of masa and tortillas. J. Agric. Food Chem. 2000, 48,5781–5786. [CrossRef]
47. Palencia, E.; Torres, O.; Hagler, W.; Meredith, F.I.; Williams, L.D.; Riley, R.T. Total fumonisins are reduced intortillas using the traditional nixtamalization method of mayan communities. J. Nutr. 2003, 133, 3200–3203.[CrossRef] [PubMed]
48. Méndez-Albores, A.; Cardenas-Rodriguez, D.A.; Vazquez-Duran, A. Efficacy of microwave-heating duringalkaline processing of fumonisin-contaminated maize. Iran J. Public Health 2014, 43, 147–155.
49. Scudamore, K.; Scriven, F.; Patel, S. Fusarium mycotoxins in the food chain: Maize-based snack foods. WorldMycotoxin J. 2009, 2, 441–450. [CrossRef]
50. De La Campa, R.; Miller, J.D.; Hendricks, K. Fumonisin in tortillas produced in small-scale facilities andeffect of traditional masa production methods on this mycotoxin. J. Agric. Food Chem. 2004, 52, 4432–4437.[CrossRef]
51. De Girolamo, A.; Lattanzio, V.M.T.; Schena, R.; Visconti, A.; Pascale, M. Effect of alkaline cooking of maize onthe content of fumonisins B1 and B2 and their hydrolysed forms. Food Chem. 2016, 192, 1083–1089. [CrossRef]
52. Gelderblom, W.C.A.; Cawood, M.E.; Snyman, S.D.; Vleggaar, R.; Marasas, W.F.O. Structure-activityrelationships of fumonisins in short-term carcinogenesis and cytotoxicity assays. Food Chem. Toxicol.1993, 31, 407–414. [CrossRef]
53. Grenier, B.; Bracarense, A.-P.F.L.; Schwartz, H.E.; Trumel, C.; Cossalter, A.-M.; Schatzmayr, G.; Kolf-Clauw, M.;Moll, W.-D.; Oswald, I.P. The low intestinal and hepatic toxicity of hydrolyzed fumonisin B1 correlates withits inability to alter the metabolism of sphingolipids. Biochem. Pharmacol. 2012, 83, 1465–1473. [CrossRef]
54. Voss, K.A.; Riley, R.T.; Snook, M.E.; Waes, J.G.-V. Reproductive and sphingolipid metabolic effects offumonisin B1 and its alkaline hydrolysis product in LM/Bc mice: Hydrolyzed fumonisin B1 did not causeneural tube defects. Toxicol. Sci. 2009, 112, 459–467. [CrossRef] [PubMed]
55. Park, J.W.; Scott, P.M.; Lau, B.P.-Y.; Lewis, D.A. Analysis of heat-processed corn foods for fumonisins andbound fumonisins. Food Addit. Contam. 2004, 21, 1168–1178. [CrossRef]
56. Burns, T.D. Fate of the Mycotoxin Fumonisin B1 During Alkaline Cooking of Cultured and Whole KernelCorn. Ph.D. Thesis, University of Georgia, Georgia, Athens, 2008.
57. Cortez-Rocha, M.O.; Trigo-Stockli, D.M.; Wetzel, D.L.; Reed, C.R. Effect of extrusion processing on fumonisinB1 and hydrolyzed fumonisin B1 in contaminated alkali-cooked corn. Bull. Environ. Contam. Toxicol. 2002,69, 471–478. [CrossRef] [PubMed]
58. Howard, P.C.; Churchwell, M.I.; Couch, L.H.; Marques, M.M.; Doerge, D.R. Formation of N-(carboxymethyl)fumonisin B1, following the reaction of fumonisin B1 with reducing sugars. J. Agric. Food Chem. 1998, 46,3546–3557. [CrossRef]
59. Seefelder, W.; Knecht, A.; Humpf, H.-U. Bound fumonisin B1: Analysis of fumonisin-B1 glyco and aminoacid conjugates by liquid chromatography−electrospray ionization−tandem mass spectrometry. J. Agric.Food Chem. 2003, 51, 5567–5573. [CrossRef] [PubMed]
60. Voss, K.A.; Riley, R.T.; Jackson, L.S.; Jablonski, J.E.; Bianchini, A.; Bullerman, L.B.; Hanna, M.A.; Ryu, D.Extrusion cooking with glucose supplementation of fumonisin-contaminated corn grits protects againstnephrotoxicity and disrupted sphingolipid metabolism in rats. Mol. Nutr. Food Res. 2011, 55, S312–S320.[CrossRef]
61. Park, J.W.; Scott, P.M.; Lau, B.P.Y. Analysis of N-fatty acyl fumonisins in alkali-processed corn foods. Food Sci.Biotechnol. 2013, 22, 147–152. [CrossRef]
62. Burns, T.D.; Snook, M.E.; Riley, R.T.; Voss, K.A. Fumonisin concentrations and in vivo toxicity of nixtamalizedFusarium verticillioides culture material: Evidence for fumonisin–matrix interactions. Food Chem. Toxicol. 2008,46, 2841–2848. [CrossRef]
63. Voss, K.A.; Riley, R.T.; Moore, N.D.; Burns, T.D. Alkaline cooking (nixtamalisation) and the reduction in thein vivo toxicity of fumonisin-contaminated corn in a rat feeding bioassay. Food Addit. Contam. Part A 2013,30, 1415–1421. [CrossRef] [PubMed]
64. Hendrich, S.; Miller, K.A.; Wilson, T.M.; Murphy, P.A. Toxicity of Fusarium proliferatum-fermented nixtamalizedcorn-based diets fed to rats: Effect of nutritional status. J. Agric. Food Chem. 1993, 41, 1649–1654. [CrossRef]
65. Abbas, H.K.; Mirocha, C.J.; Rosiles, R.; Carvajal, M. Decomposition of zearalenone and deoxynivalenol in theprocess of making tortillas from corn. Cereal Chem. 1988, 65, 15–19.
150

Toxins 2019, 11, 227
66. Trenholm, H.L.; Charmley, L.L.; Prelusky, D.B.; Warner, R.M. Washing procedures using water or sodiumcarbonate solutions for the decontamination of three cereals contaminated with deoxynivalenol andzearalenone. J. Agric. Food Chem. 1992, 40, 2147–2151. [CrossRef]
67. Schaarschmidt, S.; Fauhl-Hassek, C. The fate of mycotoxins during the processing of wheat for humanconsumption. Compr. Rev. Food Sci. Food Saf. 2018, 17, 556–593. [CrossRef]
68. Pineda-Valdes, G.; Ryu, D.; Jackson, D.S.; Bullerman, L.B. Reduction of moniliformin during alkaline cookingof corn. Cereal Chem. 2002, 79, 779–782. [CrossRef]
69. Pineda-Valdes, G.; Bullerman, L.B. Thermal stability of moniliformin at varying temperature, pH, and timein an aqueous environment. J. Food Prot. 2000, 63, 1598–1601. [CrossRef] [PubMed]
© 2019 by the authors. Licensee MDPI, Basel, Switzerland. This article is an open accessarticle distributed under the terms and conditions of the Creative Commons Attribution(CC BY) license (http://creativecommons.org/licenses/by/4.0/).
151


MDPISt. Alban-Anlage 66
4052 BaselSwitzerland
Tel. +41 61 683 77 34Fax +41 61 302 89 18
www.mdpi.com
Toxins Editorial OfficeE-mail: [email protected]
www.mdpi.com/journal/toxins


MDPI St. Alban-Anlage 66 4052 Basel Switzerland
Tel: +41 61 683 77 34 Fax: +41 61 302 89 18
www.mdpi.com ISBN 978-3-0365-0159-8