functional analysis of genes required for entry into … · functional analysis of genes required...
TRANSCRIPT

Chapter 3
Functional analysis of genes required for entry into and exit from stationary phase in
S. cerevisiae
Marijana Radonjic, Theo Bijma and Frank C.P. Holstege

Cha
pter
3
50

51
Chapter 3
Summary
Quiescence is a common cellular state in all organisms, yet it remains largely unexplored. In yeast, quiescence is induced in response to starvation as a strategy that facilitates long-term survival under harsh conditions. We have previously used DNA microarray expression profiling to describe the changes in mRNA levels that accompany entry into and exit from stationary phase (SP) in the yeast S. cerevisiae. Here, we analyse phenotypes and functions of genes selected from the genome-wide expression data to determine processes and genes that are essential for long-term survival and for the exit from quiescence upon re-feeding. In total, phenotype analysis of gene deletion mutants identifies 50 strains with strong to intermediate SP-associated growth defects. The analysis of functional categories of SP-responsive genes reveals that the primary processes in the initiation of reproliferation are the facilitation of protein synthesis and the activation of gene-specific transcription regulators, and that entry into quiescence requires activation of cellular stress response and major changes in energy metabolism. Thirty percent of the analysed genes have not been previously associated with any biological role, which underscores the importance of these assays in the functional characterisation of the genome. Taken together, the results reveal many genes essential for yeast quiescence and provide a comprehensive description of the metabolic and regulatory processes responsible for entry and exit from this important and poorly explored cellular state.
Introduction The resting state, also known as quiescence or G0, is the most common state of eukaryotic cells (Lewis, 1991). Quiescent cells are non-dividing, but they retain the potential to resume division upon receiving stimuli for reproliferation. Mammalian cells become quiescent after terminal differentiation and can be inappropriately induced to divide, as occurs during development of cancer and early stages of neurodegenerative diseases (Raina et al., 1999; Sherman and Goldberg, 2001; Yoshikawa, 2000). Understanding the regulation of quiescence is therefore important for cancer and ageing studies (Gershon and Gershon, 2000).
In yeast, quiescence can be induced by starvation. Nutrient depletion causes growth arrest and the yeast culture enters stationary phase (SP). In such SP cultures, most of the cells are in a quiescent state. SP is the result of multiple transitions. Upon depleting glucose, cells adjust metabolism for utilization of other carbon sources during the non-proliferative diauxic shift (DS). This is followed by slow postdiauxic growth (respiration), until complete carbon source depletion results in cells entering quiescence. Yeast quiescence represents a survival program involving morphological and physiological changes that protect cells during harsh environmental conditions (Werner-Washburne et al., 1993). The resistance of quiescent cells to stress is common for all microorganisms and causes difficulties in treatment of human microbial diseases with antibiotics. More insight into SP would therefore benefit strategies for fighting pathogenic microorganisms. In addition, S. cerevisiae is widely used in the food and biotech industry and better understanding of
Functional analysis of genes required for entry into and exit from stationary phase in S.cerevisiae
Marijana Radonjic, Theo Bijma and Frank C.P. Holstege
Department of Physiological Chemistry, University Medical Center Utrecht, Universiteitsweg 100, 3584 CG Utrecht, The Netherlands

Cha
pter
3
52
stationary phase would also be beneficial for these fields (Schuller and Casal, 2005).
Despite the importance of understanding quiescence for biomedicine and industry, yeast stationary phase (SP) remains largely unexplored. In part, this is due to the properties of quiescent yeast cells. The thick cell wall obstructs lysis (de Nobel et al., 2000). Analysis of mRNA and proteins is difficult due to low biochemical activity during quiescence (Choder, 1991; Fuge et al., 1994). Understanding SP has also been complicated by different definitions, different methods of inducing quiescence, insufficient expression markers and lack of mutants with quiescence-associated phenotypes. Also, distinction between SP mutants involved in entry, maintenance and/or exit from quiescence has received little attention in previous studies.
The development of genome-wide techniques has started to facilitate an understanding of stationary phase. Several DNA microarray studies have investigated mRNA expression changes that occur in yeast cells during different growth phases (DeRisi et al., 1997; Gasch et al., 2000; Martinez et al., 2004; Radonjic et al., 2005). Here, we have employed a previously generated genome-wide mRNA expression dataset (Radonjic et al., 2005) to select SP-responsive genes for functional and phenotype analyses. The aim of this work was to determine which relevant processes occur during SP exit and entry and to identify novel mutants with SP phenotypes. The phenotype assays include mutants for genes that are induced during SP, identifying genes required for SP entry and maintenance, as well as mutants of genes induced upon SP exit, identifying genes required for exit from SP. Of 73 analysed mutants, we found 50 genes with a SP-related growth defect. The rate of phenotype discovery (68%) shows that genome-wide expression screens are a useful tool for identification of genes that are essential for particular conditions.
Results
Biological processes required for exit from stationary phase Exit from stationary phase (SP) in S.cerevisiae is characterized by an extremely rapid transcription response. Over 2500 genes are induced after only three minutes upon adding fresh medium to the SP culture (Radonjic et al., 2005). The functions of immediately transcribed genes may indicate critical events responsible for the reprogramming of cellular metabolism in preparation for growth. To identify pivotal biological processes that occur during the transition from quiescence to proliferation, we examined functional categories (Harris et al., 2004; Robinson et al., 2002) of 201 genes that were induced more than four-fold within the first 3 minutes upon exit from SP (Radonjic et al., 2005) (Figure 1A and 2A).
The most significant functional category for the members of rapidly induced genes is related to ribosome biogenesis and assembly (Figure 2A). Ribosome biosynthesis is necessary for the boost of protein production, which is indispensable for the establishment of cellular growth (Moss, 2004). All the genes from this category are rapidly induced upon exit from SP and their expression is further stabilized until the mid-log phase (Figure 1A), which confirms the necessity of these genes for both the SP exit and for the maintenance of exponential growth.
Many genes induced upon SP exit have a regulatory function. This includes transcription factors that regulate carbon utilization by repressing glucose repressible genes (NRG1, MIG1, MIG2) or by activating glycolysis (TYE7). Other identified regulators control growth through PKA and Rho1 PKC signalling pathways (RGS2, BAG7, PDE2) and the cell cycle (RCK1, TYE7). All the genes from the category of transcription regulators are induced transiently upon SP exit (Figure 1A), indicating that they are required for the initiation, but not for the maintenance of growth.
Other genes induced upon stationary phase exit include those with a function in cellular metabolism. This involves various transporters

53
Chapter 3
(HXT1, HXT2, HXT4, PHO84, PHO89, TPO2, TPO3, ENA2, ENA1, MEP1, MEP2, FCY2, THI7, AQY1), genes with a role in amino acid biosynthesis
(LYS4, LYS9, LYS12, GLY1, CYS4) and energy derivation (PFK27, OYE2, DLD3, ERO1). Within the 201 analysed genes, we found 64 that were not previously associated with any biological process or molecular function. Expression profiles of these genes imply their involvement in one or more aspects of the stationary phase exit and make them attractive candidates for further phenotype analysis. Finally, 54 out of 201 genes are classified as essential (p=5.10-4), which underlines the importance of the ability of the cells to successfully exit quiescence when nutrients are replenished.
Entry into stationary phase is accompanied by metabolic changes and stress responseThe next group of genes selected for functional analysis were stationary phase induced genes. We investigated functional categories of these genes to determine the most important processes required for quiescence entry and maintenance. The analysis included 460 genes upregulated at the nine-day stationary phase culture of S. cerevisiae (Radonjic et al., 2005) (Figure 1B and 2B).
SP induced genes have functions in various aspects of yeast metabolism (Figure 2B). The majority of these metabolic genes are involved in energy derivation. Over-representation of categories related to mitochondrial and peroxisomal function, tricarboxylic acid cycle (TCA) and oxidative phosphorylation suggests that energy is largely derived by respiration and oxidation of organic compounds. This is in agreement with the other studies of similar starvation endpoints (Boer et al., 2003; Martinez et al., 2004; Wu et al., 2004). In addition, all genes belonging to the categories of glyoxylate, propionate and vitamin metabolism were also identified within the set of SP induced genes.
Increased resistance to stress is an important property of quiescent cells (Werner-Washburne et al., 1993). Analysis of the functional categories among the SP upregulated genes reveals an expected overrepresentation of the stress response genes. This includes genes involved in resistance to heat shock (HSP12, HSP26,
Figure 1. mRNA expression profiles of genes selected for functional analysis (A) Genes induced more then 4 fold in the three minute time-point after stationary phase (SP) exit compared to the SP starting sample (Radonjic et al., 2005). Rep-resentatives of the functional categories “ribosome biogenesis and assembly” and “DNA dependent tran-scription” are shown in yellow and red, respectively. The remainder of SP exit genes is shown in gray. The coloured bar at the bottom of the graphs represents the various culture periods: LP, lag phase; EP, exponential phase; DS, diauxic shift; PD, post-diauxic phase; SP, stationary phase.
(B) Genes induced in stationary phase (Radonjic et al., 2005). Representatives of the functional category “respiration” are shown in red and the rest of the SP induced genes are shown in gray. All genes shown in (B) are induced during SP at least three fold more than in exponential phase, relative to expression of all genes in the genome.
00.01
0.1
1
10
100
0.15 1 4 6.5 20 83 200time (h)
expr
essi
onra
tio
00.01
0.1
1
10
100
0.15 1 4 6.5 20 83 200time (h)
expr
essi
onra
tio
LP EP DS PD SP
A
B
LP EP DS PD SP

Cha
pter
3
54
HSP30, HSP42, HSP78, HSP104, SSA3, SSA4, YDC1, NTH1), oxidative stress (GPX1, HYR1, TRR2, CTT1, TRX3, YCL033C), osmotic shock (GCY1, HOR7, SIP18), copper (CUP1, CUP1-2, CRS5), and DNA damage (DDR2). The genes
that regulate the metabolism of glycogen and trehalose are also induced, consistent with the notion that the quiescent cells generate energy reserves to survive prolonged starvation periods (Francois and Parrou, 2001). In addition to its role
P value frequency of representatives (%)functional category
0 2 4 6 8 10 12 14
Frequency in SPGenome frequency
1.50E-07
2.07E-063.17E-06
3051393819643917
3826
1001003550
1005317
100
%
14
P value frequency of representatives (%)functional category
0 5 10 15 20 25 30
Frequency in SP exitGenome frequency
%
A
B
ribosome biogenesis and assemblyrRNA processing
transcription from Pol I promoterRNA metabolism
transcription, DNA-dependenttransport facilitation
metabolismessential genes
amino acid biosynthesisregulation of glycolysis
<1.00E-14<1.00E-14<1.00E-144.14E-089.80E-081.86E-066.43E-055.54E-041.34E-039.60E-03
192523
1089
559
40
carbohydrate metabolismrespiration
organic acid metabolism
energy pathwaysmitochondrion
tricarboxylic-acid pathway
vitamin metabolismtransporter
peroxisomealcohol metabolism
glyoxylate cycle
pyridoxine metabolismenergy reserves (glycogen and trehalose)
heat shock proteinpropionate metabolism
thiamin metabolismstress response
biotin biosynthesis
cell rescue, defense and virulence
<1.00E-14
<1.00E-14<1.00E-14
1.02E-146.64E-145.96E-132.03E-112.85E-10
3.65E-084.44E-081.50E-07
1.03E-061.50E-06
8.25E-06
2.84E-051.12E-04
16
oxidative phosphorylation 3.03E-10 73
Figure 2. Functions of genes induced during stationary phase entry and exitFunctional categories overrepresented in the group of transcripts rapidly induced upon stationary phase exit (A) and in the group of stationary phase enriched transcripts (B). The functional category is shown on the left, followed by the p-value as determined by a hypergeometric test. Percentage values signify the fraction of queried genes within a category relative to all genes in that category. The black bar indicates how many of the queried genes are assigned to a category, and the white bar, how many genes in the genome belong to that category. Functional categories were derived from MIPS and GO databases.

55
Chapter 3
as the reserve carbohydrate, trehalose functions as an important protectant against a variety of stresses (Wiemken, 1990).
Regulatory factors induced in stationary phase are of particular interest for understanding the transcriptional mechanisms underlying quiescence. A total of 42 (putative) transcription factors and components of signal transduction pathways are upregulated in SP. These include established regulators of stress and metabolism such as MSN4, HAP4, ADR1, XBP1, MTH1, SIP4, DAL80, CUP2, ROX1 and MET28, 10 uncharacterised genes homologous to regulatory factors and genes implicated in cell cycle control such as the PCL10 and CLB3 cyclins. Of the 460 analysed SP-induced genes, 178 have no prior established molecular function or biological process. This underscores the uncharacterised nature of S. cerevisiae quiescence, indicating that SP provides good starting condition for assigning function to many unknown genes.
Mutants of SP-responsive genes exhibit stationary phase phenotypesElevated levels of expression during stationary phase (SP) exit and entry may indicate a requirement for successful survival and recovery from SP. To investigate this, we selected 22 genes with rapid induction upon SP exit, and 51 genes induced in SP for phenotype analysis (Table 1). Mutant strains bearing deletions of one of these 73 selected genes were grown to stationary phase at 30°C and subsequently screened for viability and for the rate of recovery from SP at 25, 30 and 37°C (Table 1, Figure 3) (Experimental procedures). Cells were grown to SP at an optimal temperature (30°C) to prevent additional stress which may affect entry into and maintenance of quiescence. Viability and rate of recovery from SP upon replating were monitored at both optimal and suboptimal temperatures to compare our findings with previous studies and discriminate between mutants with “real” and temperature sensitivity–coupled SP phenotypes.
Out of 22 deletion strains, selected mainly from the rapidly and transiently induced regulatory
genes, 13 exhibit a slow recovery (SR) phenotype specifically during exit from SP (Table 1). In eight of these 13 mutants, the SR phenotype is accompanied by loss of viability in stationary phase. Examples of SP exit mutants showing survival defects are depicted in Figure 3A, 3B. Slow recovery genes include: DIA1 and SOK2, regulators of pseudohyphal and invasive growth (Christie et al., 2004; Ward et al., 1995); MIG1, a regulator of glucose metabolism (Lutfiyya et al., 1998) and PRS3, proposed to link cell cycle progression with nutrient limitation (Binley et al., 1999; Jorgensen et al., 2002).
The phenotype analysis of strains bearing deletions in one of the 51 SP upregulated genes results in the identification of 34 strains with a reduced SP survival (Table 1, Figure 3D). Of these, 16 lose viability upon replating at any tested temperature and 18 have reduced survival exclusively at 37°C. Inability to recover from SP at 37°C indicates that the SP phenotype of these strains is related to temperature sensitivity.
Genes required for SP survival are mainly involved in metabolism, including transporters (PUT4, JEN1, YLR004C, FUN34, PDR10, BIO5) and various metabolic enzymes (ACH1, SNO1, THI4, MLS1, INO1). Furthermore, many of the genes necessary for SP survival act as regulators. These include: ADR1 and SIP4, carbon source-responsive transcription factors (Lesage et al., 1996; Vincent and Carlson, 1998; Young et al., 2003); YPL054W and YGR067C, putative transcription factors (Bohm et al., 1997; Epstein et al., 2001; Treger et al., 1998); RDI1, YPT53C and YBR203W, involved in signaling (Koch et al., 1997; Masuda et al., 1994; Singer-Kruger et al., 1994) as well as RIM4 and SPR3, regulators of sporulation (Fares et al., 1996; Soushko and Mitchell, 2000). Among the other genes with phenotypes in these assays are HBT1, a target of Hub1p ubiquitination, implicated in regulation of cell polarity (Dittmar et al., 2002), PBI2, regulator of proteolysis (Betz, 1975; Slusarewicz et al., 1997), as well as the relatively uncharacterised histone acetyltransferase HPA2 (Sterner and Berger, 2000). In addition, eight of the 34 genes with SP phenotypes have no previously established function.

Cha
pter
3
56
Table 1. Analysis of stationary phase survival and rate of recovery from stationary phase
Deletion mutant Replating temperature
Gene name 25°C 30°C 37°CSystematic
Name Description
Genes induced upon SP exit
YOR051C YOR051C Protein that purifies with the nuclear pore complex SR + SR + SR +YMR316W DIA1 Protein involved in invasive and pseudohyphal growth ++ SR + ++
YHL011C PRS3 Role in nutrient limitation induced cell cycle regulation SR ++ SR + SR ++YGL035C MIG1 Transcriptional repressor involved in glucose repression SR ++ SR + SR ++YML123C PHO84 High-affinity inorganic phosphate/H+ symporter SR ++ SR ++ SR ++YOR052C YOR052C Protein containing an AN1-like zinc finger domain SR ++ SR ++ +++YOR028C CIN5 Transcription factor of the basic leucine zipper family ++ SR +++ SR +++YOR032C HMS1 Probable myc family transcription factor involved pseudohyphal differentiation SR ++ SR +++ +++YGR123C PPT1 Protein serine/threonine phosphatase of unknown function SR +++ SR +++ SR ++YGL209W MIG2 Zinc-finger protein involved in glucose repression of SUC2 SR +++ SR +++ SR +++YGL162W SUT1 Involved in sterol uptake SR +++ SR +++ SR +++YMR016C SOK2 Transcription factor of meiosis, pseudohyphal differentiation and sporulation SR +++ SR+++ SR +++YGL158W RCK1 Serine/threonine protein kinase with similarity to Cmk1p, Cmk2p, and Cmk3p ++ SR+++ SR +++YOR134W BAG7 GTPase-activating protein (GAP), activates Rho1p ++ ++ ++YOR107W RGS2 G protein signaling regulator for inactivation of the cAMP signaling pathway ++ ++ ++YMR291W YMR291W Serine/threonine protein kinase of unknown function +++ ++ ++YIL130W GIN1 Putative zinc finger transcription factor +++ +++ +++YHR136C SPL2 Putative inhibitor of Pho80p-Pho85p cyclin-dependent protein kinase +++ +++ +++YER064C YER064C Putative global transcriptional regulator +++ +++ +++YER037W PHM8 Protein involved in phosphate metabolism +++ +++ +++YDR281C PHM6 Protein predicted to have a role in phosphate metabolism +++ +++ +++YDR043C NRG1 Transcriptional glucose repressor and suppressor of snf mutations +++ +++ +++
Genes induced in SP YLR004C YLR004C Member of the allantoate permease family + + +
YKL217W JEN1 Pyruvate and lactate/H[+] symporter NT + +YNL015W PBI2 Protease B inhibitor 2, also has unrelated activity to vacuolar fusion NT + +YOR348C PUT4 High affinity proline permease, also transports alanine and glycine NT + +YBR203W YBR203W F-box domain protein for ubiquitin-conjugation NT + +
YDL135C RDI1 Rho GDP dissociation inhibitor ++ ++ ++YDR216W ADR1 Transcription factor, regulation of ADH2 and peroxisomal genes NT ++ ++YBL015W ACH1 Acetyl-CoA hydrolase, involved in acetate utilization and sporulation NT ++ ++YDR070C YDR070C Protein of unknown function NT ++ ++YDL223C HBT1 Target of Hub1p ubiquitination, bud site selection and shmoo formation NT ++ ++YKL163W PIR3 Protein with similarity to members of the Pir1p/Hsp150p/Pir3p family NT ++ ++YBR230C YBR230C Protein of unknown function NT ++ ++YPR193C HPA2 Histone and other protein acetyltransferase ++ ++ ++YMR095C SNO1 Putative pyridoxine (vitamin B6) biosynthetic enzyme ++ ++ ++YGR144W THI4 Thiamine-repressed protein, for growth in the absence of thiamine ++ ++ ++YDL048C STP4 Similarity to Stp1p: involved in tRNA splicing and amino acid uptake NT +++ +YML122C YML122C Protein of unknown function SR ++ SR ++ SR ++YJL089W SIP4 Activator of gluconeogenic genes, activated by Snf1p kinase NT +++ ++YGR043C YGR043C Protein that may be involved in signal transduction NT +++ ++YMR175W SIP18 Interacts with phospholipid vesicles, induced by osmotic stress NT +++ ++YGR059W SPR3 Sporulation-specific septin NT +++ ++YNL093W YPT53 Rab family GTP-binding protein involved in endocytosis NT +++ ++YNR002C FUN34 Induced by excess acetate NT +++ ++YPL054W LEE1 Two zinc-finger protein NT +++ ++YHL024W RIM4 Protein required for sporulation and formation of meiotic spindle NT +++ ++YGR146C YGR146C Protein of unknown function NT +++ ++YBR047W YBR047W Protein of unknown function NT +++ ++

57
Chapter 3
YNL117W MLS1 Malate synthase 1, functions in glyoxylate cycle NT +++ ++YFR017C YFR017C Protein of unknown function NT +++ ++YOR328W PDR10 Member of ATP-binding cassette (ABC) superfamily +++ +++ ++YNR056C BIO5 Transporter of KAPA/DAPA, biotin biosynthesis +++ +++ ++YJL153C INO1 Inositol-1-phosphate synthase +++ +++ ++YGR067C YGR067C Protein with two tandem zinc finger domains +++ +++ ++YLR311C YLR311C Protein of unknown function +++ +++ ++YML128C MSC1 Protein that affects meiotic homologous chromatid recombination NT +++ ++++YMR107W YMR107W Protein of unknown function NT ++++ ++++YPR002W PDH1 Protein possibly involved in propionate utilization NT ++++ ++++YDR536W STL1 Hexose transporter of the major facilitator superfamily ++++ ++++ ++++YKR034W DAL80 GATA-type zinc finger transcriptional repressor NT +++ +++YJL103C YJL103C Putative Zinc finger transcription factor NT +++ +++YPL230W YPL230W Putative Zinc finger transcription factor NT +++ +++YLR178C TFS1 CDC25-dependent nutrient-response cell cycle regulator NT +++ +++YGR236C SPG1 Protein of unknown function +++ +++ +++YBR045C GIP1 Glc7p-interacting protein for spore wall deposition during meiosis +++ +++ +++YPL186C UIP4 Protein of unknown function +++ +++ +++YBR240C THI2 Zinc-finger regulatory protein for thiamine biosynthesis +++ +++ +++YJR122W CAF17 Component of the CCR4 transcription complex +++ +++ +++YBL059W YBL059W Protein of unknown function +++ +++ +++YMR096W SNZ1 Putative pyridoxine (vitamin B6) biosynthetic enzyme +++ +++ +++YPL058C PDR12 Membrane transporter +++ +++ +++YBR067C TIP1 Cold- and heat-shock induced mannoprotein of the cell wall +++ +++ +++
SR slow recovery upon exit from stationary phase + loss of viability in stationary phase ++ decreased viability in stationary phase+++ viability in stationary phase equal to wild-type++++ increased viability in stationary phaseNT condition not tested
A total of 50 genes are found with strong to intermediate phenotypes in these assays. The finding that mutants of genes with distinct expression patterns and diverse functions can exhibit SP-related phenotypes reflects the complexity of quiescence regulation.
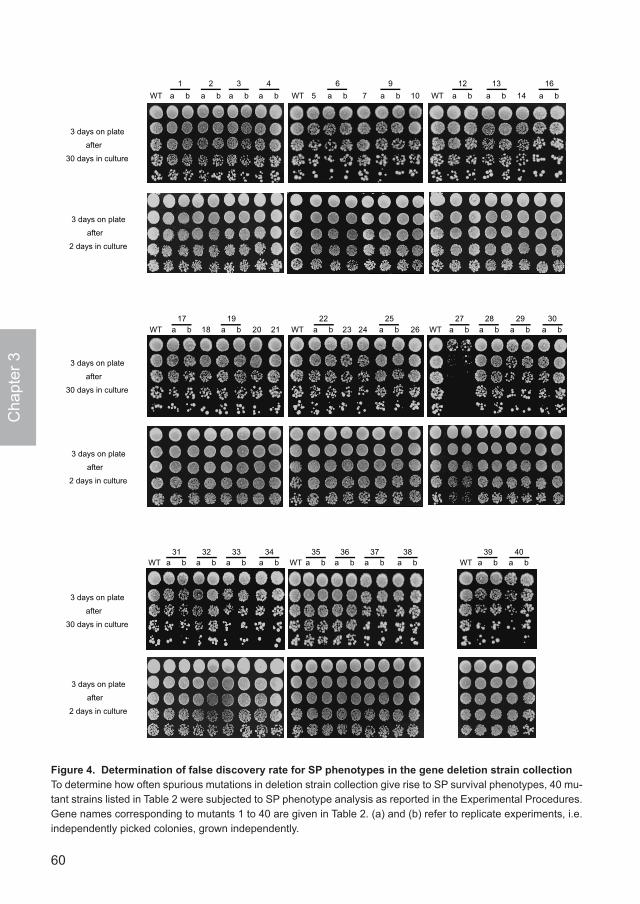
False discovery rate for SP phenotypes in the gene deletion strain collectionThe SP phenotype analysis was carried out using the deletion strain collection (Winzeler et al., 1999), which is a commonly used strain resource for the S. cerevisiae deletion studies. To test how often spurious mutations or errors in this collection give rise to loss of survival in SP, we selected 40 genes that showed no upregulation in stationary phase and with no previously known growth phenotypes (as reported in Saccharomyces Genome Database) and then
subjected deletion strains of these genes to an identical phenotype analysis as reported for the SP induced genes (Table 2 and Figure 4). Of the 37 deletion strains that we were able to assay (Table 2), only one had the phenotype of loss of viability in stationary phase. In retrospect, this phenotype had previously been described and attributed to deletion of this gene, but in a different database (Costanzo et al., 2000; Csank et al., 2002). Out of the other 36 strains, none showed the phenotype. These numbers compare favorably to our original finding that 34 of the 51 deletion strains (selected for upregulation of the corresponding mRNA in stationary phase) have this phenotype. This control experiment indicates that the false-positive rate for this phenotype screen is less than 3% for the strains used here.

Cha
pter
3
58
A
3 days on plate
after
30 days in culture
3 days on plate
after
2 days in culture
B
WT
WT
D
3 days on plate
after
30 days in culture
3 days on plate
after
2 days in culture
1, 2, and 3 days on plate
after
30 days in culture
WT
yor0
52c
WT
yor0
52c
WT
yor0
52c
day 1 day 2 day 3
1, 2, and 3 days on plate
after
2 days in culture
WT
dia1
mig
1
yor0
51c
prs3
00.01
0.1
1
10
100
0.15 1 4 6.5 20 83 200time (h)
expr
essi
onra
tio
LP EP DS PD SP
WT
WT
rdi1
ylr0
04c
pbi2
adr1
ybr2
03w
jen1
put4
00.01
0.1
1
10
100
0.15 1 4 6.5 20 83 200time (h)
expr
essi
onra
tio
LP EP DS PD SP
C
E
Figure 3. Stationary phase phenotypes (A, B) Examples of phenotypes for mutants bearing deletion in stationary phase (SP) exit genes. Wild-type and mutant strains were grown for 30 days in YPD culture at 30°C. Cells from 30-day (top panels) or two-day (bottom panels) cultures were spotted in five-fold serial dilutions on YPD plates and incubated for 3 days at 30°C. Loss of viability in stationary phase is estimated from the number of colonies formed on the third day upon replating (A). Slow recovery from stationary phase is deduced from the size of colonies formed during first, second and third day upon replating (B).

59
Chapter 3
Table 2. Phenotype analysis of strains from deletion strain collection
Deletion mutant Systematic name Gene name Remark
1 YAL026C DRS2, FUN382 YAL013W DEP1, FUN543 YOR061W4 YOR355W5 YPL127C6 YEL014C7 YIL016W SNL18 YML075C HMG1 both cultures contaminated9 YJR010C-A SPC1
10 YJR032W CPR711 YBR189W RPS9B, RPS13A, SUP46 both cultures contaminated12 YGR038W ORM113 YGR106C14 YKR094C RPL40B, UBI215 YPL158C overnight culture did not grow 16 YGR221C17 YKR074W18 YHR193C EGD219 YFR006W20 YKL207W21 YLR313C SPH122 YML060W OGG123 YPR068C HOS124 YPR126C25 YLR065C26 YLR179C27 YPL091W loss of viability in SP28 YBL079W NUP170, NLE329 YBR174C30 YBR187W31 YDL121C32 YDL236W PHO1333 YDR257C RMS134 YDR279W35 YDR492W36 YDR503C LPP137 YGL050W38 YGL221C NIF339 YGL229C SAP440 YOR179C
(C) mRNA expression profiles of genes with phenotypes shown in (A) and (B). The colour of mRNA expression graphs corresponds to the colour of gene names in (A) and (B). The bar at the bottom of mRNA expression graphs represents the various culture periods, with abbreviations according to Figure 1.(D) Examples of phenotypes for mutants bearing deletions in SP induced genes, revealed by an identical analysis as in (A) and (B).(E) mRNA expression profiles of genes with phenotypes shown in (D). The colour of mRNA expression graphs corresponds to the colour of gene names in (D).
Cha
pter
3
60
3 days on plate
after
2 days in culture
3 days on plate
after
30 days in culture
3 days on plate
after
30 days in culture
3 days on plate
after
2 days in culture
3 days on plate
after
30 days in culture
3 days on plate
after
2 days in culture
WT a b
1
a b
2
a b
3
a b
4
WT a b
6
a b
9
5 7 10 WT a b
12
a b
13
14 a b
16
WT a b17
18 a b19
20 21 WT a b22
23 24 a b25
26 WT a b27
a b28
a b29
a b30
WT a b31
a b32
a b33
a b34
WT a b35
a b36
a b37
a b38
WT a b39
a b40
Figure 4. Determination of false discovery rate for SP phenotypes in the gene deletion strain collectionTo determine how often spurious mutations in deletion strain collection give rise to SP survival phenotypes, 40 mu-tant strains listed in Table 2 were subjected to SP phenotype analysis as reported in the Experimental Procedures. Gene names corresponding to mutants 1 to 40 are given in Table 2. (a) and (b) refer to replicate experiments, i.e. independently picked colonies, grown independently.
61
Chapter 3
Discussion
Genome-wide studies are a powerful means of identifying gene function. Here, we employ gene expression data (Radonjic et al., 2005), to determine the most important biological processes that occur during the exit and entry into stationary phase (SP). Furthermore, we find a SP related role for many of the SP expressed genes by phenotype analysis. The diversity of the identified genes suggests that yeast quiescence is a complex cellular state and that regulation of multiple cellular functions is required for successful completion of the quiescence cycle.
Functions of SP exit genes
Important processes developed to cope with the improved nutritional status upon exit from stationary phase are preparation for protein synthesis and activation of gene-specific transcription regulators. The ribosome biosynthesis genes are identified as the most significant category of SP exit induced genes, which is in agreement with previous studies (Martinez et al., 2004). The rapidly activated transcription regulators are particularly informative for understanding quiescence exit control. The nature of these regulators reveals the expression remodeling that takes place upon SP exit, leading to inactivation of the program required for the maintenance of SP (ROX1, ROX3, NRG1, MIG1), and to activation of cellular growth (DRS1, FAL1, SNU13, NOP1, NSR1).
Quiescence versus stationary phase
Functional categories of genes induced during various starvation conditions have been investigated in several expression studies (DeRisi et al., 1997; Gasch et al., 2000; Wu et al., 2004). Our analysis of stationary phase induced genes (Radonjic et al., 2005), identified activation of metabolic processes and stress response genes. Clearly, a distinction needs to be made between genes required for the quiescence growth arrest and genes required for the particular condition under which quiescence is
induced and maintained. For example, induction of SNO and SNZ gene families has traditionally been considered a hallmark of stationary phase (Padilla et al., 1998). However, induction of such genes has been shown to be specific to stationary phase in auxotrophic strains (Radonjic et al., 2005), demonstrating that this activation is a consequence of specific requirements in amino acid metabolism and not the universal property of arrested quiescent cells. This is in agreement with the finding that these genes function in pyridoxine metabolism (Rodriguez-Navarro et al., 2002), which serves as the co-factor for amino acid biosynthesis enzymes. Most of the stationary phase enriched genes are indeed involved in cellular metabolism. Many are required for respiration and and are already induced at the end of the diauxic shift (Radonjic et al., 2005) (Figure 1B). These genes have specific metabolic roles and therefore, similar to the SNO/SNZ family, are likely to be activated as a consequence of subsequent changes in the culture environment such as pH, salt and other limiting nutrients, rather than directly due to quiescence.
The induction of most of the stationary phase transcripts during the diauxic shift (DS) (Radonjic et al., 2005) suggests that the program of quiescence may already be (partially) initiated during this phase. This hypothesis is supported by transient activation of the genes required for diverse survival programs early during DS (Radonjic et al., 2005). This includes the cell cycle and nutrient limitation regulators as well as the genes involved in mating, sporulation and pseudohyphal differentiation, indicating integrative control of various nutrient adaptation survival programs (Madhani and Fink, 1998). The model emerging from these data suggests that the quiescent program is induced much earlier in the glucose starvation experiments than previously assumed (Gray et al., 2004). Another implication of the model proposed above is that glucose starvation, the most frequently applied method of quiescence induction, is perhaps too complex to allow simple unraveling of purely quiescent regulatory mechanisms.

Cha
pter
3
62
Stationary phase exit, entry and maintenance mutants The analysis of mutant phenotypes is a powerful method for determination of gene function. Three subclasses of “stationary phase” (SP) mutants are proposed to exist, all of which may be defective in one or more transitions during the cell quiescence cycle (Gray et al., 2004). This distinction has not been addressed in previous mutant analyses. SP mutants were simplistically defined as those that lose viability when cultured to stationary phase, and were often confused with temperature sensitivity phenotypes. For example, in Martinez et al., 2004, SP phenotypes are investigated by growing mutants to SP at 37 instead of 30°C, which results in additional stress. All strains that lose viability were classified as “stationary phase essential”, although only quarter shows any growth defect when grown to SP at 30°C. This demonstrates that the majority of such previously reported mutants lose viability as the consequence of temperature sensitivity, rather than only impaired SP survival.
Mutants that are defective in exit from SP are viable during quiescence but unable to generate colony forming units (CFU) upon replating (Gray et al., 2004). It is likely that strains with such phenotypes would already be classified as essential by previous analyses of the deletion collection (Winzeler et al., 1999), since successful manipulation of the stock cultures requires completion of the entire quiescence cycle. Mutants with severe SP exit phenotypes are therefore probably not present in the mutant collection and could not be investigated here. This agrees with the fact that 25% of the SP exit induced genes are indeed found to be essential. We propose that mutants that are capable of partially recovering from stationary phase, but which are unable to reach the wild-type rate of colony growth, represent a less severe manifestation of the lethal SP exit phenotype (Table 1, Figure 3A, 3B).
Although our phenotype study introduces several improvements, a downside of the commonly used replating assay is that it cannot distinguish between mutants defective in
establishment of SP and mutants impaired for SP maintenance (Gray et al., 2004). Both of the defects are manifested by decreased viability in stationary phase, however, this lethality has different causes: entry mutants fail to establish quiescence and to acquire protective properties that are essential for survival, and maintenance mutants successfully enter quiescence but are unable to maintain long-term viability in that state. These two subclasses can be discriminated by the assessment of various quiescence properties of the mutants. It would be useful to examine DNA content of the cells during entry into stationary phase to determine which mutants lack the ability to arrest growth in G0 phase. Additionally, levels of stress resistance and diverse biochemical properties of the cells could be monitored as indicators of protective capacity. These studies will be required to make a distinction between SP entry and SP maintenance mutants and to determine in which particular phase of the quiescence cycle are the mutated genes involved.
RDI1 is a putative quiescence regulatorOur phenotype study implies a SP related role for 34 SP induced genes, including many regulators of growth and metabolism. Particularly interesting is the phenotype observed upon deleting RDI1, a proposed GDP dissociation inhibitor for Cdc42. Cdc42 is an evolutionary conserved Rho-type GTPase regulator of mammalian cell morphogenesis and cell division polarity in yeast (Johnson, 1999). The function of a Rho GDP dissociation inhibitor in yeast has remained elusive, despite the interest because of its interaction with the growth regulator Cdc42 (Masuda et al., 1994). Previous deletion analysis of RDI1 did not show loss of viability in normal cultures or any defects in mating, sporulation, heat shock or budding (Masuda et al., 1994). However, over-expression of RDI1 did result in inhibition of cell growth. Loss of SP survival upon RDI1 deletion (Figure 3D), suggests that the Rho GDP dissociation activity keeps Cdc42 inactive, thereby preventing inappropriate proliferation during quiescence. To the best of our knowledge,

63
Chapter 3
RDI1 represents the first gene that shows these reciprocal phenotypes, that is inhibition of growth upon over-expression in proliferating cells and loss of SP survival upon deletion. This leads to the proposal that Rdi1 negatively regulates proliferation during quiescence through its interaction with Cdc42. In accordance with the model of early quiescence induction proposed here, transient upregulation of RDI1 mRNA also occurs at the beginning of the diauxic shift (Figure 3E).
The analyses described here discover regulators involved in entry into and exit from quiescence and identify many genes required for stationary phase survival. A substantial set of these genes has no prior established cellular role, including 64 of 201 rapidly induced genes upon SP exit and 178 of 460 genes upregulated in SP. These genes can now be classified as SP related, increasing significantly the number of currently annotated SP genes. Altogether, the data provide novel insights into the nature and the regulation of quiescence and opens new avenues for the further exploration of this relatively uncharacterised and important cellular state.
Experimental procedures
Yeast strains S.cerevisiae BY4741 (MATa; met15∆0; ura3∆0; his3∆1; leu2∆0) (Research Genetics) was used as the wild-type reference strain in all experiments. The stationary phase phenotype analysis was carried out using the yeast knockout strain collection of the yeast gene deletion consortium (Winzeler et al., 1999). Deletion mutants were obtained through EUROSCARF. In addition, the mutant strain bearing deletion of RDI1 gene was reconstructed for this study, by replacing the ORF with a kanamycin cassette in the BY4741 parental strain.
Stationary phase phenotype analysisAll strains were cultured in YEP medium supplemented with 2% glucose at 30°C. The cultures were grown under agitation (250 rpm) for 30 days and subsequently examined for viability by spot assay. Starting with equal amounts of stationary phase cells, five-fold serial
dilutions were spotted on YPD plates and incubated for 3 days at 25, 30 and 37°C. Plates were screened for growth after the first, second and third day upon replating. The viability of strains was estimated by the number of colonies formed on a plate after the third day of incubation. Fewer colonies formed by mutant compared to wild-type strain identified mutants with decreased viability in the stationary phase. To discover mutants that are indispensable for reproliferation from the stationary phase, the plates were additionally checked for growth after the first and second day of incubation. This enabled the assessment of the slow recovery phenotype (SR) manifested by formation of smaller colonies by mutants compared to wild-type strain in the first days upon plating. Upon continued culture of the plates, these SR strains partially recover and show closer to wild-type growth on later days. For all mutants, the control spot assay was performed after 2 days of growth in the liquid culture. The aim of this control was to ensure that observed growth-related defects are specific to the stationary phase of growth.
Functional categorization of co-expressed genesGenes co-regulated upon a stationary phase exit and entry (Radonjic et al., 2005) were queried for annotations of functional categories using FunSpec (Robinson et al., 2002). Biological Process and Molecular Function categories were derived from the Gene Ontology (GO) database (Harris et al., 2004) and MIPS database (Mewes et al., 2004). Obtained p-values were subjected to Bonferroni correction for multi-variant testing.
References
Betz, H. (1975). Levels and turnover of the proteinase B inhibitors in yeast. Biochim Biophys Acta 404, 142-151.Binley, K. M., Radcliffe, P. A., Trevethick, J., Duffy, K. A., and Sudbery, P. E. (1999). The yeast PRS3 gene is required for cell integrity, cell cycle arrest upon nutrient deprivation, ion homeostasis and the proper organization of the actin cytoskeleton. Yeast 15, 1459-1469.Boer, V. M., de Winde, J. H., Pronk, J. T., and Piper, M. D. (2003). The genome-wide transcriptional responses of Saccharomyces cerevisiae grown on glucose in aerobic chemostat cultures limited for carbon, nitrogen, phosphorus, or sulfur. J Biol Chem 278, 3265-3274.Bohm, S., Frishman, D., and Mewes, H. W. (1997). Variations of the C2H2 zinc finger motif in the yeast genome and classification of yeast zinc finger proteins. Nucleic Acids Res 25, 2464-2469.Choder, M. (1991). A general topoisomerase I-dependent transcriptional repression in the stationary phase in yeast.

Cha
pter
3
64
Genes Dev 5, 2315-2326.Christie, K. R., Weng, S., Balakrishnan, R., Costanzo, M. C., Dolinski, K., Dwight, S. S., Engel, S. R., Feierbach, B., Fisk, D. G., Hirschman, J. E., et al. (2004). Saccharomyces Genome Database (SGD) provides tools to identify and analyze sequences from Saccharomyces cerevisiae and related sequences from other organisms. Nucleic Acids Res 32 Database issue, D311-314.Costanzo, M. C., Hogan, J. D., Cusick, M. E., Davis, B. P., Fancher, A. M., Hodges, P. E., Kondu, P., Lengieza, C., Lew-Smith, J. E., Lingner, C., et al. (2000). The yeast proteome database (YPD) and Caenorhabditis elegans proteome database (WormPD): comprehensive resources for the organization and comparison of model organism protein information. Nucleic Acids Res 28, 73-76.Csank, C., Costanzo, M. C., Hirschman, J., Hodges, P., Kranz, J. E., Mangan, M., O’Neill, K., Robertson, L. S., Skrzypek, M. S., Brooks, J., and Garrels, J. I. (2002). Three yeast proteome databases: YPD, PombePD, and CalPD (MycoPathPD). Methods Enzymol 350, 347-373.de Nobel, H., Ruiz, C., Martin, H., Morris, W., Brul, S., Molina, M., and Klis, F. M. (2000). Cell wall perturbation in yeast results in dual phosphorylation of the Slt2/Mpk1 MAP kinase and in an Slt2-mediated increase in FKS2-lacZ expression, glucanase resistance and thermotolerance. Microbiology 146 ( Pt 9), 2121-2132.DeRisi, J. L., Iyer, V. R., and Brown, P. O. (1997). Exploring the metabolic and genetic control of gene expression on a genomic scale. Science 278, 680-686.Dittmar, G. A., Wilkinson, C. R., Jedrzejewski, P. T., and Finley, D. (2002). Role of a ubiquitin-like modification in polarized morphogenesis. Science 295, 2442-2446.Epstein, C. B., Waddle, J. A., Hale, W. t., Dave, V., Thornton, J., Macatee, T. L., Garner, H. R., and Butow, R. A. (2001). Genome-wide responses to mitochondrial dysfunction. Mol Biol Cell 12, 297-308.Fares, H., Goetsch, L., and Pringle, J. R. (1996). Identification of a developmentally regulated septin and involvement of the septins in spore formation in Saccharomyces cerevisiae. J Cell Biol 132, 399-411.Francois, J., and Parrou, J. L. (2001). Reserve carbohydrates metabolism in the yeast Saccharomyces cerevisiae. FEMS Microbiol Rev 25, 125-145.Fuge, E. K., Braun, E. L., and Werner-Washburne, M. (1994). Protein synthesis in long-term stationary-phase cultures of Saccharomyces cerevisiae. J Bacteriol 176, 5802-5813.Gasch, A. P., Spellman, P. T., Kao, C. M., Carmel-Harel, O., Eisen, M. B., Storz, G., Botstein, D., and Brown, P. O. (2000). Genomic expression programs in the response of yeast cells to environmental changes. Mol Biol Cell 11, 4241-4257.Gershon, H., and Gershon, D. (2000). The budding yeast, Saccharomyces cerevisiae, as a model for aging research: a critical review. Mech Ageing Dev 120, 1-22.Gray, J. V., Petsko, G. A., Johnston, G. C., Ringe, D., Singer, R. A., and Werner-Washburne, M. (2004). “Sleeping beauty”: quiescence in Saccharomyces cerevisiae. Microbiol Mol Biol Rev 68, 187-206.Harris, M. A., Clark, J., Ireland, A., Lomax, J., Ashburner, M.,
Foulger, R., Eilbeck, K., Lewis, S., Marshall, B., Mungall, C., et al. (2004). The Gene Ontology (GO) database and informatics resource. Nucleic Acids Res 32 Database issue, D258-261.Johnson, D. I. (1999). Cdc42: An essential Rho-type GTPase controlling eukaryotic cell polarity. Microbiol Mol Biol Rev 63, 54-105.Jorgensen, P., Nishikawa, J. L., Breitkreutz, B. J., and Tyers, M. (2002). Systematic identification of pathways that couple cell growth and division in yeast. Science 297, 395-400.Koch, G., Benz, C., Schmidt, G., Olenik, C., and Aktories, K. (1997). Role of Rho protein in lovastatin-induced breakdown of actin cytoskeleton. J Pharmacol Exp Ther 283, 901-909.Lesage, P., Yang, X., and Carlson, M. (1996). Yeast SNF1 protein kinase interacts with SIP4, a C6 zinc cluster transcriptional activator: a new role for SNF1 in the glucose response. Mol Cell Biol 16, 1921-1928.Lewis, D., and D.K. Gattie (1991). The ecology of quiescent microbes. ASM News 57, 27-32.Lutfiyya, L. L., Iyer, V. R., DeRisi, J., DeVit, M. J., Brown, P. O., and Johnston, M. (1998). Characterization of three related glucose repressors and genes they regulate in Saccharomyces cerevisiae. Genetics 150, 1377-1391.Madhani, H. D., and Fink, G. R. (1998). The control of filamentous differentiation and virulence in fungi. Trends Cell Biol 8, 348-353.Martinez, M. J., Roy, S., Archuletta, A. B., Wentzell, P. D., Anna-Arriola, S. S., Rodriguez, A. L., Aragon, A. D., Quinones, G. A., Allen, C., and Werner-Washburne, M. (2004). Genomic analysis of stationary-phase and exit in Saccharomyces cerevisiae: gene expression and identification of novel essential genes. Mol Biol Cell 15, 5295-5305.Masuda, T., Tanaka, K., Nonaka, H., Yamochi, W., Maeda, A., and Takai, Y. (1994). Molecular cloning and characterization of yeast rho GDP dissociation inhibitor. J Biol Chem 269, 19713-19718.Mewes, H. W., Amid, C., Arnold, R., Frishman, D., Guldener, U., Mannhaupt, G., Munsterkotter, M., Pagel, P., Strack, N., Stumpflen, V., et al. (2004). MIPS: analysis and annotation of proteins from whole genomes. Nucleic Acids Res 32, D41-44.Moss, T. (2004). At the crossroads of growth control; making ribosomal RNA. Curr Opin Genet Dev 14, 210-217.Padilla, P. A., Fuge, E. K., Crawford, M. E., Errett, A., and Werner-Washburne, M. (1998). The highly conserved, coregulated SNO and SNZ gene families in Saccharomyces cerevisiae respond to nutrient limitation. J Bacteriol 180, 5718-5726.Radonjic, M., Andrau, J. C., Lijnzaad, P., Kemmeren, P., Kockelkorn, T. T., van Leenen, D., van Berkum, N. L., and Holstege, F. C. (2005). Genome-wide analyses reveal RNA polymerase II located upstream of genes poised for rapid response upon S. cerevisiae stationary phase exit. Mol Cell 18, 171-183.Raina, A. K., Monteiro, M. J., McShea, A., and Smith, M. A. (1999). The role of cell cycle-mediated events in Alzheimer’s disease. Int J Exp Pathol 80, 71-76.Robinson, M. D., Grigull, J., Mohammad, N., and Hughes, T. R. (2002). FunSpec: a web-based cluster interpreter for

65
Chapter 3
yeast. BMC Bioinformatics 3, 35.Rodriguez-Navarro, S., Llorente, B., Rodriguez-Manzaneque, M. T., Ramne, A., Uber, G., Marchesan, D., Dujon, B., Herrero, E., Sunnerhagen, P., and Perez-Ortin, J. E. (2002). Functional analysis of yeast gene families involved in metabolism of vitamins B1 and B6. Yeast 19, 1261-1276.Schuller, D., and Casal, M. (2005). The use of genetically modified Saccharomyces cerevisiae strains in the wine industry. Appl Microbiol Biotechnol 68, 292-304.Sherman, M. Y., and Goldberg, A. L. (2001). Cellular defenses against unfolded proteins: a cell biologist thinks about neurodegenerative diseases. Neuron 29, 15-32.Singer-Kruger, B., Stenmark, H., Dusterhoft, A., Philippsen, P., Yoo, J. S., Gallwitz, D., and Zerial, M. (1994). Role of three rab5-like GTPases, Ypt51p, Ypt52p, and Ypt53p, in the endocytic and vacuolar protein sorting pathways of yeast. J Cell Biol 125, 283-298.Slusarewicz, P., Xu, Z., Seefeld, K., Haas, A., and Wickner, W. T. (1997). I2B is a small cytosolic protein that participates in vacuole fusion. Proc Natl Acad Sci U S A 94, 5582-5587.Soushko, M., and Mitchell, A. P. (2000). An RNA-binding protein homologue that promotes sporulation-specific gene expression in Saccharomyces cerevisiae. Yeast 16, 631-639.Sterner, D. E., and Berger, S. L. (2000). Acetylation of histones and transcription-related factors. Microbiol Mol Biol Rev 64, 435-459.Treger, J. M., Schmitt, A. P., Simon, J. R., and McEntee, K. (1998). Transcriptional factor mutations reveal regulatory complexities of heat shock and newly identified stress genes in Saccharomyces cerevisiae. J Biol Chem 273, 26875-26879.Vincent, O., and Carlson, M. (1998). Sip4, a Snf1 kinase-dependent transcriptional activator, binds to the carbon source-responsive element of gluconeogenic genes. Embo J 17, 7002-7008.Ward, M. P., Gimeno, C. J., Fink, G. R., and Garrett, S. (1995). SOK2 may regulate cyclic AMP-dependent protein kinase-stimulated growth and pseudohyphal development by repressing transcription. Mol Cell Biol 15, 6854-6863.Werner-Washburne, M., Braun, E., Johnston, G. C., and Singer, R. A. (1993). Stationary phase in the yeast Saccharomyces cerevisiae. Microbiol Rev 57, 383-401.Wiemken, A. (1990). Trehalose in yeast, stress protectant rather than reserve carbohydrate. Antonie Van Leeuwenhoek 58, 209-217.Winzeler, E. A., Shoemaker, D. D., Astromoff, A., Liang, H., Anderson, K., Andre, B., Bangham, R., Benito, R., Boeke, J. D., Bussey, H., et al. (1999). Functional characterization of the S. cerevisiae genome by gene deletion and parallel analysis. Science 285, 901-906.Wu, J., Zhang, N., Hayes, A., Panoutsopoulou, K., and Oliver, S. G. (2004). Global analysis of nutrient control of gene expression in Saccharomyces cerevisiae during growth and starvation. Proc Natl Acad Sci U S A 101, 3148-3153.Yoshikawa, K. (2000). Cell cycle regulators in neural stem cells and postmitotic neurons. Neurosci Res 37, 1-14.Young, E. T., Dombek, K. M., Tachibana, C., and Ideker, T. (2003). Multiple pathways are co-regulated by the protein
kinase Snf1 and the transcription factors Adr1 and Cat8. J Biol Chem 278, 26146-26158.
