madison county's economic development plan, 2013
TRANSCRIPT

7/29/2019 Madison County's economic development plan, 2013
http://slidepdf.com/reader/full/madison-countys-economic-development-plan-2013 1/192
Madison Count
Economic Development Strateg
Brookfeld
Canastota
Cazenovia
Chittenango
DeRuyter
Earlville
Eaton
Fenner
Georgetown
Hamilton
Lebanon
Lenox
Lincoln
Madison
Morrisville
Munnsville
Nelson
Oneida
Smithfeld
Stockbridge
Sullivan
Wampsville
D R A F T— November 14, 2012
ONEIDA MOLDED PLAS

7/29/2019 Madison County's economic development plan, 2013
http://slidepdf.com/reader/full/madison-countys-economic-development-plan-2013 2/192
Table of Contents
Executive Summary 3
1.0 Central New York 19
Regional Profile . . . . . . . . . . . . . . . . . . . . . . . . . . . . . . . . . . . . . . . . . . . . . . . . . . . . . . . . . . . . . . . . . . . . . . . 19
Employment Clusters . . . . . . . . . . . . . . . . . . . . . . . . . . . . . . . . . . . . . . . . . . . . . . . . . . . . . . . . . . . . . . . . . . 24Regional Benchmarks . . . . . . . . . . . . . . . . . . . . . . . . . . . . . . . . . . . . . . . . . . . . . . . . . . . . . . . . . . . . . . . . . . 27
Regional Economic Development Plans . . . . . . . . . . . . . . . . . . . . . . . . . . . . . . . . . . . . . . . . . . . . . . . . . . . . 32
2.0 Profile of Madison County 37
Demographic Data . . . . . . . . . . . . . . . . . . . . . . . . . . . . . . . . . . . . . . . . . . . . . . . . . . . . . . . . . . . . . . . . . . . . 39
Economic Data . . . . . . . . . . . . . . . . . . . . . . . . . . . . . . . . . . . . . . . . . . . . . . . . . . . . . . . . . . . . . . . . . . . . . . . 46
Commuting Patterns . . . . . . . . . . . . . . . . . . . . . . . . . . . . . . . . . . . . . . . . . . . . . . . . . . . . . . . . . . . . . . . . . . . 57
Manufacturing . . . . . . . . . . . . . . . . . . . . . . . . . . . . . . . . . . . . . . . . . . . . . . . . . . . . . . . . . . . . . . . . . . . . . . . . 60
Service Sector . . . . . . . . . . . . . . . . . . . . . . . . . . . . . . . . . . . . . . . . . . . . . . . . . . . . . . . . . . . . . . . . . . . . . . . . 63
Retail . . . . . . . . . . . . . . . . . . . . . . . . . . . . . . . . . . . . . . . . . . . . . . . . . . . . . . . . . . . . . . . . . . . . . . . . . . . . . . . 64 Agriculture . . . . . . . . . . . . . . . . . . . . . . . . . . . . . . . . . . . . . . . . . . . . . . . . . . . . . . . . . . . . . . . . . . . . . . . . . . . 66
Tourism . . . . . . . . . . . . . . . . . . . . . . . . . . . . . . . . . . . . . . . . . . . . . . . . . . . . . . . . . . . . . . . . . . . . . . . . . . . . . 71
Higher Education . . . . . . . . . . . . . . . . . . . . . . . . . . . . . . . . . . . . . . . . . . . . . . . . . . . . . . . . . . . . . . . . . . . . . . 73
Community Resources and Services . . . . . . . . . . . . . . . . . . . . . . . . . . . . . . . . . . . . . . . . . . . . . . . . . . . . . . . 77
Economic Development Resources and Major Initiatives . . . . . . . . . . . . . . . . . . . . . . . . . . . . . . . . . . . . . . 96
3.0 Goal and Recommendations 99
A. Governance . . . . . . . . . . . . . . . . . . . . . . . . . . . . . . . . . . . . . . . . . . . . . . . . . . . . . . . . . . . . . . . . . . . . . . 101
B. Infrastructure and Real Estate Development. . . . . . . . . . . . . . . . . . . . . . . . . . . . . . . . . . . . . . . . . . . . . 104
C. Business Retention, Expansion, and Entrepreneurial Development . . . . . . . . . . . . . . . . . . . . . . . . . . . 106D. Business Attraction . . . . . . . . . . . . . . . . . . . . . . . . . . . . . . . . . . . . . . . . . . . . . . . . . . . . . . . . . . . . . . . . 108
E. Manufacturing and Producer Services . . . . . . . . . . . . . . . . . . . . . . . . . . . . . . . . . . . . . . . . . . . . . . . . . . 109
F. Agriculture . . . . . . . . . . . . . . . . . . . . . . . . . . . . . . . . . . . . . . . . . . . . . . . . . . . . . . . . . . . . . . . . . . . . . . . 110
G. Retail and Tourism . . . . . . . . . . . . . . . . . . . . . . . . . . . . . . . . . . . . . . . . . . . . . . . . . . . . . . . . . . . . . . . . . 112
H. Energy . . . . . . . . . . . . . . . . . . . . . . . . . . . . . . . . . . . . . . . . . . . . . . . . . . . . . . . . . . . . . . . . . . . . . . . . . . 114
I. Education and Workforce Training . . . . . . . . . . . . . . . . . . . . . . . . . . . . . . . . . . . . . . . . . . . . . . . . . . . . 115
4.0 Appendix 117
A. Central New York Data Profile . . . . . . . . . . . . . . . . . . . . . . . . . . . . . . . . . . . . . . . . . . . . . . . . . . . . . . 117
B. International Monetary Fund—World Economic Outlook Update . . . . . . . . . . . . . . . . . . . . . . . . . . . 139C. NYS Comptroller Economic Trends in New York State . . . . . . . . . . . . . . . . . . . . . . . . . . . . . . . . . . . 147
D. Consultant Roundtable Report— Ask the Experts . . . . . . . . . . . . . . . . . . . . . . . . . . . . . . . . . . . . . . . 153

7/29/2019 Madison County's economic development plan, 2013
http://slidepdf.com/reader/full/madison-countys-economic-development-plan-2013 3/192
THE PURPOSE OF A LOCAL ECONOMIC DEVELOPMENT STRATEGY
An economic development strategy provides a community with a clear understanding of their current economic
situation, identies potential opportunities as well as challenges for economic growth, and denes the efforts
required to achieve specic goals. A strategy is typically established for a ten to twenty year horizon and addresses
the multiple facets of economic development at the local level including organizational structure, resource develop-
ment and allocation (provision of basic public services, supply of qualied labor, capacity and accessibility of reli-
able utilities, availability of land and buildings, capital resources, favorable tax and regulatory policy, etc.), and the
growth of specic target industries that will produce jobs and new wealth for the community.
An important part of the strategy is to promote a broad range of economic initiatives that not only help strengthen
existing businesses, but also help to diversify the employment base through the start-up of new companies and the
attraction of businesses to the area. Since the employment levels of any given company never stay constant, it is
important to continually support expansion of the local economy with new opportunities. This approach helps insure
jobs for the next generation seeking employment in the community.
To carry out this economic development mission, considerable attention must be paid to forces in the marketplace
that will affect the likely success of any particular economic development initiative. In today’s global economy,
these forces operate on the international, national, regional, and local levels. Compounding the challenge is the need
to pay close attention to the broad range of employers in a community, from the traditional large scale manufactur -
ing rm to the entrepreneurial start-up with plans to introduce a new niche product or service into the marketplace.
Attention must also be focused on key industry sectors in a community such as advanced manufacturing, profes-sional and business services, agriculture, and tourism. In addition, the large institutional employers in a community
such as colleges and universities, hospitals, and utility providers must be recognized. These institutions serve as
major economic engines with their own set of resource needs and associated economic development opportunities.
When preparing an economic development strategy for a community it is important to start with a common
understanding that the public sector has traditionally provided services to support business and commerce at the
local level. These services cover a broad range of activities including governance, public safety, roads, sewer and
water, education, recreation, solid waste management, environmental and public health protection, and the overall
advancement of the common welfare. Maintaining the delivery of these vital public services in an affordable and
efcient manner must be the starting point for any concerted effort to support the growth of a local economy. Build-ing on these resources, attention can then be focused on the tools available in the public sector that can support job
retention and creation in a market system based upon the concept of free enterprise. In today’s competitive world,
the application and use of these tools often requires an entrepreneurial and proactive approach at the government
level.
Madison County Economic Development Strategy Pag
Executive Summar
Draft —November 14,

7/29/2019 Madison County's economic development plan, 2013
http://slidepdf.com/reader/full/madison-countys-economic-development-plan-2013 4/192
THE PROCESS USED TO DEVELOP THE STRATEGY
Preparation of the Madison County Economic Development Strategy was initiated by the Madison County Board
of Supervisors in 2010 under the direction of the Planning, Economic Development, Environmental, and Inter -
governmental Affairs Committee and a Steering Committee formed by the Chairman of the Board of Supervisors.
Interest on the Steering Committee included representatives from the County Legislative Planning Committee, the
Madison County Industrial Development Agency, the Madison County Department of Planning, Madison County’s
Ofce of Workforce Development, Madison County’s Department of Health, City of Oneida Department of Plan-
ning and Development, Cornell Cooperative Extension of Madison County, Madison County Tourism Ofce, and
the CNY Regional Planning and Development Board.
The development of the strategy was based in part on a process that built upon a very thorough gathering of facts
about the state of the local economy. This information was supplemented by input obtained from local and outside
experts representing a broad range of industry sectors. In addition, reference was made to several related planning
documents including work that was recently completed by the CNY Regional Economic Development Council on a
ve-year strategic economic development plan. At the conclusion of this background work, the Steering Committee
formulated a goal and a broad set of recommendations. In formulating these recommendations, specic emphasis
was placed on steps that can be taken by the County, working in conjunction with various departments and afliated
organizations, to support economic growth in the community. This work has been summarized into a draft report
titled the Madison County Economic Development Strategy. The draft strategy will be nalized and presented to
the Madison County Legislative Planning Committee for review and approval. At the conclusion of this process,
the Legislative Planning Committee will present the strategy to the Madison County Board of Supervisors for nal
approval. The current schedule is to have this process completed by December 2012.
OVERVIEW OF THE ECONOMY AND MADISON COUNTY PROFILE
A review of the information presented in this report shows that the preparation of an economic development
strategy must be carefully calibrated to account for developments which are occurring on an international, national,
and regional level. As noted in a World Economic Outlook Update issued by the International Monetary Fund in July
2012, “In the past three months, the global recovery, which was not strong to start with, has shown signs of further
weakness. Financial market and sovereign stress in the euro area periphery have ratcheted up, close to end-2011
levels. Growth in a number of major emerging market economies has been lower than forecast. Partly because of a
somewhat better-than-expected rst quarter, the revised baseline projections in this WEO Update suggest that these
developments will only result in a minor setback to the global outlook, with global growth at 3.5 percent in 2012 and
3.9 percent in 2013, marginally lower than in the April 2012 World Economic Outlook. These forecasts, however,
are predicated on two important assumptions: that there will be sufcient policy action to allow nancial condi-
tions in the euro area periphery to ease gradually and that recent policy easing in emerging market economies will
gain insufcient policy action. In Europe, the measures announced at the European Union (EU) leaders’ summit in
June are steps in the right direction. The very recent, renewed deterioration of sovereign debt markets underscores
that timely implementation of these measures, together will further progress on banking and scal union, must be a
priority. In the United States, avoiding the scal cliff, promptly raising the dent ceiling, and developing a medium-
term scal plan are of the essence. In emerging market economies, policymakers should be ready to cope with trade
declines and the high volatility of capital ows”
Madison County Economic Development StrategyPage 4 Madison County Strategic Economic Development PlanPage 4

7/29/2019 Madison County's economic development plan, 2013
http://slidepdf.com/reader/full/madison-countys-economic-development-plan-2013 5/192
Supplementing this information is an overview of the current condition of the NYS economy as provided by the
NYS Comptroller’s ofce in May 2012. This report noted that New York’s Gross State Product (GSP) rebounded
strongly after the recession, with the rate of growth exceeding the nationwide increase and ranking second among
the 50 states in both 2010 and 2011. However, New York’s rate of growth eased from 5.1% in 2010 to an estimated
3.8% in 2011, and IHS Global Insight forecasts that the State’s GSP will slow to 2.6% in 2012. The report also noted
that between December 2009 and April 2012, NYS has regained 312,700 jobs, nearly 95% of the jobs lost during the
recession, and that New York has added more private sector jobs (335,900) during the recovery than it lost during
the recession, but these gains have been offset by 23,200 jobs lost in the government sector.
Regarding employment, it was noted that job growth has been uneven across that State and the unemployment
rate exceeded the Statewide rate of 8.5% in more than half of New York’s counties (33 of 62), including eight coun-
ties in which the rate was 10% or greater.
In a previous report issued by the Comptroller in October 2010, it was noted that the State’s population is pro-
jected to increase from 18.5 million in 2010 to 20.5 million over the next ten years, with most of the State’s popula-
tion growth occurring in the NYC metropolitan area.
Looking more closely on a regional and local level, data presented documents that the population base in Cen-
tral New York and Madison County has stabilized in recent years following a sharp decline that took place from
1985–1995. In looking at these gures, it is important to note that the area’s population is now at the highest level
is has ever been in the history of this region growing from a total of 572,408 in 1950 to 791,939 in 2010 and cor -
respondingly the region’s labor force totals over 394,600 workers. While CNY is clearly not experiencing the level
of population growth as other parts of the country, the fact the population base has stabilized and the labor force
remains strong is important to the region’s effort to retain existing businesses in the area and attract new companies
to Central New York. This point is particularly noteworthy since there is very little that can be done on a public
policy basis at the local level to inuence what is generally considered a long term trend in a community that is
directed by economic forces at play in the marketplace.
Other demographic factors that were reviewed for the region show that the area’s per capita income of $36,833
is comparable with similar sized metropolitan areas and has increased in recent years in a manner that is consistent
with general trends across the State and nation. This increase suggests that the area’s economy has been able to sup-
port salary increases at a time when economic forces continue to create a great deal of turmoil in the marketplace.
One area of real concern in looking at the demographic data is the aging of the region’s population base. One of the
factors contributing to this dynamic is the lack of signicant population growth in the area. Again this issue is very
difcult to address at the local level but suggests that efforts to support a strong employee retraining program and
resident retention and recruitment program are needed to address a possible workforce shortage in Madison County.
Education data clearly suggests that the Madison County is in a strong position to provide the educated work -
force needed by employers today and decisions at the State and local level to expend signicant resources on public
education continues to pay dividends for many communities across Upstate New York. At the local level, these divi-
dends are reected in the graduation rates, test scores, and higher education career plans of students graduating from
the many K–12 programs in Madison County. Regionally, much attention is given to the institutions of higher educa-
tion in Upstate New York which currently number over 44 with a student population of more than 215,000. These
Madison County Economic Development Strategy PagMadison County Strategic Economic Development Plan Pag

7/29/2019 Madison County's economic development plan, 2013
http://slidepdf.com/reader/full/madison-countys-economic-development-plan-2013 6/192
colleges and universities are economic engines for many communities in Upstate New York given their employment
levels and provide the career training demanded by businesses in the marketplace today.
On the economic front much has been made in recent years about the diversity of the region’s economy which
has proven to be a real benet to the area as residents struggle with the nation’s current economic recession. In
December 2010, it was estimated there are 320,100 jobs in CNY, including 262,700 (81.8%) in the private sector
with 40,000 in goods-producing and 280,100 in service-producing jobs. In reviewing this data, it is important to
note that this economic diversity is consistent with similar patterns taking place in many parts of the country and
is a reection of a natural shift in the nation’s economy and not the result of some major public policy initiatives
which have been implemented at the federal, state or local level. A closer look at the data by industry sector shows
that this area’s decline in manufacturing is very similar to data shown for NYS and the nation, and the growth in
the service sector reects a similar pattern. Despite the decline in manufacturing there are still over 28,000 jobs in
manufacturing in the region which generate a payroll of more than $1.7 billion, suggesting that this industry sector is
worth signicant public policy support in the years ahead. In reviewing this information, it is important to note that
while there has been a general decline in manufacturing in recent years, there has also been a signicant increase in
employment in the region in professional/business services (34,600 jobs), education services (21,400 jobs), and in
health care (42,200 jobs). Interestingly, public employment outside of education is shown to have declined 18.4%
over the past 20 years from 28,200 in 1990 to 26,000 in 2000, and 23,000 in 2010.
With regard to the CNY labor force it is important to note that the region’s labor force has remained very stable
over the past 30 years uctuating from 350,000 in 1980 to a high of over 391,000 in 2010. Data for this labor force
clearly shows that wage rates in the region are very competitive with labor costs across the country and oftentimes
signicantly less when compared with large metropolitan areas in the nation. Industry sectors paying the highest
wages in CNY include manufacturing ($56,000), professional and technical services ($55,000), nance and insur -
ance ($55,000), and wholesale trade ($54,000). Regarding unionization of the labor force, overall approximately
23% of the workforce is unionized. However, it is important to note that most of the unionized workforce is in
public employment and the utility sector and only 12% of private employers are unionized.
In addition to the information that can be gleaned from the data are the opportunities presented by trying to capi-
talize on the list of major employers in CNY which include such prominent names as Cornell University, Syracuse
University, SUNY Upstate Medical University, Wegmans, Lockheed Martin, Constellation Energy Group, the Hart-
ford Financial Group, Welch Allyn, Verizon, Syracuse Research Corporation, Bank of America, Excellus BC/BS,
Anheuser Bush, Air Force Research Lab, Cooper Crouse Hinds, Nucor Steel, Bristol-Myers Squibb, Novelis, Pall
Trinity Micro, MONY Group, Marietta Industries.
Complementing these companies are the opportunities presented by the existence of several major employment
clusters in Central New York. These clusters include biomedical, logistics and distribution, electronics, industrial
machinery, materials processing, forest products, food processing, education and health care service.
Supporting the economic base of the area is a large commitment of public resources to a strong network of trans-
portation assets in the region including major interstate highways, state routes, county and local roads, a regional
commercial airport, and a port. Supplementing these public assets are numerous public water and sanitary sewer
systems, public safety services, and various recreational assets. Many of these systems are developed and maintained
at great expense for the benet of private enterprise by State, county and municipal governments across Central New
Madison County Economic Development StrategyPage 6 Madison County Strategic Economic Development PlanPage 6

7/29/2019 Madison County's economic development plan, 2013
http://slidepdf.com/reader/full/madison-countys-economic-development-plan-2013 7/192
York. Also noteworthy is the extensive electric and natural gas supply systems that have been deployed across the
area by major private utility companies and the NYS Power Authority. While the region’s energy supply is fairly
robust and of sufcient quantity to meet anticipated demand, the cost of these energy resources are very high and
oftentimes uncompetitive in the marketplace. It is important to note that the increasing demand for energy downstate
and the desire to generate alternative renewable energy resources may create additional opportunities for energy
production facilities in Upstate New York, particularly if a number of bottlenecks in the electric power distribution
grid system can be addressed. Complementing these public resources is an extensive professional business service
and banking network that exists in Central New York. This network provides a very robust and competitive array of
services and nancial resources to support economic growth in the region.
Regarding governance, information was presented which demonstrates the challenges facing government today
to provide vitally needed public services and infrastructure while at the same time controlling costs. Data presented
by the Tax Foundation shows that NYS is uncompetitive with other states when it comes to overall tax expenditures.
These costs present a very challenging situation to the region’s business community and often undermines efforts to
attract and retain companies at the local level. A closer look at the data shows that local government expenditures
in Central New York have increased approximately 3% per year over the past ten years. Much of these increases in
expenditures can be attributed to State policies regarding the sharing of certain social service cost’s with local gov-
ernment and mandated retirement benets without appropriate levels of employee contributions.
To put all of this data in perspective, information was gathered from two research companies that compare
regional economies using a broad spectrum of factors to measure the economic vitality of an area. This regional
benchmarking analysis showed that Central New York is in a fairly competitive position ranking 162 out of 366
metropolitan areas in the nation in one study and 80 out of 366 metropolitan areas in another study. Each of these
studies presented information showing that the region’s economy has improved fairly dramatically over the past ten
years when compared to other communities across the nation.
Looking more closely at county-level data revealed that in recent years Madison County’s population grew morethan other counties in Central New York and currently stands at a total population base of 73,442, which is the high-
est level in history. Financially the per capita income in the County increased 32% over the past ten years and was
estimated to equal $33,113 in 2009. Overall, the median age in the County is 39.8. On the education front, of the
County’s population 25 years old and over, 16,962 residents are high school graduates, 5,551 have an associates’
degree, 6,476 have obtained bachelor’s degrees, and 3,637 have gone on to obtain their graduate or professional
degree.
Economically, Madison County has a very diverse employment base with over 25,000 jobs distributed across a
broad spectrum of industry classications. In reviewing these gures it is important to note that the top ten employ-
ers in the County employ over 18,841 people; these employers cross a broad industry spectrum from manufacturing,
to education, and health care. Major employers include Colgate University (855), Oneida Health Care (786), Mor -
risville State College (450), Ferris Industries (410), Esco Turbine Technology (370), Community Memorial (305),
Marquardt Switches (294), Dielectric Laboratories (223), ARC (210), and GHD (150). Each of these companies and/
or institutions of higher education or health care play a very signicant role in the County’s economy in terms of
employment, net wealth generating activity, and investment in the community.
Madison County Economic Development Strategy PagMadison County Strategic Economic Development Plan Pag

7/29/2019 Madison County's economic development plan, 2013
http://slidepdf.com/reader/full/madison-countys-economic-development-plan-2013 8/192
In addition to this group of large employers, there are over 1,400 other business establishments in the County
of which a large majority employ fewer than 50 people. In fact, over 89% of the County’s business establishments
employ four or fewer individuals and the nonemployer/sole proprietorships outnumber wage-paying employers by
almost 3:1. Taken together these large and small employers generate an annual payroll of over $703 million with an
average wage of $33,586. Included in this total are 65 manufacturing establishments with a payroll of $107 million.
Targeting services to this mix of a few large and many small employers in the County is a tremendous challenge to
business leaders and government ofcials today.
With respect to agriculture there are approximately 744 farms in operation in Madison County with an average
sized farm of 253 acres. The total value of products sold by these farming establishments is $86 million. Seventy-
two% of these sales were for dairy products. Total farm employment is estimated to be less than 1,000 or less than
2.5% of the total county workforce and account for less than 1% of all wages paid in the County. Tourism numbers
demonstrated the importance of this sector to the area’s economy with estimates of $70 million in visitor spending,
over 1,600 employees, and $4.5 million in sales tax revenue to the County. In a related category, information sug-
gests that the County is losing some retail spending to neighboring counties. While not signicant, the estimated loss
of $43 million in sales and $1.7 million in sales tax revenue annually suggest that new retail business opportunities
should be developed in the County to capture these expenditures.
In reviewing workforce data for Madison County, it is important to note that over 10,290 (32.4 % of workforce)
County residents currently commute to Onondaga County and 3,715 to Oneida County for work. Persons are com-
muting for work in many industry sectors including manufacturing, wholesale and retail trade, nance and insur -
ance, and various professional service and heath care jobs. This workforce represents a potential source of new
employees for existing businesses located in the County or new companies attracted to the community. To capture
this resource, some attention will have to be given by area employers to the wages paid in Madison County, which
are often below neighboring counties. Information regarding municipal governance and services suggest that Madi-
son County is operating very efciently with a per capita tax expenditure rate of $1,491—one of the lowest rates
in NYS. Excluding local school districts, public employment at the local level has declined over the past ten years.
Key services provided at the State and local level include an extensive road transportation system, public safety, a
network of business parks, recreational assets, and a strong public school system with competitive graduation rates
and reasonable costs. Complementing these services are various natural resources which are available to support
tourism and alternative energy development in the County. These resources include extensive woodland biomass,
wind energy, and water.
GOAL AND RECOMMENDATIONS
Every healthy economy is comprised of three levels of employers. The most signicant employers are the netwealth generators for a community and consist of the primary industries that not only provide local jobs but also
infuse new money into a local economy through the sale of a product and/or service outside of the area. The next
level of employers provide business support services for the primary industries. At the third level are employers
providing consumer retail services to support the daily activities of local residents. It is important for an economy
to have a diverse primary industry base that is supported by a network of smaller rms, which together generate
sufcient wealth for the community to function as a modern day economy capable of meeting the basic needs of its
Madison County Economic Development StrategyPage 8 Madison County Strategic Economic Development PlanPage 8

7/29/2019 Madison County's economic development plan, 2013
http://slidepdf.com/reader/full/madison-countys-economic-development-plan-2013 9/192
citizens. In accessing these resources, it is important for local ofcials to acknowledge that every business, prod-
uct, and service ultimately goes through a life cycle that may be measured in today’s economy in months, years, or
decades due to competition in the marketplace. At times, companies grow and become very successful only to be
bought out by a larger rm, or the cost of production increases to a point that a company must move its operations to
another locale to remain competitive. Essentially, no business can guarantee a community that it will be able to stay
in operation forever, and communities must adapt to the constant ebb and ow of companies in and out of the local
economy.
It is against this backdrop that the Steering Committee analyzed the local economy and formulated the following
over-arching goal: Madison County must direct its efforts to the growth of a diverse economic base that will
provide employment opportunities for a broad cross section of its citizens across the entire county. In keeping
with this goal, the Steering Committee offered a series of recommendations to focus attention on several key areas
including governance, business retention and expansion, business attraction, infrastructure and real estate develop-
ment, manufacturing and the producer service industry, agriculture, retail and tourism, alternative energy develop-
ment, and employee training and workforce development.
In developing an economic development strategy, it is important to acknowledge the important role played by
local units of government to ensure that traditional public services are provided on a daily basis to business and
residents across a community. In Madison County these services are provided, in part, through a formal legislative
structure and professional County administrative ofce. Through these ofces, the County has been able to maintain
a complex road network and maintenance function, an effective public safety system and emergency communica-
tion service, a comprehensive solid waste system, records management, a range of public health and social welfare
services, and an efcient tax collection system. As noted in the statistics, these services are provided very efciently
by the County with a per capita tax expenditure rate of $1,491—one of the lowest rates in NYS. Complementing this
work are the services provided at the State and local government level across Madison County. Key components of
these services include additional highway and road maintenance activities, the provision of public water and sewer
services, additional public safety personnel, public education, land use controls, environmental protection, and
public recreation resources. To build on this strong foundation, the Steering Committee recommends the following
action points:
● Maintain a strong foundation for management and delivery of government services at the County
and local government level
● Maintain an appropriate County legislative committee system to provide proper oversight and sup-
port for planning and economic development efforts in the County
● Establish an Economic Development Leadership Council at the County level with representation
from business, government, and higher education
● Support efforts to address concerns regarding the costs of State mandated services and energy costs
in NYS
● Maintain a County-supported ofce of economic development with appropriate professional and
support staff
Madison County Economic Development Strategy PagMadison County Strategic Economic Development Plan Pag

7/29/2019 Madison County's economic development plan, 2013
http://slidepdf.com/reader/full/madison-countys-economic-development-plan-2013 10/192
● Establish an institutional framework to identify organizational responsibility for completing various
economic development projects in the County
● Investigate opportunities to standardize County and municipal forms and applications for per-
mitting, zoning, and building code applications and for making these available on the County
website
● Maintain a County-wide infrastructure resource data base with current information about the size,
capacity, and condition of road, sewer, water, solid waste, electric and gas, and a telecommunica-
tion systems operating in the County
● Undertake a coordinated effort to use municipal controls to protect major development sites from
encroachment of competing uses—i.e. residential and commercial
The provision of public infrastructure is one of the most vital services that can be provided to the business com-
munity in Madison County. The principal issues of concern to businesses in this area are access and proximity to
markets and sources of supply, either physically through transportation networks or remotely though the telecom-
munications network; the cost, convenience and reliability of access; and the availability of sufcient land or built
space to accommodate business needs at present and in the near future. A signicant number of recommendations
have been developed by the Steering Committee that the County can undertake to help ensure the area’s infrastruc-
ture resources meet the needs of a 21st century economy. Key recommendations on this list include:
● Develop a comprehensive inventory of public infrastructure and major real estate resources in the
County, including an assessment of browneld development opportunities
● Develop a coordinated capital improvement plan for major State, County, and municipal infrastruc-
ture that supports economic growth in the County
● Complete development of a modern 911 emergency communication that is coordinated with deploy-
ment of a County-wide telecommunication system
● Continue development and maintenance of a County-based solid waste management system
● Continue efforts to development the Madison County Agriculture and Renewable Energy Park
● Investigate the feasibility of establishing a county-based central heat and power plant at the County
campus in Wampsville to create demand for biomass resources in the County
● Develop an inventory of major parcels of vacant land in the County and perform regular assess-
ment of development potential of these parcels for many uses including a major retail outlet center,
warehouse/distribution facility, a hotel/conference center, and senior citizen community
● Develop virtual building concept plans and pre-permitting at key business park/development sites in
the County
In addition to the provision of general government services, it is important to note in today’s economic climate
that many counties across the nation have formed dedicated economic development functions with full-time profes-
sional staff with responsibility for providing a range of services to support economic growth. The Madison County
Industrial Development Agency (MCIDA) is the designated economic development agency for the County. The
MCIDA is a public benet corporation established under the provisions of NYS law with the authority to issue
Madison County Economic Development StrategyPage 10 Madison County Strategic Economic Development PlanPage 10
7/29/2019 Madison County's economic development plan, 2013
http://slidepdf.com/reader/full/madison-countys-economic-development-plan-2013 11/192
taxable and tax-exempt bond nancing, elimination of sales tax on materials and equipment used for manufacturing,
and the establishment of payment-in-lieu-of-tax agreements for the management of real property taxes and the elimi-
nation of mortgage recording taxes. The MCIDA is staffed by three full-time positions and has ofces in the Village
of Canastota. Capitalizing on the strength of this economic development ofce, the Steering Committee recommends
a number of high priority initiatives be undertaken to support the work of the MCIDA including:
● Represent the Madison County Center for Economic Development whenever addressing economic
development efforts associated with Madison County
● Maintain a County-supported ofce of economic development with appropriate professional and
support staff
● Maintain a comprehensive economic development strategy for the County
● Organize outreach meetings with municipal ofcials to familiarize these ofcials with the County’s
economic development programs
● Develop a plan and allocation of staff resources to maintain the County’s economic development
website
● Convene workshops of industry experts; develop a local “economic expert” roundtable to regularly
review economic status, resources and opportunities for economic development
● Convene an annual meeting of the MCIDA ofce of economic development with the Board of Super -
visors and invited guests
● Coordinate a formal outreach program and education initiative to area chambers of commerce, i.e.
quarterly/semi-annual meetings
● Regularly evaluate IDA incentive programs and loan fund objectives to ensure they align
with evolving economic development objectives, community needs, and competition in the
marketplace
Beyond these organizational initiatives, a great deal of attention is paid today to work that can be done at the
County level to support economic growth through an organized business retention and expansion program. While
often undervalued as a strategy for economic development, business retention and expansion (BR&E) is neverthe-
less among the most common elements of a comprehensive economic development program. According to the
International Economic Development Council (IEDC), two-thirds of all economic development organizations in the
nation have BR&E programs, while less than half have business attraction programs.
There is a common adage in economic development that it is far easier to retain an existing employer than to
recruit a new one. In fact, research has shown that most new jobs are created by existing businesses in a commu-
nity rather than those relocating from elsewhere. In today’s global marketplace, with industries rapidly consolidat-
ing and economic developers competing to lure new companies to their communities, business retention is even
more important as part of an economic development strategy. Business retention and expansion programs typically
include a wide variety of activities undertaken to retain and facilitate the growth of local businesses. The “tools”
used in BR&E are many of the same items found in the recruitment toolbox: nancial assistance, workforce training,
information on available sites or buildings, assistance with permitting and licensing, export/procurement assistance,
Madison County Economic Development Strategy PageMadison County Strategic Economic Development Plan Page

7/29/2019 Madison County's economic development plan, 2013
http://slidepdf.com/reader/full/madison-countys-economic-development-plan-2013 12/192
and so on. In some cases, the economic development organization (EDO) can provide services directly; in other
instances, the EDO serves as a broker between the company and the source(s) of the assistance.
Because the services provided are based on the needs of the customer, BR&E depends heavily on a customer
service orientation. Successful BR&E must begin with an effective outreach program to assess the needs, priorities,
and concerns of individual businesses in cooperation with company owners and managers.
Based upon an analysis of numerous BR&E programs across the country and a review of the available staff resources and work that is being done by the MCIDA, the Steering Committee suggest that specic attention be
given immediately to the following recommendations:
● Convene workshops of local “economic experts” to review issues, resources, and opportunities for
economic development in the County
● Establish a formal business outreach program in the County that coordinates the delivery of ser-
vices provided by various agencies to the small business community
● Conduct formal outreach to various business service providers such as bankers, lawyers, and
accountants to identify business development opportunities and needs in the County ● Complete a detailed inventory and contact list for major development projects/business opportuni-
ties in Upstate New York—Fort Drum, Albany Nanotech, Global Foundries, Turning Stone that may
represent business development opportunities for local companies
● Support entrepreneurial initiatives and business networking forums at area colleges
● Support regional and statewide efforts to foster formal relationships with venture capital providers
and angel investors to support entrepreneurial development in the County
● Maintain a competitive business incentive and small business loan program at the County
level
While a comprehensive business retention and expansion program must be a cornerstone to the County’s eco-
nomic development program, data provided by various site location experts suggest that resources should also be
directed to a targeted business recruitment program. In trying to recruit a company to a community, ofcials must
have some understanding of the global stress factors that are impacting companies today and how these factors
may inuence a company’s decision to expand or relocate their operations to a new community. In reviewing these
factors, considerable attention must be focused on high-growth industries and the potential to capitalize on certain
industry clusters which exist in Central New York. In addition, the County must recognize that the site selection pro-
cess typically begins on an international or national level today, transitions into a regional and state search, before
nally focusing on a set of recommendations regarding potential host communities. While surprising to many, thesite selection process is often characterized as a process of elimination that places a premium on communities being
“ready-for-development” long before prospect interest is ever known to a community. Given Madison County’s
location between the Syracuse and Utica/Rome metropolitan areas, the strong population and labor force base in the
region, and the availability of a well developed infrastructure system, the Steering Committee recommends that a
carefully structured business recruitment program be continued in the County with an initial focus on the following
initiatives:
Madison County Economic Development StrategyPage 12 Madison County Strategic Economic Development PlanPage 12

7/29/2019 Madison County's economic development plan, 2013
http://slidepdf.com/reader/full/madison-countys-economic-development-plan-2013 13/192
● Develop a target industry business recruitment plan based in part on certain industry sectors
and employment clusters that currently exist in CNY, including renewable energy, medical instru-
ments, food processors, information/nancial back ofce services, pharmaceuticals, warehouse/
distribution
● Capitalize on proximity to major food processors based in NYS to promote the County as a viable
location for food processing facilities
● Pursue opportunities for back ofce operations looking to expand/relocate from major metropolitan
in the Northeast
● Pursue foreign investment opportunities through existing industry contacts in County
● Undertake a coordinated outreach campaign to college alumni through advertisements in alumni
magazines if nancially viable to undertake
● Develop and maintain relationship with key site selectors that serve key industry sectors appropri-
ate for growth in the County
● Encourage a regional effort to inventory major companies with operating facilities in small town/
rural locations in other parts of the country—target these companies for marketing
Most of the activities that can be undertaken to support the manufacturing and producer service industry are typi-
cally addressed in a comprehensive business retention and expansion program. However, the signicance of these
two sectors to any local economy deserves careful consideration and attention by the local economic development
staff. This observation is certainly relevant in Madison County where manufacturing still holds an important position
in the County’s employment base and serves as a signicant generator of new wealth for the community through the
sale of products onto a regional, national, and international marketplace. Likewise, the producer service industry is
another important economic component to the County led by the location of three institutions of higher education
in the community along with several professional business establishments, and a number of important health care
providers. To capitalize on these resources the Steering Committee recommends:
● Continue efforts to develop a meat processing facility to assist local dairy and beef farmers
● Capitalize on opportunities to develop relationships with major food processors in the
Northeast
● Seek to identify supplier network opportunities to serve local manufacturing companies
● Complete a detailed on-line inventory of major vocational and technical training programs avail-
able to serve area industry needs
● Pursue relationship with plant mangers
● Support efforts by CenterState CEO’s Project ION, an internship outreach program for companies
in CNY
In addition to these two major industrial sectors, information gathered in this strategy suggests that the County
should continue to focus attention on several other sectors in the local economy including agriculture, retail, and
tourism. While each of these sectors plays a relatively small role in the overall structure of the County’s economy,
Madison County Economic Development Strategy PageMadison County Strategic Economic Development Plan Page

7/29/2019 Madison County's economic development plan, 2013
http://slidepdf.com/reader/full/madison-countys-economic-development-plan-2013 14/192
their importance to certain segments of the local community and potential to generate or retain wealth in the area
warrants consideration.
In considering these other economic sectors, agriculture drew a signicant amount of attention from the Steer -
ing Committee as work was done on the overall goal and recommendations for the County. As noted in the strategy,
agriculture is a relatively small part of the County’s overall economy in terms of employment, wages, and the value
of economic output. However, the rural nature of much of Madison County forms an important part of the County’s
image and is a distinct consideration when assessing the quality of life in the County. Moreover, the potential for
additional economic development stemming from changing demographic taste and product demands on a national
and regional level offer some promising opportunities for area farmers and food processors in the community. To
capitalize on some of these opportunities, the Steering Committee considered a long list of initiatives some of which
are highlighted in the following recommendations:
● Maintain an Agriculture Economic Development staff position at the County level
● Develop a detailed inventory of farm resources, products, and services and place on-line
● Inventory major agriculture initiatives and commercial enterprise developments on a regional basis
to identify agriculture supply side opportunities in the County
● Secure funds to support alternative crop / niche value-added product development
● Pursue business development opportunities in major metro area food centers with a focus on niche
agriculture products produced in the County
● Promote niche products for major markets such as NYC
● Complete a detailed inventory of natural resources and under-utilized land inventory in the County
as basis for alternative crop production
● Develop a program to help capitalize on the value of under-utilized and marginal land resources in
the County
While the retail sector is not known for creating high paying jobs generally, it is a major source of entry level and
part-time job opportunities. The retail sector can also play a large role in improving the quality of life in communi-
ties as part of a revival of main streets in smaller towns and cities and by the improvement in the convenience of
needed products and services in more rural areas. When evaluating information regarding this sector of the economy,
it is important to note several national trends which may affect the retail business opportunities in Madison County.
These trends include a general down-sizing and closing of unprotable large chain retailers, a shift in buying pat-
terns to discount destinations to replace lifestyle centers, a more cautious approach to spending among some ele-
ments of the “millennial generation”, and a continuing migration of retail sales to the internet.
Information regarding the retail sector in Madison County suggest that there may be opportunities to create
additional jobs and capture sales revenue that is currently being lost to neighboring areas in Onondaga and Oneida
Counties. This “retail leakage” is estimated at $41 million per year. If the retail opportunities represented by this
outow of dollars were directed to certain communities and areas in the County, additional community benets
could be realized from this employment sector. Based on these factors, the Steering Committee suggests that a very
Madison County Economic Development StrategyPage 14 Madison County Strategic Economic Development PlanPage 14

7/29/2019 Madison County's economic development plan, 2013
http://slidepdf.com/reader/full/madison-countys-economic-development-plan-2013 15/192
targeted approach be undertaken to help support the growth of the retail sector in Madison County and recommends
the following action:
● Complete a detailed “Buxton” study of retail leakage and opportunities in major retail centers in
the County—City of Oneida and villages/hamlets across the County
● Investigate the feasibility of establishing an ofce of “Main Street” coordinator to support retail
development in selected villages and hamlets in the County
● Establish a micro-lending program to support niche market retail opportunities in selected commu-
nity centers /main streets
● Inventory resources available from the National Main Street program and market these services to
communities and businesses in the County
● Identify key under-utilized and vacant property/buildings in retail centers across the County and
target for redevelopment
● Coordinate main street activities with various college and university initiatives and development
opportunities
● Investigate the feasibility of establishing a major discount outlet center at Thruway exit 34 in
Canastota
● Investigate the economic impact and opportunities for attracting a destination retail center to the
County
● Implement a “Buy Local” marketing program in the County
In many communities across the nation, tourism has become recognized as an important component of an area’s
economy and an economic sector that can benet directly from concerted actions taken at the local level. In view-
ing this sector it is important to note that data shows that tourism visitor spending in NYS exceeded $14.9 billion
in 2008. On a regional level, approximately $1.76 billion of this visitor spending took place in the Central Leather -
stocking region and $2.67 billion was spent in the Finger Lakes region. This spending is estimated to support more
than 1,600 jobs in the area. In reviewing these gures it is important to note that tourism acts much like a net wealth
generating industry by attracting dollars from outside the community and stimulating development of retail and ser -
vice businesses. To capitalize on this business opportunity, the Steering Committee recommends continued operation
and funding for the Madison County Tourism Development Ofce (MCTDO) and that the MCTDO and its partners
undertake the following actions:
● Complete a comprehensive inventory of major tourist attractions and resources in the County with
data measuring levels of activity, attendance, and economic impact
● Develop a capital improvement plan for major tourism assets and resources in the County
● Develop an updated plan for the effective promotion, marketing, and funding of various recreation,
cultural, and heritage sites in the County
● Utilize the strategic plan to complete an update of the County’s tourism website and market the
website through the use of various social media outlets
Madison County Economic Development Strategy PageMadison County Strategic Economic Development Plan Page

7/29/2019 Madison County's economic development plan, 2013
http://slidepdf.com/reader/full/madison-countys-economic-development-plan-2013 16/192
● Closely integrate the County’s tourism marketing activities with other regional assets and
attractions
● Improve the appearance and maintenance of visitor gateways to the County
● Pursue strategically located and coordinated development of a hotel/conference center with pos-
sible association with a hops/culinary/equine institute
● Establish micro-lending program to support tourism related business development in selected com-
munities across the County
In recent years the development of an alternative energy industry in the United States has received increased
attention by public policy makers on a federal and state level. The impacts of climate change and the need to
increase energy efciency, reduce reliance on foreign oil, and address related international security threats are some
of the issues driving the need for a national energy policy and practice. These public policy changes have created
opportunities in the marketplace that can be used by communities to help create additional job opportunities on the
local level. In viewing these opportunities it is important to recognize that alternative energy is not a separate indus-
try sector in a local economy and development of alternative energy resources can incorporate a broad cross-section
of several industrial sectors including utilities, manufacturing, professional services, construction, and agriculture.
Based upon developments in the marketplace and a preliminary assessment of the County’s natural resources, the
Steering Committee suggests the following recommendations regarding alternative energy development:
● Undertake a coordinated effort to develop institutionally-based central heat and power plants in the
County to expand the market demand for biomass resources in the area
● Undertake community-based alternative energy initiatives at ARE Park—i.e. wind farm, central
heat and power plant, micro-hydro, and solar
● Monitor research and demonstration projects promoted by organizations such as SUNY-ESF, U.S.
DOE National Renewable Energy Laboratory, Biomass Energy Research Center, Morrisville Col -
lege (renewable energy center) and Colgate (willow biomass) for development opportunities in the
County
● Inventory State forest and under-utilized land resources in the County as basis for development of
energy resources and crops
● Obtain detailed guidance regarding access to State forest resources as basis for biomass energy
initiative
● Develop an inventory of County waterways and dams to assess micro-hydro potential.
● Seek federal and state funds to support biomass crop assistance program
The availability of a trained or trainable workforce may be one of the most crucial ingredients in any decision by
today’s businesses to expand or relocate. The development of specialized skills is an expensive undertaking for any
company and the availability of a pool of workers ready to be productive is a major attraction for local and relocat-
ing rms alike. Having such a workforce is key to Madison County’s ability to participate in the dynamic and highly
competitive regional, national, and international economies of today. There are two essential challenges in this area:
keeping a viable local labor pool available as the population ages, and providing the right type of training at the right
Madison County Economic Development StrategyPage 16 Madison County Strategic Economic Development PlanPage 16

7/29/2019 Madison County's economic development plan, 2013
http://slidepdf.com/reader/full/madison-countys-economic-development-plan-2013 17/192
time for this workforce. Based upon these issues, the Steering Committee recommends several measures to help
ensure the County has sufcient labor resources to support economic growth across a range of industrial sectors.
These recommendations include:
● Maintain an ofce of workforce development and employee training in the County
● Carefully inventory vocational and technology education programs on a County and regional basis
as an information resource to area employers and site location consultants ● Disseminate information about available job training resources and case study projects to area
employers
● Capitalize a small business loan/grant program to support employee training program in the
County
● Develop a internship program for high school graduates and college level students with major area
employers—public and private
● Investigate the merit of establishing additional specialized training programs to address economic
development opportunities in the marketplace—see what other community colleges are doing across
the country
● Develop a formal career-awareness outreach program to K–12 and colleges/universities
The preparation of this economic development strategy represents a signicant milestone in the community’s
efforts to promote a prosperous future for residents throughout Madison County. Like most effective plans of this
type, the thoughts, strategies, and recommendations that are incorporated in the plan are not meant to be an exhaus-
tive list of things that can be done by public ofcials to promote economic growth in their community. In fact, as
has been well documented over the years, most of the hard work needs to be done in the private sector where the
true entrepreneurial spirit of a community is unleashed in a strong free enterprise system. But the public sector
clearly has a role to play in the economic health of a community and this plan is designed to help the County meet
this obligation.
In reviewing this plan it is important to note that special emphasis was placed on trying to identify initiatives
where the County can have a direct impact on their implementation. In addition, emphasis was placed in trying to
balance out the many recommendations that were considered by identifying projects which might have a catalytic
effect in the County. Given the purpose of the plan, limited consideration was given to trying to access the potential
economic impact of the program recommendations that are presented. However, an effort was made to prioritize the
recommendations in the form of a short, medium, and long term implementation horizon. Consideration was also
given to identifying the various parties with responsibility for helping to implement the plan.
To be effective, this strategic plan must be widely and frequently circulated in the County. Citizens and busi-
nesses need to know that the County has a roadmap to help guide its economic development efforts in the years
ahead. In addition, the plan must be updated on a continuous basis to reect new economic data and information
about the County. These updates must include an assessment of the success and failure of various program recom-
mendations incorporated in the plan. In the end, the plan must be viewed as a tool which if applied effectively will
help the County support a strong private sector that has many great employers, a tremendous workforce, and a reser -
voir of economic development assets to draw on at local, regional, state, and federal level regional level to support a
strong economy in the future.
Madison County Economic Development Strategy PageMadison County Strategic Economic Development Plan Page

7/29/2019 Madison County's economic development plan, 2013
http://slidepdf.com/reader/full/madison-countys-economic-development-plan-2013 18/192
Madison County Economic Development StrategyPage 18

7/29/2019 Madison County's economic development plan, 2013
http://slidepdf.com/reader/full/madison-countys-economic-development-plan-2013 19/192
Regional Prole
Central New York is geographically centered
in Upstate New York and includes the counties of
Cayuga, Cortland, Madison, Onondaga, and Oswego.
The region covers an area of 3,622 square miles,
comprising a balance of an urban center - the City
of Syracuse, suburban areas, small cities and towns,
and rural farming communities. The region is located
in close proximity to the cities of Rochester, Ithaca,
Utica, Buffalo, Albany, and Binghamton and is within
a 4–5 hour drive to several major metropolitan areas
in the northeast including New York, Toronto, Boston,
Montreal, and Philadelphia. Over 136 million people
live within a 750 radius of Syracuse including over 50
percent of the population of Canada and the United
States.
Central New York has a population base of approxi-
mately 790,000 residents. Historical population sta-
tistics show that the region’s population has remained
relatively stable over the past 20 years since reaching
a peak in 1990. Per capita income for the Syracuse
Exhibit 1. Map of Northeast
Source: Source Syracuse University
Madison County Economic Development Strategy Page
Central New Yo
C H A P T E R
1Draft —November 14, 2012

7/29/2019 Madison County's economic development plan, 2013
http://slidepdf.com/reader/full/madison-countys-economic-development-plan-2013 20/192
Metropolitan Statistical Area totals $36,980 which
compares favorably with other metropolitan areas
across Upstate New York and with the nation.
The region’s labor force currently numbers more
than 394,600 workers and has remained stable over
the past ten years. The average annual wage cost in the
ve-county area is estimated to equal $40,286 which
is competitive with national levels and signicantly
below major metropolitan areas in the northeast. Over
38.9 percent of the region’s population has attained a
college associate’s degree or higher. The skills of the
Central New York labor force support a wide range of
economic sectors including agriculture, manufacturing,
health care, education, professional business services,
warehouse and distribution, wholesale and retail trade,
construction trades, utilities, and public employment.
Current statistics for the region show a total of
330,000 jobs, including 262,000 in the private sector,
with an annual payroll in excess of $13.6 billion. Over
28,500 jobs are based in the manufacturing sector with
a total payroll of approximately $1.8 billion. The total
value of agricultural products sold in the region is
estimated at more than $532 million. Annual tourism
spending in Central New York exceeds $4 billion. A
metropolitan statistical area’s economic strength rank -
ing provided by the Policom Corporation shows that
the Syracuse MSA ranks 162 out of 366 metropolitan
areas in the nation.
Businesses in Central New York are served by an
extensive transportation network, which includes Syra-
cuse Hancock International Airport, the deep water
Port of Oswego, several rail freight carriers, a CSX
intermodal rail center, Amtrak passenger rail service,Interstate Routes 81 and 90, and a public transportation
bus service maintained by the CNY Regional Trans-
portation Authority. Companies are also served by an
extensive network of public sewer and water facilities,
which includes a major water supply transmission line
from Lake Ontario that is provided by the Metropolitan
Water Board and the Onondaga County Water Author -
ity. Ample supplies of electric and gas service are pro-
vided by the New York Power Authority and several
private utility companies including National Grid, New
York State Electric and Gas, and Rochester Gas and
Electric. The region is also served by an advanced tele-
communications system that is provided by such major
service providers as Verizon, Time Warner, and AT&T.
In evaluating the region’s resources, it is important
to note that businesses have access to a wide range of
real estate opportunities that are very affordable and
diverse—from sophisticated urban space and high-tech
research centers, to ofce and industrial parks, and
efcient warehouse and distribution facilities. This
real estate inventory is well distributed throughout the
ve-county region and includes several major busi-
ness parks and Build Now-NY “shovel ready” sites:
the Aurelius Business Park in Cayuga County; the
Finger Lakes East Business Park in Cortland County;
the Canastota and Lakeport Business Parks in Madison
County; the Clay Business Park, Syracuse University
Research Park, Hancock Airpark, Collamer Crossing
Business Park, and the Radisson Industrial Park in
Onondaga County; and the Oswego County Industrial
Park, Lake Ontario Industrial Park, and the Riverview
Business Park in Oswego County. Together these real
estate holdings represent over 1,000 acres of land that
are ready for development at very affordable prices
that range from $10,000–$100,000 per acre.
When seeking to build an educated workforce, com-
panies across the region are well served by 44 institu-
tions of higher education located in Upstate New York,
with a combined enrollment in excess of 215,000 stu-
dents, and several for-prot education centers. Top area
schools include Cazenovia College, Clarkson Univer -
sity, Colgate University, Cornell University, LeMoyne
College, Rensselaer Polytechnic Institute, Rochester
Institute of Technology, Syracuse University, Uni-
versity of Rochester, Wells College and members of
the SUNY system including Albany, Binghamton,
Madison County Economic Development StrategyPage 20

7/29/2019 Madison County's economic development plan, 2013
http://slidepdf.com/reader/full/madison-countys-economic-development-plan-2013 21/192
Exhibit 2. Historical U.S. and Regional Population Trends, 1910–2010
Source: U.S. Census BureauExhibit 3. Central New York Population, 1950–2010
0
100,000
200,000
300,000
400,000
500,000
600,000
700,000
800,000
201020052000199019701950
Source: Source U.S. Census Bureau:
Exhibit 4. Regional and County Population Estimates
1950 1970% Change
‘50 - ‘701990
% Change
‘70 - ‘902000
% Change
’90 - ‘002010
% Change
‘00-’10
Cayuga 70,136 77,439 10.4% 82,313 6.3% 81,963 -0.4% 80,026 -2.4%
Cortland 37,158 45,894 23.5% 48,963 6.7% 48,599 -0.7% 49,336 1.5%
Madison 46,214 62,864 36.0% 69,120 10.0% 69,441 0.5% 73,442 5.8%
Onondaga 341,719 472,835 38.4% 468,973 -0.8% 458,336 -2.3% 467,026 1.9%
Oswego 77,181 100,897 30.7% 121,771 20.7% 122,377 0.5% 122,109 -0.2%
CNY Region 572,408 759,929 32.8% 791,140 4.1% 780,716 -1.3% 791,939 1.4%
Albany/Schenect-
ady/Troy MSA
825,875 870,716 5.4%
Binghamton MSA 252,320 251,725 >-0.1%
Bualo/Niagara
MSA1,170,111 1,135,509 -0.3%
Rochester MSA 1,037,831 1,054,323 1.6%
Syracuse MSA 650,154 662,577 1.9%
Uca/Rome MSA 299,896 299,397 >-0.1%
NYS 14,830,192 18,242,584 23.0% 18,976,457 5.5% 19,378,102 2.1%
Source: Source U.S. Census Bureau:
Madison County Strategic Economic Development Plan Page

7/29/2019 Madison County's economic development plan, 2013
http://slidepdf.com/reader/full/madison-countys-economic-development-plan-2013 22/192
Buffalo, Cortland, Morrisville, Oswego, the College
of Environmental Science and Forestry, the Institute of
Technology, Cayuga Community College, Onondaga
Community College, and Tompkins-Cortland Commu-
nity College. Many of these colleges and universities
have made the U.S. News and World Reports annual
survey of the nation’s best institutions of higher learn-
ing. Advanced education and research facilities in the
region include Syracuse University’s Center of Excel-
lence and the Computer Applications and Software
Engineering Center, the Human Performance Center at
SUNY Upstate Medical University, Onondaga Com-
munity College’s Applied Technology Center, Rome’s
U.S. Air Force Research Laboratory, and four national
research centers at Cornell University.
Residents in Central New York enjoy very afford-
able housing, excellent health care, a strong K–12
public education system, several vibrant entertainment
and shopping districts, cultural amenities that include
a professional theatre, professional and college level
sports, and numerous outdoor recreation opportunities.
Quality of life rankings for the region are consistently
very high—Forbes.com has ranked Syracuse #4 in the
American Best Places to Raise a Family List and theACCRA cost of living index maintained by the Coun-
cil for Community and Economic Research shows the
region is very competitive with other metropolitan
areas across the nation.
Businesses in Central New York are supported by
a strong professional business service community and
Exhibit 5. Employment by Industry, Syracuse MSA
1990–2010, ’000s
1990 1995 2000 2005Dec
2010
Total Non-Farm 317.8 307.8 325.4 320.8 320.1
Total Private 264.2 252.9 269.0 263.5 262.7
Goods Producing 61.2 53.0 57.3 45.5 40.0
Service
Producing256.6 254.8 268.1 275.4 280.1
Nat. Resources,
Mining,
Construcon
15.6 11.7 12.9 12.3 12.0
Manufacturing 45.6 41.3 44.5 33.2 28.0
Wholesale Trade 20.1 15.8 15.8 15.6 14.1
Retail Trade 38.3 37.3 38.1 36.9 36.1
Ulies 6.4 4.8 4.8 4.0 3.4
Transportaon/
Warehousing 9.5 9.4 9.2 9.4 9.2
Informaon 7.7 6.3 7.7 6.6 4.8
Financial
Acvies20.6 18.0 17.7 17.6 17.0
Professional/
Business Services27.8 29.0 30.2 34.3 34.6
Educaonal
Services11.8 13.7 15.2 16.7 21.4
Health Care and
Social Assistance26.9 31.9 34.4 38.0 42.2
Hospitals 8.9 9.3 9.1 8.9 9.4
Leisure/
Hospitality 24.1 22.8 25.2 26.6 27.5
Accommoda-
on and Food
Services
21.6 20.1 22.0 22.6 22.7
Other Services 9.8 11.1 13.3 12.5 12.4
Government 53.7 54.9 56.4 57.4 57.4
Federal 4.6 4.6 5.1 4.4 4.4
State 13.0 13.5 13.8 13.9 13.7
Educaon 6.0 6.6 7.4 8.2 8.3
Local 36.1 36.8 37.5 39.1 39.3
Educaon 20.3 21.9 23.0 23.6 25.8
Source: NYSDOL and BLS
Exhibit 6. Average Annual Wages by Industry Sector, Central New York, 2009
$0 $10,000 $20,000 $30,000 $40,000 $50,000 $60,000 $70,000 $80,00
Total, All Industries
Agriculture, Forestry, Fishing, Hunting
Construction
Manufacturing
Wholesale Trade
Retail Trade
Transportation & Warehousing
Information
Finance & Insurance
Real Estate and Rental
Professional & Technical
Management of Companies and Enterprises
Administrative and Waste Services
Educational Services
Health Care and Social Services
Arts, Entertainment and Recreation
Accommodation & Food Services
Other Services
Government
Source: NYSDOL
Madison County Economic Development StrategyPage 22

7/29/2019 Madison County's economic development plan, 2013
http://slidepdf.com/reader/full/madison-countys-economic-development-plan-2013 23/192
a network of county and regionally based economic
development organizations. These organizations offer
a range of services that include nancial assistance, tax
abatement programs, workforce training, entrepreneur -
ial development, marketing, and site location assis-
tance. Building upon these resources, companies and
various development organizations across the region
are engaged in efforts to capitalize on developments
in the marketplace that could prove benecial to CNY
such as initiatives in biotechnology, alternative energy,
information management, health care, national defense,
and deployment of advanced infrastructure systems
and smart grid technology.
In addition to the efforts noted above, support is
being given to innovative initiatives being led by major
area companies and those associated with the Syracuse
Technology Garden, the SU Center of Excellence, and
the Central New York Biotechnology Center. Attention
is also being directed to work done by the NYS Energy
Research and Development Authority and by the NYS
Foundation for Science, Technology and Innovation,
and to the economic opportunities associated with
several major developments in Upstate New York.
These developments include the ongoing growth of the
U.S. Army Fort Drum military installation in the north
country, the AMD/Global Foundries semiconductor
manufacturing center at the Luther Forest Technology
Park in Saratoga County, the activities associated with
the SEMATECH industry research consortium and the
College of Nanoscale Science & Engineering at the
University of Albany, the GE Global Research Center
in Schenectady, the Cornell Agriculture and Food
Technology Park in Geneva, the NYS Yogurt Summit,
the NYS Beer, Wine and Spirits Summit, the Roswell
Park Cancer Institute in Buffalo, the New York Power
Authority’s off-shore wind power and solar initiative,
Destiny USA and Turning Stone Resort, and highspeed rail. These initiatives, when combined with the
region’s strong economic foundation, are expected to
help generate the growth of a signicant number of
new jobs in the years ahead.
Exhibit 7. Comparison of Cost of Living of Selected Cities, 2008
MSA Total Food Housing Ulies Transp. Health
Misc.
Goods/
Services
Rochester, NY 101.9 94.0 87.6 131.4 106.4 100.5 106.7
Cleveland, OH 99.6 105.9 90.7 113.1 104.6 101.7 98.8
Bualo, NY 99.5 103.5 89.8 130.5 103.7 94.1 96.3
Syracuse, NY 98.8 98.5 82.6 122.5 100.8 93.4 105.1
Grand Rapids, MI 98.1 99.4 99.5 111.5 101.3 88.9 92.8
Erie, PA 96.5 99.2 83.6 127.8 99.8 96.3 95.9
Pisburgh, PA 94.2 97.6 87.0 107.6 101.7 85.9 93.6
South Bend, IN 93.4 93.1 82.4 98.2 102.0 95.1 98.2
Akron, OH 93.3 96.6 80.9 101.1 106.9 90.9 96.3Rockford, IL 92.8 89.8 77.7 96.3 109.1 104.0 99.0
Dayton, OH 91.9 88.9 75.2 100.2 107.1 94.1 99.3
Muncie, IN 91.1 98.0 77.3 86.8 103.4 93.6 96.9
Charleston, WV 91.0 85.2 85.7 93.9 98.8 95.5 93.8
Youngstown/
Warren, OH89.6 96.9 76.2 107.8 95.2 86.9 91.0
Fort Wayne, IN 89.0 90.6 84.5 93.8 105.2 95.2 85.3
Source: Council for Community and Economic Research
Madison County Economic Development Strategy PageMadison County Strategic Economic Development Plan Page

7/29/2019 Madison County's economic development plan, 2013
http://slidepdf.com/reader/full/madison-countys-economic-development-plan-2013 24/192
Employment Clusters
Industries can group within an area as a result of
several factors including geography, availability of
natural resources, presence of intellectual assets, pres-
ence of a workforce with a high concentration of a
particular skill, and the unique historical developmentof a region. Areas with such concentrations tend to
attract similar industries or supporting industries; this
provides a competitive advantage from the local pool-
ing of talent and expertise.
Exhibit 8 represents data assembled by the
NYSDOL regarding industry concentrations in Central
New York (Cayuga, Cortland, Madison, Onondaga and
Oswego Counties). The table lists the industry concen-
tration within the region, the jobs and wages produced
by each, their regional ranking and their Location
Quotient (LQ), which are measures of employment
concentration in a regional economy. More specically,
they compare the concentration of industry employ-
ment locally to that of the U.S. If an industry’s LQ is
greater than 1.0, the region’s labor market contains a
higher concentration of jobs in that industry relative to
the U.S.
One particularly important aspect of industry clus-
ters with LQ’s greater than 1.0 is that they are assumed
to be producing more than local demand and are there-
fore “export oriented”, that is, they attract money from
outside the region by either bringing consumers to the
region or selling goods and services to other areas. The
multiplier effects on local employment vary, but such
export-oriented industries generally produce a healthy
return for the local economy. A higher LQ ranking also
suggests that the area possesses higher labor force skill
levels in these industries, making it an attractive loca-
tion for similar industries looking to expand.
Exhibit 8. Central New York Employment Clusters, 2009
Industry Cluster Jobs Rank
Total
Wages ($
MM)
RankAverage
WageRank
Employment
Locaon
Quoent
Clusters
Ranked by
LQ within
Region
Central NY
Back Oce & Outsourcing 6,900 6 $210.9 9 $30,500 15 0.84 9
Biomedical 3,100 11 $215.6 8 $68,900 1 1.48 2
Communicaons, Soware & Media Services 5,900 7 $290.5 6 $49,600 9 0.84 9
Distribuon 14,200 3 $669.7 4 $47,200 10 1.07 6
Electronics & Imaging 2,100 14 $114.3 14 $55,300 6 1.09 5
Fashion, Apparel & Texles 400 16 $13.7 16 $36,500 14 0.24 16
Financial Services 14,300 2 $761.7 3 $53,300 7 .97 7
Food Processing 3,900 9 $163.6 10 $42,400 12 0.79 11
Forest Products 3,500 10 $148.4 12 $42,900 11 1.26 3
Front Oce & Producer Services 15,900 1 $986.0 1 $62,000 5 0.89 8
Industrial Machinery & Services 12,400 5 $781.2 2 $62,800 4 1.61 1
Informaon Technology Services 2,300 12 $150.3 11 $64,200 2 0.46 15
Materials Processing 5,700 8 $292.8 5 $51,100 8 1.12 4
Miscellaneous Manufacturing 600 15 $23.1 15 $41,200 13 0.57 14
Transportaon Equipment 2,200 13 $140.8 13 $63,500 3 0.79 11
Travel & Tourism 12,600 4 $246.1 7 $19,600 16 0.79 11
Total, All Clusters
Central NY 105,900 $5,208.7 $49,200
Source: NYSDOL
Madison County Economic Development StrategyPage 24

7/29/2019 Madison County's economic development plan, 2013
http://slidepdf.com/reader/full/madison-countys-economic-development-plan-2013 25/192
Exhibit 9. Number of Companies by Select Industry Sectors, Syracuse MSA, 2009
Syracuse MSA United States
A B C D E F
IndustryNumber of
Companies
% of companies
in an Industry
Segment as a % of
Total Companies
in MSA
Paid
Employees
Number of
Companies
% of companies
in an Industry
Segment as a % of
Total Companies
in USA
Paid
Employees
Rao
(B/E)
Esmated Total Number of
Companies in MSA (includes
Market Segments not shown
below)
13,568 100.00% 6,417,035 100.00%
Manufacturing 787 5.8% 28,202 363,753 5.7% 16,888,016 1.02
Food 67 0.5% 2,240 26,361 0.4% 1,471,050 1.19
Apparel 4 0.0% 500 17,065 0.3% 719,269 0.11
Wood & Paper 62 0.5% 2,848 23,307 0.4% 1,151,346 1.25
Chemical 28 0.2% 1,278 13,513 0.2% 884,321 0.97
Plascs/Rubber 38 0.3% 2,414 16,876 0.3% 1,029,976 1.06
Fabricated Metals 150 1.1% 4,467 62,501 1.0% 1,774,874 1.13
Machinery 74 0.5% 4,403 30,665 0.5% 1,421,820 1.13
Computer & electronic
products53 0.4% 5,771 17,465 0.3% 1,698,529 1.43
Electrical equipment &
appliances26 0.2% 3,030 6,946 0.1% 594,914 1.76
Furniture 21 0.2% 1,255 20,758 0.3% 604,845 0.48
Misc 67 0.2% 1 31,554 0.5% 735,337 1
Wholesale Trade 1,206 8.8% 15,611 453,470 7.1% 5,796,557 1.25
Retail Trade 2,895 21.2% 40,997 1,118,447 17.7% 13,991,103 1.22
Transportaon &
Warehousing353 2.6% 10,954 178,025 2.8% 2,920,777 0.93
Truck Transportaon 200 1.5% 3,967 103,978 1.6% 1,293,790 0.9
Warehousing & Storage 22 0.2% 394 6,497 0.1% 109,760 1.59
Finance & Insurance 941 6.9% 15,679 395,203 6.2% 5,835,214 1.12
Credit Intermediaon &
Related Services334 2.4% 5,007 166,882 2.6% 2,744,910 0.94
Securies Intermediaon
& Related Services88 0.6% 764 54,491 0.8% 706,053 0.76
Insurance Carriers &
Related Acvies519 3.8% 9,908 172,299 2.7% 2,327,306 1.42
Professional, Scienc &
Technical Services1,362 10.0% 13,000 621,129 9.7% 5,361,210 1.03
Administrave & Support
Services528 3.9% 16,548 260,025 4.1% 7,066,658 0.95
Art, Entertainment and
Recreaon289 2.1% 1,964 99,099 1.5% 1,587,660 1.37
Source: DeLoitte & Touche
Madison County Strategic Economic Development Plan Page

7/29/2019 Madison County's economic development plan, 2013
http://slidepdf.com/reader/full/madison-countys-economic-development-plan-2013 26/192
In reviewing the data, it is important to note that
Central New York has several industries that match this
description, including biomedical, distribution, electron-
ics and imaging, forest products, industrial machinery,
and services and materials processing. Several other
industries have high employment concentrations thatsuggest the area has a critical mass of skills that could be
leveraged to expand activity in that sector through local
growth or outside investment.
Of all industry sectors that make up an economy,
manufacturing tends to have one of the largest multi-
plier effects. It is a “net wealth generator” that creates
economic activity through its export of goods to other
regions in the country and around the world. Jobs in this
sector also tend to be well compensated. The promo-tion of existing manufacturing and attraction of new
manufacturing rms is often a top priority of economic
development efforts everywhere.
Madison County Economic Development StrategyPage 26

7/29/2019 Madison County's economic development plan, 2013
http://slidepdf.com/reader/full/madison-countys-economic-development-plan-2013 27/192
Regional Benchmarks
To assess the strengths and weaknesses of Madison
County, the Steering Committee reviewed data from
other parts of the country to benchmark the data col-
lected for the County prole. The most efcient vehicle
for comparison was the Metropolitan Statistical Area(MSA). An MSA is dened as a geographical region
with a relatively high population density at its core and
close economic ties throughout the area. Such regions
are not legally incorporated as a city or town would be,
nor are they legal administrative divisions like coun-
ties or sovereign entities like states. There are currently
366 MSAs in the United States. Madison County is a
part of the Syracuse, NY MSA, The Syracuse MSA
comprises the City of Syracuse, as the urban core,
Madison, Onondaga and Oswego counties.
The Steering Committee examined sets of ranking
indices which used various combinations of economic
data to assess the relative economic strength of differ-
ent MSAs. Two such ranking services were found to
be particularly informative: the Policom Corporation’s
Economic Strength Rankings and the Milken Institute’s
Best Performing Cities.
The Policom approach emphasizes the condition of
local economies from the “standard of living” per -
spective of those who reside in the area. Weight in its
rankings is given to areas that have demonstrated rapid
and consistent growth for an extended period of time.
Areas with volatile growth typically rank lower. Three
groups of data are considered:
● Earnings, jobs, and wages for the whole area and
on a per capita basis reect overall growth in the
size and quality of a local economy;
● The same data, but specically for small busi-
nesses (proprietors), the construction industry,
and the retail industry, are measured because it is
highly reactive to changes in the ow of money
into or out of an area;
● Welfare and Medicare income are tracked
as negative indicators of local economic
performance.
The most recent release of Policom’s rankings
(2011) provides 8 years of rankings dating to 2004.
The Syracuse MSA has shown signicant improvement
over this period and in 2011 ranked 162 out of 366
MSAs. Since 2004, the Syracuse MSA has improved
its ranking position by nearly 100 places. Among other
Upstate NY MSAs, Albany and Rochester had higher
ranking although neither showed the type of improve-
ment over time as the Syracuse MSA did. Other
communities against which the Steering Committee
benchmarked the region are shaded in the following
partial reproduction of Policom rankings. Among these
MSAs, Omaha, NE, Oklahoma City, OK and Fargo,
ND demonstrated similar improvements in scores over
the same period.
The Milken ranking system likewise focuses on job
and wage growth to pinpoint areas that are thriving.
Additionally, the system incorporates a measurement
of high technology GDP growth and high technology
location quotients to weight for a metro area’s partici-
pation in the knowledge economy.
The Syracuse MSA saw an improvement in its
2008 overall ranking of 127, rising to 80 in 2010. The
Syracuse MSA did especially well in the one-year job
growth category (31), high-tech sector output growth
relative to the U.S. average (42) and in the number of
high-technology industries with a location quotient
(LQ) above the U.S. average of 1.0 in 2009 (18). The
addition of the high technology weighting component
improved the ranking of several Upstate NY MSAs,
possibly reecting the results of years of public and
private efforts to diversify the Upstate economy.
Benchmarked communities are shaded for identica-
tion and comparison.
Madison County Economic Development Strategy Page

7/29/2019 Madison County's economic development plan, 2013
http://slidepdf.com/reader/full/madison-countys-economic-development-plan-2013 28/192
Exhibit 10. Policom Economic Strength Rankings
Metropolitan Area 2011 2010 2009 2008 2007 2006 2005 2004
Washington-Arlington-Alexandria, DC-VA-MD-WV (MSA) 1 2 2 2 1 3 1 3
Salt Lake City, UT (MSA) 2 6 10 9 28 18 6 17
Seale-Tacoma-Bellevue, WA (MSA) 3 1 12 11 23 51 34 11
Ausn-Round Rock-San Marcos, TX (MSA) 4 12 19 39 37 45 22 15
Houston-Sugar Land-Baytown, TX (MSA) 5 4 1 8 26 29 32 24
—Break in data—
Dallas-Fort Worth-Arlington, TX (MSA) 11 10 4 7 22 16 13 12
Madison, WI (MSA) 12 9 6 15 8 20 7 13
Omaha-Council Blus, NE-IA (MSA) 13 23 22 23 32 38 57 48
San Diego-Carlsbad-San Marcos, CA (MSA) 14 8 8 3 6 21 21 5
—Break in data—
Phoenix-Mesa-Glendale, AZ (MSA) 20 16 18 6 7 8 11 14
Napa, CA (MSA) 21 32 46 65 46 72 54 75
Raleigh-Cary, NC (MSA) 22 15 15 24 30 25 19 9
Fargo, ND-MN (MSA) 23 25 51 84 96 108 95 95
Colorado Springs, CO (MSA) 24 40 73 77 83 67 39 29
Portland-Vancouver-Hillsboro, OR-WA (MSA) 25 24 24 30 49 63 64 60
—Break in data—
New York-Northern New Jersey-Long Island, NY-NJ-PA (MSA) 64 62 43 38 42 42 42 49
New Haven-Milford, CT (MSA) 65 55 52 57 41 35 69 83
Cincinna-Middletown, OH-KY-IN (MSA) 66 50 38 31 38 34 33 38
San Francisco-Oakland-Fremont, CA (MSA) 67 51 41 62 63 74 86 80
Albany-Schenectady-Troy, NY (MSA) 68 92 68 75 65 54 82 110
Jacksonville, FL (MSA) 69 76 58 45 71 57 65 74
—Break in data—
Cheyenne, WY (MSA) 74 119 152 126 158 175 162 133
Green Bay, WI (MSA) 75 48 78 68 50 48 20 27
Louisville-Jeerson County, KY-IN (MSA) 76 102 59 66 67 41 28 30
Miami-Fort Lauderdale-Pompano Beach, FL (MSA) 77 53 60 47 60 70 66 82
Los Angeles-Long Beach-Santa Ana, CA (MSA) 78 60 57 55 47 61 79 88
—Break in data—
Fayeeville, NC (MSA) 92 122 165 131 128 150 189 227
Cedar Rapids, IA (MSA) 93 78 116 136 159 165 168 184
Milwaukee-Waukesha-West Allis, WI (MSA) 94 66 45 35 40 37 58 57
Albuquerque, NM (MSA) 95 111 129 111 100 88 74 61
Anchorage, AK (MSA) 96 154 180 217 226 223 276 328
Appleton, WI (MSA) 97 68 80 91 109 99 73 91
Knoxville, TN (MSA) 98 81 74 60 74 58 77 71
Madison County Strategic Economic Development PlanPage 28

7/29/2019 Madison County's economic development plan, 2013
http://slidepdf.com/reader/full/madison-countys-economic-development-plan-2013 29/192
Metropolitan Area 2011 2010 2009 2008 2007 2006 2005 2004
Oklahoma City, OK (MSA) 99 75 97 148 180 153 157 183
Bismarck, ND (MSA) 100 145 188 221 229 264 228 200
—Break in data—
Fort Collins-Loveland, CO (MSA) 116 103 114 107 80 75 45 37
Hagerstown-Marnsburg, MD-WV (MSA) 117 95 92 81 86 114 119 154
Chaanooga, TN-GA (MSA) 118 99 108 93 75 71 105 145
Salinas, CA (MSA) 119 107 83 92 95 124 169 202
Greeley, CO (MSA) 120 88 150 164 157 128 88 94
Rochester, NY (MSA) 121 135 110 106 115 147 175 214
—Break in data—
Panama City-Lynn Haven-Panama City Beach, FL (MSA) 150 192 203 183 178 192 225 196
Worcester, MA (MSA) 151 160 172 160 122 98 109 118
Scranton–Wilkes-Barre, PA (MSA) 152 198 159 180 196 168 133 163
Bloomington-Normal, IL (MSA) 153 159 192 169 155 132 106 97
—Break in data—
Ann Arbor, MI (MSA) 160 165 130 114 110 97 84 106
Oshkosh-Neenah, WI (MSA) 161 132 151 138 131 107 91 66
Syracuse, NY (MSA) 162 195 149 166 179 201 222 258
Manhaan, KS (MSA) 163 157 120 NR NR NR NR NR
Jacksonville, NC (MSA) 164 199 264 299 284 327 280 316
—Break in data—
Palm Bay-Melbourne-Titusville, FL (MSA) 188 169 167 145 174 199 209 177
Atlanc City-Hammonton, NJ (MSA) 189 177 197 237 213 225 256 274
Bualo-Niagara Falls, NY (MSA) 190 219 161 167 167 179 201 235
Akron, OH (MSA) 191 150 99 95 108 90 104 120
—Break in data—
Toledo, OH (MSA) 276 249 195 190 203 214 220 233
Kingston, NY (MSA) 277 246 262 261 307 331 316 276
Glens Falls, NY (MSA) 278 303 324 316 339 348 344 340
—Break in data—
Merced, CA (MSA) 286 247 281 246 208 233 259 299
Uca-Rome, NY (MSA) 287 308 289 306 326 321 308 282
Albany, GA (MSA) 288 307 335 333 321 279 270 257
—Break in data—
Yuma, AZ (MSA) 294 271 318 310 278 278 301 281
Dayton, OH (MSA) 295 265 199 175 168 136 152 162
Binghamton, NY (MSA) 296 327 323 323 344 332 332 311
Florence, SC (MSA) 297 298 288 256 232 207 203 160
—Break in data—
Source: Policom Corporation
Madison County Strategic Economic Development Plan Page
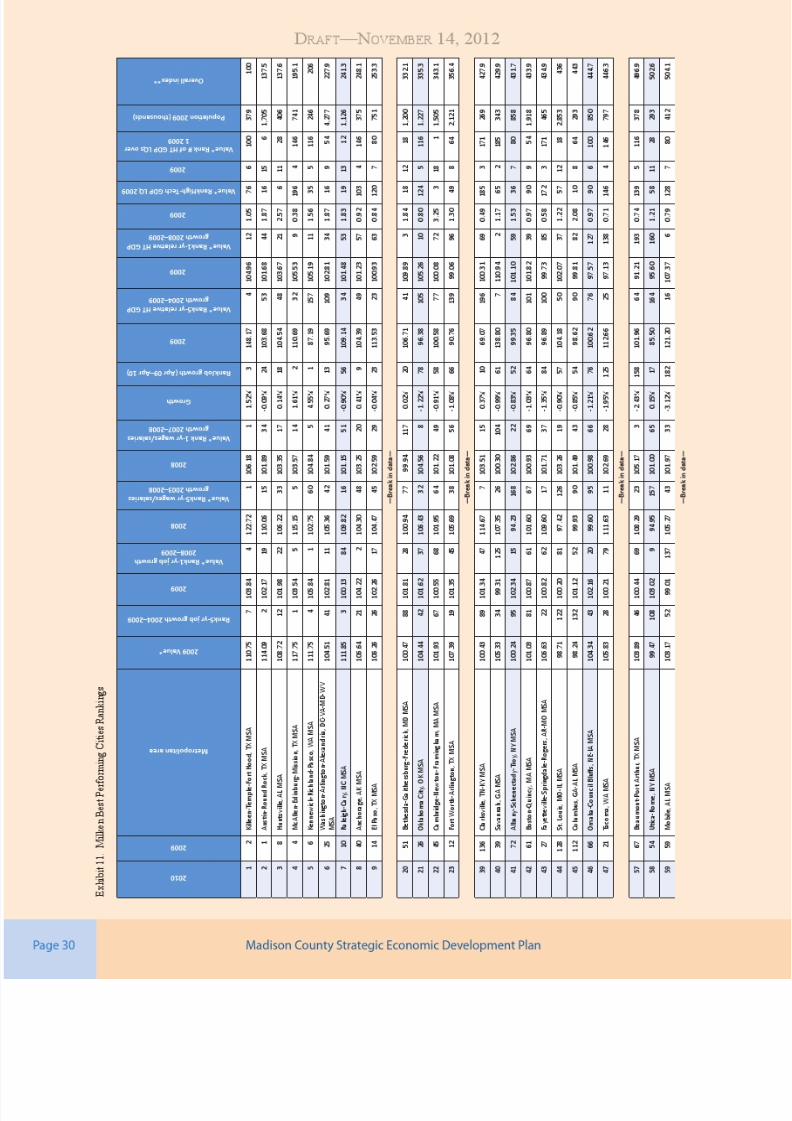
7/29/2019 Madison County's economic development plan, 2013
http://slidepdf.com/reader/full/madison-countys-economic-development-plan-2013 30/192

7/29/2019 Madison County's economic development plan, 2013
http://slidepdf.com/reader/full/madison-countys-economic-development-plan-2013 31/192

7/29/2019 Madison County's economic development plan, 2013
http://slidepdf.com/reader/full/madison-countys-economic-development-plan-2013 32/192
Regional EconomicDevelopment Plans
The Central New York community has a very
diverse economy that is supported by a growing work -
force, a well-developed infrastructure base, and strong
academic resources. Despite these assets, the regionis challenged economically as evidenced by various
sociodemographic data. This data shows a stagnant
population base, low per capita income, and areas of
high long-term unemployment. To address these chal-
lenges, the region has developed a number of strategic
economic development plans over the past twenty
years which together represent a short-term economic
development strategy and a long-term comprehen-
sive approach to economic growth. These documentsinclude the CNY Comprehensive Economic Develop-
ment Strategy (CNY CEDS), Vision 2010: A Regional
Economic Development Strategy for Syracuse and
Central New York, and the Essential New York Initia-
tive. The CNY CEDS is a document updated each
year by the CNY Regional Planning and Development
Board and focuses on a short term project priority list
of public capital improvement projects for the region.
Vision 2010 is a document that was prepared in 1996
by the Stanford Research Institute under contract with
the Metropolitan Development Association of Syracuse
and Central New York. The revisions to Vision 2010,
now titled the Essential New York Initiative, were pre-
pared in 2004 by the Battelle Institute and Catalytix (a
Richard Florida Company), two nationally-recognized
consultants retained by MDA.
In 2011, these planning efforts received additional
support by Governor Andrew Cuomo’s administrationthrough the implementation of a regional economic
development council program initiative. As part of this
initiative, each regional council was tasked with the
challenge of preparing a regional economic develop-
ment plan for their respective region. The Central
New York Regional Economic Development Council
(CNY REDC) completed work on their Five-Year
Strategic Plan: 2012–2016 in November 201. This
plan was chosen by the Governor’s ofce in December
2011 as the “Best Plan Awardee” in NYS and received
$103.7 million in capital grants and tax credit nanc-
ing to support a range of economic and community
development projects in the ve-county Central New
York region .
Included in the CNY REDC’s strategy are 30 prior -
ity projects that are eligible for capital funding and
excelsior tax credits. Collectively, they represent a total
investment of $785 million, total ve-year payroll of
$393 million, and total project expenses of more than
$1.1 billion. Together, these projects are projected to
support the creation of 1,958 new jobs and 1,928 con-
struction jobs; the retention of 366 existing jobs; and
promise a return on investment of 28:1.
The CNY REDC’s strategic plan is built around
three priority goals to guide the region’s collective
actions:
A. Strengthen Targeted Industry Concentrations
that Leverage Unique Economic Assets
B. Improve Competitiveness in, and Connec-
tions to, the Regional, National, and Global
Economies
C. Revitalize the Region’s Urban Cores, Main
Streets, and Neighborhoods
A. Strengthen Targeted Industry Concentrations that
Leverage Unique Economic Assets
In planning for future prosperity, the CNY REDC
identied several critical industry concentrations that
are at the heart of its economic strategy. These sectors
represent a cross-section of both traditional and new
economy industries and share ve common criteria:
(1) they have critical mass of existing rms and a large
base of existing employment in the region; (2) employ-
ment in these sectors is highly concentrated in Central
New York; (3) there is signicant growth in regional,
Madison County Economic Development StrategyPage 32

7/29/2019 Madison County's economic development plan, 2013
http://slidepdf.com/reader/full/madison-countys-economic-development-plan-2013 33/192
national, and global demand for the products and
services they generate; (4) Central New York possesses
resources to support these clusters and, therefore, this
region has a competitive advantage to attract similar
rms; and (5) they are deeply connected to our anchor
institutions.
Priority industry concentrations identied in the plan
include:
a. Clean Energy and Environmental Systems—Cen-
tral New York has the eighth highest concentration of
private sector “green jobs” of any region in the country
and is home to New York State’s Syracuse Center
of Excellence in Environmental and Energy Sys-
tems (SyracuseCoE), a consortium of more than 200
research institutions and private sector companies.
b. Health, Biomedical Services, and Biosciences—
The region’s hospitals directly employ more than
23,000 people and another 3,500 are employed in
private, high-tech biomedical companies with aver -
age wages approaching $70,000, nearly double the
region’s median wage. The region’s extensive research
and development (R&D) in the biosciences cluster not
only fuels health and biomedical, but also drives the
area’s clean technology, agribusiness, and other coreindustries.
c. Financial Services—This industry employs
more than 24,000 in the region. Recent research
demonstrates that Central New York offers signicant
advantages to rms in this sector, such as a lower cost
of operation and a highly skilled and experienced
labor force that provides opportunities for employment
growth.
d. Agribusiness and Food Processing—New York
State is the nation’s third-largest producer of uid
milk and commodity crops representing more than $1
billion in sales alone. Central New York is a signi-
cant contributor and increasingly focused on value-
added opportunities for agribusiness, including food
processing.
e. Advanced Manufacturing—Manufacturing
represents 10 percent of the region’s total employment
and subsectors, such as digital electronics and radar
and sensor systems, serve expanding global markets in
security, information technology, and defense.
f. Tourism—Tourism is a $1 billion industry in
Central New York, and current global economic condi-
tions, including the weak dollar, create opportunities
for the region to draw additional international visitors
across our shared boundary with Canada and from
entry points downstate.
B. Improve Competitiveness in, and Connections to,
the Regional, National, and Global Economies
The CNY REDC’s economic development strat-
egy acknowledges and embraces the global nature of
today’s economy and encourages businesses, large
and small, to compete in an increasingly competitive
marketplace. As noted in the plan, Central New York’s
highly educated workforce forms the foundation for
those investments, as does its unique concentration of
leading higher-education and research and develop-
ment institutions. In order to improve global com-
petitiveness, the plan recommends making signicant
investments in several critical mechanisms that fueleconomic growth:
a. Encourage New Venture and Product Develop-
ment—The region has a strong foundation in entrepre-
neurship with collaborative programs between higher
education and business. Further investments in this
area are recommended to support successful venture
development, including student venture development,
as part of a transformational strategy to re-energize the
regional economy.
b. Prioritize Investments in Innovation, Commer -
cialization, and Process Improvement—Continuous
improvement and the development of new products
and services is critical to the success of businesses in
a rapidly evolving global economy. The CNY REDC
recommends private investment in research and
Madison County Economic Development Strategy Page
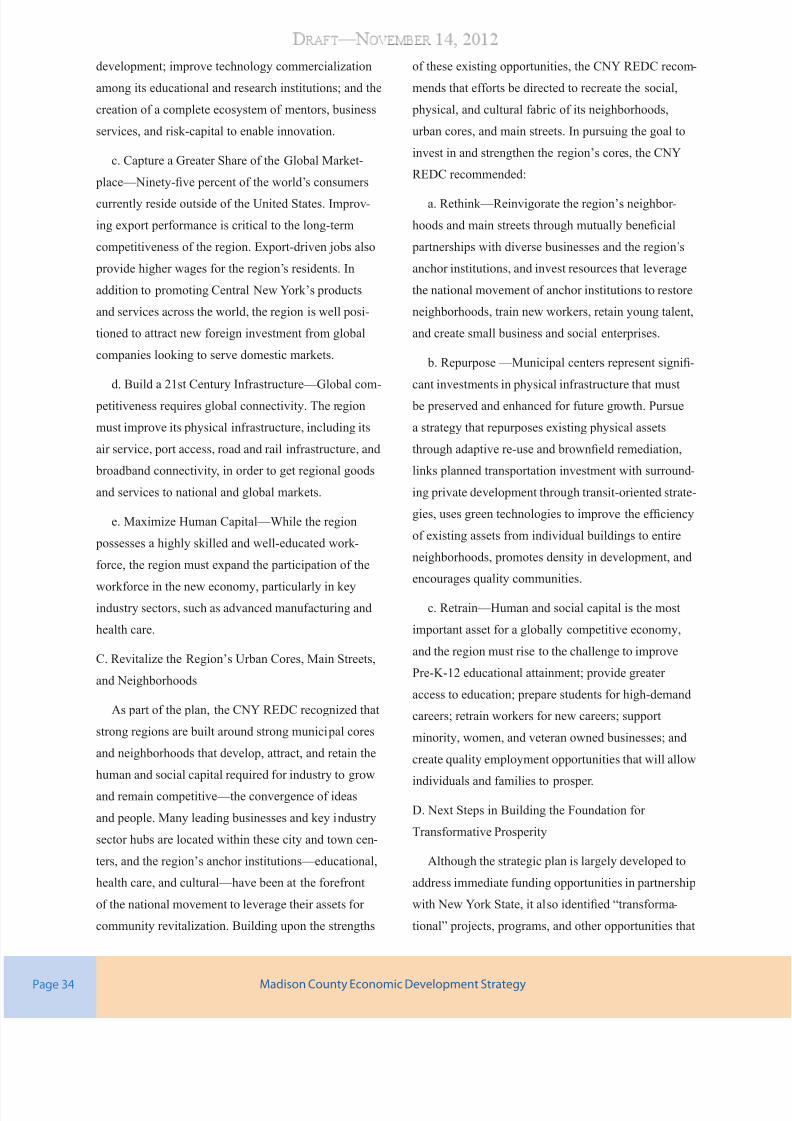
7/29/2019 Madison County's economic development plan, 2013
http://slidepdf.com/reader/full/madison-countys-economic-development-plan-2013 34/192
development; improve technology commercialization
among its educational and research institutions; and the
creation of a complete ecosystem of mentors, business
services, and risk-capital to enable innovation.
c. Capture a Greater Share of the Global Market-
place—Ninety-ve percent of the world’s consumers
currently reside outside of the United States. Improv-
ing export performance is critical to the long-term
competitiveness of the region. Export-driven jobs also
provide higher wages for the region’s residents. In
addition to promoting Central New York’s products
and services across the world, the region is well posi-
tioned to attract new foreign investment from global
companies looking to serve domestic markets.
d. Build a 21st Century Infrastructure—Global com-
petitiveness requires global connectivity. The region
must improve its physical infrastructure, including its
air service, port access, road and rail infrastructure, and
broadband connectivity, in order to get regional goods
and services to national and global markets.
e. Maximize Human Capital—While the region
possesses a highly skilled and well-educated work -
force, the region must expand the participation of the
workforce in the new economy, particularly in keyindustry sectors, such as advanced manufacturing and
health care.
C. Revitalize the Region’s Urban Cores, Main Streets,
and Neighborhoods
As part of the plan, the CNY REDC recognized that
strong regions are built around strong municipal cores
and neighborhoods that develop, attract, and retain the
human and social capital required for industry to grow
and remain competitive—the convergence of ideas
and people. Many leading businesses and key industry
sector hubs are located within these city and town cen-
ters, and the region’s anchor institutions—educational,
health care, and cultural—have been at the forefront
of the national movement to leverage their assets for
community revitalization. Building upon the strengths
of these existing opportunities, the CNY REDC recom-
mends that efforts be directed to recreate the social,
physical, and cultural fabric of its neighborhoods,
urban cores, and main streets. In pursuing the goal to
invest in and strengthen the region’s cores, the CNY
REDC recommended:
a. Rethink—Reinvigorate the region’s neighbor -
hoods and main streets through mutually benecial
partnerships with diverse businesses and the region’s
anchor institutions, and invest resources that leverage
the national movement of anchor institutions to restore
neighborhoods, train new workers, retain young talent,
and create small business and social enterprises.
b. Repurpose —Municipal centers represent signi-
cant investments in physical infrastructure that must
be preserved and enhanced for future growth. Pursue
a strategy that repurposes existing physical assets
through adaptive re-use and browneld remediation,
links planned transportation investment with surround-
ing private development through transit-oriented strate-
gies, uses green technologies to improve the efciency
of existing assets from individual buildings to entire
neighborhoods, promotes density in development, and
encourages quality communities.
c. Retrain—Human and social capital is the most
important asset for a globally competitive economy,
and the region must rise to the challenge to improve
Pre-K-12 educational attainment; provide greater
access to education; prepare students for high-demand
careers; retrain workers for new careers; support
minority, women, and veteran owned businesses; and
create quality employment opportunities that will allow
individuals and families to prosper.
D. Next Steps in Building the Foundation for
Transformative Prosperity
Although the strategic plan is largely developed to
address immediate funding opportunities in partnership
with New York State, it also identied “transforma-
tional” projects, programs, and other opportunities that
Madison County Economic Development StrategyPage 34

7/29/2019 Madison County's economic development plan, 2013
http://slidepdf.com/reader/full/madison-countys-economic-development-plan-2013 35/192
are critical for the region’s future. Transformational
initiatives identied include:
a. Regional Industrial Clusters
New York Energy Regional Innovation Cluster—
(NYE-RIC) NYE-RIC is a statewide alliance focused
on accelerating the development and deployment of
innovations to dramatically improve energy efciency
in buildings, addressing a global demand in a market
that is expected to grow dramatically over the coming
decades. The proposed investment of $225 million
includes $150 million from private and federal sources,
which can be used to leverage $75 million from vari-
ous state and federal sources.
Food-to-Market and Agricultural Programming—
Central New York is uniquely poised to be the agri- business “hub” of New York if it can coordinate its use
of agricultural and natural resources to create more
robust systems for local food to market initiatives and
regional energy production.
Tourism in the Arts and Culture—The region has
an abundance of arts and cultural opportunities, with
world-class offerings by individual artist studios
to large-scale performance venues. Access must be
provided to broader audiences while nding ways to
leverage community support and funding for the arts to
reach national and international markets.
Project “Top Hat”—A Fortune 1,000 nancial back
ofce services rm is considering an expansion in mul-
tiple regions in upstate New York, with the potential
to generate more than 1,000 jobs. In order to accom-
modate the anticipated growth, the region must engage
institutions of higher learning in terms of internships,
curriculum development, and employment training to
meet the company’s anticipated workforce demand.
b. Connecting People, Jobs, and Housing
Municipal Core Mixed-Use Investment Program—
The Restore New York program successfully provided
needed gap nancing to mixed-use projects of all sizes
throughout the State. The program proved critical to
getting new commercial and residential construction
moving in Central New York’s municipal cores and the
State must consider the creation of similar mixed-use
investment programs in the future.
Broadband/Connectivity Infrastructure—In an
increasingly interconnected marketplace, ubiquitous
high-speed, affordable broadband Internet access is a
key component to thriving economies in both urban
and rural communities. Rural areas need a strategy to
support investment in broadband to connect its citizens
with each other and the broader economy.
Region-Wide Waterfront Revitalization Strategy—
To unlock the full economic potential of the region’s
abundant waterfronts, New York State must help create
focused waterfront programs that leverage local invest-
ments in municipal revitalization, marketing, business
recruitment, and shipping.
c. Workforce Alignment
Say Yes to Education—The nation’s rst-ever,
district-wide implementation of Say Yes in the City
of Syracuse is poised to be a visionary, turnaround
model for education and economic development in
urban centers across the United States. New York State
must help expand the Say Yes Summer Academies
throughout the ve-county region, and further advance
scholarship opportunities for aspiring youth.
d. Innovation Infrastructure
Innovate Upstate Fund—Central New York has a
robust innovation ecosystem through R&D at major
area employers and its academic institutions, and at
strong early-stage companies; however, the State does
not have a complete continuum of funding programs
and tax breaks to assist in various emerging technology
sectors. The region’s private and institutional partners
must work to capitalize a regional venture fund to
provide critical risk capital to accelerate the launch and
growth of more startup companies.
Madison County Economic Development Strategy Page

7/29/2019 Madison County's economic development plan, 2013
http://slidepdf.com/reader/full/madison-countys-economic-development-plan-2013 36/192
Madison County Economic Development StrategyPage 36

7/29/2019 Madison County's economic development plan, 2013
http://slidepdf.com/reader/full/madison-countys-economic-development-plan-2013 37/192
Madison County is located in Upstate New York
in the Syracuse Metropolitan Statistical Area and is
comprised of fteen towns, ten villages and one city.
It is one of 62 counties in New York and ranks 37th
in population with a total of 73,442 residents, which
represents the highest population total in the County’s
history. The County’s population has increased each
decade for the past seventy years.
Madison County has a total land area of 656 square
miles and a total open water area of 5.7 square miles.
In the 2010 Census, the population per square milewas approximately 112 persons. The average popula-
tion density in New York State is about 411 persons
per square mile. In Central New York, only Cortland
County, at 99 persons per square mile, is less densely
populated than Madison County.
Madison County’s land development pattern has
been inuenced by its two physiographic regions—the
Oneida Lake Plain in the north and the Appalachian
Uplands in the south. The Oneida Lake Plain is gener -
ally level while the Uplands rise abruptly from the
plain and consist of rounded hills and broad, deep, and
steep-sided valleys. The population is concentrated in
the Oneida Lake Plain with the Appalachian Upland
population dispersed throughout the remainder of the
County. A majority of the population (55 percent) lives
outside of the incorporated boundaries of villages and
the City of Oneida. This pattern has accelerated since
1980, with most of the population growth taking place
near these incor porated areas.
Colgate University
Madison County Economic Development Strategy Page
Profle o Madison Count
C H A P T E R
2Draft —November 14,

7/29/2019 Madison County's economic development plan, 2013
http://slidepdf.com/reader/full/madison-countys-economic-development-plan-2013 38/192
Exhibit 12. Madison County
UV12
UV46
UV13
UV8
UV12B
UV80
UV20
UV31
UV26
UV26
§̈¦90
Chenango
River
Beaver
Creek
Otselic
Creek
Sangerfield
River
Limestone Creek
Erie Canal
Unadilla
River
Oneida
Creek
Chittenango
Creek
Tuscarora
Lake Eaton
Reservoir Lake
Moraine
Cazenovia
Lake
De Ruyter
Reservoir
SULLIVAN
EATON
BROOKFIELD
LENOX
NELSONCAZENOVIA
LEBANON
MADISON
HAMILTON
FENNER
DERUYTER
LINCOLN
GEORGETOWN
STOCKBRIDGE
SMITHFIELD
ONEIDA
CANASTOTA
HAMILTON
CHITTENANGO
CAZENOVIA
WAMPSVILLE
MORRISVILLE
MUNNSVILLE
MADISON
EARLVILLE
DERUYTER
Oneida
Lake
Exhibit 13. Madison County Population Change
Source: U.S. Census
Madison County Strategic Economic Development PlanPage 38

7/29/2019 Madison County's economic development plan, 2013
http://slidepdf.com/reader/full/madison-countys-economic-development-plan-2013 39/192
Demographic Data
A basic statistic for any community is the size
and dynamic of its population base. A community’s
population inuences numerous economic develop-
ment factors including workforce, demand on public
infrastructure, and size of the local market for goodsand services. The trend in a community’s population
reects multiple underlying conditions related to the
performance of the local and regional economy, the
quality of life, and the relative success of the commu-
nity in dealing with economic transitions.
The population of Madison County has exhibited
growth over the last one hundred years, punctuated by
several periods of rapid growth and relative stability.
The number of Madison County residents remained
nearly constant in the rst half of the century and
started to expand rapidly during the 1950s and 1960s.
More moderate growth in the 1970s led to another
period of stability in the 1980s and 1990s with growth
resuming during the past decade.
As indicated in the prole of Central New York,
the general trend in population in the region has been
stable over the past decade after a 10-year period of
decline from 1985–1995. Madison and Oswego coun-
ties were the only counties in the region to experience
population growth over this period and the gains made
in those communities offset the lack of signicant
growth in the rest of the region.
Current Populaon Esmates
According to the 2010 Census, the Central New
York region experienced a modest 1.4% gain in popu-
lation. Madison County’s growth exceeded that of all
other counties in the region, gaining 5.8% during the
previous decade. The general growth in the region was
a signicant reversal of the previous trend of no or low
growth in the area. The result of this more recent boost
to regional population is that the area’s population has
remained virtually unchanged since 1990.
The two sources of population growth are natural
increases in the existing population (births > deaths)
and net migration. In the case of Madison County’s
above-average growth during this period, it seems
largely due to a robust net migration into the County.
The excess of births over deaths for the County would
have added fewer than 200 residents per year over
the previous decade, assuming they all remained in
Madison County. That would account for only half the
increase in population actually experienced. The bal-
ance of the increase is net migration into the County.
Villages and the City of Oneida accounted for
approximately 45% of the County’s population in 2010
as it had for the previous decade as well. Nine of the
eleven villages and city experienced growth over the
past decade. The Village of Hamilton grew by over 700
residents or more than 20%, the best showing in this
grouping. Overall, village and city population in the
County rose by nearly 7% from 2000 to 2010.
All towns in the County experienced growth over
the past decade. The towns containing the colleges,
Cazenovia, Hamilton, and Eaton exhibited some of the
highest growth. The Town of Sullivan, which contains
the Village of Chittenango, experienced modest growth
as did some of the more rural towns. It is interesting to
note that 53% of the County’s growth stemmed from
population increases in the City of Oneida and the Vil-
lages. The majority of the County’s residents still live
in towns outside villages, but this growth trend reversal
might presage future concentration of the County’s
residents in villages and the City of Oneida.
It is also likely that some of the growth in the west-
ern towns and villages can be attributed to sprawl asthese areas begin to fall into the Syracuse labor shed.
The relatively attractive land prices and tax rates in
Madison County may have pulled residents from the
Onondaga County suburban communities willing to
undertake a somewhat longer commute for more space
and lower living expenses. In fact, it seems likely that
Madison County Economic Development Strategy Page

7/29/2019 Madison County's economic development plan, 2013
http://slidepdf.com/reader/full/madison-countys-economic-development-plan-2013 40/192
some of the growth experienced by the County over
the past two decades is due more to population transfer
within the region than from any organic growth.
The distribution of population follows some pre-
dictable patterns. Approximately half of the County’s
population is located in the Towns of Sullivan and
Lenox and the City of Oneida, along the northern cor -
ridor transportation route between Syracuse and Utica.
This area also contains the Villages of Chittenango and
Canastota. These are the most densely populated areas
of the County concentrating not only half the County’s
population but likely half the County’s workforce as
well. The less densely populated Towns of Cazenovia,
Eaton, and Hamilton, each of which contains a signi-
cant village and, within those villages, a university, are
likely showing the impact of the college communities
and, in the case of Cazenovia, of some of the growth
that has come from Onondaga County.
Populaon Characteriscs
The quantitative population data presented above
are often useful in assessing the potential size or loca-
tion of economic development projects in a commu-
nity. Knowing how large a population base exists and
where it can be accessed is important information for
evaluating the size of a possible market or workforce.
Entrepreneurs considering potential business sites or
other related projects will consider this as primary
information. Qualitative population data are likewise
critical to several areas of business decision-making
and the characteristics and attributes of a given popula-
tion can have a signicant impact on the evaluations
noted above. This information can also cast the basic
population data in different lights and provide a more
nuanced prole of an area.
Exhibit 18 presents basic demographic characteris-
tics about Madison County’s residents and compares
Madison County with its MSA, New York State and
the U.S. Madison County stands outs in several ways:
Exhibit 14. Madison County Population, Villages and City
1990 2000
% Change
Previous
period
2010
% Change
Previous
period
Canastota 4,673 4,425 -5.3% 4,804 8.6%
Cazenovia 3,007 2,640 -12.2% 2,835 7.4%
Chienango 4,734 4,833 2.1% 5,081 5.1%
DeRuyter 568 531 -6.5% 558 5.1%
Earlville* 883 791 -10.4% 872 10.2%
Hamilton 3,790 3,515 -7.3% 4,239 20.6%
Madison 316 315 -0.3% 305 -3.2%
Morrisville 2,732 2,148 -21.4% 2,199 2.4%
Munnsville 438 437 -0.2% 474 8.5%
Oneida 10,850 10,987 1.3% 11,393 3.7%
Wampsville 501 561 12.0% 543 -3.2%
Total Village &
City
32,492 31,183 -4.0% 33,303 6.8%
Source: U.S. Census Bureau
Exhibit 15. Madison County Population, Towns (includes village population)
1990 2000
% Change
Previous
period
2010
% Change
Previous
periodBrookeld 2,225 2,403 8.0% 2,545 5.9%
Cazenovia 6,514 6,481 -0.5% 7,086 9.3%
DeRuyter 1,458 1,532 5.1% 1,589 3.7%
Eaton 5,362 4,826 -10.0% 5,255 8.9%
Fenner 1,694 1,680 -0.8% 1,726 2.7%
Georgetown 888 946 6.5% 974 3.0%
Hamilton 6,221 5,733 -7.8% 6,690 16.7%
Lebanon 1,265 1,329 5.1% 1,332 0.2%
Lenox 8,621 8,665 0.5% 9,122 5.3%
Lincoln 1,669 1,818 8.9% 2,012 10.7%Madison 2,774 2,801 1.0% 3,008 7.4%
Nelson 1,892 1,964 3.8% 1,980 0.8%
Smitheld 1,053 1,205 14.4% 1,288 6.9%
Stockbridge 1,968 2,080 5.7% 2,103 1.1%
Sullivan 14,622 14,991 2.5% 15,339 2.3%
Total Towns 58,226 58,454 0.4% 62,049 6.2%
Source: U.S. Census Bureau
Madison County Economic Development StrategyPage 40
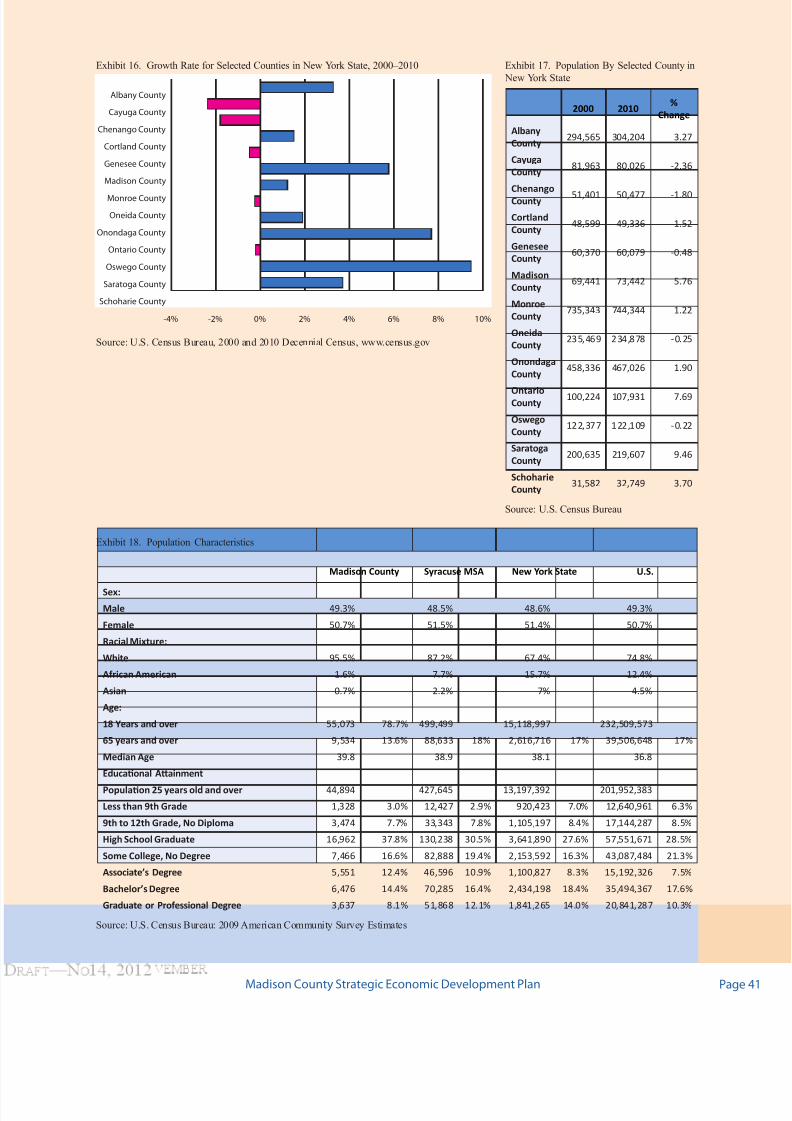
7/29/2019 Madison County's economic development plan, 2013
http://slidepdf.com/reader/full/madison-countys-economic-development-plan-2013 41/192
Exhibit 16. Growth Rate for Selected Counties in New York State, 2000–2010
-4% -2% 0% 2% 4% 6% 8% 10%
Schoharie County
Saratoga County
Oswego County
Ontario County
Onondaga County
Oneida County
Monroe County
Madison County
Genesee County
Cortland County
Chenango County
Cayuga County
Albany County
Source: U.S. Census Bureau, 2000 and 2010 Decennial Census, www.census.gov
Exhibit 17. Population By Selected County in
New York State
2000 2010%
Change
Albany
County294,565 304,204 3.27
Cayuga
County81,963 80,026 -2.36
Chenango
County 51,401 50,477 -1.80
Cortland
County48,599 49,336 1.52
Genesee
County60,370 60,079 -0.48
Madison
County69,441 73,442 5.76
Monroe
County735,343 744,344 1.22
Oneida
County235,469 234,878 -0.25
Onondaga
County458,336 467,026 1.90
OntarioCounty
100,224 107,931 7.69
Oswego
County122,377 122,109 -0.22
Saratoga
County200,635 219,607 9.46
Schoharie
County31,582 32,749 3.70
Source: U.S. Census Bureau
Exhibit 18. Population Characteristics
Madison County Syracuse MSA New York State U.S.
Sex:
Male 49.3% 48.5% 48.6% 49.3%
Female 50.7% 51.5% 51.4% 50.7%
Racial Mixture:
White 95.5% 87.2% 67.4% 74.8%
African American 1.6% 7.7% 15.7% 12.4%
Asian 0.7% 2.2% 7% 4.5%
Age:
18 Years and over 55,073 78.7% 499,499 15,118,997 232,509,573
65 years and over 9,534 13.6% 88,633 18% 2,616,716 17% 39,506,648 17%
Median Age 39.8 38.9 38.1 36.8
Educaonal Aainment
Populaon 25 years old and over 44,894 427,645 13,197,392 201,952,383
Less than 9th Grade 1,328 3.0% 12,427 2.9% 920,423 7.0% 12,640,961 6.3%
9th to 12th Grade, No Diploma 3,474 7.7% 33,343 7.8% 1,105,197 8.4% 17,144,287 8.5%
High School Graduate 16,962 37.8% 130,238 30.5% 3,641,890 27.6% 57,551,671 28.5%
Some College, No Degree 7,466 16.6% 82,888 19.4% 2,153,592 16.3% 43,087,484 21.3%
Associate’s Degree 5,551 12.4% 46,596 10.9% 1,100,827 8.3% 15,192,326 7.5%
Bachelor’s Degree 6,476 14.4% 70,285 16.4% 2,434,198 18.4% 35,494,367 17.6%
Graduate or Professional Degree 3,637 8.1% 51,868 12.1% 1,841,265 14.0% 20,841,287 10.3%
Source: U.S. Census Bureau: 2009 American Community Survey Estimates
Madison County Strategic Economic Development Plan Page

7/29/2019 Madison County's economic development plan, 2013
http://slidepdf.com/reader/full/madison-countys-economic-development-plan-2013 42/192
● It is considerably less racially diverse than New
York State and the U.S. and less than the Syracuse
MSA. However, the lack of racial diversity is not
unique to Madison County within the context of
Upstate New York demographics. A review of the
2010 Census data and the more recent estimates
for other upstate counties indicates that a large
majority of Upstate counties have populations that
are 90–92 percent Caucasian.
● Home-ownership is quite high in the County
compared with other areas, a situation possibly
supported by the much lower median value of the
owner-occupied homes. The median value of these
homes in Madison County was nearly half that of
the U.S. median value and only one-third of the
NYS median value. ● Madison County residents also tend to remain in
the same homes they occupied the year before
to a greater extent than Americans generally and
residents of the MSA but were more mobile than
residents of NYS in general.
● The population of Madison County is somewhat
older than the U.S. median of 36.9 years old and
is equal to the median ages for the Syracuse MSA
and NYS.
A population’s age distribution can be an important
predictor of an area’s potential for economic growth.
Over 40% of Madison County residents are either older
workers or retired. Younger residents, with a presum-
ably exible set of skills, account for approximately
22% of the total population. A gap exists in the next
level as the 18- to 24-year-olds just entering the work -
force cannot adequately replace the next older group in
the workforce. A larger cohort of under–18-year-olds
exists but there is little guarantee they will remain in
the area if well-paying jobs cannot be maintained.
There is clearly a shrinking base of younger resi-
dents and a proportionately smaller distribution in the
25–45 age group as the population ages ( Exhibit 19).
This group provides the bulk of the workforce and the
projected trend is negative for the County, especially
when viewed by companies who might be interested in
expanding into the area but for whom the availability
of workers in this prime cohort is singularly important.
Another key demographic affecting a region’s
economic development prole is the education level of
the potential work force. This demographic measure
reects a workforce’s ability to perform certain types
of work or its capacity to be trained in skills specic
to an employer’s needs. The need for a skilled work -
force drives most economic development decisions in
today’s environment with critical technological skills
becoming increasingly important in many different
business environments.
Exhibit 19. Age Distribution of Madison County Residents as Percentage of Total Population, 2009
0% 5% 10% 15% 20% 25% 30%
USA
Syracuse MSA
Madison County
Under 18
18 to 24
25 to 44
45 to 64
65 & Older
Source: U.S. Census. American Community Survey
Madison County Economic Development StrategyPage 42

7/29/2019 Madison County's economic development plan, 2013
http://slidepdf.com/reader/full/madison-countys-economic-development-plan-2013 43/192
Exhibit 20 summarizes the educational attainment
levels of the County’s 25+ year-old population in com-
parison to the Syracuse MSA, the Utica/Rome MSAand the U.S. Madison County has a relatively well-
educated workforce. The percentage of high school
graduates is signicantly higher than that of all the
areas being compared. However, as one moves higher
on the attainment ladder, Madison begins to lag behind
the Syracuse MSA and the U.S. in the percentage of
the workforce with bachelor or professional degrees.
In comparison to areas that share the labor pool with
Madison County, the educational attainment of Madi-
son County residents is higher then the Utica/Rome
area but lower than the more urban Syracuse MSA.
The presence of three universities, a large hospital
and several high-tech industries in Onondaga County
may explain the high percentage of advanced degrees.
Taken together with the earlier data, Madison County
nds itself in a region whose educated workforce com-
pares favorably on a statewide and national basis.
Additional information relating to the economic
prole of Madison County residents is presented in
the following sections. This information is important
to consider when evaluating an area’s past growth, the
relative well-being of the residents, and its potential as
a center of economic activity.
Per Capita Income
Madison County experienced an above-average
growth in per capita income in the twenty years since
1980, but this growth appears to have subsided during
the decade just ended as shown in Exhibit 21. Since
1980, on a decennial basis, per capita income growth
in Madison County exceeded that of neighboring coun-
ties and exceeded or equaled the growth in U.S. per
capita income.
Median Household Income
Another important measure of economic well-being
is the median household income of a region or area.
Since households are the smallest discrete consumer
entity, the growth in and relative position versus other
areas of median income can be indicative of the eco-
nomic vitality of an area.
According to the data from the three decennial
Census years, Madison County’s median household
income shown in Exhibit 22 was close to the U.S.
median household income, ranging from 95.5% in
1980 to 98.3% in 1990. The median household income
in Madison County also lagged that of Onondaga
County in those years, often by a wider margin. In the
2009 estimate, however, the County’s median house-
hold income is expected to have surpassed both that of
Exhibit 20. Educational Attainment for Residents 25-years and Above, Madison and Neighboring Counties, 2009
0% 5% 10% 15% 20% 25% 30% 35% 40%
Utica MSA
Madison County
Syracuse MSA
US
Grad or Prof Degree
4 Yr College
Some College/2 Yr College
H.S.
Less than H.S.
Source: U.S. Census
Madison County Economic Development Strategy Page

7/29/2019 Madison County's economic development plan, 2013
http://slidepdf.com/reader/full/madison-countys-economic-development-plan-2013 44/192
Onondaga County and of the U.S. In fact, the Madison
County income gure is the highest in the CNY region
according to the Census estimate.
Income Distribuon
As displayed in Exhibit 23, family incomes in Madi-
son County tend to skew toward the middle portions
of income distribution as compared with the Syracuse
MSA and the U.S. Family incomes between $40,000
and $100,000 are much more prevalent in Madison
County while families with incomes below $40,000
and above $100,000 are much less common. Madison
County is a distinctly middle class area.
Exhibit 23. Comparative Family Income Distribution, 2009
0%
5%
10%
15%
20%
25%
US
Syracuse MSA
Madison County
$ 2 0 0
, 0 0 0 +
$ 1 5 0
, 0 0 0 - 2 0 0
, 0 0 0
$ 1 0 0
, 0 0 0 - 1 5 0
, 0 0 0
$ 7 5
, 0 0 0 - 1 0 0
, 0 0 0
$ 6 0
, 0 0 0 - 7 5
, 0 0 0
$ 5 0
, 0 0 0 - 6 0
, 0 0 0
$ 4 0
, 0 0 0 - 5 0
, 0 0 0
$ 2 0
, 0 0 0 - 3 0
, 0 0 0
$ 1 0
, 0 0 0 - 2 0
, 0 0 0
$ 0 - 1 0
, 0 0 0
Source: U.S. Census
Exhibit 21. Per Capita Income for CNY Counties In Unadjusted Dollars
1980 1990 % Change 2000 % Change 2009 (est.) % Change
Cayuga 8,000 15,500 94% 22,702 46% 31,989 41%
Cortland 7,277 14,739 103% 22,044 50% 29,900 36%
Madison 8,009 16,538 107% 25,175 52% 33,113 32%
Onondaga 10,025 19,964 99% 28,772 44% 39,311 37%
Oswego 8,838 15,226 72% 20,404 34% 29,695 45%
Syracuse MSA 9,441 18,841 100% 27,033 43% 36,833 36%
NYS 11,015 23,523 114% 34,898 48% 46 516 33%
U.S. 10,114 19,477 93% 29,847 53% 39,635 33%
Source: BEA—Income gures not adjusted for ination
Exhibit 22. Median Household Income for CNY Counties In
Unadjusted Dollars
1980 1990 2000 2009 (est.)
Cayuga 15,603 27,568 37,487 47,414
Madison 16,091 29,547 40,184 51,670
Cortland 14,248 26,791 34,364 44,853
Onondaga 17,574 31,783 40,847 50,129
Oswego 16,156 29,093 36,598 45,071
NYS 16,647 32,965 43,393 55,233
U.S. 16,841 30,056 41,994 51,425
Source: U.S. Census, Decennial Census & American Fact Finder..
Madison County Economic Development StrategyPage 44

7/29/2019 Madison County's economic development plan, 2013
http://slidepdf.com/reader/full/madison-countys-economic-development-plan-2013 45/192
Poverty Rate
An additional dimen-
sion of the income picture
for an area is the percent-
age of individuals who fall
below the poverty rate. The
Census Bureau uses a set of
money income thresholds
that vary by family size and
composition to determine
who is in poverty. If a fam-
ily’s total income is below
the dened threshold,
then that family and every
individual in it is consid-
ered to be in poverty. The
ofcial poverty thresholds
do not vary geographically,
but they are updated for
ination using the Consumer Price Index (CPI-U). The
ofcial poverty denition uses money income before
taxes and does not include capital gains or noncash
benets (such as public housing, Medicaid, and food
stamps). The NYS graphic depicted in Exhibit 24 com-
pares estimated poverty rates throughout the State on a
county basis for 2008.
Exhibit 25 compares the percentage of individuals
below the poverty level for Madison County, CNY
counties, NYS and the U.S. for 1990, 2000 and 2009.
Madison County compares favorably with other
Central New York counties, NYS, and the U.S. show-
ing a generally lower poverty rate than other areas.
The numbers suggest that Madison County residents
have been enjoying a somewhat higher living standard
compared to their neighbors in the region and to New
Yorkers and U.S. residents in general. However, pov-
erty rates across the State and in the U.S. have been on
the rise, most notably during the past decade. Several
CNY counties have seen their poverty rates surge, and
Madison County is no exception.
Some signicant socioeconomic differences
between Madison County and other areas may have a
role in explaining these results. For example, Madison
County is less urban and less ethnically diverse than
NYS and the U.S. Urban populations and certain ethic
groups often exhibit markedly higher poverty levels
than the population as a whole.
Exhibit 24. Poverty in NYS Counties
Essex
Erie
Lewis
Franklin
Ulster
Hamilton
Oneida
Steuben
Clinton
Herkimer
Delaware
Suffolk
Jefferson
Otsego
Oswego
Warren
Sullivan
Allegany
Orange
Cattaraugus
Cayuga
Tioga
SaratogaWayne
Broome
Ontario
Greene
Chenango
Chautauqua
Dutchess
MonroeFulton
Albany
Onondaga
Madison
Yates
Niagara
Wyoming
Cortland
Genesee
Tompkins
Orleans
Chemung
Schuyler
Montgomery
Putnam
Washington
Columbia
Livingston
Schoharie
RensselaerSeneca
Westchester
NassauQueens
Rockland
Kings
Schenectady
Richmond
BronxNew York
% Population in Poverty
Less than 10%
10 to 13.3%
13.2 to 16.9%
17% or more
Source: NYSDOL
Exhibit 25. Comparative Poverty Rates 1990 - 2009
1990 2000 2009
Madison 9.4 9.6 11.3
Onondaga 8.4 10.8 13.7
Oneida 11.4 12.6 14.4
Cayuga 10.6 11.3 13.5
Oswego 9.9 12.6 14.7
Cortland 11.2 12.9 17.8
NYS 12.3 13.2 14.2
U.S. 12.8 11.3 14.3
Source: U.S. Census, Small Area Income and Poverty Estimates
Madison County Economic Development Strategy Page

7/29/2019 Madison County's economic development plan, 2013
http://slidepdf.com/reader/full/madison-countys-economic-development-plan-2013 46/192
Economic Data
Employment by Sector
The total number of jobs in Madison County is
estimated to equal 20,900 in 2009, including 16,261
private sector jobs. Exhibit 26 indicates which indus-try sectors provided the largest percentage of jobs in
Madison County in 2009 and compares this with the
sectoral shares of MSA and national employment.
Madison County is notable for its divergence from
national averages in several areas. It has a compara-
tively higher labor force participation in educational
services, public administration, and manufacturing
while it lags in information, professional, scientic and
technical services and transportation and warehousing.
The County is unusual in possessing three institutions
of higher learning, which explains the disproportion-
ate presence of private educational services jobs in
the community. The historical long-term presence of
manufacturing in the area is likely the reason for a
larger share for that sector. Some of the lagging sectors
might be partially explained by considering the source
of the data. As noted earlier, the presence of a large
number of “non-employers” is ignored in most BLS
and NYSDOL databases, as these are based on payroll
tax information. In Madison County, 13% of the non-
employers were engaged in the provision of profes-
sional, scientic and technical services; adding them to
the total wage-paying jobs in that sector would produce
a more pronounced sectoral presence for that group.
This is true in several other areas as well, including
construction, transportation and warehousing, and arts,
entertainment and recreation.
There were several shifts among the different
industrial sectors between 2004 and 2009. Exhibit 27
presents numerical and percentage shifts for Madison
County employment and percentage changes for the
corresponding categories at the MSA and national
level. Some of the divergences from national trends
point to professional, scientic and technical profes-
sions and information jobs. The County seems to be
following the general trend of shedding manufacturing
jobs while creating jobs in educational services. The
losses in information and professional, scientic and
technical service may be masked by the non-employer
data factor. Large increases in arts, entertainment and
recreational and in accommodation and food services
may indicate success of efforts to market Madison
County as a tourism destination.
Exhibit 26. Employment Distribution by Industry 2009
Madison CountySyr.
MSAU.S.
Industry # Jobs % % %
Ag., Forest. & Fishing 189 0.9% 0.3% 0.3%
Mining n/a n/a 0.1% 0.5%
Construcon 787 3.8% 3.9% 5.0%
Manufacturing 2249 10.7% 9.4% 9.6%
Wholesale Trade 605 2.9% 4.7% 4.4%
Retail Trade 2590 12.4% 11.5% 11.5%
Trans. & Warehousing 167 0.8% 3.0% 3.9%
Informaon 197 0.9% 1.7% 2.2%
Finance & Insurance 552 2.6% 4.4% 4.4%
Real Estate & Leasing 160 0.8% 1.3% 1.6%
Prof., Scienc & Tech.
Serv.607 2.9% 4.9% 5.8%
Management of
Companies136 0.6% 1.3% 1.5%
Admin. & Support 325 1.6% 4.8% 5.8%
Educaonal Serv. 1777 8.5% 3.5% 9.8%
Health Care & Soc.
Assist.2864 13.7% 13.1% 13.0%
Arts, Entertain. & Rec. 302 1.4% 1.4% 1.5%
Accommod. & Food
Serv.2011 9.6% 7.7% 8.7%
Other Services 683 3.3% 3.3% 2.9%
Government, all levels 4671 22.3% 18.4% 7.6%
Unclass. Estab. 20 0.1% 0.1% 0.0%
Ulies 24 0.1% 1.2% >0.1%
Total 20,916
Source: U.S. Bureau of Labor Statistics, NYSDOL
Madison County Economic Development StrategyPage 46

7/29/2019 Madison County's economic development plan, 2013
http://slidepdf.com/reader/full/madison-countys-economic-development-plan-2013 47/192
Industry Sector Distribuon,
Relave Size and Share of
Employment Exhibit 28 compares the distribution of businesses
in Madison County across the major industry groups
for 2000 and 2008. Madison County’s business sector
is diversied along the lines generally seen in Central
New York. Most notable is the decline in manufactur -
ing and the increase in employment in various services
such as health care, nancial, insurance and real
estate (FIRE), and accommodation and food services.
Another signicant change is the increase in the
number of professional, scientic, and technical ser -
vices. These businesses increased in number by nearly
15% over the period 2000–2008.
Like the rest of the region and the nation as a
whole, most of Madison County’s businesses are
small. According to the Census Bureaus’ County
Business Prole data for 2008, 56.2% of Madison
County’s businesses employ 4 or fewer individuals,
down slightly from 56.4% in 2000. Over three-quarters
(76.7%) of these businesses employed fewer than 9
individuals, down slightly from 77.2% in 2000.
Among Madison County’s top employing private
business sectors in 2008, the size of establishment
varies from sector to sector. Exhibit 30 depicts the
distribution of various - sized establishments by sector.
Health care and manufacturing establishments tend to
be somewhat larger entities while retail establishments
are smaller.
These gures only take into account employers
that pay wages. So-called non-employers, dened
as unincorporated business with no paid employees,annual business receipts of $1,000 or more and subject
to federal income tax account, are not included. If
these businesses were added then both the County’s
top employment sectors and the relative presence of
small businesses in the overall mix would need to be
re-interpreted. In 2008, there were approximately 4,116
such businesses in Madison County, nearly three times
the number of establishments with paid employees.
When all these establishments are combined,
certain industries become more signicant in terms
of job creation and income generation. For example,
construction accounted for 925 jobs in 2008 while non-
employer construction jobs totaled 609 in Madison
County. On a combined basis, construction would have
accounted for approximately 1,534 jobs. By similar
Exhibit 27. Employment Change by Industry 2004 - 2009
Madison County Syr. MSA U.S.
Descripon # Change % Change % Change % Change
Total Jobs -395 -1.9% -1.5% 2.0%
Ag., Forest. &
Fishing33 21.2% 0.2% 0.4%
Mining n/a n/a -16.2% 34.7%
Ulies n/a n/a -17.3% -1.5%
Construcon 72 10.1% -0.5% 5.7%
Manufacturing -483 -17.7% -15.7% -13.0%
Wholesale Trade -82 -11.9% -3.4% 1.9%
Retail Trade -58 -2.2% -4.0% -1.3%
Trans. &
Warehousing1 0.6% 2.3% 0.9%
Informaon -43 -17.9% -26.8% -8.3%
Finance &
Insurance-3 -0.5% 1.7% -1.5%
Real Estate &
Leasing
33 26.0% -3.7% -1.8%
Prof., Scienc &
Tech. Serv.-326 -34.9% 4.9% 14.0%
Management of
Companies-23 -14.5% 4.5% 11.7%
Admin. &
Support-213 -39.6% -4.4% -4.2%
Educaonal Serv. 176 11.0% 5.7% 7.0%
Health Care &
Soc. Assist.62 2.2% 7.8% 13.2%
Arts, Entertain.
& Rec.115 61.5% 7.7% 6.3%
Accommod. &Food Serv. 138 7.4% 2.0% 6.8%
Other Services 57 9.1% -6.7% 1.1%
Public
Administraon216 4.8% 2.9% 5.8%
Unclass. Estab. -25 -55.6% -45.7 0.4%
Source: U.S. Bureau of Labor Statistics
Madison County Economic Development Strategy Page

7/29/2019 Madison County's economic development plan, 2013
http://slidepdf.com/reader/full/madison-countys-economic-development-plan-2013 48/192
Exhibit 28. Madison County Business Establishments by Industry Sector
Industry SectorNo. of Establish-
ments 2000% of Total
No. of Establish-
ments 2008% of Total
% Change,
2000- 2008
Total Establishments 1377 1442 4.7%
Forestry, Fishing, Hunng & Ag. Support 5 0.4% 9 0.6% 80.0%
Construcon 189 13.7% 194 13.5% 2.6%
Manufacturing 67 4.9% 65 4.5% -3.0%
Wholesale Trade 55 4.0% 39 2.7% -29.1%
Retail Trade 242 17.6% 223 15.5% -7.9%
Transportaon/Warehousing 26 1.9% 31 2.1% 19.2%
Finance & Insurance 59 4.3% 71 4.9% 20.3%
Real Estate & Leasing 42 3.1% 51 3.5% 21.4%
Professional, Scienc & Tech Services 108 7.8% 124 8.6% 14.8%
Health Care & Social Assistance 135 9.8% 157 10.9% 16.3%
Accommodaon & Food Services 156 11.3% 166 11.5% 6.4%
Other Services (not Pub. Admin.) 147 10.7% 144 10.0% -2.0%
Other 151 11.0% 177 12.3% 17.2%
Source: U.S. Census, County Business Patterns
Exhibit 29. Top Ten Private Employers in 2008 (including non-employer rms), by Sector*, Madison County
Sector Jobs Wages & Receipts % NonEmp
Health Care & Social Assistance 3,195 $106,524,796 11%
Retail Trade 3,085 83,305,369 17%
Manufacturing 2,740 114,919,335 4%
Accommodaon & Food Service 2,100 28,104,387 3%
Educaonal Services 1,891 77,345,250 7%
Construcon 1,528 65,510,428 42%Other Services 1,272 33,380,734 42%
Professional, Scienc & Tech. Service 1,255 49,692,084 46%
FIRE 1,048 84,053,986 33%
Wholesale Trade 727 45,497,964 12%
Total, All Sectors 25,651 16%
* Assumes Non-Employer establishment = 1 job.
Source: U.S. Census, NYSDOL
Exhibit 30. Sizes of Top Madison County Businesses in 2008 as Related to Employment Sector
Sector Total Establishments 1–4 5–9 10–19 20–49 50–99 100–249 250+
Health Care 157 51 41 37 22 1 3 2
Manufacturing 65 23 10 8 9 7 5 3
Retail Trade 223 95 66 39 13 5 4 1
Accom.&Food 166 77 30 29 22 6 2 0
Ed. Services 17 6 4 3 2 0 0 2
Source: U.S. Census, County Business Patterns
Madison County Strategic Economic Development PlanPage 48

7/29/2019 Madison County's economic development plan, 2013
http://slidepdf.com/reader/full/madison-countys-economic-development-plan-2013 49/192
estimates, retail trade jobs would increase to over
3,000, professional and technical services to 1,276
and jobs in the FIRE sectors to over 1,050, indicat-
ing a more signicant presence of these industries in
Madison County’s economy than would otherwise
be expected utilizing payroll-based gures alone.
Exhibit 29 summarizes the top ten employers in the
County by sector and the combined wages/receipts
generated in each sector.
Exhibit 32 indicates how the non-employer busi-
nesses in Madison County are concentrated by industry
sector. While this distribution resembles that of wage-
paying employers, there is a smaller representation
of businesses in those sectors where scale is an issue,
such as manufacturing, and a greater representation
among those industries where a self-employed indi-
vidual might be able to operate effectively, such as
construction or the professional, scientic and techni-
cal service elds.
If approximately 4,116 non-employers were added
to the 1,442 establishments reported in 2008 as wage
paying employers, nearly 89% of Madison County’s
business establishments would employ four or fewer
individuals. By comparison, such microenterprises
represent 84% and 86% of all businesses in Onondaga
and Oneida Counties, respectively. The rate is 88% for
the U.S. as a whole while New York, which is second
only to Florida in percentage of microenterprises, has a
rate of 90%.
The data on microenterprise employment and non-
employers underscore the importance of small busi-
nesses to the Madison County economy. According
to the Association for Enterprise Opportunity (AEO),a national member-based organization dedicated to
microenterprise development, from 2000 to 2003, total
micro-business employment in rural areas of New York
State grew by 6% while non-farm private employ-
ment was stable. The non-employer sector in Madison
County experienced a 5% growth between 2002 and
2006 while overall private employment grew at a
more modest 2.7%. Over the longer period of 2000 to
2008, private employment in Madison County actually
shrank.
Large employers continue to be a signicant factor
in Madison County. Public employment is the largest
employment sector in the County with 4,671 employ-
ees, representing 22% of all wage-earning jobs in
2009. Local government employment accounts for
3,714 of these workers and nearly half (1,840) of these
local government employees are teachers or staff of
local school districts. According to D&B, there were
23 Madison County employers in 2008 employing
more than 100 people and their total employment
was 5,586, about 26% of the wage earning workforce
of 21,547. The three colleges, Colgate, Morrisville
and Cazenovia accounted for 1,500 employees while
hospital and nursing home employers accounted for
approximately 1,400 workers. Manufacturers, which
have tended toward larger establishments than other
sectors, have seven rms with 100+ employees, with a
total sector employment of 1,330.
Exhibit 33 indicates some of the changes that
have taken place in Madison County’s workforce and
sectoral employment over the past ve years. There
has been growth in public education and educational
services employment since 2005. Private sector jobs in
manufacturing and professional, scientic and manage-
ment elds, however, have declined during the period.
Manufacturers in particular have been hard hit, shed-
ding over 500 jobs over the period.
A longer view of sectoral changes in Madison
County’s employment structure is shown in Exhibit 34.Here, changes in jobs and wages in the larger employer
sectors in the County are shown over the past decade.
Signicant job gains in public education are notable
and, although the absolute number of jobs has declined
in manufacturing and health care, substantial increases
in wages in these sectors have taken place.
Madison County Economic Development Strategy Page

7/29/2019 Madison County's economic development plan, 2013
http://slidepdf.com/reader/full/madison-countys-economic-development-plan-2013 50/192
Exhibit 31. Madison County Businesses by Number of Employees, 2008
0 200
1000 or more: 0.07% (1)
500-999: 0.14% (2)
250-499: 0.35% (5)
100-249: 1.39% (20)
50-99: 2.01% (29)
20-49: 6.73% (97)
10-19: 12.69% (183)
5-9: 20.46% (295)
1-4: 56.17% (810)
800
Source: U.S.:Census
Exhibit 32. Unincorporated Business Firms in Madison County, 2008
Segment Number of Firms Receipts ($1,000)
Total for all sectors 4,116 $196,482
Agriculture, forestry, shing and hunng 86 $2,484
Mining, quarrying, and oil and gas extracon n/a n/a
Ulies 3 $23
Construcon 609 $28,423
Manufacturing 104 $6,710
Wholesale trade 87 $10,250
Retail trade 535 $22,210
Transportaon and warehousing 111 $10,186
Informaon 46 $1,513
Finance and insurance 102 $43,974
Real estate and rental and leasing 240 $14,391
Professional, scienc, and technical services 572 $22,631
Administrave and support and waste management and remediaon services 305 $5,104
Educaonal services 122 $1,056
Health care and social assistance 349 $7,857
Arts, entertainment, and recreaon 242 $3,002
Accommodaon and food services 62 $1,413
Other services (except public administraon) 535 $14,996
Source: U.S. Census Bureau
Madison County Strategic Economic Development PlanPage 50

7/29/2019 Madison County's economic development plan, 2013
http://slidepdf.com/reader/full/madison-countys-economic-development-plan-2013 51/192
Exhibit 33. Workforce and Employment in Madison County, 2005–2009
1990 2000 2005 2009 % Change
Labor Force (Total) 36,100 35,600 -1.4%
Employed 34,300 33,000 -3.8%
Unemployed 1,900 3,000 57.9%
Total, All Industries 21,313 20,932 -1.8%
Total, All Private 16,842 16,261 -3.4%
Agriculture, Forestry Fishing, Hunng 170 189 11.2%
Construcon 735 787 7.1%
Manufacturing 2,782 2,249 -19.2%
Wholesale Trade 716 605 -15.5%
Retail Trade 2,591 2,590 0.0%
Transportaon & Warehousing 146 167 14.4%
Informaon 226 197 -12.8%
Finance and Insurance, Real Estate, Rental and Leasing 705 712 1.0%
Professional, Scienc, Management, Administrave 1,403 1,068 -23.9%
Educaon - private 1,673 1,777 6.2%
Health Care and Social Services 2,791 2,864 2.6%
Arts, Entertainment, Accommodaon, Food Services 2,162 2,313 7.0%
Other Services 627 683 8.9%
Government, including public schools 4,471 4,671 4.5%
Source: NYS Department of Labor
Exhibit 34. Changes in Employment and Wages by Selected Sectors in Madison County, 2000–2009
2000 2009
Sector Jobs Av. Wages Jobs Av. Wages % Ch. Jobs % Ch. Wages
All
Government4,188 $30,450 4,671 $35,752 11.5% 17.4%
Federal 112 33,849 155 $43,469 3.8% 28.4%
State 826 40,650 802 $41,025 -3.0% >1%
Local 3,250 27,741 3,714 $34,291 14.3% 23.6%
Educaonal
Services1,512 $32,814 1,777 $44,770 17.5% 36.4%
Health Care 2,893 $21,445 2,864 $35,147 -1.0% 63.9%
Manufacturing 2,970 $32,130 2,249 $41,422 -24.3% 28.9%
Source: NYS Department of Labor
Madison County Strategic Economic Development Plan Page
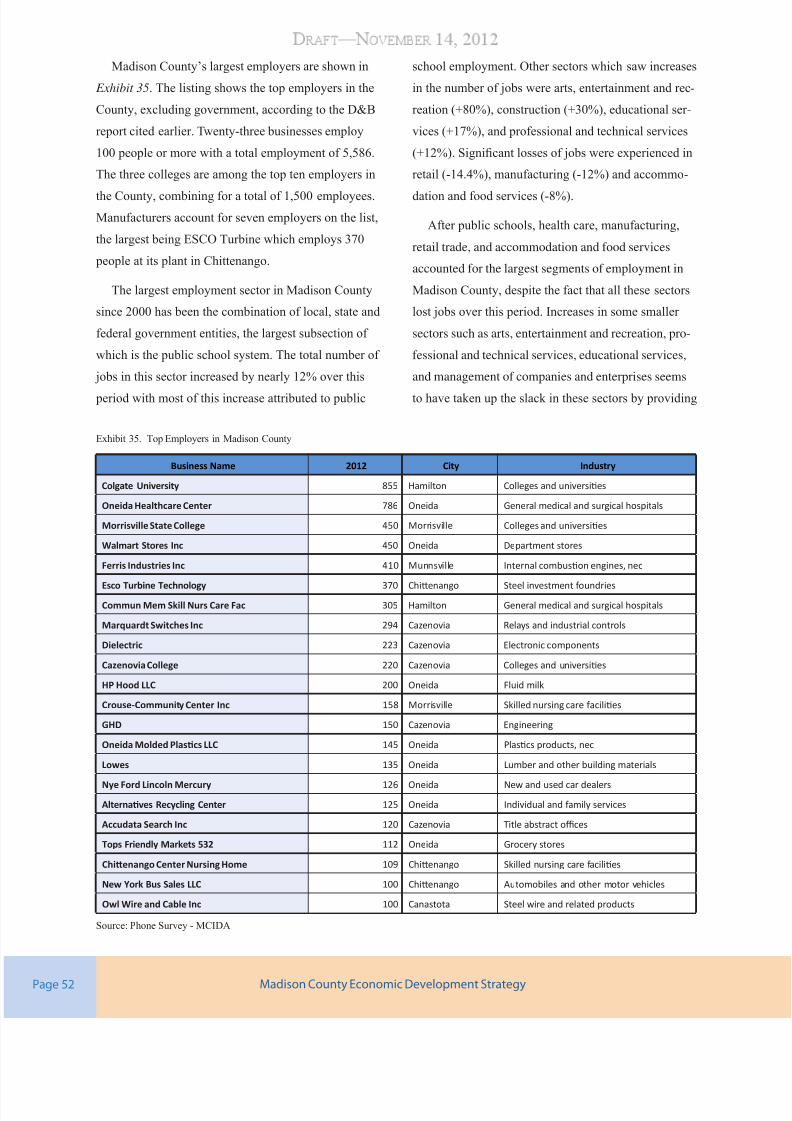
7/29/2019 Madison County's economic development plan, 2013
http://slidepdf.com/reader/full/madison-countys-economic-development-plan-2013 52/192
Madison County’s largest employers are shown in
Exhibit 35. The listing shows the top employers in the
County, excluding government, according to the D&B
report cited earlier. Twenty-three businesses employ
100 people or more with a total employment of 5,586.
The three colleges are among the top ten employers in
the County, combining for a total of 1,500 employees.
Manufacturers account for seven employers on the list,
the largest being ESCO Turbine which employs 370
people at its plant in Chittenango.
The largest employment sector in Madison County
since 2000 has been the combination of local, state and
federal government entities, the largest subsection of
which is the public school system. The total number of
jobs in this sector increased by nearly 12% over this
period with most of this increase attributed to public
school employment. Other sectors which saw increases
in the number of jobs were arts, entertainment and rec-
reation (+80%), construction (+30%), educational ser -
vices (+17%), and professional and technical services
(+12%). Signicant losses of jobs were experienced in
retail (-14.4%), manufacturing (-12%) and accommo-
dation and food services (-8%).
After public schools, health care, manufacturing,
retail trade, and accommodation and food services
accounted for the largest segments of employment in
Madison County, despite the fact that all these sectors
lost jobs over this period. Increases in some smaller
sectors such as arts, entertainment and recreation, pro-
fessional and technical services, educational services,
and management of companies and enterprises seems
to have taken up the slack in these sectors by providing
Exhibit 35. Top Employers in Madison County
Business Name 2012 City Industry
Colgate University 855 Hamilton Colleges and universies
Oneida Healthcare Center 786 Oneida General medical and surgical hospitals
Morrisville State College 450 Morrisville Colleges and universies
Walmart Stores Inc 450 Oneida Department stores
Ferris Industries Inc 410 Munnsville Internal combuson engines, nec
Esco Turbine Technology 370 Chienango Steel investment foundriesCommun Mem Skill Nurs Care Fac 305 Hamilton General medical and surgical hospitals
Marquardt Switches Inc 294 Cazenovia Relays and industrial controls
Dielectric 223 Cazenovia Electronic components
Cazenovia College 220 Cazenovia Colleges and universies
HP Hood LLC 200 Oneida Fluid milk
Crouse-Community Center Inc 158 Morrisville Skilled nursing care facilies
GHD 150 Cazenovia Engineering
Oneida Molded Plascs LLC 145 Oneida Plascs products, nec
Lowes 135 Oneida Lumber and other building materials
Nye Ford Lincoln Mercury 126 Oneida New and used car dealers
Alternaves Recycling Center 125 Oneida Individual and family services
Accudata Search Inc 120 Cazenovia Title abstract oces
Tops Friendly Markets 532 112 Oneida Grocery stores
Chienango Center Nursing Home 109 Chienango Skilled nursing care facilies
New York Bus Sales LLC 100 Chienango Automobiles and other motor vehicles
Owl Wire and Cable Inc 100 Canastota Steel wire and related products
Source: Phone Survey - MCIDA
Madison County Economic Development StrategyPage 52

7/29/2019 Madison County's economic development plan, 2013
http://slidepdf.com/reader/full/madison-countys-economic-development-plan-2013 53/192
enough job opportunities to result in almost a static
number of jobs (actual loss of approximately 190 jobs)
for the County during this period.
Much of the County’s economic activity takes place
in the northern part of the County as evidenced by the
concentration of the County’s main employers here. Of
the 102 county employers with 25 or more employees,
56% are located in the 13037/13032 and 13421 zip
codes (Chittenango, Canastota and Oneida). Another
16% are located in Cazenovia along the County’s west-
ern border with Onondaga County.
Workforce
Size of the Workforce
Exhibit 36 tracks several data points for the Madi-
son County workforce. The size of workforce has been
remarkably stable, growing by only 3.7% over the
nearly–20-year period covered. The size of the work -
force in the Syracuse MSA over the same period stayed
essentially the same: 335,900 in 1990 to 335,700 in
August 2009.
A workforce of 36,600 represents approximately
52% of the total population of Madison County. This
is a relatively high participation rate and one that sug-
gests a motivated and hard-working workforce.
Unemployment
Historical unemployment data are presented in
Exhibit 37 for Madison County and neighboring
counties sharing the labor pool, as well as the MSA,
state and nation. Madison County’s connectedness to
the region is visible in the close correlation between
its unemployment rate and that of its neighbors and
region.
Exhibit 36. Average Annual Civilian Labor Force, Non-Agricultural
Employment and Unemployment Rate, Size of Labor Force and the
Unemployment Rate for Madison County
YearLabor
Force
%
ChangeEmployed
%
Change
Unem-
ployment
Rate
1990 35,300 33500 5
1995 35,200 -0.28% 33,100 -1.19% 5.8
2000 35,100 -0.28% 33,700 1.81% 3.8
2005 36,200 2.85% 34,300 1.78% 5.2
2006 36,100 -0.27% 34,400 0.29% 4.7
2007 36,100 0.00% 34,400 -0.29% 4.7
2008 36,400 0.80% 34,300 0.00% 5.8
2009 36,000 -1.1% 33,000 -3.8% 8.3
Source: NYS Department of Labor
Exhibit 37. Unemployment Rates for Selected Areas
2000 2001 2002 2003 2004 2005 2006 2007 2008 2009
Chenango 4 4.5 5.4 5.9 5.6 5 5 5 6.5 8.9
Madison 3.8 4.5 5.3 5.6 5.6 5.2 4.7 4.7 5.8 8
Oneida 3.9 4.6 5.3 5.5 5.2 4.8 4.4 4.3 5.5 7.4
Onondaga 3.5 4 4.9 5.1 5.1 4.5 4.4 4.1 5.3 7.6
Syracuse
MSA3.8 4.3 5.3 5.6 5.5 4.9 4.7 4.5 5.7 8
NYS 4.5 4.9 6.2 6.4 5.8 5 4.6 4.5 5.4 8.4
U.S. 4 4.7 5 6 5.5 5.1 4.6 4.6 5.8 9.3
Source: NYS Department of Labor, U.S. Bureau of Labor Statistics
Madison County Economic Development Strategy Page

7/29/2019 Madison County's economic development plan, 2013
http://slidepdf.com/reader/full/madison-countys-economic-development-plan-2013 54/192
Educaonal Aainment
A review of the Madison County workforce indi-
cates that the resident population 25 years old and
older are relatively well-educated by national, state and
regional standards. The static picture of educational
attainment did not include some of the dynamic trends
that could impact the County’s job creation efforts in
certain sectors.
One such trend is the apparent decline in the
number of educated workers coming up from younger
age cohorts. Exhibit 38 looks at educational attainment
by age group for the year 2000. All three counties in
Madison County’s “job marketplace” show declines
in the number of workers with high school diplomas
versus 1990 for the youngest three age groupings. Thedecline in Oneida County is particularly pronounced.
As previously younger groups have aged, improve-
ments over their 1990 rates are evident. However, this
improvement in the local workforce seems to have
halted in the decade from 1991–2000. Fewer of those
in the local workforce in the age range 19–44 have HS
diplomas. This could be due to migration of younger
people and/or the concurrent reduction in the types
of jobs which would attract or require those levels of
education.
In the four age groupings comprising the workforce,
the percentage of the workers with a bachelor degree
or higher is signicantly higher in Onondaga County
in each subgroup, likely reecting the concentration
of certain higher level jobs there. The higher rates of
bachelor degrees among the younger workforce in
Onondaga County might indicate the ability of the
County to attract or concentrate younger, well-edu-
cated workers through the presence of larger private
sector rms and their attendant business services such
as attorneys, accountants, etc., the concentration of the
region’s health care providers and a large university.
According to the NYSDOL, the workforce in
Madison County increased by 3.1% from 1990—2008,
representing a gain of 1,100 workers over the 18–
year-long period. In Madison County, the number of
employed hovered between a low of 33,000 and a high
of 34,400, reached in 2007. In general, it is a stagnant
job market. Some workers no doubt found employ-
ment in surrounding areas, lling gaps in the declining
resident workforces of the Syracuse and Utica/Rome
MSA’s.
Wages in Madison County
Of interest to many economic development ofcials
and businesses are the wages demanded by the work -
force for particular types of jobs. Local ofcials would
like to be competitive with other regions, but at the
same time attract high paying jobs to the area. Busi-
nesses are looking for skilled labor, but at wage rates
that allow them to compete in national and sometimes
international markets.
Exhibit 39 summarizes the change in total wages
paid in the County and the average wage paid. Overall
wages paid and average wages increased in Madison
County over the past decade with a noticeable drop
off in 2009 of total wages paid and a slowdown in the
growth of average wages, a likely result of the reces-
sion that took hold during 2008–09. Given the relative
stagnation in labor force growth during this period,
most of the gross payroll amount increase is due to an
increase in average wages. These increased 33% over
the period while the gross payroll amount increased by
28%. The Madison County workforce increased 3.6%
during this time while the regional labor force was
stagnant.
As noted earlier, in addition to the availability of relevant skill sets, businesses looking to locate or
expand into an area are also seeking competitive wage
levels that will enable them to be viable in the market-
place. Exhibit 40 compares Madison County, MSA and
U.S. average annual wages from several key industrial
categories. These wages are averaged across numerous
Madison County Economic Development StrategyPage 54

7/29/2019 Madison County's economic development plan, 2013
http://slidepdf.com/reader/full/madison-countys-economic-development-plan-2013 55/192
E x h i b i t 3 8 . E d u c a t i o n a l A t t a i n m e n t
2 0 0 0 . A g e s 1 8 – 2 4
P e r c e n t w / H
i g h
S c h o o l D i p l o m a
C h a n g e f r o m
1 9 9 0 ( % )
L e s s t h a n 9 t h
g r a d e
9 t h t
o 1 2 t h
g r a d
e , n o
d i p l o m a
H i g h s c h o o l
g r a d u a t e
S o m e c o l -
l e g e , n o
d e g r e e
A s s o c i a
t e
d e g r e e
B a c h e l o r ’ s
d e g r e e
G r a d u a t e o r
p r o f . d e g r e e
T o t a l a g e
g r o u p
% H S g r a d
o r h i g h e r
% B a c h e l o r ’ s
o r h i g h e r
M a d i s o n C o u n t y
8 5 . 3
- 0 . 5
8 6
1 , 1 3 0
2 , 0 4 6
4 , 0 7 6
5 3 7
3 9 5
1 9
8 , 2 8
9
8 5 . 3 %
5 . 0 %
O n o n d a g a C o u n t y
8 1 . 4
- 1 . 8
5 0 4
7 , 5 8 2
1 0 , 0 1 8
1 7 , 5 6 4
2 , 3 6 3
5 , 0 1 1
3 3 6
4 3 , 3 7
8
8 1 . 4 %
1 2 . 3 %
O n e i d a C o u n t y
7 2 . 9
- 5 . 8
5 9 1
4 , 9 1 1
5 , 1 5 7
6 , 8 2 4
1 , 6 1 6
1 , 1 2 0
8 0
2 0 , 2 9
9
7 2 . 9 %
5 . 9 %
2 0 0 0 . A g e s 2 5 – 3 4
M a d i s o n C o u n t y
8 8 . 1
- 0 . 8
1 7 4
7 5 8
2 , 4 7 2
1 , 5 7 9
1 , 1 4 4
1 , 2 2 7
4 6 5
7 , 8 1
9
8 8 . 1 %
2 1 . 6 %
O n o n d a g a C o u n t y
8 9 . 5
- 0 . 9
1 , 0 3 1
5 , 1 3 4
1 3 , 8 2 4
1 0 , 9 7 9
7 , 9 1 6
1 3 , 2 2 2
6 , 5 3 5
5 8 , 6 4
1
8 9 . 5 %
3 3 . 7 %
O n e i d a C o u n t y
8 0 . 9
- 5 . 2
1 , 1 4 3
4 , 3 9 7
8 , 6 6 1
6 , 0 1 3
3 , 6 5 0
3 , 7 0 8
1 , 4 8 6
2 9 , 0 5
8
8 0 . 9 %
1 7 . 9 %
2 0 0 0 . A g e s 3 5 – 4 4
M a d i s o n C o u n t y
8 8 . 9
- 1 . 8
2 5 7
1 , 0 0 1
3 , 6 3 2
2 , 1 3 2
1 , 6 3 6
1 , 6 5 6
1 , 0 1 0
1 1 , 3 2
4
8 8 . 9 %
2 3 . 5 %
O n o n d a g a C o u n t y
9 0 . 9
- 0 . 4
1 , 1 3 7
5 , 6 4 4
2 0 , 3 6 0
1 4 , 0 9 2
1 0 , 3 1 6
1 3 , 5 7 4
9 , 1 8 5
7 4 , 3 0
8
9 0 . 9 %
3 0 . 6 %
O n e i d a C o u n t y
8 4 . 7
- 3 . 5
1 , 3 1 6
4 , 4 2 1
1 1 , 8 4 9
7 , 6 1 3
4 , 7 6 1
4 , 5 2 1
2 , 9 0 0
3 7 , 3 8
1
8 4 . 7 %
1 9 . 9 %
2 0 0 0 . A g e s 4 5 – 6 4
M a d i s o n C o u n t y
8 4 . 9
8 . 7
5 3 6
1 , 8 7 3
5 , 3 7 5
2 , 9 0 8
1 , 6 2 1
1 , 9 9 6
1 , 6 2 8
1 5 , 9 3
7
8 4 . 9 %
2 2 . 7 %
O n o n d a g a C o u n t y
8 8 . 7
9 . 9
2 , 8 7 3
8 , 5 2 2
2 8 , 3 7 1
1 9 , 9 6 9
9 , 7 3 4
1 6 , 1 7 0
1 4 , 9 2 4
1 0 0 , 5 6
3
8 8 . 7 %
3 0 . 9 %
O n e i d a C o u n t y
8 4 . 5
8 . 3
2 , 6 2 4
5 , 6 9 5
1 7 , 3 5 9
1 1 , 3 2 3
5 , 0 4 7
6 , 2 9 1
5 , 2 0 5
5 3 , 5 4
4
8 4 . 5 %
2 1 . 5 %
2 0 0 0 . A g e s 6 5 +
M a d i s o n C o u n t y
6 9
1 2 . 7
8 1 4
1 , 8 7 8
3 , 0 4 0
1 , 1 6 1
3 1 6
7 6 8
7 0 5
8 , 6 8
2
6 9 . 0 %
1 7 . 0 %
O n o n d a g a C o u n t y
7 1 . 3
1 2 . 9
6 , 3 8 9
1 1 , 8 2 8
2 3 , 8 5 4
8 , 4 4 8
1 , 8 9 2
6 , 1 5 9
4 , 8 3 2
6 3 , 4 0
2
7 1 . 3 %
1 7 . 3 %
O n e i d a C o u n t y
6 4 . 8
1 4 . 4
5 , 8 7 6
7 , 8 0 9
1 3 , 8 7 9
5 , 1 0 4
1 , 2 3 4
2 , 7 1 8
2 , 2 4 3
3 8 , 8 6
3
6 4 . 8 %
1 2 . 8 %
S o u r c e : V a r i o u s — N Y S E d u c a t i o n D
e p a r t m e n t , R o c h e s t e r D e m o c r a t a n d C h r o n i c l e “ R o c D o c s ” o n S A T s c o r e s
Madison County Strategic Economic Development Plan Page

7/29/2019 Madison County's economic development plan, 2013
http://slidepdf.com/reader/full/madison-countys-economic-development-plan-2013 56/192
subsectors and so are not reective of any particular
type of job within that sector. But even this high level
comparison offers some insights into where Madison
County may offer a business a competitive advantage
in labor costs.
Madison County wages lag the national average in
most sectors but are noticeably higher in areas such as
transportation and warehousing, nance and insurance,
professional, scientic and technical services, and
accommodation and food services. These segments in
particular seem to have potential for Madison County
because of other inherent characteristics, such as an
advantageous location, tourism and retail development
efforts, and existing workforce assets.
Exhibit 40. Comparative Average Annual Wages by Sector, 2009
0 10000 20000 30000 40000 50000 60000 70000 80000
US Mean Annual Salary
Madison Cty. Average Wage
Accommod. & Food Service
Health Care & Social Assist.
Educational Services
Professional, Scientic & T ech
Finance & Insurance
T ransportation & Warehousing
Retail T rade
Wholesale T rade
Manuf acturing
Construction
Agriculture, Forestry, Fishing
Source: NYS Department of Labor and U.S. Bureau of Labor Statistics
Exhibit 39. Annual Payroll in Madison County - All Industries
Year Payroll (‘000’s) % Change Average Wages % Change
2000 $548,354 $25,273
2003 $592,142 8% $28,739 13.7%
2006 $643,400 8.6% $29,871 3.9%
2007 $679,688 5.6% $31,231 4.5%
2008 $713,902 5.0% $33,151 6.1%
2009 $703,020 (1.5%) $33,586 1.3%
Source: NYS Department of Labor
Madison County Economic Development StrategyPage 56

7/29/2019 Madison County's economic development plan, 2013
http://slidepdf.com/reader/full/madison-countys-economic-development-plan-2013 57/192
Commung Paerns
For the past thirty years, Madison County has
exhibited a consistent pattern of lling jobs for
approximately half of its working age residents while
approximately half the working age residents found
employment in neighboring counties, principally inOneida and Onondaga counties. Madison County
residents are part of two labor pools that support the
economies of the Syracuse and Utica MSA’s.
According to the Bureau of Economic Analysis,
U.S. Department of Commerce, nearly 51% of Madi-
son County workers lled positions within the County
while over 32% worked in Onondaga County and
nearly 12% found jobs in Oneida County. None of the
other 25 NY counties represented registered above 2%
of Madison County’s workforce.
Alternatively, Oneida and Onondaga County sent
nearly 6,000 commuters into Madison County in 2000.
Over 3,800 Oneida County residents went to work in
Madison County that year, 100 more than travelled in
the opposite direction. In 2000, outbound commuters
exceeded inbound commuters by 8,142 which is the
difference between the number of working age resi-
dents (31,752) and the number of jobs being performed
in Madison County by both residents and non-residents
(23,610) (see Exhibit 41 and Exhibit 42).
Exhibit 44 shows that Madison County residents
who worked in Oneida and Onondaga Counties lled
slightly over 14,000 jobs. The main categories of jobs
lled by these commuters were in services (28%),
manufacturing (19%), wholesale and retail trades
(15%), Information and FIRE (10%) and state and
local government (10%).
In the two main destination counties of Onondaga
and Oneida, the average wage paid in these sectors
ranged from a high of $45,533 for manufacturing posi-
tions in Onondaga County to a low of $24,330 for a
position in services in Oneida County ( Exhibit 45).
Madison County lled more than 7,400 jobs with
commuters from other counties, principally Oneida
and Onondaga, whose residents accounted for 88% of
the inow. More than half of these jobs were in either
manufacturing or services. State and local government
Exhibit 41. Madison County Residents Commuting to Other Counties
(2000):
County of Work Total% of
Workforce*
% of
Commuters
Onondaga 10,290 32.4 66.0
Oneida 3,715 11.7 23.8
Chenango 613 1.9 3.9
All Others 960 3.0 6.2
Total OutboundCommuters 15,578
*Total Resident Workforce = 31,752 of which 16,174 remain in-county
Source: U.S. Department of Commerce, Bureau of Economic Analysis
Exhibit 42. Commuters to Madison County from Other Counties
(2000):
County of
ResidenceTotal
% of
Workforce*
% of
Commuters
Onondaga 2,064 8.7 27.7
Oneida 3,849 16.3 51.8
Chenango 682 2.8 9.2
All Others 841 3.6 11.3Total Inbound
Commuters7,436
*Total In-County Workforce = 16,174 resident + 7,436 commuters =
23,610
Source: U.S. Department of Commerce, Bureau of Economic Analysis
Exhibit 43. Largest Madison County Employment Sectors, by Residence of Worker, 2000
Sector # of JobsFilled by County
Resident%
Filled by
Commuter%
Services 7958 5605 70 2353 30
State & Local Gov’t 3923 2625 67 1298 33
Manufacturing 3496 1960 56 1536 44
Wholesale & Retail 2831 1890 67 941 33
Source: U.S. Department of Commerce, Bureau of Economic Analysis
Madison County Economic Development Strategy Page

7/29/2019 Madison County's economic development plan, 2013
http://slidepdf.com/reader/full/madison-countys-economic-development-plan-2013 58/192
Exhibit 44. Madison County Residents Leaving for Work, 2000
Desnaon/ Employment Sector Onondaga County Oneida County Other Desnaon Total by Sector % of Total Commuters
Forestry/Fishing/Ag 105 45 20 170 1%
Uls./Trans./Warehousing 530 80 77 687 4.4%
Construcon 645 150 144 939 6%
Manufacturing 1,810 905 258 2,973 19%
Wholesale/Retail Trade 1,685 420 176 2,281 14.6%
Info./FIRE 1,165 220 167 1,552 10%
Services 2,740 1,200 414 4,354 27.9%
Private Households 10 0 0 10 ~
Fed. Gov. & Military 235 50 30 315 2%
State and Local Gov’t 985 490 186 1,661 10.7%
Other 380 155 101 636 4%
Totals by Desnaon 10,290 3,715 1,573 15,578
Source: U.S. Department of Commerce, Bureau of Economic Analysis
Exhibit 45. Comparative Wages in Largest Employment Sectors, 2000
Sector In-County Wage Onondaga Wage +/- % Oneida Wage +/- %
Services 20,268 32,929 + 62 24,337 + 20
State and Local Gov’t 28,176 38,098 + 35 37,963 + 35
Manufacturing 30,531 45,533 + 49 37,695 + 23
Wholesale & Retail 21,052 38,246 + 82 27,283 + 30
Source: U.S. Department of Commerce, Bureau of Economic Analysis
Exhibit 46. Non-Residents Working in Madison County, 2000
Origin/Employment Sector Onondaga County Oneida County Other Origin Total by Sector % of Total Commuters
Forestry/Fishing/Ag 40 30 30 100 1.3%
Uls./Trans./Warehousing 20 45 43 108 1.5%
Construcon 140 95 60 278 3.7%
Manufacturing 445 835 256 1536 20.7%
Wholesale/Retail Trade 220 630 91 941 12.7%
Info./FIRE 55 210 58 323 4.3%
Services 630 1245 478 2353 31.6%
Private Households 4 4 ~
Fed. Gov. & Military 4 90 8 102 1.4%
State and Local Gov’t 425 505 368 1298 17.5%
Other 85 160 131 376 5.1%
Totals by Origin 2064 3849 1523 7436
Source: U.S. Department of Commerce, Bureau of Economic Analysis
Madison County Strategic Economic Development PlanPage 58

7/29/2019 Madison County's economic development plan, 2013
http://slidepdf.com/reader/full/madison-countys-economic-development-plan-2013 59/192
and the wholesale/retail trade were also main job sec-
tors for inbound commuters (see Exhibit 46 ).
As a result of these commuting patterns, Madison
County had a net ow of earnings of $440,930,000 in
2000. That is, more County residents earned wages
working outside of the County than non-residents were
paid for their jobs in Madison County. By contrast,
Onondaga and Oneida counties’ net ow of earnings
balances are typically negative, indicating a large
inow of commuters. This is likely due in large part
to the existence of two large cities in these counties
which have acted as “job magnets”.
As can be seen, a signicant portion of each sector’s
workforce is drawn from the surrounding counties. The
numbers alone are not so large that these jobs could
not have been lled by residents of the County. In fact,
4,354 residents left to work outside the County in ser -
vices, in state and local government - 1661, in manu-
facturing—2,973 and in wholesale and retail—2,281.
Of interest are the reported discrepancies in average
wages between residents working in-county and those
who travel to one of the major destination counties to
work in a similar job.
It would appear that wages paid in the two main
magnet counties are substantially higher than what
is offered from Madison County employers and this
could partially explain the job drain. Average Madison
County wages paid in the top four employment sectors
are considerably lower than those paid in the same
sectors in Oneida and Onondaga counties. This could
be part of the reason for the out-commuting in these
sectors. The wage discrepancy could result from a mis-
match of skills required in the respective sectors, from
the nature of the specic industries within the sectors,
and/or lower expectations or needs of employers in
Madison County. Less costly labor is also an attractive
workforce attribute for potential employers.
Madison County Economic Development Strategy Page
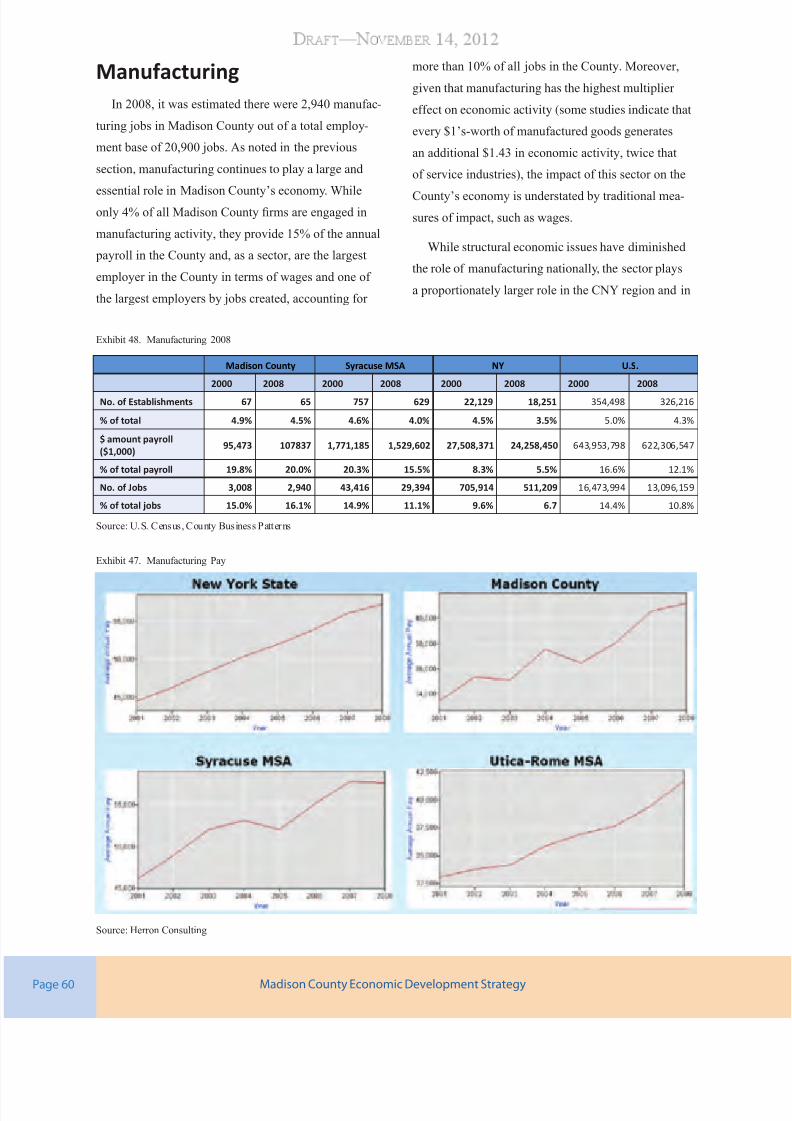
7/29/2019 Madison County's economic development plan, 2013
http://slidepdf.com/reader/full/madison-countys-economic-development-plan-2013 60/192
Manufacturing
In 2008, it was estimated there were 2,940 manufac-
turing jobs in Madison County out of a total employ-
ment base of 20,900 jobs. As noted in the previous
section, manufacturing continues to play a large and
essential role in Madison County’s economy. Whileonly 4% of all Madison County rms are engaged in
manufacturing activity, they provide 15% of the annual
payroll in the County and, as a sector, are the largest
employer in the County in terms of wages and one of
the largest employers by jobs created, accounting for
more than 10% of all jobs in the County. Moreover,
given that manufacturing has the highest multiplier
effect on economic activity (some studies indicate that
every $1’s-worth of manufactured goods generates
an additional $1.43 in economic activity, twice that
of service industries), the impact of this sector on the
County’s economy is understated by traditional mea-
sures of impact, such as wages.
While structural economic issues have diminished
the role of manufacturing nationally, the sector plays
a proportionately larger role in the CNY region and in
Exhibit 47. Manufacturing Pay
Source: Herron Consulting
Exhibit 48. Manufacturing 2008
Madison County Syracuse MSA NY U.S.
2000 2008 2000 2008 2000 2008 2000 2008
No. of Establishments 67 65 757 629 22,129 18,251 354,498 326,216
% of total 4.9% 4.5% 4.6% 4.0% 4.5% 3.5% 5.0% 4.3%
$ amount payroll
($1,000)95,473 107837 1,771,185 1,529,602 27,508,371 24,258,450 643,953,798 622,306,547
% of total payroll 19.8% 20.0% 20.3% 15.5% 8.3% 5.5% 16.6% 12.1%
No. of Jobs 3,008 2,940 43,416 29,394 705,914 511,209 16,473,994 13,096,159
% of total jobs 15.0% 16.1% 14.9% 11.1% 9.6% 6.7 14.4% 10.8%
Source: U.S. Census, County Business Patterns
Madison County Economic Development StrategyPage 60

7/29/2019 Madison County's economic development plan, 2013
http://slidepdf.com/reader/full/madison-countys-economic-development-plan-2013 61/192
Madison County than it does statewide or nationally.
According to the data assembled by the U.S. Census
and presented in Exhibit 48 , manufacturing accounts
for a larger proportion of Madison County’s economy
on all levels (number of businesses, percentage of
total payroll, and number of jobs) than it does on
the regional, state or national level. In fact, Madison
County showed an increase in manufacturing’s total
payroll and percentage of total payroll from 2000 to
2008 even as the number of manufacturing establish-
ments and manufacturing jobs were decreasing (some
of these data will differ from what was presented
earlier as the source of the data was changed to provide
comparative information, U.S. Census vs. NYSDOL).
The comparative trends in manufacturing pay
over the decade explains in part what has happened
in this sector even as the number of manufacturers
have declined. As seen in Exhibit 47 , average wages
increased during this period, possibly driven by
scarcity of employees in a declining sector and by the
increased specialization of the manufacturing base that
has remained.
Even in the case of rising wages, Madison County
appears to have an advantage. The data shown in
Exhibit 50 indicate the comparative wages in this
sector and Madison County wages are extremely
competitive.
It is clear that manufacturing is a critical player in
the local economy having retained if not increased its
relative position during a period of general decline in
the manufacturing sector.
While the data results from this source—County
Business Patterns (CBP)—are not ideal, some sense of
how the manufacturing sector is composed in Madison
County can be obtained from this information. There
are some concentrations in printing and related activi-
ties, plastics and rubber manufacturing, and primary
metal manufacturing. In the latter case, it appears that
at least some of the gains seen in payroll gures in
manufacturing during the 2000—2008 period have
come from this subsector, which includes foundries
and wire manufacturers.
While information may be incomplete for the entire
period, it seems likely that the computer and electron-
ics sector, which includes semiconductor and elec-
tronic capacitor fabrication, has continued to operate
in the County at a substantial level. Considering data
Exhibit 49. Manufacturing in Madison County 2000–2008
Sector 2000 % 2008 %
All
Payroll ($1,000) $95,476 $107,837
Establishments 67 65
Employees 3,008 2,940
Paper Manufacturing
Payroll ($1,000) $2,349 2.5% n/a
Establishments 3 4.5% n/a
Employees 78 2.6% n/a
Prinng & Related Support Acvies
Payroll ($1,000) $512 0.5% 433 0.4%
Establishments 7 10.4% 5 0.077
Employees 27 0.9% n/a
Plascs & Rubber Mfg.
Payroll ($1,000) $15,734 16.5% $8,036 7.5%
Establishments 6 9.0% 6 9.2%
Employees 478 15.9% 326 11.1%
Primary Metal Mfg.
Payroll ($1,000) $24,978 26.2% $28,112 26.1%
Establishments 4 6.0% 4 6.2%
Employees 675 22.4% 727 24.7%
Computer and Electronics Mfg.
Payroll ($1,000) $14,062 14.7% n/a
Establishments 5 7.5% n/a
Employees 642 21.3% n/a
Source: U.S. Census, County Business Patterns
Exhibit 50. Local Manufacturing Labor Cost, 2008
State/CountyManufacturing Industry
Annual Pay
Madison County $41,200
Oneida County $42,414
Virginia $48,736
Vermont $50,669
Pennsylvania $51,529
Ohio $51,902
U.S. Average $54,400
New York $57,235
Onondaga County $60,072
Conneccut $70,574
Source: Herron Consulting
Madison County Economic Development Strategy PageMadison County Strategic Economic Development Plan Page

7/29/2019 Madison County's economic development plan, 2013
http://slidepdf.com/reader/full/madison-countys-economic-development-plan-2013 62/192
from the NYSDOL, it is clear that many of these sec-
tors are part of a regional concentration of industrial
competence.
The NYSDOL data also highlight the importance of
two other manufacturing sectors in Madison County:
food and fabricated metal.
The manufacturing sector continues to play a major
role in Madison County’s economy and decisions
regarding the future economic development of the
County would not be complete without an understand-
ing of this role or a coordinated approach toward the
County’s manufacturing employers.
ONEIDA MOLDED PLASTICS, LLC
Madison County Economic Development StrategyPage 62 Madison County Strategic Economic Development PlanPage 62

7/29/2019 Madison County's economic development plan, 2013
http://slidepdf.com/reader/full/madison-countys-economic-development-plan-2013 63/192
Service Sector
As the United States has developed from a manu-
facturing-based economy to a predominately service-
oriented economy, there has been considerable growth
in these sectors on both national and local levels.
Employment and wages generated in these sectorshas come to represent a signicant part of Madison
County’s economy as well. It is estimated there were
7,658 service sector jobs in Madison County in 2009,
representing 36.6% of the County’s total employment
base of 20, 932. The table below shows detailed year-
end data for employment and wages in the services
sector.
As was noted earlier, the gures drawn from the
NYS Department of Labor understate the number of
jobs in certain sectors as they exclude the establish-
ments of self-employed workers. As previously, several
service sectors, notably professional, scientic and
technical services/administrative and waste services/
health care/other services, have a sizeable representa-
tion among the “non-employer” sector. Exhibit 51
combines the information for both wage-earning and
self-employed workers in these sectors and shows the
relative positions of each sector in terms of employ-
ment and wages.
Jobs in the information and scientic and technical
sectors are viewed as positive indicators for local econ-
omies. These jobs are often in higher growth, cutting-
edge elds that bode well for future economic develop-
ment. They also tend to create relatively well-paying
jobs and so have a positive impact on other parts of the
local economy. Economies with healthy arts, enter -
tainment and tourism sectors can indicate a dynamic
community which is poised to leverage travel and
tourism dollars. In Madison County, the professional,
scientic and technical sector is a signicant part of the
economy and, while small, the arts, entertainment and
tourism sector has shown growth in recent years.
Exhibit 51. Service Sector in Madison County, 2009
Sector Employment % of Total Wages % of Total
Ulies 24 0.1% $1,789,740 >0.1%
Transportaon & Warehousing 167 0.8% $4,290,409 0.6%
Informaon 197 0.9% $5,827,386 0.8%
Finance and Insurance 552 2.6% $23,004,432 3.3%
Real Estate and Rental and Leasing 160 0.8% $4,394,465 0.6%
Professional, Scienc and Technical Services 607 2.9% $24,000,691 3.4%
Administrave and Waste Services 325 1.6% $9,997,540 1.4%
Educaonal Services 1,777 8.5% $79,555,785 11.3%
Health Care and Social Assistance 2,864 13.7% $100,662,152 14.3%
Arts, Entertainment, and Recreaon 302 1.4% $4,336,895 0.6%
Other Services 683 3.3% $16,451,605 2.3%
Total Service Sector 7,658 36.6% $274,311,100 39.0%
Total All Sectors 20,932 $703,020,710
Source: NYSDOL
Madison County Economic Development Strategy Page

7/29/2019 Madison County's economic development plan, 2013
http://slidepdf.com/reader/full/madison-countys-economic-development-plan-2013 64/192
Retail
The total number of retail jobs in Madison County
in 2009 was estimated to equal 2,600. While the retail
sector of the economy is not a signicant wage genera-
tor, it does perform several important functions in any
local economy. It generates entry-level or part-time jobs for various segments of the population; it provides
convenient access to many goods and services for com-
munity residents; it captures sales tax revenue for the
relevant taxing authority.
As discussed earlier, the retail sector is the most
numerous type of business establishment in the
County, accounting for 15% of all wage-paying busi-
nesses. Retail businesses currently provide nearly
12% of the total jobs in the County, a percentage that
tracks the national average closely. The sector pro-
vides only 8% of the total payroll in the County and
the average annual wage currently (2010) is approxi-
mately $24,000, an amount more than 15% below the
national average. Unlike national trends, the number
of jobs in this sector declined by 4% over the ve year
period of 2003–2008 while on a national level retail
jobs increased by 2.5%. This is perhaps a symptom
of a trend that is causing additional problems for asemi-rural county like Madison—the concentration of
retail operations into “big box” stores located closer to
metropolitan area centers. Retail jobs are more difcult
to obtain or even access for job seekers in Madison
County as these jobs are drawn closer to urban areas.
Needed goods and services that these businesses for -
merly provided in the community become less avail-
able to residents of smaller communities.
Data available on retail potential, retail surplus, and
retail leakage for Madison County can shed light on
some of the issues facing the County’s retail sector.
Retail surplus is when local retailers sell more than
what was demanded locally, thus attracting retail
dollars from outside the area. A retail leakage is the
opposite situation; that is, local household demand for
goods and services provided by these sectors exceeded
what was available in a community. Consequently, this
gap was satised by retail businesses located else-
where. Exhibit 52 and Exhibit 53 compare retail sectors
that have surpluses and leakages and estimate the size
of the gaps produced. Retail surplus in the County
totaled $135 million while retail leakage stood at $178
million, resulting in a net $43 million leakage of sales.
Assuming these sales were taxable at the County rate
of 4%, the net leakage costs Madison County approxi-
mately $1,720,000 in lost sales tax revenue annually.
An additional cost to Madison County residents
is the amount of time and money they must spend to
obtain these goods and services outside their immedi-
ate communities or to travel to and from jobs at retail
locations outside Madison County. An interesting cal-
culation looks at the average national sales in certain
retail segments where there is a local gap in sales and
calculates the type of retail businesses, their sales, jobs
and wages created if their potential was realized within
Madison County. The data in Exhibit 54 depict this
potential relationship.
Madison County Economic Development StrategyPage 64 Madison County Strategic Economic Development PlanPage 64
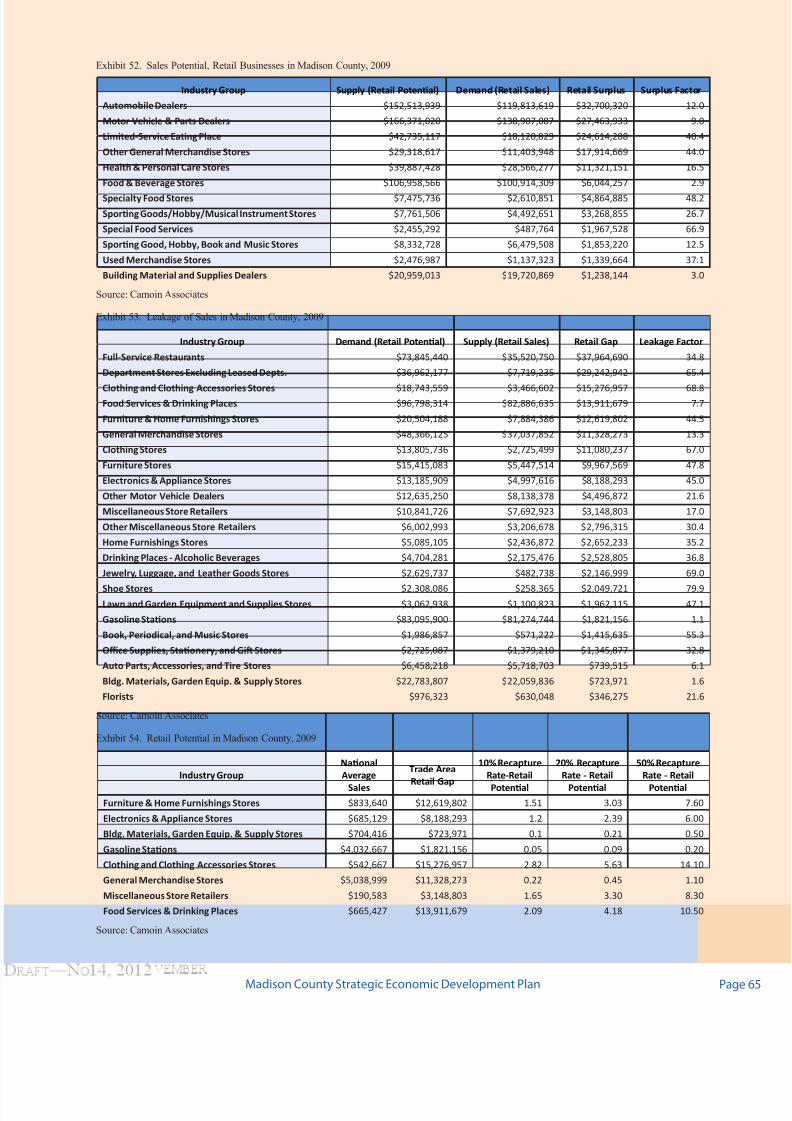
7/29/2019 Madison County's economic development plan, 2013
http://slidepdf.com/reader/full/madison-countys-economic-development-plan-2013 65/192
Exhibit 52. Sales Potential, Retail Businesses in Madison County, 2009
Industry Group Supply (Retail Potenal) Demand (Retail Sales) Retail Surplus Surplus Factor
Automobile Dealers $152,513,939 $119,813,619 $32,700,320 12.0
Motor Vehicle & Parts Dealers $166,371,020 $138,907,087 $27,463,933 9.0
Limited-Service Eang Place $42,735,117 $18,120,829 $24,614,288 40.4
Other General Merchandise Stores $29,318,617 $11,403,948 $17,914,669 44.0
Health & Personal Care Stores $39,887,428 $28,566,277 $11,321,151 16.5
Food & Beverage Stores $106,958,566 $100,914,309 $6,044,257 2.9
Specialty Food Stores $7,475,736 $2,610,851 $4,864,885 48.2
Sporng Goods/Hobby/Musical Instrument Stores $7,761,506 $4,492,651 $3,268,855 26.7
Special Food Services $2,455,292 $487,764 $1,967,528 66.9
Sporng Good, Hobby, Book and Music Stores $8,332,728 $6,479,508 $1,853,220 12.5
Used Merchandise Stores $2,476,987 $1,137,323 $1,339,664 37.1
Building Material and Supplies Dealers $20,959,013 $19,720,869 $1,238,144 3.0
Source: Camoin Associates
Exhibit 53. Leakage of Sales in Madison County, 2009
Industry Group Demand (Retail Potenal) Supply (Retail Sales) Retail Gap Leakage Factor
Full-Service Restaurants $73,845,440 $35,520,750 $37,964,690 34.8
Department Stores Excluding Leased Depts. $36,962,177 $7,719,235 $29,242,942 65.4
Clothing and Clothing Accessories Stores $18,743,559 $3,466,602 $15,276,957 68.8Food Services & Drinking Places $96,798,314 $82,886,635 $13,911,679 7.7
Furniture & Home Furnishings Stores $20,504,188 $7,884,386 $12,619,802 44.5
General Merchandise Stores $48,366,125 $37,037,852 $11,328,273 13.3
Clothing Stores $13,805,736 $2,725,499 $11,080,237 67.0
Furniture Stores $15,415,083 $5,447,514 $9,967,569 47.8
Electronics & Appliance Stores $13,185,909 $4,997,616 $8,188,293 45.0
Other Motor Vehicle Dealers $12,635,250 $8,138,378 $4,496,872 21.6
Miscellaneous Store Retailers $10,841,726 $7,692,923 $3,148,803 17.0
Other Miscellaneous Store Retailers $6,002,993 $3,206,678 $2,796,315 30.4
Home Furnishings Stores $5,089,105 $2,436,872 $2,652,233 35.2
Drinking Places - Alcoholic Beverages $4,704,281 $2,175,476 $2,528,805 36.8
Jewelry, Luggage, and Leather Goods Stores $2,629,737 $482,738 $2,146,999 69.0
Shoe Stores $2,308,086 $258,365 $2,049,721 79.9Lawn and Garden Equipment and Supplies Stores $3,062,938 $1,100,823 $1,962,115 47.1
Gasoline Staons $83,095,900 $81,274,744 $1,821,156 1.1
Book, Periodical, and Music Stores $1,986,857 $571,222 $1,415,635 55.3
Oce Supplies, Staonery, and Gi Stores $2,725,087 $1,379,210 $1,345,877 32.8
Auto Parts, Accessories, and Tire Stores $6,458,218 $5,718,703 $739,515 6.1
Bldg. Materials, Garden Equip. & Supply Stores $22,783,807 $22,059,836 $723,971 1.6
Florists $976,323 $630,048 $346,275 21.6
Source: Camoin Associates
Exhibit 54. Retail Potential in Madison County, 2009
Industry Group
Naonal
Average
Sales
Trade Area
Retail Gap
10% Recapture
Rate-Retail
Potenal
20% Recapture
Rate - Retail
Potenal
50% Recapture
Rate - Retail
Potenal
Furniture & Home Furnishings Stores $833,640 $12,619,802 1.51 3.03 7.60
Electronics & Appliance Stores $685,129 $8,188,293 1.2 2.39 6.00
Bldg. Materials, Garden Equip. & Supply Stores $704,416 $723,971 0.1 0.21 0.50
Gasoline Staons $4,032,667 $1,821,156 0.05 0.09 0.20
Clothing and Clothing Accessories Stores $542,667 $15,276,957 2.82 5.63 14.10
General Merchandise Stores $5,038,999 $11,328,273 0.22 0.45 1.10
Miscellaneous Store Retailers $190,583 $3,148,803 1.65 3.30 8.30
Food Services & Drinking Places $665,427 $13,911,679 2.09 4.18 10.50
Source: Camoin Associates
Madison County Strategic Economic Development Plan Page

7/29/2019 Madison County's economic development plan, 2013
http://slidepdf.com/reader/full/madison-countys-economic-development-plan-2013 66/192
Agriculture
Agriculture and related activities continue to play
an important role in Madison County’s economy. It is
estimated there are approximately 1,000 jobs in the
agriculture sector in Madison County, including many
sole proprietorships. As shown in Exhibit 55 , between2002 and 2007, the number of farms in Madison
County increased by 1% to 744 operations. New York
State saw its number of farms decline by 2% while
39 other states reported an increase in the number of
farms for a 4% gain nationwide. (A farm, for the pur -
poses of the Census, is any place from which $1,000 or
more of agricultural products were, or normally would
be, produced and sold during the Census year.)
The amount of land in farms in Madison County
increased by 12% to 188,320 acres. This represents
approximately 294 square miles of land in farm use
or 44% of the County’s total land /water area of 662
square miles. The average size of a farm in Madison
County increased from 229 acres to 253 acres.
Exhibit 56 compares the distribution of farms by
number of acres over a ten-year period ending in 2007.
Farms in low to mid-range sizes (10–49 acres and
50–179 acres) have shown an increase over this period
as have very large farms of over 1,000 acres. Very
small farms have declined as have the larger mid-range
farms in the 180—499 acres category.
Average sales per farm ( Exhibit 57 ) increased
from $83,929 to $116,036 between 2002 and 2007.
However, a third of all farms reported sales of less
than $2,500 and nearly three-quarters (71%) of farms
reported annual sales of less than $25,000.
Exhibit 58 shows the overall market value of agri-
cultural products sold in Madison County increased
by 40% to $86 million, ranking it 21st of the 54 New
York counties reporting agricultural revenue. Of this
amount, crops accounted for $16 million (19%) and
livestock, poultry and their products yielded $70
million (81%) in sales. Of the latter amount, milk
accounted for $62 million which was 89% of live-
stock/livestock product sales and 72% of total sales.
According to USDA statistics, farm operators keep
about $24.7 million of these sales or about $33,000 on
average per farm.
Madison County’s agricultural output accounts for
approximately 33% of the MSA’s agricultural output
of $262 million. This sector is a fairly small portion of
the region’s economy - the BEA estimates the MSA’s
Gross Domestic Product to be approximately $26 bil-
lion. While agricultural activity accounts for a larger
share of Madison County’s economic activity than in
Onondaga or Oswego counties, it is still a relatively
small, though not insignicant, portion of overall
output. Farming at the local level in Madison County
retains its signicance in several ways. Agricultural
activity contributes to the economy in direct and
indirect ways. As noted, the value of farm products
sold was more than $86,000,000 in 2007 and as this
money circulates through the local economy, it gener-
ates approximately $260,000,000 of business in other
sectors. Moreover, as will be discussed below, agricul-
ture and activities related to agricultural pursuits may
offer the County continued new opportunities for the
growth and development of its economy. Finally, the
agricultural setting of Madison County and the lifestyle
that prevails as a result is a major factor inuencing the
quality of life and contributes in many intangible ways
to the economic health of the County.
Madison County ranked 14th in the State (out of 54)
and 116th in the nation (out of 2,493) in milk and dairy
products from cows and 21st in the State in overall
value of agricultural products sold. The dependence on
milk can be problematic given the commodity nature
of the product. While relatively high milk prices in
2007 beneted producers and were probably responsi-
ble in part for the large increase in agricultural product
revenue for that year, the current state of milk prices
Madison County Economic Development StrategyPage 66

7/29/2019 Madison County's economic development plan, 2013
http://slidepdf.com/reader/full/madison-countys-economic-development-plan-2013 67/192
As noted in the County’s 2005 Agriculture and Farmland Protection Plan, “[T]here are currently 13 Agricultural
Districts, which encompass over 153,000 acres in Madison County.
Together these districts make up over 36% of the County’stotal land base, [and] provide both economic and regulatoryincentives for farmers to continue farming…”
Exhibit 56. Madison County Farms by Size, 1997 to 2007
0
50
100
150
200
250
300
1997
2002
2007
1 0 0 0 +
a c r e s
5 0 0
- 9 9 9
a c r e s
1 8 0
- 4 9 9
a c r e s
5 0
- 1 7 9
a c r e s
1 0
- 4 9
a c r e s
1 - 9
a c r e s
Source: U.S. Department of Agriculture
Exhibit 57. Farms by Value of Sales, 2007
0
50
100
150
200
250
$ 1 0 0
, 0 0 0
+
$
5 0
, 0 0 0
- $ 9 9
, 9 9 9
$ 2 5
, 0 0 0
- $ 4 9
, 9 9 9
$ 1 0
, 0 0 0
- $ 2 4
, 9 9 9
$ 5
, 0 0 0
- $ 9
, 9 9 9
$ 2
, 0 0 0
- $ 4
, 9 9 9
$ 2
, 5 0 0
<
Source: U.S. Department of Agriculture
Exhibit 55. Agricultural Summary, Madison County 2002 & 2007
2002 2007
Total Farms 734 744
Land in Farms (acres) 168,264 188,320
Average Size of Farm (acres) 229 253
Proporon of Land Area in Farms 40% 44.8%
Market Value all Products Sold ($1,000) $61,604 $86,331
Market Value Average Sales per Farm
(dollars)$83,929 $116,036
Source: U.S. Department of Agriculture
Exhibit 58. Agricultural Products
Product$Revenue
($1,000)
Total Crops, nursery,greenhouse $16,124
Corn $4,875
Soybeans $1,014
Vegetables, melons, potatoes $1,946
Nursery, greenhouse, oriculture $3,758
All other $4,531
Livestock, poultry and products $70,207
Cale & Calves $6,992
Milk and other dairy prods from cows $62,337
All other $878
Source: U.S. Department of Agriculture
Madison County Strategic Economic Development Plan Page

7/29/2019 Madison County's economic development plan, 2013
http://slidepdf.com/reader/full/madison-countys-economic-development-plan-2013 68/192
in the Northeast is causing many producers to consider
exiting the industry.
A distant second and third ranking in the County’s
agricultural sales were the sale of cattle and calves at
$7 million and the sale of grains, oilseeds, dry beans
and dry peas at $6.5 million.
The top crop item in Madison County was forage
which utilized 59,000 acres. Another 30,000 acres was
utilized for corn production which was nearly evenly
split between corn for grain and corn for silage.
It’s difcult to completely assess this sector’s
impact on the County’s employment in that farm
operators are, by and large, self-employed proprietors
and some farm labor comes through the involvement
of immediate family members. Moreover, as will be
seen below, farm operators are increasingly working in
this sector as part-time employers/employees. In 2008,
NYSDOL reported 181 wage earners from 29 reporting
units in the agricultural support, forestry and sh-
ing category, of which 141 were engaged in crop and
animal production sub-categories. The total number of
wage earners for this period in Madison County was
21,562. Agricultural workers generated $4.4 million in
wages out of a total of $726.5 million (<1%). Non-employer statistics for 2006 indicated 86 establish-
ments in the sector out of a total of 4,200.
Farming as Lifestyle
A signicant number of farms in the Madison
County are small, with nearly 50% reporting less than
$10,000 in sales.. Of the 744 farms in the County, 374
show a positive net income while 370 show a loss.
As noted earlier, many if not most operators have to
rely on other sources of income to sustain themselves.
In fact, only 56% of the farm operators in Madison
County reported farming as their primary occupation
(still much higher than the national rate of 45%). There
were 423 operators reporting that they worked some
days off the farm while 256 operators reported working
more than 200 days off the farm. This reects not only
the challenge of making a living by farming but also a
trend toward part-time farming that is evident here and
nationally.
National trends in farming may be instructive, asshown in Exhibit 59. Underlying the change in farm
numbers is the fact that farmers are continually enter -
ing and exiting agriculture. Since the 2002 Census of
Agriculture, 291,329 new farms have begun operation
in the U.S. Farms that began operation between 2003
and 2007 tended to be smaller and have lower sales
than all farms nationwide. New farms, on average, had
201 acres of land and $71,000 in sales. By comparison,
the average for all farms in the United Stated was 418
acres and $135,000 in sales. Operators of new farms
were more likely to be engaged in occupations other
than farming and to derive income from non-farm
sources. The percentage of principal operators report
farming as their primary occupation was 33 percent for
these new farm operators. The average for all principal
farm operators was 45 percent.
Bouque and Organic Crops
Exhibit 60 summarizes some basic information on
organic production for the counties most involved in
this sector in New York State.
These are small farms, or portions of larger farms,
averaging 153 acres and selling products valued at, on
average, $61,000 per year. Madison County is squarely
Exhibit 59. New Farm Trends in the U.S.
New Farm Trends All Farms New Farms
Percent of Total 100% 13%
Average Size 418 acres 201 acres
Average Value of Products Sold $135,000 $71,000
Sales and Government Payments
<$10,00058% 73%
Average Age of Operator 57 48
Farming as Primary Occupaon 45% 33%
Source: U.S. Department of Agriculture
Madison County Economic Development StrategyPage 68

7/29/2019 Madison County's economic development plan, 2013
http://slidepdf.com/reader/full/madison-countys-economic-development-plan-2013 69/192
in the middle of this listing in terms of land and farm
involvement and the value of organic products among
the largest producers of organic in the State and 13th
overall in terms of value of organic products. Nearby
Tompkins County, a smaller, more densely populated
county than Madison, leads the list in terms of percent-
age of land devoted to organics and in the percentage
of total product value derived from organics and over-
all value of organic products (over $5 million).
Equine
Exhibit 61 summarizes the economic impacts of
horse-breeding activities in the County presented in theAgricultural Census for 2002 and 2007.
There has been a sizable increase in revenues in this
sector over the past ve years. The large increase in
economic activity has been supported by the develop-
ment of local equine science and business management
programs at two local colleges, SUNY Morrisville’s
Equine Science Program and Cazenovia College’s
Equine Business Management Studies Program. Each
program has invested in its equine program in recent
years; Cazenovia through the construction of a 243-
acre horse farm and Morrisville’s Equine Rehabilita-
tion Center.
As an example of how this beneted the local
economy, the annual Syracuse International Horse
Show sponsored by the American Saddlebred Horse
Association and the New York State Fair Horse Show
drew signicant attention to Central New York on
an annual basis as a center of equestrian activity. An
Exhibit 60. NYS Farms’ Organic Products - 2007 Largest Producers
County# of
Farms
Acres Used
for Organic
% of acres in
farms
Value of Organic
Products (‘000)
Value all Products
(‘000)
Organic % of
total
Allegany 31 5,718 3.8% $1,281 $46,068 2.8%
Cayuga 42 3,459 1.4% $1,463 $214,403 0.7%
Chautauqua 30 2,378 1.0% $1,353 $138,578 1.0%
Cortland 30 3,860 3.1% $1,584 $54,884 2.9%
Delaware 18 4,061 2.5% $101 $55,143 0.2%
Erie 13 4,568 3.1% $1,578 $117,031 1.3%
Herkimer 33 4,951 3.5% $2,096 $62,141 3.4%
Jeerson 31 7,494 2.9% $2,198 $139,242 1.6%
Madison 22 4,741 2.5% $1,460 $86,331 1.7%
Montgomery 21 3,939 3.2% $1,560 $73,612 2.1%
Onondaga 21 2,404 1.6% $2,020 $137,372 1.5%
Orleans 16 2,561 1.8% $1,440 $101,026 1.4%
Seneca 46 4,850 3.8% $2,955 $84,075 3.5%
St. Lawrence 62 13,716 3.9% $3,456 $140,151 2.5%
Steuben 52 5,204 1.4% $1,535 $135,286 1.1%
Tompkins 41 5,815 5.3% $5,263 $60,185 8.7%
Yates 49 5,579 4.4% $2,720 $88,382 3.1%
Totals 558 85,298 $34,063
Source: U.S. Department of Agriculture
Exhibit 61. Economic Impact from Horse Breeding, Madison
County
2002 2007 % Chge
Operaons with Sales 38 46 17%
Sales measured in head 92 209 127%
Sales measured in $ $185,000 $443,000 139%
Source: U.S. Department of Agriculture
Madison County Economic Development Strategy Page

7/29/2019 Madison County's economic development plan, 2013
http://slidepdf.com/reader/full/madison-countys-economic-development-plan-2013 70/192
important by-product of these activities is the money
pumped into the local economy directly through the
events and indirectly through any resulting revenues to
local stables and equestrian related businesses. A local
equestrian Olympic medalist may also be an important
resource in terms of symbolizing the equestrian status
of Madison County.
CSA parcipaon
Community Supported Agriculture arrangements,
in which consumers purchase produce directly from
local farms as buying groups, is an increasingly
popular means for nearby urban residents to purchase
locally grown produce. The Census of Agriculture
began to track this activity in its 2007 report. There
were 9 Madison County farms that participated in CSA
arrangements at that time.
The movement toward utilization of local food
sources comes from a variety of sources (security,
health, energy conservation, and environmental con-
cerns) and appears to be growing. The proximity of the
metro areas of Utica and Syracuse may be part of the
reason Madison County seems to have better than aver -
age participation in this form of direct-to-consumer
sales and might further support the maintenance and
development of farms in the County and help diversify
the product base.
Agritourism
An agritourism farm is any land based farm or
business that is open to the public. These specialized
agritourism destinations generally offer things to see,
things to do, and produce or gifts to buy, and are opento the public at least some parts of the year. Some agri-
tourism farms are open 365 days, some only open for a
few weekends in the fall. All offer a unique and enter -
taining farm experience and are generally appealing
to all members in a family. Wine tasting, farm tours,
country bed and breakfast, corn mazes, hay rides,
u-pick farms and even farm stands are all examples of
agritourism. The national market for agritourism is put
at $567 million, up from $202 million in 2002. The
average farm earned $23,350.
There has been increased participation in agritour -
ism by Madison County farms and in NY as a whole.
Revenue from this source has increased by nearly
500% in Madison County over the ve year period
with the average participating farm earning $20,133.
Agritourism activities can support the maintenance
or creation of farms, especially given the trend toward
farming as a part-time occupation for so many. It also
can drive development opportunities for other local
services and retail. Madison County has signicant
resources already devoted to promoting tourism in the
region and agritourism’s rapid growth nationally and
locally seems to be a trend in which the County could
participate.
Madison County Economic Development StrategyPage 70

7/29/2019 Madison County's economic development plan, 2013
http://slidepdf.com/reader/full/madison-countys-economic-development-plan-2013 71/192
Tourism
Madison County is located in the New York State-
designated Central New York/Leatherstocking Tourism
Region. A 2011 report for the State by Tourism Eco-
nomic, Inc. on the economic impact of tourism noted
that tourism in the CNY/Leatherstocking region is a$1.8 billion business supporting 32,000 jobs. The same
report estimated there are 1,852 tourism-related jobs in
Madison County supported by tourism spending that
exceeded $77 million in 2011. Exhibit 62 shows how
total tourism spending is distributed among the coun-
ties belonging to the CNY/Leatherstocking region.
The tourism industry in Madison County has a large
impact on residents as it provides over $23 million in
direct income to residents and over $17 million in indi-
rect and induced incomes. This accounts for about 5%
of the total wages in the County. The tourism industry
employs over 1,286 people directly and another 566
indirectly. According to a 2011 study, the tourism
industry contributed $4.9 million dollars in local taxes
(4% sales tax and property taxes) and $4.6 million in
State sales taxes.
In terms of trends, tourism spending in the region
has been on a consistent upward swing. In the early
part of the decade revenue increased at rates of
10–15% yearly. In 2005 and 2006 those rates were
closer to 5%. In 2011 tourism spending increased
7.3%.
As shown in Exhibit 63, over one-third of the visi-
tor spending in Madison County went toward food
and beverage spending. Lodging and retail & service
station revenues were also signicant components of
overall tourist spending in the County.
Exhibit 62. Tourism Impact by County, 2011
Total Tourism Impact, 2011Visitor Spending,
’000sLabor Income, ’000s Employment
Local Taxes,
’000s
State Taxes,
’000s
Broome $283,089 $142,748 6,264 $17,650 $17,250
Chenango $29,210 $10,944 509 $1,749 $1,780
Herkimer $92,076 $40,008 1,568 $5,066 $5,611
Madison $77,029 $40,303 1,852 $4,940 $4,694
Montgomery $32,332 $15,376 670 $2,223 $1,970
Oneida $1,106,934 $553,996 16,548 $63,357 $67,450
Otsego $153,160 $74,005 3,233 $10,453 $9,333
Schoharie $55,753 $21,882 978 $3,280 $3,397
Total $ 1,829,583 $899,262 31,622 $108,717 $111,484
Source: Empire State Development Corp.
Madison County Economic Development Strategy Page

7/29/2019 Madison County's economic development plan, 2013
http://slidepdf.com/reader/full/madison-countys-economic-development-plan-2013 72/192
Representative List of Annual Events and Attractions Drawing Visitors to Madison County
• Erie Canal• Oneida lake• Chittenango Falls State Park•
Verona State Park• Lorenzo State Historic Site• Madison-Bouckville Antique
Show • Ozstravaganza• International Boxing Hall of
Fame• Earleville Opera House• Many Unique B&Bs• 130 miles of multi-use trails:
hunting, cross-country skiing, hiking, fishing
• Turning Stone
Exhibit 64. Tourism Spending
Schoharie: 2%
Otsego: 10%
Oneida: 58%
Montgomery: 2%
Madison: 4%
Herkimer: 5%
Chenango: 2%
Broome: 16%
Source: Empire State Development Corp.
Exhibit 63. Visitor Spending by Category, 2011
2011 Visitor Spending,
’000sLodging Recreaon F&B
Retail & Svce.
StaonsTransport Second Homes Total
Broome $79,807 $6,995 $91,203 $63,186 $34,402 $7,496 $283,089
Chenango $1,552 $635 $5,722 $3,283 $1,332 $16,687 $29,210
Herkimer $16,729 $3,737 $17,837 $14,016 $7,849 $31,908 $92,076Madison $12,338 $2,334 $27,145 $18,217 $3,083 $13,912 $77,029
Montgomery $4,740 $516 $7,181 $3,479 $14,358 $2,057 $32,332
Oneida $220,362 $370,816 $187,048 $273,361 $37,152 $18,196 $1,106,934
Otsego $42,219 $7,237 $42,866 $34,415 $4,017 $22,407 $153,160
Schoharie $14,940 $1,383 $9,308 $8,724 $64 $21,334 $55,753
Total $392,687 $393,653 $388,309 $418,682 $102,256 $133,995 $1,829,583
Source: Empire State Development Corp.
Madison County Strategic Economic Development PlanPage 72

7/29/2019 Madison County's economic development plan, 2013
http://slidepdf.com/reader/full/madison-countys-economic-development-plan-2013 73/192
Higher Educaon
In 2009 it was estimated there were 1,777 private
sector education jobs in Madison County. A majority
of these jobs were in higher education. Local colleges
and universities can have a large positive impact on the
economies of the communities that host them. Directeconomic impact can stem from institutional spending
on employment and capital projects and from spend-
ing by students and visitors. Additional indirect and
induced spillover benets result from this spending and
the spending of the institution’s employees. A recent
study by the Center for Government Research esti-
mated that statewide, NY’s independent higher educa-
tion sectors indirect and induced economic impact was
nearly as large as the direct spending of the institu-
tions, its students and visitors.
Colleges and universities are net wealth genera-
tors in that they draw income from sources outside the
community. They are essentially selling the service of
education to consumers from across the U.S. and in
some cases from abroad. Much like manufacturers, this
“export” product has a large multiplier effect on the
local economy. Beyond this, there is the resource of the
college itself that may be available to the community;they are participants in community activities, investors
in community facilities and infrastructure, and provid-
ers of educational and research services to workforce
and employers.
Madison County is unusual for a county of its size
in having three institutions of higher learning. The
three colleges have deep roots in the communities in
which they are located. Cazenovia College and Col-
gate University were founded in the early nineteenth
century and Morrisville State College was founded in
1908. All three institutions continue to exert distinct,
positive inuences on the County and on their host
community as major employers, consumers, taxpayers,
and investors in the community.
Cazenovia College
Cazenovia College is an undergraduate baccalaure-
ate college located in the Village of Cazenovia, New
York. The college was founded in 1824 and has oper -
ated at its original site for over 185 years. Cazenovia
has approximately 1,000 degree seeking students with
more than 800 living on campus. The college employs
150 faculty, 55 of whom are full-time and 95 part-time
and 247 staff (170 full-time, 77 part-time). The college
reports that there are 10,960 living, active alumni.
Academics
Programs of study at Cazenovia College include
Accounting, Business, Communication Studies,
Criminal Justice and Homeland Security Studies,
Early Childhood Program Administration, Early
Childhood Teacher Education, Inclusive Elementary
Education, English, Environmental Studies, Equine
Management, Fashion Design, Fashion Merchandis-
ing, Human Services, Interior Design, International
Studies, Liberal Studies, Photography, Psychology,
Social Science, Sport Management, Studio Art, Visual
Communications
The college offers the following BaccalaureateDegrees:
● Bachelor of Arts
● Bachelor of Fine Arts
● Bachelor of Science
● Bachelor of Professional Studies
Cazenovia College also offers associate degrees
in arts, applied sciences, and science through its Ofce
of Extended Learning.
As noted in the Agriculture section, Cazenovia
has an Equine Business Management specialization
designed for students interested in the organizational,
management, and commercial aspects of the equine
industry as well as students interested in advanced
horse care, breeding, and stable management. The
program provides a variety of professional experiences
Madison County Economic Development Strategy Page

7/29/2019 Madison County's economic development plan, 2013
http://slidepdf.com/reader/full/madison-countys-economic-development-plan-2013 74/192
through a liberal internship program. This specializa-
tion is accredited by the International Assembly of Col-
legiate Business Education (IACBE). Cazenovia Col-
lege currently owns a 243-acre horse farm located less
than ve miles from the main campus that is home to
the Equine Business Management Studies program. It
houses a herd of approximately 72 horses. Facilities
include an indoor arena, multiple outdoor riding areas,
a dressage arena, trails, and turnout paddocks.
Impact on the Community
Cazenovia College is also a signicant employer
and source of economic activity in the community.
It is a major economic contributor through local
expenditures associated with its payroll; operating
expenses; students, parents, employees, alumni andvisitors’ spending; and capital projects. In the 2005–06
academic year, the College estimated its total direct
economic impact at $24.7 million, the components of
which are shown in Exhibit 65.
Morrisville State College
Morrisville State College is part of the State
University of New York (SUNY) system. The col-
lege is located in the Village of Morrisville and was
established in 1908. The campus is comprised of
over 48 buildings spread across an area of 150 acres.
The college has 3,383 students, 2,953 of whom are
full-time equivalent. Students in the college’s agricul-
ture programs alone total 600. The college employs
approximately 450 faculty and staff.
The college offers 13 bachelor degrees and a wide
variety of associate degrees and options from four
separate schools:
● School of Agriculture & Natural Resources
● School of Business
● School of Liberal Arts
● School of Science & Technology
In the 2008–09 academic year, Morrisville awarded
453 Associate Degrees in 40 different programs and
132 Bachelor’s Degrees in 8 different programs. As
noted earlier, Morrisville offers a Bachelor of Technol-
ogy Equine Science program that is designed to further the technical and business knowledge and skills of
equine students at the upper division level. Courses
ranging from Equine Business Management to Applied
Equine Nutrition to Animal Genetics allow the student
to advance academically and specialize in very specic
areas of the horse industry.
Morrisville is a key educational resource for Madi-
son County. Its Workforce Development & Community
Education Department offers many non-credit classes
(and other classes eligible for continuing education
credit) each year on a wide variety of topics. The
ofce also provides customized training programs for
business and industry that meet the specic skills and
knowledge needed in the competitive work environ-
ment. Specic training is done in management devel-
opment, professional and career development, and
computer skills. Courses can be customized to meet an
individual company’s specic needs.
Several grant programs are run through the Work -
force Development & Community Education Depart-
ment, including the Bridge program at Morrisville
State College, a grant-funded program which helps low
income families get the education and training they
need to obtain employment.
Exhibit 65. Cazenovia College Financial Impact
Gross Payroll & Benets: $11.2 million
Purchases in the Local Marketplace: $4.0 million
Out-of-Pocket Expenditures: (students,
parents, employees, alumni, visitors)$3.5 million
Capital Projects: $6.0 million
Direct Economic Impact (Subtotal): $24.7 million
Source: Cazenovia College
Madison County Economic Development StrategyPage 74

7/29/2019 Madison County's economic development plan, 2013
http://slidepdf.com/reader/full/madison-countys-economic-development-plan-2013 75/192
Morrisville developed and supports Nelson Farms,
an organization located in Nelson, NY, providing entre-
preneurial agri-business opportunities for specialty
food processors, farmers, growers, and producers.
Opportunities include processing/co-packing, product
development, dairy incubator, distribution, marketing
and sales. Nelson Farms offers a state-of-the-art, one-
stop processing facility for small scale food processors,
farmers, growers, and producers that enables local
farmers to add value to their products. Nelson Farms
is licensed by the State of NY and adheres to FDA
regulations.
Nelson Farms and Morrisville State College are
establishing a state wide distribution system to assist
the processor, farmer, grower, and producer in getting
their products to the market place. This distribution
system will provide opportunities for expansion into
major markets in the northeast.
Colgate University
Colgate is a highly selective, nationally recognized
undergraduate liberal arts college located in Hamilton,
NY. The college was founded in 1819.
Some 2,800 undergraduates are enrolled in 51 programs, taking advantage of the university’s award-
winning curriculum, off-campus study program, and
numerous research opportunities. Full-time faculty
numbers 263, 98 percent of whom have a PhD or the
highest degree in their eld of study.
Colgate undergraduates have earned funding for
research, and gained recognition through professional
publication for more than 30 years. Annually more
than 100 students engage in full-time, grant-funded
original research in the sciences, humanities and social
sciences.
Colgate has approximately 32,400 alumni, 8,100 of
whom continue to live in New York State. Of these NY
resident alumni, approximately 1,300 are in Central
New York.
Colgate’s relationship with the Village and Town of
Hamilton is an excellent example of productive town/
gown cooperation. With a population of 2,500, the
Village is roughly the size of the student body and so
the impact of Colgate on the community is consider -
able. Colgate is an active member in the Partnership
for Community Development, which stimulates and
supports local business through small business devel-
opment and the revitalization of historic buildings.
Colgate’s bookstore, Schupf Studio Art Center, Hamil-
ton Movie House, and Palace Theater are all located in
the Village.
In an effort to improve the vitality of Hamilton,
N.Y., supporters of Colgate University came forward
to fund the Hamilton Initiative LLC in 2000. Hamil-
ton Initiative is a for-prot limited liability company
whose focus is real estate and economic develop-
ment in downtown Hamilton. The initiative primarily
focuses on the following three areas:
● Renovation of 8 key downtown buildings
● Attracting quality tenants
● Managing 4 business operations
The Hamilton Initiative has worked to improve
the overall appearance of the community and has also beneted the economic climate of the area by spurring
an active and diverse business center.
Colgate University has a signicant nancial impact
in the community as demonstrated by the following
summary of it direct expenditures during the 2009–
2010 period, shown in Exhibit 66 .
As was seen in the case of Cazenovia College,
direct University expenditures in the community are
amplied by other related direct spending (capital
expenditures/students/visitors) and indirect or spillover
spending. While gures are not available for these
impacts, Colgate’s relative size and its position as the
County’s largest employer ensure that these impacts
are considerable.
Madison County Economic Development Strategy Page

7/29/2019 Madison County's economic development plan, 2013
http://slidepdf.com/reader/full/madison-countys-economic-development-plan-2013 76/192
Exhibit 66. Colgate University Financial Impact
Colgate University Taxes Paid (2009–2010)
School $171,607
Town $99,491
Village $87,908
TOTAL $359,006
Hamilton Iniave LLC Taxes Paid (2009–2010)
School $71,128
Town $40,548
Village $44,410
TOTAL $ 156,086
Voluntary Contribuons (2009–2010)
Hamilton Central Schools (general) $192,787
Hamilton Central Schools (special project) $ 20,000
Town of Hamilton $80,865
Village of Hamilton $132,704
Town of Lebanon $3,082
Chenango Nursery School $59,425
Community Memorial Hospital* $50,000
Hamilton Fire Department (re truck) $18,000
Hamilton Fire Department (rescue truck) $20,000
Partnership for Community Development (PCD) $90,000
July 4th Fireworks $5,000
“Save the Mural” campaign $3,600
Syracuse Symphony Orchestra $7,000
TOTAL $620,717
GRAND TOTAL $1,197,555
* The university committed $150,000 to Community Memo-
rial Hospital in 2008–2009, the rst portion of which was paid in
2009–2010.
Source: Colgate University
Madison County Strategic Economic Development PlanPage 76

7/29/2019 Madison County's economic development plan, 2013
http://slidepdf.com/reader/full/madison-countys-economic-development-plan-2013 77/192
Community Resources andServices
Governance
The total number of public sector (federal, state, and
local) jobs in Madison County in 2009 was estimatedto equal 4,671, including 1,800 jobs in the public
education K–12 school system. The New York State
Constitution provides the basis for New York State law
and the delineation of the powers and authority of local
governments in New York State. Since its initial adop-
tion in 1777, ve (5) versions of the State Constitution
(as later adopted in 1821, 1846, 1894, and 1938) have
provided the legal framework for governance in New
York State. The constitution as approved by the voters
in 1938, as later amended by actions of the legislature
and the voters under the provisions of Article XIX,
Section 1, forms the legal basis for all current New
York State Laws.
New York is a diverse state with a long history of
home rule and local decision making in the establish-
ment of its local government structure and organiza-
tion. Article IX of the State Constitution establishes the
“Bill of Rights for Local Governments” and delineates
those powers granted to local government and those
reserved to the State through the actions of the State
legislature. Although local governments are granted
certain powers and privileges in the Local Government
Bill of Rights, their ability to govern is closely tied to
actions by the State Legislature. The Statute of Local
Governments enacted by the State Legislature grants
additional authority to local governments as prescribed
under the local government bill of rights subject to “…
such purposes, standard, and procedures as the State
Exhibit 67. CNY County Benchmark Comparisons: County Revenues and Expenditures 2009
Category Madison Cayuga Cortland Oneida Onondaga Oswego
Full Value per Capita $53,129 $51,517 $43,051 $42,817 $53,714 $40,904
NYS Rank (out of 57) 34 35 50 51 32 55
Eecve Property Tax Rate 0.73% 0.80% 1.33% 0.60% 0.47% 0.77%
NYS Rank 20 12 2 30 37 15
Taxes per Capita $706 $907 $1,094 $783 $1,037 $754
NYS Rank 51 29 6 44 11 46
Debt per Capita $5 $636 $443 $589 $779 $27
NYS Rank 53 18 29 23 16 52
Total Revenues Per Capita $1,469 $1,835 $2,257 $1,589 $2,271 $1,527
NYS Rank 52 29 8 48 7 51
Educaon Per Capita $76 $64 $86 $96 $113 $98
NYS Rank 35 42 22 16 8 14
Public Safety Per Capita $134 $142 $179 $141 $246 $121
NYS Rank 44 38 20 40 4 49
Transportaon Per Capita $220 $129 $292 $214 $104 $157
NYS Rank 17 38 5 18 45 32
Economic Development Per Capita $10 $19 $16 $2 $47 $8
NYS Rank 35 21 26 52 5 40
Total Expenditures Per Capita $1,491 $1,799 $2,336 $1,705 $2,446 $1,495
NYS Rank 53 35 13 39 9 52
Source: Ofce of NY State Comptroller & The Empire Center for NY State Policy
Madison County Economic Development Strategy Page
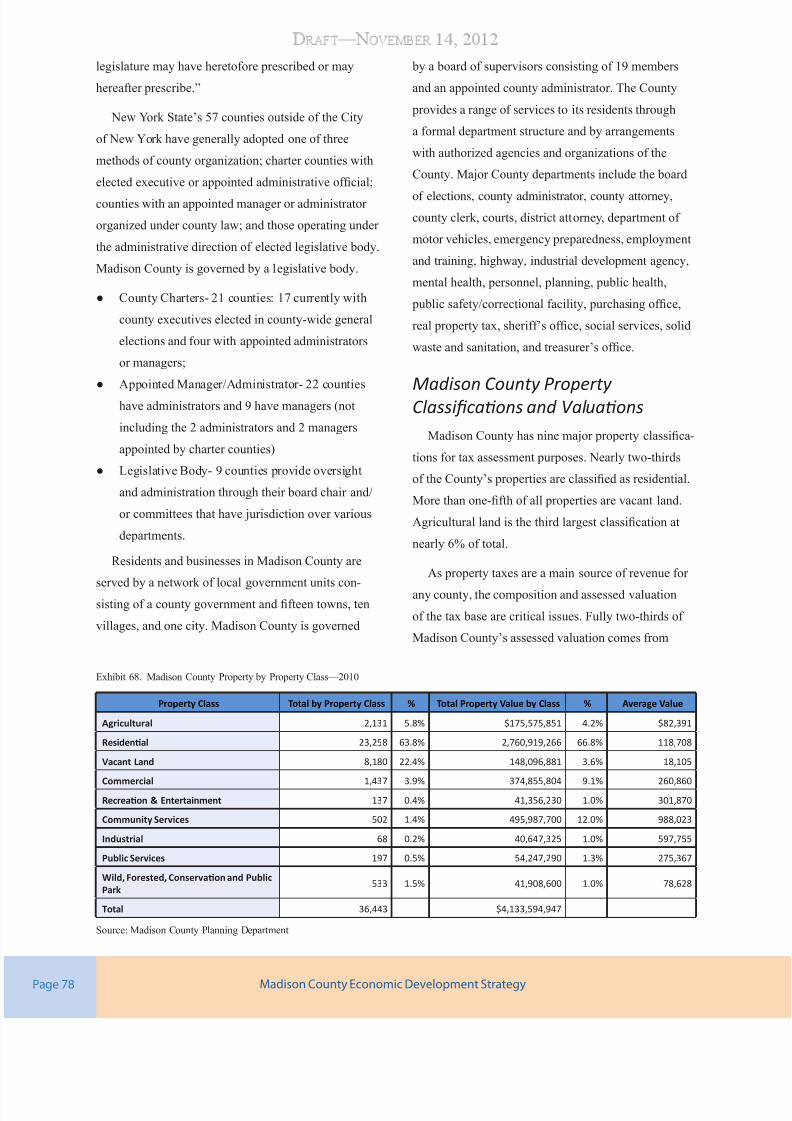
7/29/2019 Madison County's economic development plan, 2013
http://slidepdf.com/reader/full/madison-countys-economic-development-plan-2013 78/192
legislature may have heretofore prescribed or may
hereafter prescribe.”
New York State’s 57 counties outside of the City
of New York have generally adopted one of three
methods of county organization; charter counties with
elected executive or appointed administrative ofcial;
counties with an appointed manager or administrator
organized under county law; and those operating under
the administrative direction of elected legislative body.
Madison County is governed by a legislative body.
● County Charters- 21 counties: 17 currently with
county executives elected in county-wide general
elections and four with appointed administrators
or managers;
● Appointed Manager/Administrator- 22 counties
have administrators and 9 have managers (not
including the 2 administrators and 2 managers
appointed by charter counties)
● Legislative Body- 9 counties provide oversight
and administration through their board chair and/
or committees that have jurisdiction over various
departments.
Residents and businesses in Madison County are
served by a network of local government units con-
sisting of a county government and fteen towns, ten
villages, and one city. Madison County is governed
by a board of supervisors consisting of 19 members
and an appointed county administrator. The County
provides a range of services to its residents through
a formal department structure and by arrangements
with authorized agencies and organizations of the
County. Major County departments include the board
of elections, county administrator, county attorney,
county clerk, courts, district attorney, department of
motor vehicles, emergency preparedness, employment
and training, highway, industrial development agency,
mental health, personnel, planning, public health,
public safety/correctional facility, purchasing ofce,
real property tax, sheriff’s ofce, social services, solid
waste and sanitation, and treasurer’s ofce.
Madison County Property Classicaons and Valuaons
Madison County has nine major property classica-
tions for tax assessment purposes. Nearly two-thirds
of the County’s properties are classied as residential.
More than one-fth of all properties are vacant land.
Agricultural land is the third largest classication at
nearly 6% of total.
As property taxes are a main source of revenue for
any county, the composition and assessed valuation
of the tax base are critical issues. Fully two-thirds of
Madison County’s assessed valuation comes from
Exhibit 68. Madison County Property by Property Class—2010
Property Class Total by Property Class % Total Property Value by Class % Average Value
Agricultural 2,131 5.8% $175,575,851 4.2% $82,391
Residenal 23,258 63.8% 2,760,919,266 66.8% 118,708
Vacant Land 8,180 22.4% 148,096,881 3.6% 18,105
Commercial 1,437 3.9% 374,855,804 9.1% 260,860Recreaon & Entertainment 137 0.4% 41,356,230 1.0% 301,870
Community Services 502 1.4% 495,987,700 12.0% 988,023
Industrial 68 0.2% 40,647,325 1.0% 597,755
Public Services 197 0.5% 54,247,290 1.3% 275,367
Wild, Forested, Conservaon and Public
Park533 1.5% 41,908,600 1.0% 78,628
Total 36,443 $4,133,594,947
Source: Madison County Planning Department
Madison County Economic Development StrategyPage 78

7/29/2019 Madison County's economic development plan, 2013
http://slidepdf.com/reader/full/madison-countys-economic-development-plan-2013 79/192
residential property. Agriculture provides slightly over
4% of the total assessed valuation while commercial
properties, comprising nearly 4% of the total number
of properties, provide over 9% of total valuation.
Public Safety
One of the most important responsibilities of
federal, state, and local units of government is the
protection of the public’s safety. In Madison County
this responsibility is addressed by the State Police,
the County’s Sheriff’s Ofce (civil, correctional, and
criminal divisions), and municipal law enforcement
departments in the Villages of Canastota, Cazeno-
via, Chittenango, Hamilton, and the City of Oneida.
Supplementing the services provided by the area’s
law enforcement personnel is the re and ambulance
rescue services provided by a full-time professional
re department maintained by the City of Oneida and
numerous volunteer departments which are strategi-
cally located throughout the County. Working together,
these communities have achieved an excellent track
record in providing for the public welfare and have
contributed signicantly in helping to make Madison
County one of the safest places to live in the United
States ( Exhibit 69).
Infrastructure
A region’s physical infrastructure encompasses
existing transportation, communication, and utility
networks that act as the support system for delivering
goods and services. Infrastructure is built, maintained
and, in some instances, rebuilt by government as well
as private businesses, and its condition, reliability and
comprehensiveness is a crucial component of an area’s
business climate. A mature infrastructure network
requires long-term capacity and capital improve-
ment planning on the part of the relevant operator to
maintain the system’s ability to service existing and
potential users.
Madison County’s location in the geographic center
of the State allows it to capitalize on many infrastruc-
ture improvements that have been made to connect
the various regions of New York State together and, in
turn, to national and international destinations. From
the Erie Canal to the NYS Thruway system, Madison
County occupies a central location in the movement
of people and goods across and through the State. Fur -
thermore, its location between the Syracuse and Utica
Exhibit 70. Regional Infrastructure Components: Major Roads and
Airports
!(
!(
!(
!(!(
!(
!(
!(
!(
$1 $1$1
$1
$1$1 $1$1$1 $1o
o
o
§̈¦81
§̈¦690 §̈¦481
UV12
UV12
UV8
UV365
UV481
UV20
UV5
§̈¦90
ONEIDA
ROME
OSWEGO
UTICA
SYRACUSE
HAMILTON
CAZENOVIA
CANASTOTA
CHITTENANGO
Syracuse HancockInternational Airport
HamiltonAirport
Utica/Rome Airport(No Daily Service)
$1 Thruway Interchange
MADISON
COUNTY
Source: CNY RPDB
Exhibit 69. Crimes Reported, Madison County 2003 - 2007
Year/
CrimeAll Crime
Violent
CrimeMurder Rape Robbery
Agg,
Assault
Property
CrimeBurglary Larceny MV The
2003 1,266 82 0 15 12 55 1,184 262 892 30
2004 1,404 71 1 14 15 41 1,333 317 992 24
2005 1,298 83 1 22 11 49 1,215 257 939 19
2006 1,217 66 0 19 5 42 1,151 296 830 25
2007 1,373 67 2 12 7 46 1,306 306 971 29
Source: NYS Division of Criminal Justice Services
Madison County Economic Development Strategy Page

7/29/2019 Madison County's economic development plan, 2013
http://slidepdf.com/reader/full/madison-countys-economic-development-plan-2013 80/192
metropolitan areas also enables it to benet from the
proximity of services in those markets, such as airports
and rail facilities.
Transportaon Infrastructure
Air Access
Syracuse Hancock International Airport is located
approximately 35 miles west of Madison County and
provides direct air access to seventeen major destina-
tions: Atlanta, Baltimore, Boston, Buffalo, Charlotte,
Chicago, Cincinnati, Cleveland, Detroit, Hartford,
Newark, New York City, Orlando, Philadelphia, Pitts-
burgh, Toronto and Washington, DC. There is also an
executive airport in the Town of Hamilton.
Syracuse Hancock International Airport is served bythe following major air carriers:
● Air Canada
● American Eagle
● Continental
● Delta
● JetBlue
● United Express
● U.S. Airways
Approximately 2.3 million passengers travel
through the airport each year. The air cargo operations
at Syracuse Hancock International Airport are located
on 22.5 acres of land. The airport handles approxi-
mately 380 million tons of cargo per year.
Syracuse Hancock International Airport is well
equipped to meet the increasing demand for air freight
service. Air cargo activity includes the handling of air
cargo and express and regular mail. A 100,000–square-
foot cargo building with a parking apron allows direct
aircraft access for quick and efcient cargo handling.
Highway Access
The New York State Thruway (I-90) bisects the
northern section of the County and provides access to
I-81 to the west for north-south travel. Three Thru-
way interchanges provide access to Madison County
destinations, with one, Exit 34, lying within the County
at Canastota. According to the NYS Department of
Transportation, the number of vehicles transiting these
interchanges on a daily basis is between 33,000 and
36,000. Travel distances to adjacent metro areas from
Exit 33 include: Syracuse (35 miles), Rochester (100
miles), Buffalo (160 miles), Albany (100 miles) and
New York City (260 miles).
Several other U.S. and State highways provide
access to various parts of the County. The largest
capacity roads are State Routes 5, 31, and U.S. Route
20 which provide east-west transit through the County
and State Routes 12B, 13, and 46 which connect the
northern and southern parts of the County.
Public Transit
Access to public transportation is an important con-
sideration in determining the mobility of the County’s
workforce and its ability to reach centers of employ-
ment. The Madison County Transit System (MTS) is a
public transportation service operated by Birnie Bus.
The service is completely open to the public and offers
both point-to-point and dial-a-ride service. The point-
to-point service operates year round, Monday through
Friday; Dial-A-Ride service operates weekdays from
6:00 a.m. to 1:00 p.m., with call ahead reservations
required. MTS has a eet of 9 vehicles, with typi-
cally 6 buses operating on a daily basis. Currently
MTS operates a northern route, connecting Hamilton/
Oneida/Canastota, a southern route,connecting Ham-
iltion/Morrisville/Canastota and a mini-xed route
servicing Stoneleigh Housing in Canastota and the
Oneida Towers in Oneida. The routes are designed to
provide service to the population centers in the County,
major areas of employment, as well as some of the less
populated areas.
Madison County Economic Development StrategyPage 80

7/29/2019 Madison County's economic development plan, 2013
http://slidepdf.com/reader/full/madison-countys-economic-development-plan-2013 81/192
Rail Access
A major CSX rail line traverses Madison County
parallel to the NYS Thruway, but currently there are no
sidings in Madison County nor are there any tranship-
ment points. A major CSX rail yard, intermodal termi-
nal and TRANSFLO terminal is located in Kirkville,
NY, in the Town of Manlius, which abuts the western
Madison County line. According to the 2009 New
York State Rail Plan, this terminal primarily serves
the central and northeastern portions of New York
and is serviced by a network of 13 trains which reach
intermodal terminals throughout the CSX system and
beyond. The facility primarily handles double-stack
container trafc. Containers destined for Upstate NY
are layered on the top and are “lleted” from the top
layer and transloaded for tractor-trailer distribution.
Telecommunicaons Network
Madison County is relatively well-served by most
of the main telecommunications technologies. More
sparsely populated areas lack high speed Internet
access and wireless coverage. The map below depicts
the structure of the County’s telecommunications
network as presented in the 2003 Central New York
Telecommunications Study prepared by ECC Tech-
nologies Inc.
Telecommunications services are concentrated
along the Route 5 and Route 20 corridors. Geographi-
cally, Frontier Communications is the largest incum-
bent telecommunications provider with coverage in the
southern half of the County. Windstream Communica-
tions, Verizon and Time Warner provide services in the
northern and central portions of the County.
Madison County is served by a number of major
ber optic routes. The major north/south routes include
Route 46 and 12B from the City of Oneida south
through the Village of Hamilton (Colgate University)
and on into Chenango County. Another major route
originates in Syracuse and travels along Route 92
though the Village of Manlius and into Cazenovia. The
major east/west routes include the Route 20, Route 31,
and NYS Thruway-Route 90 corridors. Each of these
routes are continuous across the entire county. Major
ber providers in the County include Verizon, Frontier,
Windstream and Time Warner.
Madison County is served by a network of 13 cen-
tral ofces (CO) which are well distributed throughout
the County. Central ofces are the facilities which
house the equipment used to switch local and long
distance telephone calls. Each CO is designated one
or more 3-digit dialing codes (the exchange portion
of a telephone number). There are also 41 cell tower
locations in the County with a majority of these sites
located in the northern and central portions of the
County.
All prime development sites and localities in the
County are located along one of the main ber optic
corridors. These areas are also served by a comprehen-
sive array of modern telecommunications services. The
development sites indicated include the main villages,
all existing industrial/business parks, Colgate Univer -
sity and SUNY Morrisville.
The map in Exhibit 73 portrays the current Stateestimate of internet coverage in the County. Most of
the populated sections of the County are serviced by
either cable-modem or DSL-delivered Internet. There
remain several pockets of non-service, primarily in the
more rural southern portion of the County but there are
also some notable non-covered areas close to popula-
tion centers.
Electricity and Gas Delivery
Networks
Madison County is located in the National Grid and
NYS Electric and Gas service areas.
Electricity rates are based on the utility’s C,D and E
Load Zones pricing structure.
Madison County Economic Development Strategy Page

7/29/2019 Madison County's economic development plan, 2013
http://slidepdf.com/reader/full/madison-countys-economic-development-plan-2013 82/192
Exhibit 72. Madison County Telecommunication Resources, 2004
Source: CNY RPDB/ECC Technologies, Inc.
Exhibit 71. Public Water Supply Systems, Madison County, 2009
COMMUNITY PWS CAPACITY LIMITATION
PEAK AVG
MONTHLY
USAGE
EXCESS
CAPACITY
% CAPACITY
AVAILABLE
(V) CAZENOVIA PWS 1.152 MGD TREATMENT 0.317 MGD 0.835 MGD 72.40%
(V) DERUYTER PWS 0.288 MGD PUMP CAPACITY 0.051 MGD 0.237 MGD 82.20%
(V) EARLVILLE PWS 0.742 MGD PUMP CAPACITY 0.068 MGD 0.674 MGD 90.80%
(V) ERIEVILLE PWS SPRINGS, SUBJECT TO DROUGHT / GWUDI
(V) GEORGETOWN 0.202 MGD PUMP CAPACITY 0.017 MGD 0.185 MGD 91.50%
(V) HAMILTON PWS 3.17 MGD SOURCE YIELD 0.499 MGD 2.671 MGD 84.20%
(V) MADISON PWS 0.173 MGD PUMP CAPACITY 0.070 MGD 0.103 MGD 59.50%
(V) MORRISVILLE PWS 0.532 MGD PUMP CAPACITY 0.112 MGD 0.420 MGD 78.90%
NEW WOODSTOCK PWS 0.461 MGD PUMP CAPACITY 0.036 MGD 0.426 MGD 92.10%
MORRISVILLE COLLEGE PWS 0.389 MGD TREATMENT 0.25 MGD 0.139 MGD 35.70%
CITY OF ONEIDA PWS 3.815 MGD WSA PERMIT 2.411 MGD 1.404 MGD 36.80%
Source: Madison County Health Department
Madison County Economic Development StrategyPage 82

7/29/2019 Madison County's economic development plan, 2013
http://slidepdf.com/reader/full/madison-countys-economic-development-plan-2013 83/192
The Village of Hamilton’s municipal utility and the
Oneida Madison Energy Cooperative offer low cost
electric service to residential and commercial custom-
ers in the southern portion of the County.
Water Supply
Municipal water systems serve 59% of the County’s
population through 12 municipal public water systems
(PWS), the largest being the Onondaga County Water
Authority (OCWA) service area in the northern portion
of the County. The City of Oneida and many of the
County’s villages operate their own water systems.
Approximately 41% of the County’s population is
served by privately-owned wells.
Exhibit 71 describes capacities and peak usage
amounts for the various systems. For the most part,
these systems display adequate capacities based
on percentage of total capacity available. Specic
demands would need to be matched against avail-
able supplies to determine whether a constraint exists.
OCWA, which supplies the large service area in the
northern part of the County that includes Chittenango
and Canastota, has excess capacity and could provide
considerably more water to service area customers
from its Lake Ontario intake. Development that creates
additional demand for water in the OCWA service area
should not confront any capacity constraints.
Exhibit 73. Madison County Internet Coverage Areas, 2011
UV26
UV12
UV46
UV13
UV8UV12BUV80
UV20
UV92
UV31
UV173
UV26
UV13
UV80
UV5
§̈¦90
SULLIVAN
EATON
BROOKFIELD
LENOX
NELSON
CAZENOVIA
LEBANON
MADISON
HAMILTON
FENNER
DERUYTER
LINCOLN
GEORGETOWN
SMITHFIELD
STOCKBRIDGE
ONEIDA
CANASTOTA
HAMILTON
CHITTENANGO
CAZENOVIA
WAMPSVILLE
MORRISVILLE
MUNNSVILLE
MADISON
EARLVILLE
DERUYTER
i i l i i ll
i ii
Legend
DSL Access (DSL-Digital Subscriber Line/LocalTelephone Network)
Map does not depict areas with Broadbandhigh-speed Internet access.
Source: New York State
Madison County Economic Development Strategy PageMadison County Strategic Economic Development Plan Page

7/29/2019 Madison County's economic development plan, 2013
http://slidepdf.com/reader/full/madison-countys-economic-development-plan-2013 84/192
Wastewater Treatment
Approximately 50% of the County’s land area is
served by privately-owned septic systems and another
25% is within a publicly operated municipal wastewa-
ter service area. The latter, as would be expected, lie
within the populated centers of the County or, as in the
case of Morrisville State College, are operated by a
single large user.
Exhibit 74 describes the treatment capacities of the
various municipal wastewater treatment systems in
place in the County. With the exception of the Canas-
tota facility, all facilities evidence some excess capac-
ity. Again, as was the case with the municipal water
systems, the adequacy of the systems would have to
be measured against a specic new demand to gaugewhether a constraint might exist to new development
in the facility’s service area.
Solid Waste Management
Madison County’s integrated solid waste manage-
ment system consists of one central sanitary landll in
the Town of Lincoln, three transfer stations ( located
in the Towns of Hamilton, Cazenovia, and Sullivan),
a central materials recovery facility located adjacent
to the landll site, and four yards and recyclables
drop-off locations (at the three transfer stations and the
sanitary landll). Madison County does not use general
tax revenue to subsidize its waste management system.
Revenues from landll tipping fees and recyclables
sales are used to operate, maintain, and pay off the debt
service for all solid waste and recycling facilities. In
order to ensure the continued operation of these facili-
ties, the County adopted Local Law No. 4 for the year
beginning 2001 to reinstate ow control for non-haz-
ardous solid waste generated within Madison County.
Madison County has met the milestones outlined in
their original Solid Waste Management Plan (SWMP—
1991) including the permitting and development of a
Exhibit 74. Wastewater Treatment Facilities, Madison County
COMMUNITY PWS / WWTP CAPACITY LIMITATION
PEAK AVG
MONTHLY
USAGE
EXCESS
CAPACITY
%
CAPACITY
AVAILABLE
(V) CAZ / MADISON CO WWTP 0.95 MGD SPDES PERMIT
*0.853 MGD 0.10 MGD 10.50%
**0.691 MGD 0.26 MGD 27.30%
(V) CANASTOTA WWTP 1.73 MGD SPDES PERMIT*1.84 MGD [0.11MGD] [6.30%]
**1.55 MGD 0.18 MGD 10.40%
(V) HAMILTON WWTP 0.85 MGD SPDES PERMIT
*0.75 MGD 0.10 MGD 11.70%
**0.65 MGD 0.20 MGD 23.50%
(V) CHITTENANGO WWTP 1.30 MGDSPDES PERMIT# AMENDED
8/090.65 MGD 0.65 MGD 50%
CITY OF ONEIDA WWTP 3.75 MGD SPDES PERMIT 3.40 MGD 0.35 MGD 9.30%
Source: Madison County Health
Department
* PEAK WET WEATHER FLOW; MARCH
** 2ND HIGHEST MONTH, APRIL
Source: Madison County Department of Health
Madison County Economic Development StrategyPage 84

7/29/2019 Madison County's economic development plan, 2013
http://slidepdf.com/reader/full/madison-countys-economic-development-plan-2013 85/192
landll expansion to allow for continued landlling
of wastes, as well as the continued operation of the
materials recovery facility, waste yard composting
facility, sharps collection program, and public recy-
cling education program. Building on these accom-
plishments, Madison County has installed an active gas
collection system for both the closed East Side Landll
and the active West Side Landll. The system, which
collects methane gas produced by the waste with
vacuum pressure, is being utilized to fuel a landll
gas to energy project that was successfully completed
in 2009 through a joint venture with Waste Manage-
ment Renewable Energy, LLC. The energy facility is
projected to generate approximately 1.3 megawatts
of electricity—or approximately enough electricity to
meet the needs of a village the size of Cazenovia. InApril 2009, the County issued a request for proposals
from companies that may be interested in utilizing the
excess heat generated from the landll gas to energy
facility. In conjunction with this RFP, the County has
been pursuing the development of an Agriculture and
Renewable Energy (ARE) Park on portions of the
County’s landll property.
Business and Industrial Parks
Several business and industrial parks have been or
are in the process of being established throughout the
County, as depicted in Exhibit 75.
The City of Oneida Business Park is a 38-acre site,
currently home to businesses such as All-Seasonings
Ingredients, Inc. and Ofce Environmental Con-
sultants, Inc. Only 3 acres of this park are currently
unoccupied.
The City of Oneida is also examining a proposed
412-acre business park boasting access to CSX main
line. The site has undergone several of the key steps
to make it shovel ready, including zoning changes
and utilities infrastructure engineering feasibility, and
is also within about six miles of two different I-90
interchanges.
The Canastota Business Park is a 224-acre busi-
ness park located only 2 miles from Exit 34 on the
New York State Thruway and a mere 25 miles from
Syracuse Hancock International Airport. Presently 150
acres of this site are occupied.
The Lakeport Business Park sits on both the north
and south sides of New York State Route 31 at Lake-
port Road. At 150 acres, this park is shovel-ready, and
26 acres are currently occupied.
The Hamilton Airpark is a 125-acre property
adjacent to an airport with a 5,200-foot runway and is
currently home to businesses like Brink Manufacturing
Co., Vantine Studios, and Wendt University Inn, LLC.
There are currently 50 acres available for development.
The Trush Park in Cazenovia offers easy access
to the Village of Cazenovia and to State Route 20, an
East-West highway. The site consists of 318 acres, 125
of which are presently occupied with companies like
Marquardt Switches, GHD, Dielectric Laboratories,
Pelco, Tronser, Community Memorial Hospital, and
Cazenovia Children’s Home.
The County is currently developing plans for an
Agriculture and Renewable Energy (ARE) Park on 150
acres of County-owned land in the Town of Lincoln.
The purpose of the proposed ARE Park is to provide
an economically-stimulating, environmentally-sound,
and shovel-ready development area that would be
benecial to the surrounding community and that
Madison County Economic Development Strategy Page

7/29/2019 Madison County's economic development plan, 2013
http://slidepdf.com/reader/full/madison-countys-economic-development-plan-2013 86/192
Exhibit 75. Business and Industrial Parks
Wampsville
26
12
46
13
812B
80
20
92
31
173
26
13
80
5
90Oneida
Madison
DeRuyter
Hamilton
Cazenovia
Earlville
Canastota
Munnsville
Chittenango
Morrisville
9
8
7
6
5
4
3
2
1
Legend
Industrial Park
Waterbodies
State Recreation Lands
Industrial Park Descripon
1. Lakeport Business Park 150-acre mixed-use park currently in development stage
2. Canastota Business Park224-acre mixed-use industrial park with educaon and warehousing
operaons
3. Canastota-Thruway Exit 34 116-acre zoned commercial
4. City of Oneida Business Park 38-acre mixed use site for light manufacturing and related operaons
5. Oneida- Curn Industrial Park 412-acre site with potenal for industrial use and rail access
6. Trush Industrial Park 318-acre mixed-use technology park with day-care center
7. Hamilton/Mid-York Airpark 125-acre mixed-use business park located near Colgate University
8. CNY Agribusiness Development Site 1,100-acre site currently in the development stage
9. Madison County Agriculture and Renewable Energy Park 150-acre proposed business park
Source: MCIDA
Madison County Strategic Economic Development PlanPage 86
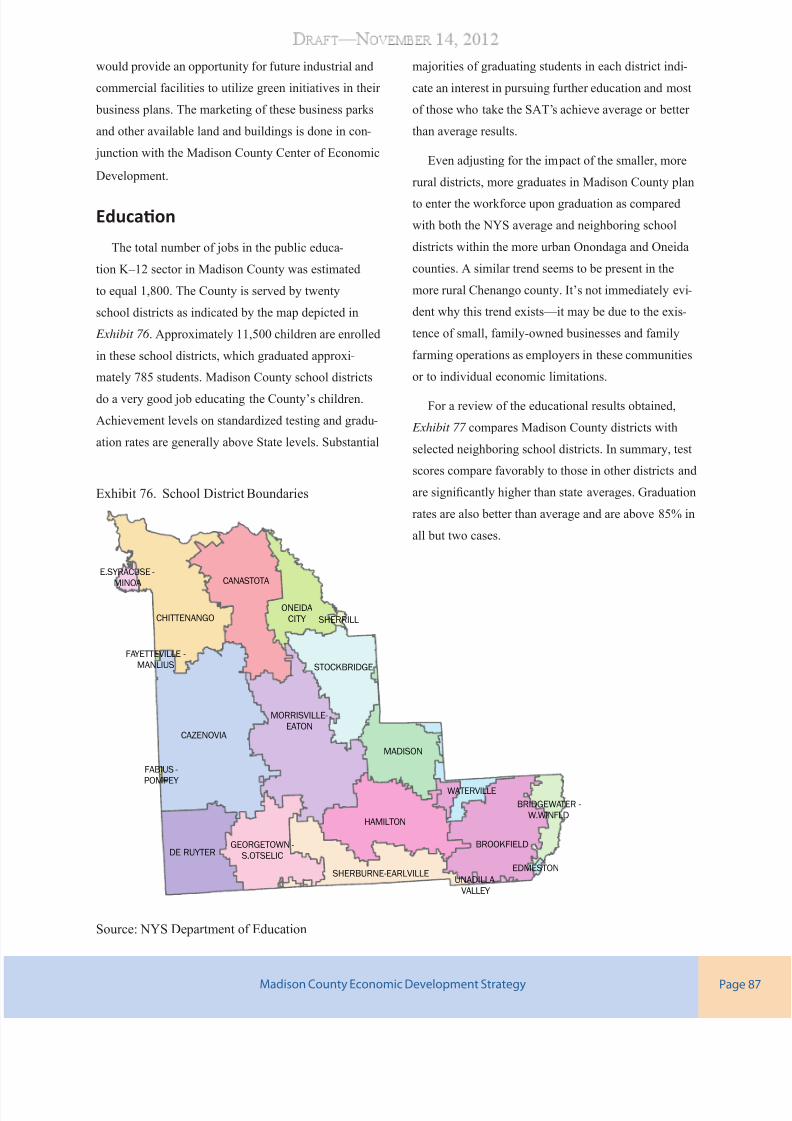
7/29/2019 Madison County's economic development plan, 2013
http://slidepdf.com/reader/full/madison-countys-economic-development-plan-2013 87/192
would provide an opportunity for future industrial and
commercial facilities to utilize green initiatives in their
business plans. The marketing of these business parks
and other available land and buildings is done in con-
junction with the Madison County Center of Economic
Development.
Educaon
The total number of jobs in the public educa-
tion K–12 sector in Madison County was estimated
to equal 1,800. The County is served by twenty
school districts as indicated by the map depicted in
Exhibit 76 . Approximately 11,500 children are enrolled
in these school districts, which graduated approxi-
mately 785 students. Madison County school districts
do a very good job educating the County’s children.
Achievement levels on standardized testing and gradu-
ation rates are generally above State levels. Substantial
majorities of graduating students in each district indi-
cate an interest in pursuing further education and most
of those who take the SAT’s achieve average or better
than average results.
Even adjusting for the impact of the smaller, more
rural districts, more graduates in Madison County plan
to enter the workforce upon graduation as compared
with both the NYS average and neighboring school
districts within the more urban Onondaga and Oneida
counties. A similar trend seems to be present in the
more rural Chenango county. It’s not immediately evi-
dent why this trend exists—it may be due to the exis-
tence of small, family-owned businesses and family
farming operations as employers in these communities
or to individual economic limitations.
For a review of the educational results obtained,
Exhibit 77 compares Madison County districts with
selected neighboring school districts. In summary, test
scores compare favorably to those in other districts and
are signicantly higher than state averages. Graduation
rates are also better than average and are above 85% in
all but two cases.
Exhibit 76. School District Boundaries
CAZENOVIA
CANASTOTA
HAMILTON
CHITTENANGO
BROOKFIELD
MORRISVILLE-
EATON
DE RUYTER
MADISON
STOCKBRIDGE
ONEIDA
CITY
SHERBURNE-EARLVILLE
GEORGETOWN -
S.OTSELIC
WATERVILLE
BRIDGEWATER -
W.WINFLD
E.SYRACUSE -
MINOA
SHERRILL
EDMESTON
UNADILLA
VALLEY
FABIUS -
POMPEY
FAYETTEVILLE -
MANLIUS
Source: NYS Department of Education
Madison County Economic Development Strategy Page

7/29/2019 Madison County's economic development plan, 2013
http://slidepdf.com/reader/full/madison-countys-economic-development-plan-2013 88/192
Exhibit 77. School District Data for the 2006–07 School Year, Madison County School Districts and selected regional school districts
School DistrictNo. of
Students
Expend.
Per Pupil
% Secondary Level
Students Meeng State
Standards
Grad Rate
%
% Grads
Planning
to aend
2Yr./4Yr.
College
% Grads
Planning
to Go to
Work
Students
taking SATSAT Math
SAT
English
Math EnglishCrical
Reading
Madison
Brookeld 248 $14,873 78 83 88 58/29 8 13 497 475
Canastota 1,623 $12,820 72 71 86 35/44 13 68 477 496
Cazenovia 1,798 $12,130 95 92 93 11/74 8 124 540 530
Chienango 2,394 $12,941 87 87 85 29/51 15 132 517 491
DeRuyter 497 $13,722 47 76 83 52/10 23 16 513 468
Hamilton 636 $11,860 89 84 88 19/64 9 50 530 528
Madison 471 $15,912 74 85 92 43/42 16 20 609 517
Morrisville-Eaton 850 $14,648 90 90 90 44/31 21 24 483 475
Oneida City 2,487 $12,244 77 74 78 37/38 9 91 523 499
Stockbridge Valley 538 $14,248 88 88 91 35/33 18 30 487 455
Onondaga
Baldwinsville 5,998 $14,281 88 86 90 30/56 6 318 550 522
Fabius-Pompey 874 $14,953 90 85 87 37/52 8 52 560 508
Fayeville-Manlius 4,738 $13,609 90 88 95 13/81 1 344 589 566
Liverpool 7,965 $14,570 82 79 84 34/47 0 472 525 513
West Genesee 5,172 $11,753 94 95 90 37/56 4 342 533 520
Oneida
Camden Central 2,552 $12,258 77 74 88 46/33 13 112 496 496
New Harord 2,654 $14,595 98 95 95 25/70 5 208 546 524
Rome City 5,444 $15,495 71 73 74 40/39 2 223 483 481
Whitesboro Central 3,659 $12,669 90 83 87 51/40 6 162 526 494
Chenango
Bainbridge-Guilford 983 $13,440 82 79 89 41/33 11 60 502 490
Norwich 2,145 $13,227 77 76 82 26/39 14 107 500 491
Sherburne-Earlville 1,614 $13,872 77 73 86 36/33 21 78 517 521
NYS
2,741,258 $16,212 72 74 75 29/50 6
Source: 2007 college-bound seniors average scores Math =515, English =502
Source: NYS Education Department
Madison County Strategic Economic Development PlanPage 88

7/29/2019 Madison County's economic development plan, 2013
http://slidepdf.com/reader/full/madison-countys-economic-development-plan-2013 89/192
Health Care
The health care facilities available in Madison
County are listed in Exhibit 78 . To these must be added
the facilities available in Syracuse and Utica, since
the specialties and services available in those institu-
tions would be considered to be part of the health care
environment in Madison County.
Regarding the availability of health services in
Madison County, the recently published Health
Improvement Planning Report for Madison County
(10/2009) found that there are several areas in which
availability of health care services is not optimal and
that shortages of health care professionals hamper
delivery of needed services. The report stated:
“In rural areas such as Madison County, having
‘breadth’ and ‘depth’ of providers creates potential
access issues. First, the breadth of specialists available
to serve our residents (e.g., neurologists) is limited;
and second, for those specialists that are available we
lack “depth” or a redundancy of these types of provid-
ers. One specialty provider leaving the area could seri-
ously affect our local health care system. Several areas,
predominantly in the southern tier of the Madison
County, are designated as Health Professional Shortage
Areas. Shortage Areas exist for both Primary Medical
Care and Mental Health Providers. Although Madison
County is not designated a health professional shortage
area for dental health, there are parts of the County that
lay outside the normal dental coverage area specically
in the south central and southeastern sections of the
County.”
In addition to the lack of primary and specialized
health care professionals, the County is further bur -
dened by an overall healthcare worker shortage. In the
2008 CHFWCNY Survey of Providers in CNY, health
care providers stated that one of the most signicant
barriers to addressing unmet health care needs was
workforce recruitment and retention. Nursing, nursing
assistant, and physician shortages were chief concerns
especially in the areas of primary care providers and
psychiatrists.
While this type of situation is not uncommon in
rural areas and while the relatively nearby medical
centers in Syracuse and Utica offer alternatives to
Madison County residents, more “depth and breadth”
in Madison County’s health care resource would posi-
tively affect quality of life assessments by current and
potential residents.
Housing
The amount, condition and value of Madison
County’s housing stock has been estimated by the
U.S. Census Bureau. Slightly more than 75% of
the occupied housing units in Madison County are
owner-occupied. Nearly 40% of the housing stock was
built before 1950 and only 17% has been built since
1990 evidencing the population stagnation of the past
two decades. The bulk of Madison County’s owner-
occupied homes are valued under $150,000 and their
estimated median value is $105,000, considerably less
than the U.S. and NY median values ($185,400 and
$300,600, respectively).
Despite some recent spikes and downturns in prices,
the median selling price of a home in Madison County
has steadily risen over the past several years. Com-
pared to the housing market that prevails in most of the
rest of the country at this point in time, the investment
value of real estate in Madison County would appear to
be extremely attractive.
Exhibit 78. Health Care Facilities per Capita, 2010
Healthcare Facilies Beds Sta
Oneida Healthcare
Center (Oneida)
101 Hospital,
160 SNF
874
(64 Physicians)
Community Memorial
Hospital (Hamilton)
40 Hospital,
40 SNF
382
(52 Physicians)
Basse Healthcare
Network (Hamilton)
Outpaent
(2 clinics)15 Prof. Sta
Crouse Extended Care
Facility (Morrisville)120 SNF only
Source: Madison County Department of Health
Madison County Economic Development Strategy Page

7/29/2019 Madison County's economic development plan, 2013
http://slidepdf.com/reader/full/madison-countys-economic-development-plan-2013 90/192
According to U.S. Census data, the cost of owning
or renting a home is signicantly lower in Madison
County than in NY as a whole ( Exhibit 80). Even
with relatively inexpensive housing, the median
price of homes in Madison County has been gradu-
ally rising over the past several years, indicating that
residential real estate is holding or increasing in value
( Exhibit 81).
Exhibit 81. Home Sales in Madison County
Source: City-Data.com
Exhibit 79. Housing Characteristics
Esmate %
Housing Occupancy:
Total Housing Units 29,612
Occupied 25,881 87.4%
Vacant 3,731 12.6%
Year Built:
2000 or later 1,751 5.9%
1990 -1999 3,327 11.2%
1980 - 1989 3,759 12.7%
1970 - 79 3,398 11.5%
1960 -1969 2,613 8.8%
1950 - 1959 3,090 10.4%
1940 - 1949 1,599 5.4%
1939 or earlier 10,075 34.0%
Housing Tenure:
Total Occupied Housing 25,881
Owner-occupied 19,733 76.2%
Renter occupied 6,148 23.8%
Value
Owner Occupied Units 19,733
Less than $50,000 2,286 11.6%
$50,000 - $99,999 7,017 35.6%
$100,000 - $149,999 4,688 23.8%
$150,000 - $199,999 2,523 12.8%
$200,000 - $299,999 1,924 9.8%
$300,000 - $499,999 940 4.8%
$500,000 -$999,999 266 1.3%
$1,000,000 or more 89 0.5%
Median (dollars) 105,400
Source: U.S. Census
Exhibit 80. Housing Costs, 2007
NYSMadison
County
Housing Units (2007) 7,905,969 29,360
Median Value $293,400 $98,500
Monthly Cost w/mort. $1,820 $1,148
Monthly Cost w/rent $898 $650
Source: U.S. Census, American Community Survey
Madison County Economic Development StrategyPage 90

7/29/2019 Madison County's economic development plan, 2013
http://slidepdf.com/reader/full/madison-countys-economic-development-plan-2013 91/192
Natural Resources
Madison County, the geographic center of New
York State, has abundant natural resources, includ-
ing productive soils, clean lakes and streams, healthy
forests, and sustained winds, which offer a foundation
for economic development as well as a desirable qual-
ity of life.
Soils
The landscape of Madison County encompasses
two distinct physiographic regions, the generally at
Lake Ontario lowlands (also known as the Oneida
Lake plain) to the north, and the Appalachian uplands
to the south. The southern region of the County is
characterized by rolling hills and broad valleys. These
two regions differ in topography and soils, and thus
suitability for agricultural production, and have expe-
rienced divergent settlement patterns as a result. The
most fertile soils are found in the valleys and the lake
plain, as discussed in the 2005 Madison County Agri-
culture and Farmland Protection Plan (MCAFPP).
The MCAFPP describes the results of a Natural
Resources Conservation Service (NRCS) classica-
tion system ranking the ability of Madison County soiltypes to support agronomic uses. The ranking system
considers the limitation of the soils for eld crop pro-
duction (e.g., corn and soybeans), the risk of degrada-
tion of soil quality when used for eld crop production,
and how well these soils will respond to management.
The ranking considers factors such as erodibility, depth
to water table, stoniness etc. Soils are ranked from
Class I (fewest limitations) to Class VIII (most severe
limitations).
The Class I soils in Madison County are generally
found in the lake plain region and the broad valleys
of the Appalachian uplands. Class II soils, supporting
more limited crops and requiring additional conserva-
tion practices, are found throughout the County; most
are in northern upland region. Class III soils, exhibiting
severe limitations that reduce the choice of plants
and/or require special conservation practices, extend
throughout most of the southern regions outside of the
river valleys. The muckland soils of northern Madison
County are an exception. These Class VIII soils are
extremely restricted in plant type and in need of major
intervention for sustainable production. However, an
extensive drainage system was established in the mid-
20th century to mitigate seasonal ooding; this drain-
age system has allowed the muck soils to be highly
productive.
The soil types have supported a long history of agri-
cultural production in Madison County. As described
in the MCAFPP, there have been three distinct, and
somewhat overlapping, phases of agricultural produc-
tion since the 1850s. The rst phase was centered on
production of grains and hops. Hop production peaked
in the 1890s and declined throughout the rst decades
of the 20th century due to competition from western
growers and blue mold infestation. The emerging
popularity of craft brewers has contributed to a recent
resurgence of interest in hops production in Madison
County.
The second phase, which continues to be signi-
cant, is dairying. Milk and dairy products have long
accounted for the majority of the County’s sale of agri-
cultural products. Many acres of farmland, notably in
the Lake Plain and valleys of the Appalachian Upland,
are cultivated for corn production. The rolling hillsides
of the Appalachian Upland support pasture and small
grain crops and the majority of the small dairy opera-
tions. Grass-fed livestock production is an emerging
trend in Madison County. The third phase of agricul-
tural production has been vegetable crops, including
peas and beans in the southern towns and onions in
the muck soils of Canastota. Potatoes are another large
crop in the County. The uctuations in agricultural
crops are affected by a multitude of factors, including
market demand, technology, government support and
competition from other areas.
Madison County Economic Development Strategy Page

7/29/2019 Madison County's economic development plan, 2013
http://slidepdf.com/reader/full/madison-countys-economic-development-plan-2013 92/192
Exhibit 83. Madison County Lakes and Streams
UV12
UV46
UV13
UV8
UV12B
UV80
UV20
UV31
UV26
UV26
§̈¦90
Chenango
River
Beaver
Creek
Otselic
Creek
Sangerfield
River
Limestone Creek
Erie Canal
Unadilla
River
Oneida
Creek
Chittenango
Creek
Tuscarora
Lake Eaton
Reservoir Lake
Moraine
Cazenovia
Lake
De Ruyter
Reservoir
SULLIVAN
EATON
BROOKFIELD
LENOX
NELSONCAZENOVIA
LEBANON
MADISON
HAMILTON
FENNER
DERUYTER
LINCOLN
GEORGETOWN
STOCKBRIDGE
SMITHFIELD
ONEIDA
CANASTOTA
HAMILTON
CHITTENANGO
CAZENOVIA
WAMPSVILLE
MORRISVILLE
MUNNSVILLE
MADISON
EARLVILLE
DERUYTER
Oneida
Lake
Source: Madison County Planning Department
Exhibit 82. Madison County Lakes and Reservoirs
Lake Town
Surface
Area
(acres)
Maximum
Depth ()Fish Community
Bradley Brook
ReservoirEaton 137 27
Chain Pickerel, Pumpkinseed, Rock Bass, Northern Pike, Yellow Perch,
Brown Bullhead, Common Carp
Canastota Reservoir Lincoln 1.7 16 White Sucker, Brown Bullhead, Pumpkinseed, Yellow Perch
Cazenovia Lake Cazenovia 1164 45Black Crappie, Largemouth Bass, Rock Bass, Yellow Perch, Pumpkinseed,
Bluegill
DeRuyter Reservoir DeRuyter 575 50Largemouth bass, Walleye, Black Crappie, Smallmouth Bass, Yellow Perch,
White Sucker, Chain Pickerel, Rock Bass, Sunsh
Eaton Brook
ReservoirEaton, Nelson 272 40
Largemouth Bass, Smallmouth Bass, Rainbow Trout, Chain Pickerel,
Walleye, Yellow Perch, Bluegill, Rock Bass, Pumpkinseed, Black Crappie,
Brown Bullhead, White Sucker
Hatch Lake Eaton 133 63Largemouth Bass, Northern Pike, Cisco, Pumpkinseed, Bluegill, Yellow
Perch, White Sucker
Lebanon Reservoir Lebanon 96 45Largemouth Bass, Rainbow Trout, Black Crappie, Yellow Perch, Bluegill,
Pumpkinseed, White Sucker, Brown Bullhead
Lower Leland Pond Eaton 55 40Largemouth Bass, Northern Pike, Rudd, Brown Bullhead, Bown, Black
Crappie, White Perch, Pumpkinseed, Bluegill, Yellow Perch
Lake Moraine Madison 251 45Largemouth Bass, Smallmouth Bass, Chain Pickerel, Tiger Muskellunge,
Black Crappie, Bluegill
Poolville Pond Hamilton 37 40 Largemouth Bass, Yellow Perch, Chain Pickerel, Common carp
Stoney Pond Nelson 28 12 Largemouth Bass, Chain Pickerel, Pumpkinseed, Bluegill
Torpy Pond Georgetown 41 12 Chain Pickerel, Black Crappie, Pumpkinseed
Tuscarora Lake Nelson 308 40Largemouth Bass, Northern Pike, Walleye, Pumpkinseed, Bluegill, Yellow
Perch, White Sucker
Upper Leland Pond Eaton 46 50
Largemouth Bass, Brown Trout, Chain Pickerel, Tiger Muskellunge, Pump -
kinseed, Redbreast Sunsh, Rock Bass, Yellow Perch, Black Crappie, Brown
Bullhead, White Sucker, Bluegill
Source: NYS DEC
Madison County Strategic Economic Development PlanPage 92

7/29/2019 Madison County's economic development plan, 2013
http://slidepdf.com/reader/full/madison-countys-economic-development-plan-2013 93/192
Surface Waters
Bordered by Oneida Lake, the largest lake entirely
within New York State, Madison County has 14 other
lakes, ponds and reservoirs large enough to be classi-
ed as state-owned waters ( Exhibit 82). Water quality
and aquatic habitat conditions are generally very high.
The lakes support year-round recreation and contribute
to the beauty of the landscape. In addition, the lakes
contribute to the tax base of their communities, since
property values rise with proximity to surface waters.
The County’s humid continental climate, with an
annual average rainfall of more than 40 inches, creates
a water surplus each year, which supports a network of
surface streams and rivers and replenishes the surcial
and deep aquifers. Three major watersheds convergein Madison County: the Susquehanna River Drainage
Basin, the Seneca-Oneida-Oswego Rivers Drainage
Basin, and the Mohawk River Drainage Basin. Over
twelve hundred miles of streams, rivers and creeks are
mapped in the County.
The County’s topography and abundance of year-
round streams provide the potential to generate micro-
hydroelectric energy (micro-hydro). A white paper
discussing the physical and institutional opportunities
and challenges associated with developing this local
renewable energy source (Jablonski and Hofmeyer
2010) concluded that more than 600 miles of streams
within Madison County were suitable for micro-hydro
based on ow and vertical drop. While educational and
legislative barriers remain, there is an enormous oppor -
tunity to develop micro-hydro to benet landowners,
farmers, businesses, and communities throughout the
County.
Forest Resources
The Madison County landscape is a mosaic of for -
ested areas, open elds, working farms, and residential
development. As summarized in Exhibit 84, forested
areas and reverting elds (scrub shrubs) together
account for almost half of the land cover, with agri-
cultural elds and pastures representing another 40%.
Much of the forest land is managed for multiple uses,
including harvesting, recreational trails and access for
hunting. Thousands of acres are held in public owner -
ship ( Exhibit 85), with more than 20 public forests and
parks within the County.
In addition to their intrinsic recreational and habitat
value, the forests and woodlands are important to the
economy of Madison County. Managed forests provide
fuel and biomass along with raw material to manufac-
ture furniture and other products. Madison County has
a long history of excellent land stewardship, and the
forests are managed for a sustainable yield as well as
for multiple uses.
Wind Resources
Madison County is home to the State’s rst com-
mercial-scale wind farm. At present, two wind farms
with a total rating of 41.5 MW are producing electri-
cal energy in Madison County, with a third under
Exhibit 84. Madison County Forest and Parklands
Forest or Parkland Size (acres)
Beaver Creek State Forest 3,500Brookeld Railroad State Forest 870
Charles Baker State Forest 9,400
Chienango Falls State Park 190
DeRuyter State Forest 970
Earleville State Forest 630
Gorton Lake State Forest 500
Great Swamp Conservancy 60
Helen L. McNi State Park 130
Lebanon State Forest 780
Mariposa State Forest 3,000
Morrow Mt. State Forest 1,290
Muller Hill State Forest 3,090
Nelson Swamp Unique Area 1,500
Nichols Pond County Park 45
Old Erie Canal State Park 36 mile linear park
Oxbow Falls County Park 100
Stoney Pond State Forest 1,470
Texas Hill State Park 700
Three Springs State Forest 800
Tioughnioga Wildlife Management
Area3,800
Source: Madison County Planning Department
Madison County Economic Development Strategy Page

7/29/2019 Madison County's economic development plan, 2013
http://slidepdf.com/reader/full/madison-countys-economic-development-plan-2013 94/192
development. The criteria for developing commercial-
scale wind farms include sustained average wind speeds
in the range of 15–17 mph or greater (Class 4 winds).
The County’s topography and setting on the boundary of
the Appalachian Uplands and the Lake Plain create ideal
conditions for sustained winds in this range. A recent
map of wind classications within Madison County is
included as Exhibit 86 . In addition, institutional factors
such as proximity to demand centers, the high costs of
electrical energy in the Northeast, federal tax incentives,
and legislative mandates enhance the potential for devel-
oping this renewable resource.
Shale Gas
Portions of Madison County are underlain by the
Marcellus Shale, which is a Middle Devonian-age black, low density, carbonaceous (organic rich) shale.
Within the past decade, geologists have determined
that a tremendous reservoir of natural gas is
held in the Marcellus Shale- estimates of this
gas reserve are as high as 500 trillion cubic
feet. The formation is nearly a mile or more
below the ground surface through much of its
extent. Using horizontal drilling and hydraulic
fracturing methods, perhaps 10% of that gas
(50 trillion cubic feet) might be recoverable.
That volume of natural gas would be enough to
supply the entire United States for about two
years and have a wellhead value of about one
trillion dollars, according to Professor Terry
Englander of Penn State University and other
experts.
The presence of such a large volume of
potentially recoverable gas in the eastern
United States has a great economic signi-
cance. This will be some of the closest natu-
ral gas to the high population areas of New
Jersey, New York and New England. This
transportation advantage will give Marcellus gas a
distinct advantage in the marketplace. Once developed,
the Marcellus shale should have a positive impact on the
stability of natural gas supply of the surrounding region
for years, if the resource estimates are accurate.
Development of the Marcellus shale gas will affect
the economy of Madison County. Leasing for mineral
rights has been active since around 2006, and some land-
owners have negotiated lucrative agreements. Devel-
opment of this new industry has the potential to bring
new jobs and businesses to the region. Before hydraulic
fracturing is undertaken, however, the New York State
Department of Environmental Conservation (NYS DEC)
must complete its environmental review and set forth
permitting requirements. Action by NYS DEC is
expected in 2012.
Madison County Economic Development StrategyPage 94
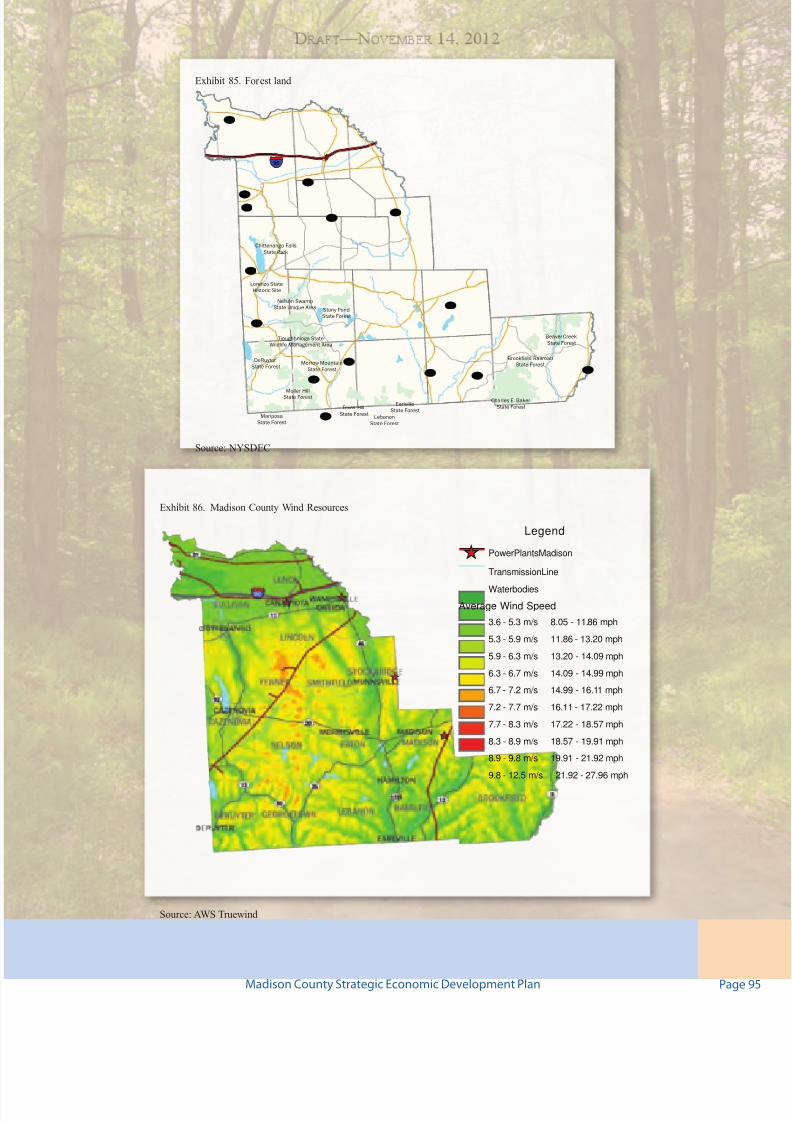
7/29/2019 Madison County's economic development plan, 2013
http://slidepdf.com/reader/full/madison-countys-economic-development-plan-2013 95/192
Exhibit 86. Madison County Wind Resources
Legend
_̂ PowerPlantsMadison
TransmissionLine
Waterbodies
Average Wind Speed
3.6 - 5.3 m/s 8.05 - 11.86 mph
5.3 - 5.9 m/s 11.86 - 13.20 mph
5.9 - 6.3 m/s 13.20 - 14.09 mph
6.3 - 6.7 m/s 14.09 - 14.99 mph
6.7 - 7.2 m/s 14.99 - 16.11 mph
7.2 - 7.7 m/s 16.11 - 17.22 mph
7.7 - 8.3 m/s 17.22 - 18.57 mph
8.3 - 8.9 m/s 18.57 - 19.91 mph
8.9 - 9.8 m/s 19.91 - 21.92 mph
9.8 - 12.5 m/s 21.92 - 27.96 mph
Source: AWS Truewind
Exhibit 85. Forest land
Earlville
State Forest
Brookfield Railroad
State Forest
Beaver Creek
State Forest
Stony Pond
State Forest
Morrow Mountain
State Forest
Texas Hill
State ForestLebanon
State Forest
Muller HillState Forest
Mariposa
State Forest
UV25
Tioughhnioga State
Wildlife Management Area
DeRuyter
State Forest
Charles E. Baker
State Forest
Nelson Swamp
State Unique Area
Lorenzo State
Historic Site
Chittenango Falls
State Park
UV26
UV12
UV46
UV13
UV8UV12BUV80
UV20
UV92
UV31
UV173
UV26
UV13
UV5
§̈¦90
Source: NYSDEC
Madison County Strategic Economic Development Plan Page

7/29/2019 Madison County's economic development plan, 2013
http://slidepdf.com/reader/full/madison-countys-economic-development-plan-2013 96/192
Economic DevelopmentResources and MajorIniaves
Business Development
The MCIDA is a professionally staffed organiza-tion with ofces in Canastota, New York that was
formed by Madison County for the purpose of foster -
ing development throughout Madison County in order
to generate and enhance the livelihood of area busi-
nesses, industries, communities, and citizens and to
enrich the overall quality of life in the County. This is
accomplished by facilitating the nancing of construc-
tion or rehabilitating of facilities and equipping them
to expand job opportunities within the area.
As a public benet corporation, the MCIDA can
provide access to taxable and tax-exempt bond nanc-
ing, elimination of sales tax on material and equipment
used for manufacturing, the establishment of pay-
ment in lieu of tax agreements for the management of
real property taxes, and the elimination of mortgage
recording tax. In addition to these statutory powers, the
MCIDA provides a range of other economic develop-
ment services including introducing company repre-
sentatives to local government and community leaders,
providing access to nancial incentives and job train-
ing resources available at the federal, state, and local
level, assisting businesses with the identication and
development of real estate, and with various business
recruitment initiatives.
To supplement the economic development resources
in the County, the MCIDA has partnered with several
organizations that operate on a federal, state, and local
level. These organizations include the NYS Empire
State Development Corporation, Center State CEO,
Manufacturer’s Association of Syracuse and Central
New York, National Grid, Central New York Regional
Planning and Development Board, the U.S. Small
Business Administration, NYS Department of Labor,
U.S. Department of Agriculture-World Development,
NYS Department of Transportation, NYS Energy
Research and Development Authority, and NY Power
Authority.
Agribusiness
Through all the changes in farming, Madison
County has recognized the primary role agriculture
continues to play in the local economy, and has been
proactive in providing support to this industry. The
support is evident in the technical resources dedicated
to supporting agricultural producers, land use and gov-
ernance policies, and support to regional partnerships.
Several examples of these economic development tools
are summarized briey.
There are currently 13 Agricultural Districts in the
County encompassing more than 153,000 acres or
about 36% of County lands. The agricultural districts
provide both economic and regulatory incentives to
remain in farming.
The Madison County Agriculture and Farmland
Protection Plan was developed by the Madison County
Farmland Protection Board in collaboration with the
Planning Department, Board of Supervisors, CornellCooperative Extension, U.S. Environmental Protection
Agency, and the NYS Department of Agriculture and
Markets. The Plan seeks to ensure the economic viabil-
ity of farming, to keep prime farmland in production,
and to promote the industry’s development in new and
different ways.
Madison County supports an Agricultural Economic
Development Specialist position; this has resulted in a
range of innovative and effective programs designed
to support existing producers as well as encourage
new business models. Among the many initiatives of
the AED program is a focus on ‘Buy Local,’ includ-
ing a successful on-line market to bring local products
to consumers. The AED program has improved local
appreciation of the importance of agriculture to the
Madison County Economic Development StrategyPage 96

7/29/2019 Madison County's economic development plan, 2013
http://slidepdf.com/reader/full/madison-countys-economic-development-plan-2013 97/192
local economy, landscape and history by producing a
self-guided farm map, open farm days, and an annual
Fresh Gala to celebrate local foods.
A revolving loan fund to enhance marketing for
agricultural products was capitalized through a federal
USDA grant.
Morrisville State College offers training in agricul-
ture-related professions, including business manage-
ment and marketing. The College is also home to a
Renewable Energy Training Center.
Nelson Farms, Morrisville State College’s small-
scale food processing center, serves local farmers,
small business owners, and entrepreneurs in producing,
packaging and marketing products. Currently, more
than 250 clients produce 500+ products at the facility,
with an average of 18,300 units produced per month.
Clients’ products are carried in more than 1,000 retail
outlets.
Workforce Development
The Madison County Ofce of Workforce Develop-
ment is responsible for providing workforce develop-
ment services to both job seekers and businesses to
help ensure job seekers gain meaningful employ-
ment and businesses develop a rst-rate workforce.
Services for job seekers include: one-on-one
career counseling; employment related workshops;
free use of computers, fax, and phones for job
search; and if available, nancial assistance for
training, both classroom and on-the-job.
Services for businesses include: post job open-
ings; pre-screen job applicants; use of ofce spacefor recruitments and interviews; and if available,
nancial assistance for training costs for on-the-job
training and customized training.
Madison County Ofce of Workforce Develop-
ment is federally funded through the Workforce
Investment Act (WIA).
Tourism
Madison County Tourism, Inc. is a membership
based destination marketing organization. They pro-
mote the tourism industry in Madison County to poten-
tial visitors who reside in other parts of the northeast.
Annually, they print a 56 page full color travel guide
highlighting the things to do, places to stay, and places
to eat among other points of interest. They also main-
tain a website offering the same information, a blog
which is updated several times a week, and a strong
social media presence promoting the happenings in the
County.
Each year the board of directors and executive
director create a marketing plan which utilizes print,
digital and radio advertising to publicize the County’stourism industry. The funding for this media plan and
many of the day to day operations is derived from the
4% occupancy tax charged to patrons of hotels, B&Bs,
country inns, and campgrounds in the County. Madison
County Tourism has been the County recognized tour -
ism promotion agency for over 15 years.
Madison County Economic Development Strategy Page

7/29/2019 Madison County's economic development plan, 2013
http://slidepdf.com/reader/full/madison-countys-economic-development-plan-2013 98/192
Madison County Economic Development StrategyPage 98

7/29/2019 Madison County's economic development plan, 2013
http://slidepdf.com/reader/full/madison-countys-economic-development-plan-2013 99/192
A review of the information presented in this report
shows that the preparation of the economic develop-
ment strategy must be carefully calibrated to account
for developments which are occurring on an interna-
tional, national, and regional level.
As noted in recent years by the International Mon-
etary Fund, the world economic recovery is proceeding
broadly with most advanced and emerging economies
still facing major adjustments, including the need to
strengthen household balance sheets, stabilize and
subsequently reduce high public debt, and repair andreform their nancial sectors. Supplementing this
information is a comprehensive overview on the cur-
rent condition of the NYS economy as provided by the
NYS Comptroller’s ofce. These reports underscore
the fact that New York is slowly recovering from the
worst recession since the Great Depression but still
faces signicant challenges and risk with unemploy-
ment rates high and many upstate regions struggling.
On a regional level, data was presented which
documented that the population base in Central New
York has stabilized in recent years following a sharp
decline estimated to have taken place from 1985–1995.
In looking at these gures, it is important to note
that the area’s population is now at the highest level
it has ever been in the history of this region. Other
demographic factors show that the region’s per capita
income is comparable with similar sized metropolitan
areas and has increased in recent years in a manner that
is consistent with general trends across the State and
nation. Education data clearly suggests the region is
in a strong position to provide the educated workforce
needed by employers today.
On the economic front information was presented
that documents the diversity of the region’s economy,
which has proven to be a real benet to the area as
residents struggle with the nation’s current economic
recession. In reviewing this data, it is important to note
that this economic diversity is consistent with similar
patterns taking place in many parts of the country and
is a reection of a natural shift in the nation’s economy
and not the result of some major public policy initia-
tives which have been implemented at the federal,
state, or local level. With regard to the CNY labor
force, the region’s labor force has remained very stable
in recent years. Data shows that wage rates in the
region are very competitive with labor cost across the
country.
In addition to the economic development opportuni-
ties that can be gleaned from the data are the possi-
bilities presented to communities who can capitalize
on the presence of several major employers in CNY.
Complementing these companies are the opportuni-
ties presented by the fact that there are several major
employment clusters in Central New York. Theseclusters include biomedical, logistics and distribution,
electronics, industrial machinery, materials processing,
food precessing, education, and health care service.
Supporting the economic base of the area is a large
network of transportation assets, public water and sani-
tary sewer systems, electric and natural gas supplies,
telecommunication systems, public safety services,
public education, and various recreational assets.
Complementing these resources is an extensive profes-
sional business service and banking network that exists
in Central New York. This network provides a very
robust and competitive array of services and nancial
resources to support economic growth in the region.
Regarding governance, information was presented
which demonstrates the challenges facing government
Madison County Economic Development Strategy Page
Goal and Recommendation
C H A P T E R
3Draft —November 14,

7/29/2019 Madison County's economic development plan, 2013
http://slidepdf.com/reader/full/madison-countys-economic-development-plan-2013 100/192
today to provide vitally needed public services and
infrastructure while at the same time controlling costs.
This situation presents a very challenging situation to
the region’s business community and often undermines
efforts to attract and retain companies at the local level.
Putting all the data in perspective, regional bench-
marking analysis shows that Central New York is in
a fairly competitive position ranking 162 out of 366
metropolitan areas in the nation in one study and 80
out of 366 in another study. Each of these studies
demonstrates that the regions’ economy has improved
fairly dramatically in recent years when compared
to other communities across the nation. In addition,
information presented in the CNY Regional Economic
Development Council’s Strategic Economic Develop-
ment Council Plan: 2012–2016 noted the opportunities
associated with efforts focused on three priority goals
including strengthening target industries, improved
competitiveness in the world marketplace, and revital-
izing the region’s urban cores and main streets.
Looking more closely at county level data, it was
revealed that Madison County population grew more
that other counties in Central New York and currently
stands at a total population base of 73,442, which is
the highest level in history. Financially, the per capita
income in the County is fairly competitive and is sup-
ported by a very diverse employment base with jobs
distributed across a broad spectrum of industry clas-
sications. In reviewing workforce data for Madison
County, it is important to note that a large number of
county residents currently commute for work out-
side of the County. Information regarding municipal
governance and services suggest that Madison County
is operating very efciently with public employment at
the local level declining over the past ten years.
Based upon the information and research presented
above, the Steering Committee has established the
following goal and recommendations for the Madison
County Economic Development Strategy.
GOALMadison County will connue eorts to support the
growth of a diverse economic base that will provide
employment opportunies for a broad cross secon of
cizens across the enre community.
In keeping with this goal, the County will focus aenon on
several key areas including governance, business retenon
and expansion, business aracon, infrastructureand real estate development, manufacturing and the
producer service industry, agriculture, retail and tourism,
alternave energy development, and employee training
and workforce development.
Madison County Economic Development StrategyPage 100

7/29/2019 Madison County's economic development plan, 2013
http://slidepdf.com/reader/full/madison-countys-economic-development-plan-2013 101/192
A. Governance
Te nature o local governance is an important con-
sideration when evaluating an area’s economic develop-
ment potential. As noted by national site location con-
sultants, a critical evaluation o this area will include an
analysis o responsibilities and eectiveness o state andlocal government agencies, the level o commitment to
economic development demonstrated by the ocials
and sta o these agencies and by the community as a
whole, and the type o resources that have been devoted
to enhancing the region’s opportunities or to growth.
Government is responsible or the maintenance and
improvement o public systems that businesses and
their employees depend on. Public services such as
road improvements, law enorcement, education, water
and sewer service are all critical to the ability o busi-
nesses to operate eectively. Government also regulates
certain business activities through various laws and
ordinances and can impose various business and real
estate taxes. Aordable ees and taxes to maintain and
expand services and the government’s responsiveness
to business needs in these areas are important eco-
nomic development considerations.
Te right combination o government support or
business, eectiveness in carrying out public programs,
and involvement in business activity as regulator can be
a prime actor inuencing the decision o a business to
locate or stay in an area.
General Operaons
Recommendaon Responsible Timing Status
Maintain a strong foundaon for management and delivery of
aordable government services at the County and local govern-
ment level
Madison County Board of Supervisors
(MC-BOS)Immediate Ongoing
Maintain appropriate county legislave commiee system to
provide proper oversight and support for planning and economic
development eorts
MC-BOS Immediate Ongoing
Establish an Economic Development Leadership Council at the
County level with representaon from business, government, and
higher educaon
MC-BOS Short Term To be planned
Maintain a strong array of aordable public services and infra-structure resources parcularly in the areas of roads, water and
sewer, public safety, solid waste management, public educaon,
telecommunicaons, and workforce training
MC-BOS ( along with federal, state, and
local municipal partners)Immediate Ongoing
Support eorts to address concerns regarding the costs of State
mandated services and energy costs in NYS
MC-BOS ( along with regional and
local partners; State legislave
representaves)
Immediate Ongoing
Economic Development
Recommendaon Responsible Timing Status
Maintain a county supported oce of economic development
with appropriate professional and support sta
MC-BOS and Madison County Industrial
Development Agency (MC-IDA)Immediate Complete
Represent the Madison County Center for Economic Development MC-IDA Immediate CompleteHouse a range of economic development iniaves in the oce
of the Madison County Center for Economic Development
- including IDA, business retenon and recruitment, agriculture,
tourism, workforce development and main street redevelopment
MC-BOS and MC-IDA
Intermediate
and long term
acon
To be planned
Build strong relaonships with various regional/statewide /
naonal service providers i.e. NYS Empire State Development
Corporaon, USDA, SBA, Naonal Grid, NYS Economic Develop-
ment Council, EDGE, CenterState CEO, CNY RPDB, etc.
Madison County Center for Economic
Development (MC-CED)Immediate Ongoing
Madison County Economic Development Strategy Page

7/29/2019 Madison County's economic development plan, 2013
http://slidepdf.com/reader/full/madison-countys-economic-development-plan-2013 102/192
Recommendaon Responsible Timing Status
Establish strong working relaonship with the Onondaga County
Water Authority, Thruway Authority, CSX, Port Authority of
Oswego, Verizon, Time Warner, NYS DOT, etc.
MC-CED Immediate Ongoing
Convene workshops of industry experts - develop a local “eco-
nomic expert” roundtable to review economic status, resources
and opportunies for economic development
MC-CED Intermediate To be planned
Prepare a comprehensive economic development strategy for the
CountyMC-CED Immediate
To be
completed by
12/31/12
Maintain a professional economic development website MC-CED Immediate Complete
Develop a plan and allocaon of sta resources to maintain the
websiteMC-CED Immediate Complete
Establish an instuonal framework to idenfy organizaonal
responsibility for compleng various economic development
projects
MC-BOS/MC-IDA Immediate Ongoing
Regularly evaluate IDA incenve programs and loan fund
objecves to ensure they align with evolving economic develop-
ment objecves, community needs, and compeon in the
marketplace
MC-IDA Immediate Ongoing
Convene annual meeng of the Oce of economic development
with invited guests and formal presentaons, company recogni-
ons, awards, etc.
MC-CED Immediate To be planned
Prepare annual report for leadership and public distribuon MC-CED Immediate To be planned
Conduct community leadership training program MC-CED Intermediate To be planned
Maintain close contact with college/university presidents to
integrate major development iniaves and programs into county
economic development eorts
MC-CED Intermediate To be planned
Coordinate a formal outreach program and educaon iniave to
area chambers of commerceMC-CED
Short and
IntermediateOngoing
Engage with media to provide posive economic development
newsMC-CED Immediate Ongoing
Boost eorts to pursue relevant grant opportunies to support
economic development projects in the CountyMC-CED and regional partners Immediate Ongoing
Organize outreach meengs with municipal ocials to familiar-
ize these ocials with the County’s economic development
programs economic development programs
MC-CED Short term To be planned
Secure leadership/corporate tesmonials to post on website and
markeng materialMC-CED Intermediate To be planned
Maintain strong relaonships with industry experts and round-
table parcipantsMC-CED Immediate Ongoing
Planning
Recommendaon Responsible Timing Status
Conduct review of County/municipal codes, ordinances, rules and
regulaons with regard to their impact on economic development
Madison County Department of Plan-
ning (MC-DP)Intermediate
To be
planned
Develop one-stop shop for zoning and building permit informa-
on in the CountyMC-DP Intermediate
To be
planned
Invesgate opportunies to standardize County and municipal
forms and applicaons for perming, zoning and building codeapplicaons and for making these available on County website MC-DP Long-term
To be
planned
Invesgate the feasibility of establishing county/municipal on-line
development applicaon templatesMC-DP Long-term
To be
planned
Undertake a coordinated eort to use municipal controls to pro-
tect major development sites from encroachment of compeng
uses—i.e. residenal and commercial
MC-DP Long-termTo be
planned
Maintain county-wide infrastructure resource data base MC-DP Short -term Underway
Madison County Economic Development StrategyPage 102

7/29/2019 Madison County's economic development plan, 2013
http://slidepdf.com/reader/full/madison-countys-economic-development-plan-2013 103/192
Madison County Strategic Economic Development Plan Page

7/29/2019 Madison County's economic development plan, 2013
http://slidepdf.com/reader/full/madison-countys-economic-development-plan-2013 104/192
B. Infrastructure and RealEstate Development
Te provision o public inrastructure is one o the
most vital services that can be provided to the busi-
ness community in Madison County. Te principal
issues o concern to businesses in this area are accessand proximity to markets and sources o supply, either
physically through transportation networks or remotely
through the telecommunications network, the cost,
convenience and reliability o access, and the avail-
ability o sucient land or built space to accommodate
business needs at present and in the near uture.
Madison County sits at the center o NYS and
between the Syracuse and Utica metropolitan areas. It
benets rom its position in several ways. Te northern
portion o the County is served by a major highway
(I-90) and several other major state and county roads.
A east-west CSX rail line traverses the County with
a signicant transhipment yard located nearby in
Onondaga County. A large airport in Syracuse serves
the region. Signicant telecommunications assets are
in place throughout the County providing cellular and
internet communication.
Te densest development is along this northern
corridor connecting Syracuse with Utica. Most o the
County’s population is located in this area as are many
o the main employers. Te southern portions o the
County are more rural in nature and oer ewer roads
and less robust telecommunication services in general.
Tere is a signicant amount o vacant land in the
County. Approximately 22% o all properties in the
County are listed as vacant. Tese vacant parcels are
distributed throughout the County, many o which are
located near developed commercial and industrial par-
cels. Additional development potential exists in the net-
work o business and industrial parks. Te County has
developed or is partnering in the development o eight
business parks comprising nearly 1,350 acres. Each o
these parks has available space or business expansion.
Te present availability and type o inrastructure
and real estate will determine to a large degree the type
o development that can take place within the County
in the near term. Decisions regarding uture inrastruc-
ture projects and developments will need to be pursued
with a realistic and pragmatic approach that reects the
County’s strengths and the needs o the marketplace.
“The provision of public infrastructure
is one of the most vital services
that can be provided to the business
community in Madison County.”Source: William A. Fredrick, Wadley-Donovan Group
Madison County Economic Development StrategyPage 104

7/29/2019 Madison County's economic development plan, 2013
http://slidepdf.com/reader/full/madison-countys-economic-development-plan-2013 105/192
Recommendaon Responsible Timing Status
Develop a comprehensive inventory of public infrastructure and
major real estate resources in the County, including an assess-
ment of browneld development opportunies
MC-DP and MC-CED Short-term Underway
Develop a coordinated capital improvement plan for major State,
county and municipal infrastructure that supports economic
growth in the County
MC-DP and MC-CED IntermediateTo be
planned
Expand the telecommunicaon system throughout the County
with high speed connecvity capability
Central New York Regional Planning and
Development Board (CNY RPDB) andlocal partners
IntermediateTo be
planned
Complete development of a modern 911 emergency communica-
on system that is coordinated with deployment of county-wide
telecommunicaon system
MC-BOS Immediate
Project cur-
rently under
construcon
Connue development and maintenance of county-based solid
waste management systemMC-BOS Immediate ongoing
Connue eorts to develop the Madison County Agriculture and
Renewable Energy ParkMC-CED and MC-BOS
Short term underway
Undertake solar, wind, and micro-hydro demonstraon projects
at ARE parkMC-BOS and local partners Intermediate
Project plans
currently
being
invesgated
Invesgate the feasibility of establishing a county-based
biodigester/central heat and power plant at the County campus
in Wampsville to create demand for biomass resources in the
County
MC-BOS, MC-CED, CNY RPDB and other
local partnersLong-term
To be
planned
Develop an inventory of major parcels of vacant land and former
industrial sites in the County and perform regular assessment of
development potenal of these parcels
MC-CED, MC-DP and CNY RPDB Short TermTo be
planned
Prepare pre-development plans for major retail outlet and/or
warehouse distribuon center at Thruway Exit 34 in Canastota
MC-CED, Madison County Tourism, Inc
(MC-T) and local partnerIntermediate
To be
planned
Develop a comprehensive pre-development plan for a co-located
hotel/conference center in combinaon with hops/culinary/
equine instute
MC-CED, CNY RPDB, MC-T and Madison
County Agriculture Economic Develop-
ment Program (MC-AED)
IntermediateTo be
planned
Develop virtual building concept plans and pre-perming at keybusiness park/development sites in the County
MC-CED Intermediate To beplanned
Prepare concept plan for 200+ acre business park in county with
Thruway access and rail serviceMC-CED, CNY RPDB, and City of Oneida Immediate Complete
Invesgate the feasibility of establishing a private senior rere-
ment community at a key locaon in the County - seek developerMC-CED Long-term
To be
planned
Madison County Strategic Economic Development Plan Page

7/29/2019 Madison County's economic development plan, 2013
http://slidepdf.com/reader/full/madison-countys-economic-development-plan-2013 106/192
C. Business Retenon,Expansion, andEntrepreneurial Development
Business retention, expansion, and entrepreneurial
development initiatives must play a key role in any eco-
nomic development strategy. Te argument or a busi-ness retention/expansion program is strong. Businesses
already located in a community have chosen to be there
and are more likely to avor staying in place, working to
make expansions happen, and to nd workarounds or
nancial or regulatory problems because the cost and
disruption o a relocation are so high. Tese companies
should not be taken or granted. Te importance o
these businesses to a community’s ability to maintain
a sustainable pace o economic development is clear
when one considers that 80% o all new jobs created
in the U.S. come rom existing businesses. A strong
business retention program will be on the lookout or
problems within the local business community and
will be proactive in its response to business concerns,
recognizing that it is ar less expensive in the long run
to retain a business already in place than to bring a new
rm to the area.
Communities typically have three levels o employ-
ers in their economies—net wealth generators that
derive revenues rom selling their goods and services
outside the community; support industries that provide
goods and services or the net wealth generators; and
local consumer oriented businesses that serve the needs
o the community residents. Te core businesses are in
the net wealth generating segment which stimulates the
support services sector and pays the wages o a large
segment o local residents, directly or indirectly. Cer-
tain business services, however, need to be in place or
need to quickly develop to satisy and attract net wealth
generating companies. A certain level o consumer ser-
vices must also be present to provide convenient access
to needed goods and services or these businesses’
employees and amilies. Each o these business sectors
can benet rom a targeted retention and expansion
program.
Recommendaon Responsible Timing Status
Establish a formal business outreach program in the County that
coordinates the delivery of services provided by various agencies
to the small business community
MC-CED Immediate Ongoing
Establish a program to formally recognize and acknowledge exist-
ing businesses in the County MC-BOS and MC-CED Short-term
To be
planned
Convene workshops of local “economic expert” to review issues,
resources and opportunies for economic developmentMC-CED Short-term
To be
planned
Conduct corporate site visits at headquarters locaons—for
companies with plant locaons in Madison CountyMC-CED Intermediate
To be
planned
Conduct formal outreach to various business service providers
such as bankers, lawyers, and accountants to idenfy business
development opportunies and needs in the County
MC-CED Short- termTo be
planned
Complete a detailed inventory and contact list for major develop-
ment projects/business opportunies in Upstate New York—Fort
Drum, Albany Nanotech, Global Foundries, Turning Stone—that
represent business develop opportunies for local companies
CNY RPDB Short-termTo be
planned
Connue eorts to keep Nelson Farms and other county-based
incubator facilies in operaonMC-CED Immediate Ongoing
Invesgate the ulity and possible establishment of a ForeignTrade zone or subzone in the County MC-CED in partnership with OnondagaCounty IDA and CNY RPDB Short -term Underway
Establish entrepreneurial iniaves such as business plan compe-
ons and networking forums at area colleges
MC-CED in partnership with CenterState
CEOImmediate Underway
Establish a network of professional advisors to support develop-
ment of start-up companies
MC-CED in partnership with CenterState
CEOImmediate Underway
Develop formal relaonships with venture capital providers and
angel investors to support entrepreneurial development in the
County
MC-CED in partnership with CenterState
CEOImmediate Underway
Develop and maintain an aggressive business incenve and small
business loan program on the CountyMC-CED in partnership with MC-IDA Immediate Complete
Madison County Economic Development StrategyPage 106

7/29/2019 Madison County's economic development plan, 2013
http://slidepdf.com/reader/full/madison-countys-economic-development-plan-2013 107/192
“If a region does not make it through the initial site-selection
screening, then no specific sites in a
county will even be considered, whichis why regional collaboration is so
important. Most of the country is now organized economically by regions. As a
county you are competing with regionsacross the entire nation for business
attraction opportunities.”Source: Robert Price, Heron Consulting
Madison County Strategic Economic Development Plan Page

7/29/2019 Madison County's economic development plan, 2013
http://slidepdf.com/reader/full/madison-countys-economic-development-plan-2013 108/192
D. Business Aracon
Business attraction strategies, particularly targeted
strategies aimed at leveraging an area’s existing assets
and advantages, can ampliy a community’s inherent
strengths and even work to improve the situation o the
area’s existing rms by providing them with new sup-pliers or customers. Moreover, new rms recruited to
the area represent a signicant source o new demand
or land, labor, supplies, etc., that is unmatched by the
more gradual growth o existing companies. A newly
transplanted company can be a powerul shot in the
arm or a local economy. Successully attracting such
companies, however, can be an expensive undertaking
and the costs should be weighed careully against the
projected benets. A strategy to attract new businesses
to the area must have a comprehensive and balanced
approach toward business. Otherwise economic devel-
opment will be unsustainable and may stall or ail to
achieve its potential owing to an overemphasis on one
sector or an unjustiable allocation o scarce economic
development resources.
Recommendaon Responsible Timing Status
Develop a target industry business recruitment plan based in
part on certain industry sectors and employment clusters that
currently exist in CNY- including renewable energy, medical
instruments, food processors, informaon/nancial back oce
services, pharmaceucals, warehouse/distribuon
MC-CED in partnership with CenterState
CEO, NYS ESD and CNY RPDBImmediate Underway
Capitalize on proximity to major food processors based in NYS
to promote the County as a viable locaon for food processing
facilies
MC-CED and Madison County Agricul-
ture Economic Development Program
(MC-AED)
IntermediateTo be
planned
Pursue opportunies for back oce operaons looking to
expand/relocate from major metropolitan in the Northeast
MC-CED in partnership with CenterState
CEOImmediate Ongoing
Pursue foreign investment opportunies through exisng industry
contacts in the County
MC-CED in partnership with Center-
State CEOImmediate Ongoing
Undertake a coordinated outreach campaign to college alumni
through adversements in alumni magazinesMC-CED Intermediate
To be
planned
Develop and maintain relaonship with key site selectors that
serve key industry sectors appropriate for growth in the CountyMC-CED Immediate Ongoing
Prepare a report that inventories major companies with operang
facilies in small town/rural locaons in other parts of the
country—target these companies for markeng
CNY RPDB IntermediateTo be
planned
Pursue major companies in the equine industry that can bearacted to the County
MC-CED, Madison County Tourism, Inc.and MC-AED
Intermediate To beplanned
“Site selection is a process of elimination. Siteconsultants are systematically finding reasons
to eliminate potential locations. There is noutopia, so don’t think that before you market
your community you have to be perfect.”Source: Robert Ady, Ady International Company
Madison County Economic Development StrategyPage 108
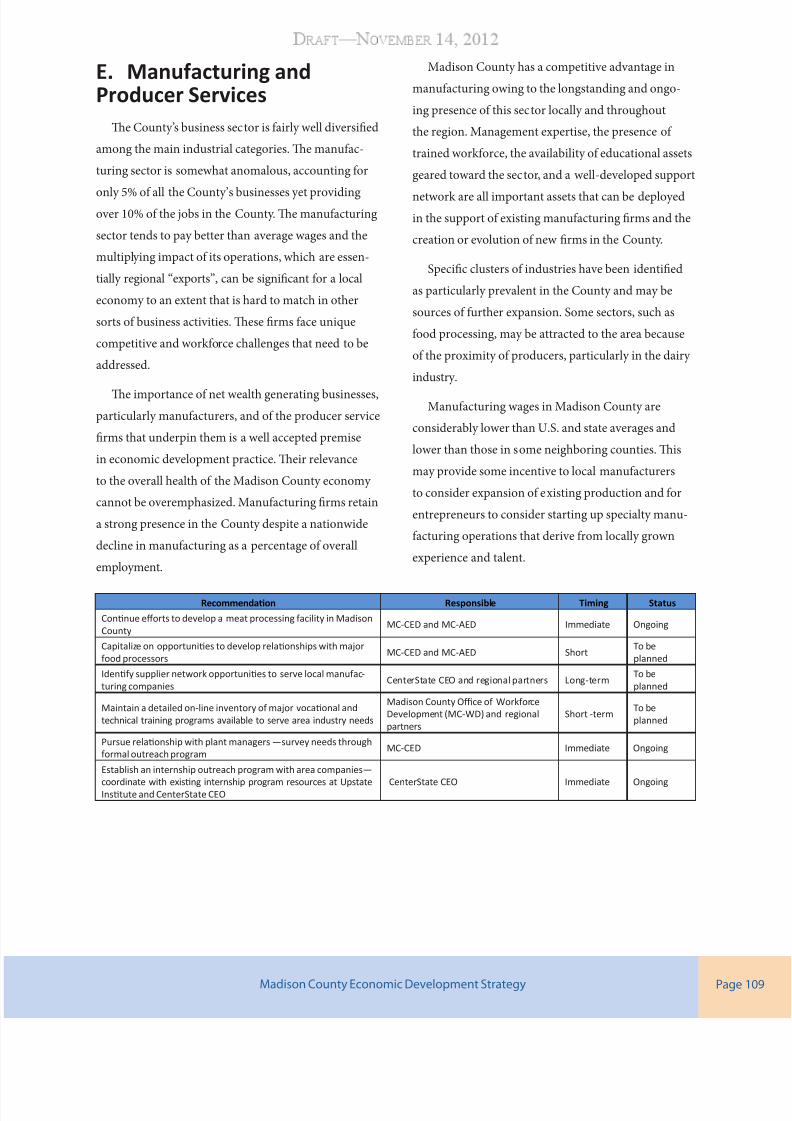
7/29/2019 Madison County's economic development plan, 2013
http://slidepdf.com/reader/full/madison-countys-economic-development-plan-2013 109/192
E. Manufacturing andProducer Services
Te County’s business sector is airly well diversied
among the main industrial categories. Te manuac-
turing sector is somewhat anomalous, accounting or
only 5% o all the County’s businesses yet providingover 10% o the jobs in the County. Te manuacturing
sector tends to pay better than average wages and the
multiplying impact o its operations, which are essen-
tially regional “exports”, can be signicant or a local
economy to an extent that is hard to match in other
sorts o business activities. Tese rms ace unique
competitive and workorce challenges that need to be
addressed.
Te importance o net wealth generating businesses,
particularly manuacturers, and o the producer service
rms that underpin them is a well accepted premise
in economic development practice. Teir relevance
to the overall health o the Madison County economy
cannot be overemphasized. Manuacturing rms retain
a strong presence in the County despite a nationwide
decline in manuacturing as a percentage o overall
employment.
Madison County has a competitive advantage in
manuacturing owing to the longstanding and ongo-
ing presence o this sector locally and throughout
the region. Management expertise, the presence o
trained workorce, the availability o educational assets
geared toward the sector, and a well-developed support
network are all important assets that can be deployed
in the support o existing manuacturing rms and the
creation or evolution o new rms in the County.
Specic clusters o industries have been identied
as particularly prevalent in the County and may be
sources o urther expansion. Some sectors, such as
ood processing, may be attracted to the area because
o the proximity o producers, particularly in the dairy
industry.
Manuacturing wages in Madison County are
considerably lower than U.S. and state averages and
lower than those in some neighboring counties. Tis
may provide some incentive to local manuacturers
to consider expansion o existing production and or
entrepreneurs to consider starting up specialty manu-
acturing operations that derive rom locally grown
experience and talent.
Recommendaon Responsible Timing Status
Connue eorts to develop a meat processing facility in Madison
CountyMC-CED and MC-AED Immediate Ongoing
Capitalize on opportunies to develop relaonships with major
food processorsMC-CED and MC-AED Short
To be
planned
Idenfy supplier network opportunies to serve local manufac-
turing companiesCenterState CEO and regional partners Long-term
To be
planned
Maintain a detailed on-line inventory of major vocaonal and
technical training programs available to serve area industry needs
Madison County Oce of Workforce
Development (MC-WD) and regional
partners
Short -termTo be
planned
Pursue relaonship with plant managers —survey needs through
formal outreach programMC-CED Immediate Ongoing
Establish an internship outreach program with area companies—
coordinate with exisng internship program resources at UpstateInstute and CenterState CEO CenterState CEO Immediate Ongoing
Madison County Economic Development Strategy Page

7/29/2019 Madison County's economic development plan, 2013
http://slidepdf.com/reader/full/madison-countys-economic-development-plan-2013 110/192
F. Agriculture
Agricultural activity is a relatively small part o the
County’s overall economy in terms o employment,
wages, and the value o economic output. It is currently
estimated there are 744 arm operators in the County
and the average size arm is 253 acres. Approximately
188,820 acres are in arm production and the overall
market value o agriculture products sold is $86 mil-
lion. Agriculture employment in the County is esti-
mated to be less than 1,000 jobs. However, the rural
nature o Madison County orms an important part o
the County’s image and is a distinct consideration when
assessing the quality o lie in the County. Moreover,
the potential or additional economic development
stemming rom new or expanding agricultural activi-
ties in the County oer some promising opportunities
or agri-entrepreneurs. Beyond the basic production o
agricultural products, there appear to be several value-
added activities in this sector that have not been ully
exploited but or which there is public and private sup-
port. Tese include SUNY Morrisville’s Nelson Farms,
the Hops rail initiative, the growing equine sector,
ood processing activity, agritourism, organic ood
products, and buy-local preerences.
Recommendaon Responsible Timing Status
Maintain an Agriculture Economic Development sta posion at
the County levelMC-BOS Immediate Complete
Develop and maintain inventory of farms and agricultural land
resources in the County
MC-CED and Madison County Agricul-
ture Economic Development Specialist
Program (MC-AED)
Immediate Complete
Develop a detailed inventory of farm resources, products, and
services and place on-lineMC-AED Short
To be
planned
Develop and maintain relaonship with key agriculture resources
providers—USDA, FSA, Cornell—Agriculture and Food Tech Park
/ Applied Economics and Management, Farm Service Bureau,
Senator Gellibrand, NYS Agriculture and Markets.
MC-AED Immediate Ongoing
Invesgate feasibility of establishing an instuonal agriculture
purchasing program—Colgate, Morrisville, Cazenovia College,
Hamilton College, public schools
MC-AED IntermediateTo be
planned
Support eorts to promote CNY Bounty and buy local program.
Assist farms with distribuon and markeng of productsMC-AED Immediate Ongoing
Connue eorts to develop alternave agriculture crops such as
hopsMC-AED Immediate Ongoing
Promote dairy grass organic farming and niche product for majormarkets such as NYC
MC-AED Short To beplanned
Develop a plan to capitalize on equine business opportunies—
associated with programs at Morrisville, Cazenovia, CornellMC-CED, MC-AED and MC-T Intermediate
To be
planned
Pursue adversing opportunies in equine trade publicaons MC-CED, MC-AED and MC-T IntermediateTo be
planned
Highlight and promote aracon of Brookeld horse trails Madison County Tourism Inc. (MC-T) ShortTo be
planned
Inventory major agriculture iniaves and commercial enterprise
developments on a regional basis to idenfy agriculture supply
side opportunies in the County
MC-AED in partnership with CNY RPDB IntermediateTo be
planned
Complete a detailed inventory of natural resources and under-
ulized land inventory in the County as basis for alternave crop
producon
MC-DP Short Underway
Secure funds to support alternave crop / niche value-addedproduct development MC-AED Immediate Ongoing
Complete review and disseminate informaon regarding SUNY-
ESF willow project and biomass study
SUNY College of Environmental Science
and Forestry (SUNY-ESF) and MC-AEDImmediate Underway
Pursue business development opportunies in major metro area
food centers—NYC, with focus on niche agriculture products
produced in the County
MC-AED in partnership with the NYS
Department of AgricultureLong-term
To be
planned
Develop program to help capitalize on value of marginal land
resources in the CountyMC-AED in partnership with SUNY-ESF Short Underway
Review studies and pursue funds to support growth of alternave
crops—willow, switchgrassMC-AED in partnership with SUNY-ESF Immediate Underway
Madison County Economic Development StrategyPage 110

7/29/2019 Madison County's economic development plan, 2013
http://slidepdf.com/reader/full/madison-countys-economic-development-plan-2013 111/192
“Agriculture is a relatively small part of the County’s overall economy;
however, a potential for additional economicgrowth stemming from new or expandingagricultural activities offers some promising
opportunities for the agri-entrepreneur.”Source: Chuck Hassebrook, Nebraska Center for Rural Affairs
Recommendaon Responsible Timing Status
Invesgate feasibility of agriculture /carbon trading program to
increase farm income— growing of “wood crops” to sequester
carbon
CNY RPDB IntermediateTo be
planned
Review track record on New York Wine and Culinary Instute.
Approach some of the companies involved in project to partner in
a Hops Instute in Madison County—Wegmans, Constellaon
MC-CED in partnership with MC-AED,
CNY RPDB and MC-TIntermediate
To be
planned
Develop a grower/food processor supply program—“All
Seasonings”MC-CED in partnership with MC-AED Intermediate
To be
planned
Operate a micro-enterprise loan fund for alternave crop andniche product development
MC-CED, MC-AED and CNY RPDB Immediate Complete
Madison County Strategic Economic Development Plan Page

7/29/2019 Madison County's economic development plan, 2013
http://slidepdf.com/reader/full/madison-countys-economic-development-plan-2013 112/192
G. Retail and Tourism
While the retail sector is not known or creating
high paying jobs generally, it is a major source o entry
level and part-time job opportunities. Te retail sector
can also play a large role in improving the quality o lie
in communities as part o a revival o main streets insmaller towns and cities and by the improvement in the
convenience o needed products and services in more
rural areas.
In 2009, it was estimated that approximately 2,600
jobs were based in the retail sector in Madison County.
Tese jobs account or 12% o the total employment
base and approximately 8% o the total payroll in the
County.
In reviewing these gures, it is important to note
that Madison County experiences a signicant amount
o retail leakage each year; these are resident purchases
that occur outside the County, estimated to total $43
million annually. Tese lost sales not only represent
lost retail job opportunities and other local economic
benets but also lost sales tax revenue. I the retail
opportunities represented by this outow o dollars
were retained within the County, the additional retail
establishments would enhance residents’ experiences
and could also serve to attract shoppers rom out-
side Madison County, stimulating jobs and sales tax
revenue.
ourism acts much like a net wealth generating
industry by attracting dollars rom outside the County
and stimulating associated retail and service busi-
nesses (e.g., lodging, restaurants, gas stations, etc.).
Madison County has numerous attractions and events
that can be leveraged to draw in visitors rom outside
the County and there is a dedicated organization with
sta that works to guide and promote these opportuni-
ties. ourism also has ramications or the County’s
agriculture sector through the development o agritour-
ism. Agritourism has the potential to supplement arm
incomes and draw more attention to the agricultural
products the County has to oer.
“As a unique economic development tool,the Main Street Four-Point Approach is the
foundation for local initiatives to revitalize
their business districts by leveraging local
assets—from cultural or architectural heritage
to local enterprises and community pride.”Source: Robert Camoin, Camoin Associates
Madison County Economic Development StrategyPage 112

7/29/2019 Madison County's economic development plan, 2013
http://slidepdf.com/reader/full/madison-countys-economic-development-plan-2013 113/192
Recommendaon Responsible Timing Status
Connue operaon and funding for the County’s Tourism
Development OceMC-BOS Immediate Ongoing
Complete a comprehensive inventory of major tourist arac-
ons and resources in the County with data measuring levels of
acvity, aendance, and impact—i.e. Turning Stone, Bouckville
Anque Fesval, Woodsman Field Days, college graduaon/sport-
ing events, Brookeld Forests Trails
Madison County Tourism, Inc (MC-T) ShortTo be
planned
Closely integrate various markeng iniaves such as Erie Canal
Naonal Heritage Corridor, Rt. 20 Scenic By-Way, and Equine Alley
into county tourism iniaves
MC-T IntermediateTo be
planned
Develop a strategic plan for the eecve promoon/funding of
cultural heritage sites in the CountyMC-T Intermediate
To be
planned
Invesgate ways to enhance image, aendance at Madison
County Fair, possibly though increased parcipaon of agricul-
tural community, new locaon.
MC-T IntermediateTo be
planned
Develop a capital improvement plan for major tourism assets and
resources in the County with priories idenedMC-T in partnership with MC-DP Intermediate
To be
planned
Improve appearance and maintenance of gateways to County MC-BOS Long-termTo be
planned
Invesgate the feasibility of establishing a major discount outlet
center at Thruway exit 34 in CanastotaMC-CED and MC-T Long-term
To be
planned
Pursue strategically located and coordinated development of
hotel/conference center with possible associaon with a hops/
culinary/equine instute
MC-CED in partnership with CNY RPDB
and MC-T
Long-termTo be
planned
Invesgate the economic impact and opportunies for aracng
a desnaon retail center to the County—i.e. Bass Pro /Cabela’s
MC-CED in partnership with the CNY
RPDBLong-term
To be
planned
Establish micro-lending program to support tourism development
and niche market retail opportunies in selected community
centers /main streets
MC-CED in partnership with CNY RPDB Immediate Complete
Invesgate the feasibility of establishing an oce of “Main
Street” coordinator to support retail development in selected
villages and hamlets in the County
MC-BOS in partnership with MC-CED
and MC-TShort -term
To be
planned
Inventory resources available from the Naonal Main Street
program and market to countyMC-DP, MC-ED and MC-T Short
To be
planned
Undertake a coordinated “Main Street” iniave in the County—
invesgate other revitalizaon programs that bring funding—e.g.,
Acve Living By Design
MC-DP in partnership with “to be
formed” Madison County Main Street
Program (MC-MSP)
IntermediateTo be
planned
Complete a detailed “Buxton” study of retail leakage and oppor-tunies in major retail centers in the County—City of Oneida and
villages across the County
MC-CED in partnership with MC-DP Intermediate To beplanned
Idenfy key under-ulized and vacant property/buildings in retail
centers across the County and target for redevelopmentMC-DP and MC-CED intermediate
To be
planned
Coordinate main street acvies with various college and
university iniaves and development opportuniesMC-MSP Long-term
To be
planned
Madison County Economic Development Strategy Page

7/29/2019 Madison County's economic development plan, 2013
http://slidepdf.com/reader/full/madison-countys-economic-development-plan-2013 114/192
H. Energy
Madison County has been at the oreront o renew-
able energy development in recent years. At present
two commercially-based wind arms with a total
rating o 41.5 MW are producing electrical energy in
the County. In addition, the County has successully
partnered with the private sector to develop a methane
gas-to-energy co-generation acility at the Madison
County Landll in the own o Lincoln. At the same
location the County has developed a small-scale solar
installation.
An analysis o the County’s natural resources also
suggests there are opportunities associated with capital-
izing on the County’s agriculture and orest land as
potential eedstock or biomass-based energy genera-
tion. Consideration must also be given to studies which
have recently been completed in the County suggest-
ing there is potential or the development o localized
micro-hydro power throughout the County. While
controversial, urther development o the two major
natural gas elds which run partially beneath land in
the southern portion o Madison County is also receiv-
ing considerable attention. aken together, develop-
ment o resources presents an opportunity to improve
the long term energy situation in Madison County while providing job opportunities or area residents.
Te development o alternative uel sources whose
costs are less volatile and impacts on the environment
less intrusive can be a spur to economic development.
Many rms seek to involve themselves in alternative
energy use to achieve status as a “green” company.
Others simply seek a stable and ecient orm o energy
to power their operations. Greeneld developments
can be undertaken with alternative energy as part o
the inrastructure, in turn leading to a less expensive
development proposition.
Recommendaon Responsible Timing Status
Idenfy and market the availability of low cost electric power
supplies through Village of Hamilton municipal electric system,
Madison County Municipal Power Authority, OMEC
MC-CED in partnership with
the CNY RPDBIntermediate To be planned
Undertake a coordinated municipal and instuonal central heat
and power plant iniave to create market for biomass resources
MC-BOS in partnership with
MC-CED and CNY RPDBLong-term To be planned
Undertake community-based alternave energy iniaves at ARE
Park—i.e. wind farm, central heat and power plant, micro-hydro,
and solar
MC-BOS in partnership with
MC-CED and CNY RPDBIntermediate Underway
Monitor research and demonstraon projects promoted byorganizaons such as SUNY-ESF, U.S. DOE Naonal Renewable
Energy Laboratory, Biomass Energy Research Center, Morrisville
College (renewable energy center) and Colgate (willow biomass)
for development opportunies in the County
CNY RPDB in partnership
with MC-CED and MC-BOSImmediate Ongoing
Inventory State forest and under-ulized land resources in
County as basis for development of energy resources and crops
(GIS-map)
MC-DP Short-term Complete
Obtain detailed guidance regarding access to State forest
resources as basis for biomass energy iniaveCNY RPDB Short-term To be planned
Develop inventory of County waterways and dams to assess
micro-hydro potenal (GIS-map).
MC-DP in partnership with
SUNY MorrisvilleIntermediate Complete
Seek federal and state funds to support biomass crop assistance
program
SUNY-ESF in partnership
with CNY RPDB and otherImmediate
Underway – SUNY-ESF
has secured a $4 million
USDA grant
Approach college/university presidents for parcipaon inalternave energy market crop iniaves
SUNY-ESF in partnership withCNY RPDB
Intermediate To be planned
Iniate and maintain contact with natural gas companies explor-
ing the Marcellus and Uca ShalesMC-DP and MC-CED Immediate Underway
“Biomass energy, harvested from the lands and forest, has the potential to provide an
important source of renewable energy for the County and jobs for local residents.”
Source: Chris Recchia, Executive Director, Biomass Energy Resource ...
Madison County Economic Development StrategyPage 114

7/29/2019 Madison County's economic development plan, 2013
http://slidepdf.com/reader/full/madison-countys-economic-development-plan-2013 115/192
I. Educaon and WorkforceTraining
Te availability o a trained workorce is one o the
most crucial ingredients in any decision by today’s
businesses to expand or relocate. Te development o
specialized skills is an expensive undertaking or any company and the availability o a pool o workers ready
to be productive is a major attraction or local and relo-
cating rms alike. Having such a workorce is key to
Madison County’s ability to participate in the dynamic
and highly competitive regional, national, and interna-
tional economies o today.
Te school systems that serve Madison County do
an excellent job o educating the County’s children and
rank among the best in the region. A good educational
system is a major asset or any community seeking to
develop a skilled workorce. While only a small per-
centage o high school graduates indicate an interest in
going directly to work, most plan on attending at least a
2 year college afer graduation.
Te presence o several universities that play a part
in training and supplying the workorce as well as in
research and development is a tremendous asset that
many communities lack. Programs specic to Madison
County needs have been developed at these institutions
and may serve as an impetus or growth in the uture.
Recommendaon Responsible Timing Status
Maintain an oce of workforce development and employee
training in the CountyMS-BOS Immediate Complete
Incorporate representaves from K–12, BOCES, and colleges/
universies on County Economic Development Leadership CouncilMC-BOS Short
To be
planned
Carefully inventory vocaonal and technology educaon
programs on a county and regional basis as informaon resource
to area employers and site locaon consultants
MC-WD in partnership with CenterState
CEO and CNY RPDBIntermediate
To be
planned
Disseminate informaon about available job training resources
and case study projects to area employersMC-WD Short
To be
planned
Capitalize a small business loan/grant program to support
employee training programMC-CED Intermediate
To be
planned
Develop an internship program for high school graduates and
college level students with major area employers—public and
private
CenterState CEO Immediate Complete
Invesgate the merit of establishing addional specialized train-
ing programs to address economic development opportunies in
the marketplace—see what other community colleges are doing
across the country
MC-CED in partnership with MC-WD,
CenterState CEO, and CNY RPDBLong-term
To be
planned
Develop formal career outreach program to area K–12 schools CenterState CEO IntermediateTo be
planned
Maintain contact with colleges and universies regarding specic
training needs of area employersMC-CED and MC-WD Long-term
To be
planned
Madison County Economic Development Strategy Page

7/29/2019 Madison County's economic development plan, 2013
http://slidepdf.com/reader/full/madison-countys-economic-development-plan-2013 116/192
Madison County Economic Development StrategyPage 116

7/29/2019 Madison County's economic development plan, 2013
http://slidepdf.com/reader/full/madison-countys-economic-development-plan-2013 117/192
Tabl 1. Historical U.S. and Rgional Population Trnds, 1910–2010
Source U.S. Cnsus Burau
Tabl 2. Nw York Stat Population stimats and projctions,
1990–2035
Source Cornll Program of Applid Dmographics
Tabl 3. Nw York Stat, Downstat and Upstat Historical
Population Trnds, 1940 - 2010
Source U.S. Population Cnsus
Madison County Economic Development Strategy Page
Central New York Data Pro
APPENDIX
ADraft —November 14,
D e m
o g r a p h i c s

7/29/2019 Madison County's economic development plan, 2013
http://slidepdf.com/reader/full/madison-countys-economic-development-plan-2013 118/192
Tabl 4. Total Population by County, Nw York Stat, Cnsus 2010
Essex
Erie
Lewis
St Lawrence
Franklin
Ulster
Hamilton
Oneida
Steuben
Clinton
Herkimer
Delaware
Suffolk
Jefferson
Otsego
Oswego
Warren
Sullivan
Allegany
Orange
Cattaraugus
Cayuga
Tioga
SaratogaWayne
Broome
Ontario
Greene
Chenango
Chautauqua
Dutchess
MonroeFulton
Albany
Onondaga
Madison
Yates
Niagara
Wyoming
Cortland
Genesee
Tompkins
Orleans
Chemung
Schuyler
Montgomery
Putnam
Washington
Columbia
Livingston
Schoharie
RensselaerSeneca
Westchester
NassauQueens
Rockland
Kings
Schenectady
Richmond
BronxNew York
Number of People
4836 - 99,999
100,000 - 199,999
200,000 - 999,999
1,000,000 - 1,999,999
2,000,0000 - 2,504,700
Source U.S. Cnsus Burau
Tabl 5. Prcnt Chang in Population by County, 2000 to 2010, Nw York Stat
Essex
Erie
Lewis
St Lawrence
Franklin
Ulster
Hamilton
Oneida
Steuben
Clinton
Herkimer
Delaware
Suffolk
Jefferson
Otsego
Oswego
Warren
Sullivan
Allegany
Orange
Cattaraugus
Cayuga
Tioga
SaratogaWayne
Broome
Ontario
Greene
Chenango
Chautauqua
Dutchess
MonroeFulton
Albany
Onondaga
Madison
Yates
Niagara
Wyoming
Cortland
Genesee
Tompkins
Orleans
Chemung
Schuyler
Montgomery
Putnam
Washington
Columbia
Livingston
Schoharie
RensselaerSeneca
Westchester
NassauQueens
Rockland
Kings
Schenectady
Richmond
BronxNew York
Percent Change
-5 to -10.1
-.01 to -5
0 to 2.9
3 to 5.9
6 to 9.5
Source U.S. Cnsus Burau
Madison County Strategic Economic Development PlanPage 118

7/29/2019 Madison County's economic development plan, 2013
http://slidepdf.com/reader/full/madison-countys-economic-development-plan-2013 119/192
Tabl 7. Cntral Nw York Population, 1950–2010
0
100,000
200,000
300,000
400,000
500,000
600,000
700,000
800,000
201020052000199019701950
Source U.S. Cnsus Buraue
Tabl 8. Education Attainmnt
0% 5% 10% 15% 20% 25% 30% 35% 40%
Utica MSA
Madison County
Syracuse MSA
US
Grad or Prof Degree
4 Yr College
Some College/2 Yr College
H.S.
Less than H.S.
Source -U.S. Cnsus
Tabl 6. Upstat Nw York Population Estimats
1950 1970% Change
‘50 - ‘701990
% Change
‘70 - ‘902000
% Change
’90 - ‘002010
% Change
‘00-’10
Cayuga 70,136 77,439 10.4% 82,313 6.3% 81,963 -0.4% 80,026 -2.4%
Cortland 37,158 45,894 23.5% 48,963 6.7% 48,599 -0.7% 49,336 1.5%
Madison 46,214 62,864 36.0% 69,120 10.0% 69,441 0.5% 73,442 5.8%
Onondaga 341,719 472,835 38.4% 468,973 -0.8% 458,336 -2.3% 467,026 1.9%
Oswego 77,181 100,897 30.7% 121,771 20.7% 122,377 0.5% 122,109 -0.2%
CNY Region 572,408 759,929 32.8% 791,140 4.1% 780,716 -1.3% 791,939 1.4%
Albany/Schenect-
ady/Troy MSA825,875 870,716 5.4%
Binghamton MSA 252,320 251,725 >-0.1%
Bualo/Niagara
MSA1,170,111 1,135,509 -0.3%
Rochester MSA 1,037,831 1,054,323 1.6%
Syracuse MSA 650,154 662,577 1.9%
Uca/Rome MSA 299,896 299,397 >-0.1%
NYS 14,830,192 18,242,584 23.0% 18,976,457 5.5% 19,378,102 2.1%
Source U.S. Cnsus Buraue
Madison County Strategic Economic Development Plan Page
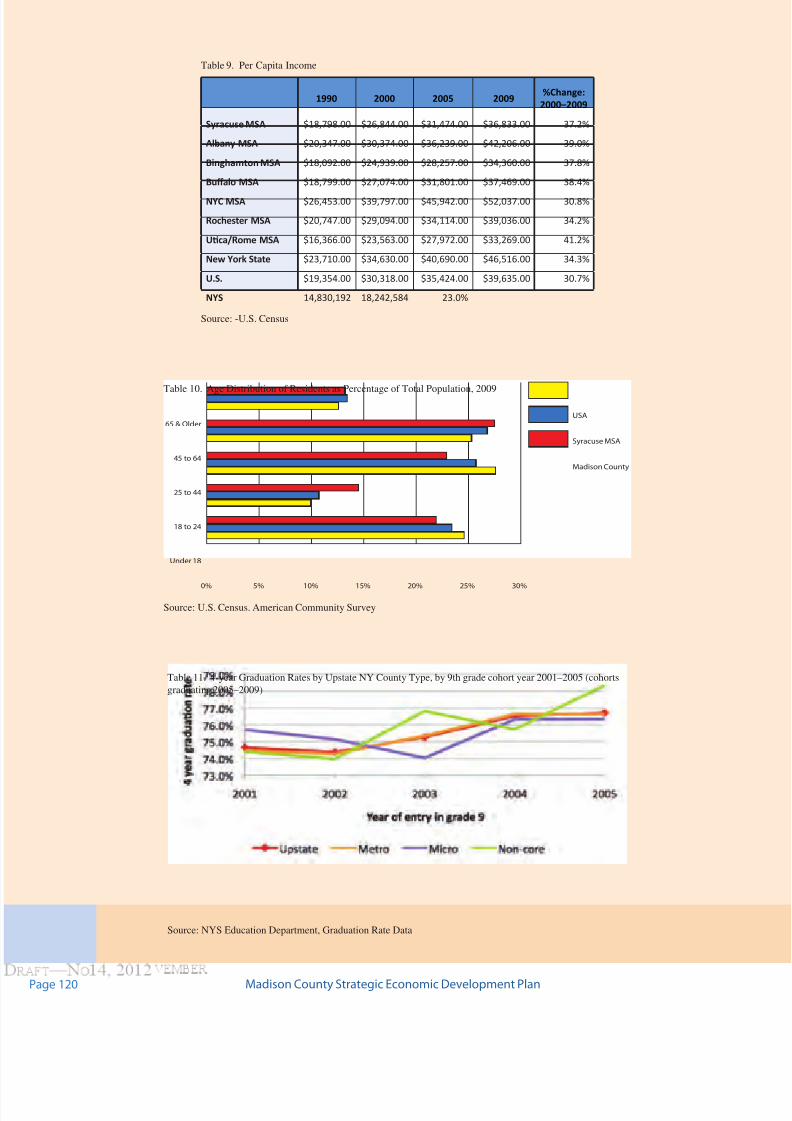
7/29/2019 Madison County's economic development plan, 2013
http://slidepdf.com/reader/full/madison-countys-economic-development-plan-2013 120/192
Tabl 10. Ag Distribution of Rsidnts as Prcntag of Total Population, 2009
0% 5% 10% 15% 20% 25% 30%
USA
Syracuse MSA
Madison County
Under 18
18 to 24
25 to 44
45 to 64
65 & Older
Source U.S. Cnsus. Amrican Community Survy
Tabl 11. 4-yar Graduation Rats by Upstat NY County Typ, by 9th grad cohort yar 2001–2005 (cohorts
graduating 2005–2009)
Source NYS Education Dpartmnt, Graduation Rat Data
Tabl 9. Pr Capita Incom
1990 2000 2005 2009%Change:
2000–2009
Syracuse MSA $18,798.00 $26,844.00 $31,474.00 $36,833.00 37.2%
Albany MSA $20,347.00 $30,374.00 $36,239.00 $42,206.00 39.0%
Binghamton MSA $18,092.00 $24,939.00 $28,257.00 $34,360.00 37.8%
Bualo MSA $18,799.00 $27,074.00 $31,801.00 $37,469.00 38.4%
NYC MSA $26,453.00 $39,797.00 $45,942.00 $52,037.00 30.8%
Rochester MSA $20,747.00 $29,094.00 $34,114.00 $39,036.00 34.2%
Uca/Rome MSA $16,366.00 $23,563.00 $27,972.00 $33,269.00 41.2%
New York State $23,710.00 $34,630.00 $40,690.00 $46,516.00 34.3%
U.S. $19,354.00 $30,318.00 $35,424.00 $39,635.00 30.7%
NYS 14,830,192 18,242,584 23.0%
Source -U.S. Cnsus
Madison County Strategic Economic Development PlanPage 120

7/29/2019 Madison County's economic development plan, 2013
http://slidepdf.com/reader/full/madison-countys-economic-development-plan-2013 121/192
Tabl 13. Total Manufacturing Jobs as Prcntag of Total
Employmnt
0
5
10
15
20
25
30
US
NYS
Syracuse MSA
201020052000199519901980
Source NYSDOL and BLS
Tabl 14. Syracus MSA Employmnt by Industry, 2009
Wholesale
Trade: 5%
Transportation,
Warehousing
and Utilities: 4%
Retail Trade: 11%
Professional and
Business Services: 11%
Other Services: 4%
Natural Resources, Mining
and Construction: 3%
Manufacturing: 8%
Leisure and
Hospitality: 8%Information: 2%
Health Care and Social
Assistance: 13%
Government: 19%
Financial
Activities: 5%
Educational
Services: 6%
Source NYSDOL and BLS
Tabl 12. Employmnt by Industry, Syracus MSA
1990–2010, ’000s
1990 1995 2000 2005Dec
2010
Total Non-Farm 317.8 307.8 325.4 320.8 320.1
Total Private 264.2 252.9 269.0 263.5 262.7
Goods Producing 61.2 53.0 57.3 45.5 40.0
Service Producing 256.6 254.8 268.1 275.4 280.1
Nat. Resources,
Mining,
Construcon
15.6 11.7 12.9 12.3 12.0
Manufacturing 45.6 41.3 44.5 33.2 28.0
Wholesale Trade 20.1 15.8 15.8 15.6 14.1
Retail Trade 38.3 37.3 38.1 36.9 36.1
Ulies 6.4 4.8 4.8 4.0 3.4
Transportaon/
Warehousing9.5 9.4 9.2 9.4 9.2
Informaon 7.7 6.3 7.7 6.6 4.8
Financial Acvies 20.6 18.0 17.7 17.6 17.0
Professional/Busi-
ness Services27.8 29.0 30.2 34.3 34.6
Educaonal
Services11.8 13.7 15.2 16.7 21.4
Health Care and
Social Assistance26.9 31.9 34.4 38.0 42.2
Hospitals 8.9 9.3 9.1 8.9 9.4
Leisure/Hospitality 24.1 22.8 25.2 26.6 27.5
Accommodaon
and Food Services21.6 20.1 22.0 22.6 22.7
Other Services 9.8 11.1 13.3 12.5 12.4
Government 53.7 54.9 56.4 57.4 57.4
Federal 4.6 4.6 5.1 4.4 4.4
State 13.0 13.5 13.8 13.9 13.7
Educaon 6.0 6.6 7.4 8.2 8.3
Local 36.1 36.8 37.5 39.1 39.3
Educaon 20.3 21.9 23.0 23.6 25.8
Source NYSDOL and BLS
Madison County Strategic Economic Development Plan Page
Economy

7/29/2019 Madison County's economic development plan, 2013
http://slidepdf.com/reader/full/madison-countys-economic-development-plan-2013 122/192
Tabl 16. CSX Rail Systm Maps
Source CSX
Tabl 15. Syracus MSA Employmnt by Industry, 2009
IndustryNumber of
Employees
Syracuse
MSA % of
Total
U.S. % of
Total
Total, All Industries 296,805
Agriculture, Forestry, Fishing Hunng 1,031 > 0.1% 0.3%
Construcon 11,638 3.9% 5.0%
Manufacturing 28,009 9.4% 9.5%
Wholesale Trade 13,992 4.7% 4.4%
Retail Trade 34,280 11.5% 11.5%
Transportaon and Warehousing 8,958 3.0% 3.9%
Informaon 4,959 1.7% 2.2%
Finance and Insurance 13,152 4.4% 4.4%
Real Estate and Rental and Leasing 3,857 1.3% 1.5%
Professional and Technical Services 14,442 4.9% 5.8%
Management of Companies and Enterprises 3,874 1.3% 1.5%
Administrave and Waste Services 14,186 4.8% 5.8%
Educaonal Services 10,515 3.5% 9.8%
Health Care and Social Assistance 38,745 13.1% 12.9%
Arts, Entertainment, and Recreaon 4,073 1.4% 1.5%
Accommodaon and Food Services 22,719 7.7% 8.6%
Other Services 9,918 3.3% 2.9%
Total, All Government 54,566 18.4% 7.6%
Source NYSDOL and BLS
Madison County Strategic Economic Development PlanPage 122

7/29/2019 Madison County's economic development plan, 2013
http://slidepdf.com/reader/full/madison-countys-economic-development-plan-2013 123/192
Tabl 17. Numbr of Companis by Industry Sctor, Syracus MSA, 2009
Syracuse MSA United States
A B C D E F
IndustryNumber of
Companies
% of companies
in an Industry
Segment as a % of
Total Companies
in MSA
Paid
Employees
Number of
Companies
% of companies
in an Industry
Segment as a % of
Total Companies in
U.S.A
Paid
Employees
Rao
(B/E)
Esmated Total Number of Companiesin MSA (includes Market Segments not
shown below)
13,568 100.00% 6,417,035 100.00%
Manufacturing 787 5.8% 44,756 363,753 5.7% 16,888,016 1.02
Food 67 0.5% 2,240 26,361 0.4% 1,471,050 1.19
Apparel 4 0.0% 500 17,065 0.3% 719,269 0.11
Wood & Paper 62 0.5% 2,848 23,307 0.4% 1,151,346 1.25
Chemical 28 0.2% 1,278 13,513 0.2% 884,321 0.97
Plascs/Rubber 38 0.3% 2,414 16,876 0.3% 1,029,976 1.06
Fabricated Metals 150 1.1% 4,467 62,501 1.0% 1,774,874 1.13
Machinery 74 0.5% 4,403 30,665 0.5% 1,421,820 1.13
Computer & electronic products 53 0.4% 5,771 17,465 0.3% 1,698,529 1.43
Electrical equipment & appliances 26 0.2% 3,030 6,946 0.1% 594,914 1.76
Furniture 21 0.2% 1,255 20,758 0.3% 604,845 0.48
Misc 67 0.2% 1 31,554 0.5% 735,337 1
Wholesale Trade 1,206 8.8% 15,611 453,470 7.1% 5,796,557 1.25
Retail Trade 2,895 21.2% 40,997 1,118,447 17.7% 13,991,103 1.22
Transportaon & Warehousing 353 2.6% 10,954 178,025 2.8% 2,920,777 0.93
Truck Transportaon 200 1.5% 3,967 103,978 1.6% 1,293,790 0.9
Warehousing & Storage 22 0.2% 394 6,497 0.1% 109,760 1.59
Finance & Insurance 941 6.9% 15,679 395,203 6.2% 5,835,214 1.12
Credit Intermediaon & Related
Services 334 2.4% 5,007 166,882 2.6% 2,744,910 0.94
Securies Intermediaon & Related
Services88 0.6% 764 54,491 0.8% 706,053 0.76
Insurance Carriers & Related
Acvies519 3.8% 9,908 172,299 2.7% 2,327,306 1.42
Professional, Scienc & Technical
Services1,362 10.0% 13,000 621,129 9.7% 5,361,210 1.03
Administrave & Support Services 528 3.9% 16,548 260,025 4.1% 7,066,658 0.95
Art, Entertainment and Recreaon 289 2.1% 1,964 99,099 1.5% 1,587,660 1.37
Source U.S. Cnsus; DLoitt & Touch
Madison County Strategic Economic Development Plan Page

7/29/2019 Madison County's economic development plan, 2013
http://slidepdf.com/reader/full/madison-countys-economic-development-plan-2013 124/192
Tabl 18. Syracus MSA, Major Employrs, 2009
Company Scope of Operaon LocaonEmploy-
ment
Syracuse University Academic instuon Syracuse 5,765
SUNY - Upstate Medical University Academic instuon Syracuse 5,700
Wegmans Regional grocery retailer Throughout region 4,070
Oneida Naon EnterprisesCasino resort, camping facilies, fuel services and misc.
retailOneida City 4,000
New Process Gear Division of NewVenture gear
Mfr. Of transmissions & gear boxes Syracuse 3,700
Carrier Corporaon Mfr. Of air condioning equipment Syracuse 2,780
P&C Food Markets Regional grocery retailer Throughout region 2,500
Lockheed Marn Sonar and radar systems Syracuse 2,300
Niagara Mohawk - A Naonal Grid Co. Public Ulity Syracuse 2,100
AT&T Telecommunicaons Syracuse 1,400
Fleet Bank & Financial Group Banking and investments Syracuse/Uca 1,300
Constellaon Energy Group Public Ulity Syracuse/Oswego City 1,300
L &JG Sckley Mfr. Of Furniture Syracuse 1,280
United Parcel Service Shipping services Syracuse 1,200
Oneida, LTD Mfr. Of atware, china and glassware Oneida 1,200
Harord Financial Group Insurance and nancial services Syracuse/New Harord 1,200
Welch Allyn Mfr. Medical and other electrical equipment Skaneateles 1,160Verizon Telecommunicaons services Syracuse 1,100
Bank of New York Banking Oriskany/Syracuse 1,125
ACS/AFSA Data Student loan processing Uca 1,100
Walmart Retail stores/distribuon center Throughout region/Marcy 1,700
Excellus (BC-BS of Central NY) Insurance and healthcare Syracuse 995
Anheuser Bush Companies Mfr. Of beer and related beverages Syracuse 960
Uca Naonal Mutual Insurance Co. Insurance New Harord/Uca 850+
Air Force Research Lab Military research operaons Rome 825
SUNY College - Cortland Academic instuon Cortland 800+
Entergy Nuclear Northeast Power generaon ulity Oswego City 800
Cooper Crouse - Hinds Mfr. Of electrical devices Syracuse 780
Colgate University Academic instuon Hamilton 775
Bristol Meyers Squibb Mfr. Of pharmaceucals Syracuse 770
Alcan Aluminum Corporaon Aluminum products Oswego City 700
Pall Trinity Micro Corporaon Mfr. Of lters and related equipment Cortland 750
MONY Group Financial services and insurance Syracuse 700
Mariea Industries Mfr. Of personal care amenies for the hospital industry Cortland 650
Hamilton College Academic instuon Clinton 600
Huhtamaki Consumer Packaging Mfr. Of packaging Oswego City 600
HSBC Banking Syracuse 600
Mohawk Valley Community College Academic instuon Uca 600
Community Bank NA Banking Syracuse 560
Metropolitan Life Insurance claims processing Oriskany 550
Orion Bus Industries Mfr. Transportaon equipment Uca 550
APAC Teleservices Telemarkeng operaon Uca 525
Key Bank NA Banking and nancial services Syracuse 500
M&T Bank Banking and nancial services Syracuse 500
Source Moran, Stahl & Boyr, LLC
Madison County Strategic Economic Development PlanPage 124

7/29/2019 Madison County's economic development plan, 2013
http://slidepdf.com/reader/full/madison-countys-economic-development-plan-2013 125/192
Tabl 19. Farmland as Prcntag
of All Privatly Ownd Land in
NYS
Source U.S.DA Agricultural
Cnsus, 2002
Tabl 20. Nw York Stat Farmland Charactristics, 1997, 2002, 2007
1997 2002 2007
Approximate total land area (acres) 30,196,361 30,216,824 30,162,489
Total farmland (acres) 7,788,241 7,660,969 7,174,743
Percent of total land area 25.8 25.4 23.8
Cropland (acres) 4,961,538 4,841,367 4,314,954
Percent of total farmland 63.7 63.2 60.1
Percent in pasture 13.8 10.6 6.5
Percent irrigated 1.4 1.4 1.5
Harvested Cropland (acres) 3,855,732 3,846,368 3,651,278
Woodland (acres) 1,655,185 1,649,585 1,559,522
Percent of total farmland 21.3 21.5 21.7
Percent in pasture 14.7 14.3 10.6
Pastureland (acres) 520,150 550,225 714,615
Percent of total farmland 6.7 7.2 10.0
Land in house lots, ponds, roads, wasteland, etc. (acres) 651,368 619,792 585,652
Percent of total farmland 8.4 8.1 8.2
Conservaon pracces
Farmland in conservaon or wetlands reserve programs
(acres97,617 211,996 115,546
Average farm size (acres) 204 206 197
Source Cnsus of Agricultur, 1997, 2002, 2007
Tabl 21. NYS top 5 agricultur commoditis, 2009
Value of
receipts
thousand $
Percent
of state
total farm
receipts
Percent
of U.S.
value
1. Dairy product 1,685,312 45.9 6.9
2. Greenhouse/nursery 355,438 9.7 2.2
3. Corn 266,853 7.3 0.6
4. Apples 226,059 6.2 11.4
5. Cale and calves 3.3 0.3
All commodies 3,675,505 1.3
Source U.S.DA National Agricultural Statistics Srvic
Tabl 22. Top 5 NYS countis in agricultural sals, 2007
Percent of state
total receipts
Thousands
$
1. Suolk County 5.5 242,933
2. Wyoming County 5.2 229,943
3. Cayuga County 4.9 214,403
4. Genesee County 4.0 177,810
5. Wayne County 3.8 168,963
State total 4,418,634
Source National Agricultur Statistics Srvic 1997, 2002 and
2007
Madison County Strategic Economic Development Plan Page
Agriculture

7/29/2019 Madison County's economic development plan, 2013
http://slidepdf.com/reader/full/madison-countys-economic-development-plan-2013 126/192
Tabl 23. Visitor Spnding by Markt in Nw York Stat
Source The Economic Impact of Tourism in New York State, August 2008,
prpard by Tourism Economics
Tabl 24. Visitor Spnding by Sctor in Nw York Stat
Source The Economic Impact of Tourism in New York
State, August 2008, prpard by Tourism Economics
Tabl 25. Visitor Spnding by Rgion in Nw York
Stat
Source The Economic Impact of Tourism in New York
State, August 2008, prpard by Tourism Economics
Tabl 26. Tourism Employmnt in Nw York Stat
Source The Economic Impact of Tourism in New York State,
August 2008, prpard by Tourism Economics
Tabl 27. Tourism Spnding in Nw York Stat
Visitor Spend '000s 2007 2008 % Change
Chautauqua-Allegany $499,915 $510,676 2.2%
Greater Niagara $2,004,536 $2,118,638 5.7%
Finger Lakes $2,606,467 $2,671,391 2.5%
Thousand Islands $418,652 $433,056 3.4%
Adirondacks $1,128,235 $1,194,114 5.8%
Central Leatherstocking $1,699,578 $1,760,230 3.6%
Capital-Saratoga $1,628,554 $1,679,103 3.1%
Catskills $988,514 $1,027,978 4.0%
Hudson Valley $3,113,656 $3,089,709 -0.8%
Long Island $4,962,128 $5,136,334 3.5%
New York City $31,849,810 $33,485,671 5.1%
TOTAL $50,900,045 $53,106,900 4.3%
Source The Economic Impact of Tourism in New York State, August 2008,
prpard by Tourism Economics
Madison County Strategic Economic Development PlanPage 126
Tourism

7/29/2019 Madison County's economic development plan, 2013
http://slidepdf.com/reader/full/madison-countys-economic-development-plan-2013 127/192
Tabl 28. Cntral Nw York Labor Forc 1980 - 2010
0
50,000
100,000
150,000
200,000
250,000
300,000
350,000
400,000
200820072005200019901980
Source NYSDOL
Tabl 29. Avrag Annual Wags by Industry Sctor, Cntral Nw York, 2009
$0 $10,000 $20,000 $30,000 $40,000 $50,000 $60,000 $70,000 $80,000
Total, All Industries
Agriculture, Forestry, Fishing, Hunting
Construction
Manufacturing
Wholesale Trade
Retail Trade
Transportation & Warehousing
Information
Finance & Insurance
Real Estate and Rental
Professional & Technical
Management of Companies and Enterprises
Administrative and Waste Services
Educational Services
Health Care and Social Services
Arts, Entertainment and Recreation
Accommodation & Food Services
Other Services
Government
Source NYSDOL
Tabl 30. Unionization of Labor Forc in Cntral Nw York
0 10 20 30 40 50 60 70
Total Labor Force
Public Employees
Private Employees
Source -NYSDOL
Madison County Strategic Economic Development Plan Page
Labor Force

7/29/2019 Madison County's economic development plan, 2013
http://slidepdf.com/reader/full/madison-countys-economic-development-plan-2013 128/192
Tabl 31. Comparison of Labor Cost Indx and Man Annual Salary for Slctd Positions
LocaonLabor Cost
Index (1)
Mechanical
Engineer (2)
Electronics
Engineer (2)
Insurance
Underwriter (2)
Loan
Ocer (2)
Customer
Service
Rep. (2)
Systems
Analyst
(2)
Computer
Programmer
(2)
U.S. Average 100 65,170 71,600 50,940 52,160 28,240 64,890 63,690
Albany 101.4 62,620 73,740 53,320 50,010 30,920 66,720 58,490
Boston 110.5 73,910 80,330 61,100 63,400 33,690 63,240 70,490
Bualo 101.7 61,170 60,970 46,800 45,500 26,330 55,090 52,520
Harord 110.1 61,670 64,710 51,760 68,010 30,770 65,890 66,550
New York City 116.2 72,850 74,280 67,180 77,380 36,820 72,820 73,010
Philadelphia 109 66,040 69,540 56,780 47,070 29,060 66,690 63,410
Rochester 103.3 66,940 68,280 45,280 58,480 28,970 61,120 61,370
CNY 101.2 61,100 68,600 43,880 45,210 29,950 59,930 53,800
Source 1. Economic Rsarch Institut (10/03) Basd on salary lvl of $50,000
2. U.S. Burau of Labor Statistics (2002)
More favorable Less favorable
-10% -5% Naonal Average 5% 10%
Source Economic Rsarch Institut (10/2003), basd on salary-lvl of $50,000; U.S. Burau of Labor Statistics (2002)
Madison County Strategic Economic Development PlanPage 128

7/29/2019 Madison County's economic development plan, 2013
http://slidepdf.com/reader/full/madison-countys-economic-development-plan-2013 129/192
Tabl 32. Primary Consumption by Sctor, 2009
Source NYSERDA, 2011
Tabl 33. Elctricity Gnration by Ful Typ, NYS and U.S. 2009
Source NYSERDA, 2011
Tabl 34. NYS Primary Enrgy Production by Ful Typ, 1995–2009
Source NYSERDA, 2011
Madison County Strategic Economic Development Plan Page
Energy

7/29/2019 Madison County's economic development plan, 2013
http://slidepdf.com/reader/full/madison-countys-economic-development-plan-2013 130/192
Tabl 35. Avrag Cost of Enrgy for Industrial Markts (Fbruary 2011 Estimats)
$0 $3 $6 $9 $12 $15
Virginia
Texas
Pennsylvania
North Carolina
New York
New Jersey
Michigan
Massachusetts
Kentucky
Kansas
Georgia
Florida
Source NYSDOL
Tabl 36. Avrag Rtail Pric of Elctricity to Ultimat Customrs by End-Us Sctor, by Stat, Fbruary 2011
Residenal Commercial Industrial Transportaon All Sectors
Florida 11.67 10.11 8.97 9.34 10.83
Georgia 10.15 9.64 6.32 7.38 9.09
Kansas 9.74 8.27 6.41 -- 8.3
Kentucky 8.74 8.44 5.16 -- 6.98
Massachuses 14.6 13.92 13.17 7.2 13.93
Michigan 12.47 10.14 7.35 9.38 10.18
New Jersey 16.7 13.43 11.86 10.87 14.47
New York 17.45 15.22 9.25 14.09 15.48
North Carolina 10.12 8.06 5.83 6.94 8.61
Pennsylvania 12.72 9.77 8.36 9.6 10.54
Texas 10.94 9.11 6.38 9.93 9.2
Virginia 9.84 7.61 6.47 7.63 8.46
Source NYSDOL
Madison County Strategic Economic Development PlanPage 130

7/29/2019 Madison County's economic development plan, 2013
http://slidepdf.com/reader/full/madison-countys-economic-development-plan-2013 131/192
Tabl 37. Chang in total Rvnus from 2000 lvls, Upstat Nw
York, 2000–2009
Source Nw York Stat Comptrollr Local Govrnmnt Data,
2000–2009
Tabl 38. Chang in total Expnditurs from 2000 lvls, Upstat
Nw York, 2000–2009
Source Nw York Stat Comptrollr Local Govrnmnt Data,
2000–2009
Tabl 39. Avrag County Rvnus, by sourc, Upstat Nw York,
2000–2009
Source Nw York Stat Comptrollr Local Govrnmnt Data,
2000–2009
Tabl 40. Avrag County Expnditurs, by sourc, Upstat Nw
York, 2000–2009
Source Nw York Stat Comptrollr Local Govrnmnt Data,
2000–2009
Madison County Strategic Economic Development Plan Page
Governance

7/29/2019 Madison County's economic development plan, 2013
http://slidepdf.com/reader/full/madison-countys-economic-development-plan-2013 132/192
Tabl 41. Major Componnts of th Stat Businss Tax Climat Indx, FY 2011
State Overall RankCorporate Tax
Index Rank
Individual
Income Tax Index
Rank
Sales Tax Index
Rank
Unemployment
Insurance Tax
Index Rank
Property Tax
Index Rank
Alabama 28 24 18 40 10 9
Alaska 2 26 1 5 31 12
Arizona 34 22 23 48 2 6
Arkansas 39 40 33 41 18 21
California 49 33 48 49 14 16Colorado 15 12 16 29 17 15
Conneccut 47 18 47 26 30 49
Delaware 8 49 34 2 8 8
Florida 5 15 1 30 3 28
Georgia 25 8 30 23 22 38
Hawaii 22 10 41 10 23 14
Idaho 18 17 29 12 48 2
Illinois 23 27 9 39 41 39
Indiana 10 21 11 20 12 4
Iowa 45 47 42 31 33 34
Kansas 35 35 21 32 7 41
Kentucky 19 42 32 7 34 20
Louisiana 36 19 26 46 5 22
Maine 31 43 37 6 44 26
Maryland 44 14 49 11 47 40
Massachuses 32 36 15 24 49 43
Michigan 17 48 12 9 45 32
Minnesota 43 44 38 38 39 18
Mississippi 21 13 19 33 4 31
Missouri 16 5 25 15 9 11
Montana 6 16 22 3 19 10
Nebraska 29 34 31 17 13 24
Nevada 4 3 6 43 40 17
New Hampshire 7 50 10 1 38 35
New Jersey 48 41 45 36 27 48
New Mexico 33 31 20 45 16 1
New York 50 20 50 34 46 42
North Carolina 41 25 36 44 6 33
North Dakota 20 30 28 18 20 7
Ohio 46 39 44 35 11 45
Oklahoma 30 7 24 42 1 27
Oregon 14 45 46 4 37 5
Pennsylvania 26 38 14 28 42 44
Rhode Island 42 37 35 14 50 47
South Carolina 24 9 27 22 43 23
South Dakota 1 1 1 25 36 13
Tennessee 27 11 8 47 35 50
Texas 13 46 7 37 15 29Utah 9 6 13 27 24 3
Vermont 38 28 40 16 21 36
Virginia 12 4 17 8 29 25
Washington 11 32 1 50 25 19
West Virginia 37 23 39 21 32 37
Wisconsin 40 29 43 19 26 30
Wyoming 3 1 1 13 28 46
Source Tax Foundation
Madison County Strategic Economic Development PlanPage 132

7/29/2019 Madison County's economic development plan, 2013
http://slidepdf.com/reader/full/madison-countys-economic-development-plan-2013 133/192
Tabl 42. Education and Training Rsourcs
No. College/University Locaon Students Programs of Study
1 Cornell University Ithaca 20,000Agriculture, Architecture, Arts & Sciences, Engineering, Hotel Administraon, Human
Ecology, Industrial and Labor Relaons, Veterinary Medicine
3Syracuse
UniversitySyracuse 17,000
Biological Science, Business, Communicaons & the Arts, Computer & Physical Science,
Educaon, Engineering, Environmental Science, Health Professions and Social Science.
8
Onondaga Com-
munity College*
(OCC)
Syracuse 8,000Biological Science, Business, Computer & Physical Science, Educaon, Engineering
Technology, Health and Social Sciences
2 SUNY - Oswego Oswego 6,400Biological Science, Business, Communicaons & the Arts, Computer & Physical Science,
Educaon, Technology Management and Social Science.
4 SUNY - Cortland Cortland 6,300 Arts & Sciences, Educaon, Professional Studies
6 Ithaca College Ithaca 6,300Business, Communicaons, Health Sciences and Human Performance, Humanies and
Sciences, Music
14
Mohawk Valley
Community
College*
Uca 5,300Aircra Mechanics, Biological Science, Business, Computer & Physical Science, Educa-
on, Engineering Technology, Environmental Science, Health and Social Sciences
11SUNY
- Morrisville*
Morris-
ville2,800
Agriculture, Biological Science, Business, Computer & Physical Science, Educaon,
Engineering Technology, Environmental Science, Social Science
12 Colgate University Hamilton 2,800Biological Science, Communicaons & the Arts, Computer & Physical Science, Educaon,
Environmental Science, Social Science
9Cayuga Commu-
nity College*
Auburn 2,700 Business, Computer Science, Educaon, Engineering Technology and Health Sciences
5
SUNY - College
of Env. Science &
Forestry
Syracuse 2,300 Agriculture (Forestry) and Environmental Science
7 LeMoyne College Syracuse 2,150Biological Science, Business, Communicaons & the Arts, Computer & Physical Science,
Educaon, Health Professions and Social Science.
16 SUNY - IT Rome 2,100Business, Engineering Technology, Computer Science, Health Services Management and
Health Professions
13
Uca College
of Syracuse
University
Uca 1,800Biological Science, Business, Communicaons & the Arts, Computer & Physical Science,
Educaon, Construcon Management, Health Professions and Social Science
17 Hamilton College Clinton 1,700Biological Science, Communicaons & the Arts, Computer & Physical Science and Social
Science
10 Cazenovia College Cazenovia 750 Communicaons and the Arts, Educaon, Environmental Design and Social Science
15 Uca School of Commerce* Uca 550 Business and Computer Science
* Two-yar collg programs
Source MCIDA
Madison County Strategic Economic Development Plan Page
Education

7/29/2019 Madison County's economic development plan, 2013
http://slidepdf.com/reader/full/madison-countys-economic-development-plan-2013 134/192
Tabl 43. ACCRA Cost of Living Indx (2008 Annual
Avrag)
Composite
Index*Grocery Housing
Bualo, NY 96.4 100.8 90.5
Glens Falls, NY 110.2 100.3 104.3
Ithaca, NY 104.6 104.2 103.2
New York,
(Manhaan) NY219.8 142.4 409.6
Rochester, NY 104.1 95.0 92.3
Syracuse, NY 99.7 99.6 85.6
Source *Composit includs six catgoris
Source Council for Community and Economic R-
sarch
Tabl 44. Quality of Lif Ranking by Catgory
Syracuse New York Albany Rochester Bualo
Cost of Living 220 354 265 255 208
Transportaon 41 3 62 64 50
Jobs 162 206 167 134 174
Educaon 21 20 3 6 27
Climate 291 105 323 233 286
Crime 60 352 93 102 213
Arts 67 1 73 60 24
Health Care 78 29 81 95 66
Recreaon 17 28 80 7 38
Overall Rank 32 65 78 30 59
Source Placs Ratd Almanac
Tabl 45. Comparison of Cost of Living of Slctd Citis
MSA Total Food Housing Ulies Transportaon Health Misc. Goods/Services
Rochester, NY 101.9 94.0 87.6 131.4 106.4 100.5 106.7
Cleveland, OH 99.6 105.9 90.7 113.1 104.6 101.7 98.8
Bualo, NY 99.5 103.5 89.8 130.5 103.7 94.1 96.3
Syracuse, NY 98.8 98.5 82.6 122.5 100.8 93.4 105.1
Grand Rapids, MI 98.1 99.4 99.5 111.5 101.3 88.9 92.8
Erie, PA 96.5 99.2 83.6 127.8 99.8 96.3 95.9
Pisburgh, PA 94.2 97.6 87.0 107.6 101.7 85.9 93.6
South Bend, IN 93.4 93.1 82.4 98.2 102.0 95.1 98.2
Akron, OH 93.3 96.6 80.9 101.1 106.9 90.9 96.3
Rockford, IL 92.8 89.8 77.7 96.3 109.1 104.0 99.0
Dayton, OH 91.9 88.9 75.2 100.2 107.1 94.1 99.3
Muncie, IN 91.1 98.0 77.3 86.8 103.4 93.6 96.9
Charleston, WV 91.0 85.2 85.7 93.9 98.8 95.5 93.8
Youngstown/Warren, OH 89.6 96.9 76.2 107.8 95.2 86.9 91.0
Fort Wayne, IN 89.0 90.6 84.5 93.8 105.2 95.2 85.3
Source Council for Community and Economic Rsarch
Madison County Strategic Economic Development PlanPage 134
Cost/Comparative Indexes
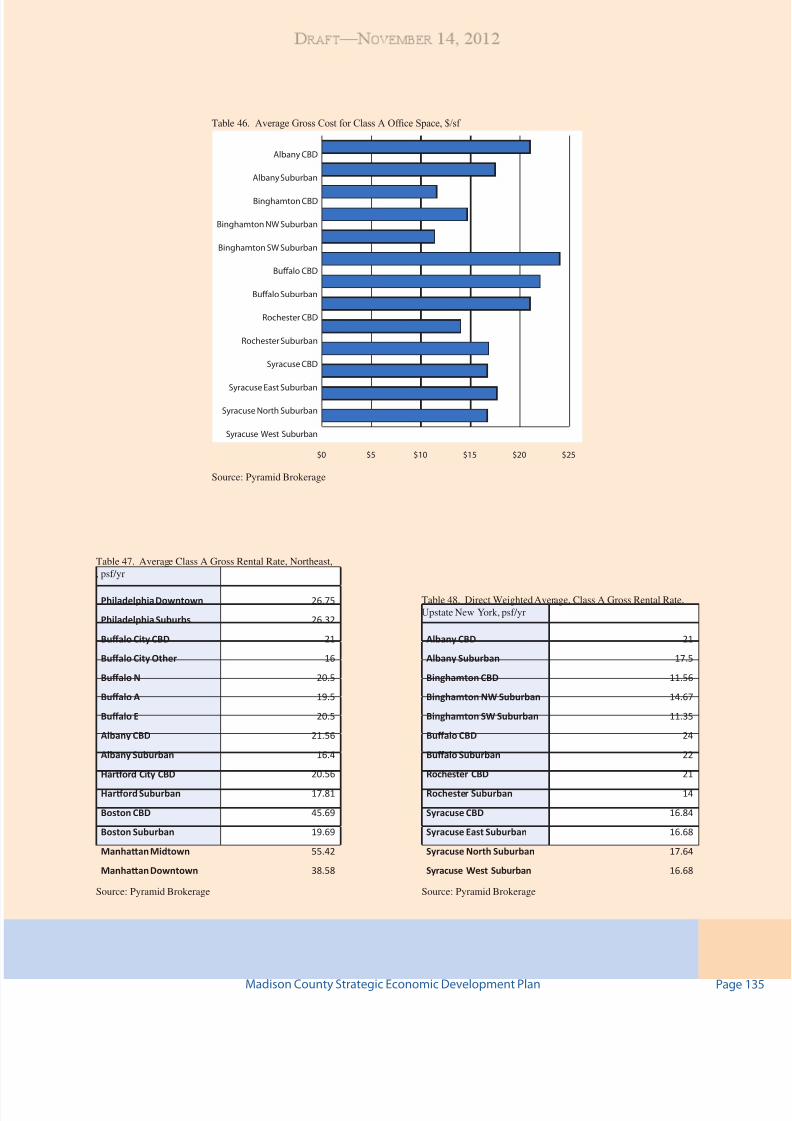
7/29/2019 Madison County's economic development plan, 2013
http://slidepdf.com/reader/full/madison-countys-economic-development-plan-2013 135/192
Tabl 46. Average Gross Cost for Class A Ofce Space, $/sf
$0 $5 $10 $15 $20 $25
Syracuse West Suburban
Syracuse North Suburban
Syracuse East Suburban
Syracuse CBD
Rochester Suburban
Rochester CBD
Bualo Suburban
Bualo CBD
Binghamton SW Suburban
Binghamton NW Suburban
Binghamton CBD
Albany Suburban
Albany CBD
Source Pyramid Brokrag
Tabl 47. Avrag Class A Gross Rntal Rat, Northast,
, psf/yr
Philadelphia Downtown 26.75
Philadelphia Suburbs 26.32
Bualo City CBD 21
Bualo City Other 16
Bualo N 20.5
Bualo A 19.5
Bualo E 20.5
Albany CBD 21.56
Albany Suburban 16.4
Harord City CBD 20.56
Harord Suburban 17.81
Boston CBD 45.69
Boston Suburban 19.69
Manhaan Midtown 55.42
Manhaan Downtown 38.58
Source Pyramid Brokrag
Tabl 48. Dirct Wightd Avrag, Class A Gross Rntal Rat,
Upstat Nw York, psf/yr
Albany CBD 21
Albany Suburban 17.5
Binghamton CBD 11.56
Binghamton NW Suburban 14.67
Binghamton SW Suburban 11.35
Bualo CBD 24
Bualo Suburban 22
Rochester CBD 21
Rochester Suburban 14
Syracuse CBD 16.84
Syracuse East Suburban 16.68
Syracuse North Suburban 17.64
Syracuse West Suburban 16.68
Source Pyramid Brokrag
Madison County Strategic Economic Development Plan Page

7/29/2019 Madison County's economic development plan, 2013
http://slidepdf.com/reader/full/madison-countys-economic-development-plan-2013 136/192
Tabl 50. Businss Travl cost, hotls, 2011
$0 $50 $100 $150 $200 $250 $300
Albany
Atlanta
Boston
Bualo
New York City
Philadelphia
Rochester
Syracuse
Source Publishd onlin rats for Marriott (Courtyard) and Hilton
(Hampton Inn) for ach location and th avrag valu was com-pard as an indx with Syracus qualing 100.
Tabl 49. Businss Travl Cost Comparison, 2011
Boston Chicago New York City Philadelphia Atlanta
Desnaon Cost Time Cost Time Cost Time Cost Time Cost Time
Albany $286 70 min $375 130 min $257 60 min $648 75 min $937 140
Bualo $188 80 min $238 100 min $148 80 min $648 80 min $322 120
Rochester $292 70 min $1,202 105 min $127 75 min $457 80 min $312 120
Syracuse $397 105 min $1,222 1 20 min $158 70 min $648 60 min $470 140
Very favorable
Average/moderate
Less Favorable
Unfavorable rates
Source Published rates from Orbitz web site for ights with a 30 + day advanced time period away from holidays and the
round trips began on Tuesday and returned on a Thursday. All ights were for non-stop ights departing on July 5th and
rturning on July 7th. Prics wr lowst listd without any taxs or fs applid.
Madison County Strategic Economic Development PlanPage 136

7/29/2019 Madison County's economic development plan, 2013
http://slidepdf.com/reader/full/madison-countys-economic-development-plan-2013 137/192
Madison County Economic Development Strategy Page

7/29/2019 Madison County's economic development plan, 2013
http://slidepdf.com/reader/full/madison-countys-economic-development-plan-2013 138/192
Madison County Economic Development StrategyPage 138

7/29/2019 Madison County's economic development plan, 2013
http://slidepdf.com/reader/full/madison-countys-economic-development-plan-2013 139/192
c h
a p
t e
International Monetary Fund | April 2012 1
c h a p t e
r Dvm Ater suering a major setback during 2011,
global prospects are gradually strengthening again,
but downside risks remain elevated. Trough the
third quarter, growth was broadly in line with the
estimates in the September 2011 World Economic
Outlook (WEO). Real GDP in many emerging and
developing economies was somewhat weaker than
expected, but growth surprised on the upside in the
advanced economies. However, activity took a sharp
turn or the worse during the ourth quarter, mainly
in the euro area (Figure 1.1, panels 1 and 2).
• he uture o the Economic and Monetary Union(EMU) became clouded by uncertainty, as the
sovereign debt crisis caused sharp increases in key
government bond rates (Figure 1.2, panels 2 and
3). Plummeting conidence and escalating inan-
cial stress were major actors in the 1.3 percent
(annualized) contraction o the euro area economy.
Real GDP also contracted in Japan, relecting sup-
ply disruptions related to loods in hailand and
weaker global demand. In the United States, by
contrast, activity accelerated, as consumption and
inventory investment strengthened. Credit and the
labor market also began to show signs o lie. • Activity sotened in emerging and developing
economies, with actors unrelated to the euro area
crisis also playing an important role, but remained
relatively strong (Figure 1.1, panel 3). In emerging
Asia and in Latin America, trade and production
slowed noticeably, owing partly to cyclical actors,
including recent policy tightening. In the Middle
East and North Arica (MENA), activity remained
subdued amid social unrest and geopolitical
uncertainty. In sub-Saharan Arica (SSA), growth
has continued largely unabated, helped by avor-
able commodity prices. In emerging Europe, weak growth in the euro area had a larger impact than
elsewhere. However, concerns about a potentially
sharp slowdown in urkey and a weakened policy
ramework in Hungary also detracted rom activity.
Although the recovery was always expected to be weak and vulnerable because o the legacy o the
nancial crisis, other actors have played important
roles. In the euro area, these include EMU design
faws; in the United States, an acrimonious debate
on scal consolidation, which undermined con-
dence within nancial markets; and elsewhere,
natural disasters as well as high oil prices because
o supply-side disruptions. Tus, past and present
WEO projections or only modest growth have their
origins in various developments and regions (Figure
1.1, panel 4). Some o these developments are now
unwinding, which will support a reacceleration o activity.
High-requency indicators point to somewhat
stronger growth. Manuacturing purchasing man-
agers’ index indicators or advanced and emerging
market economies have edged up in the most recent
quarter (Figure 1.3, panel 1). Te disruptive eects
on supply chains caused by the Tai foods appear to
be receding, leading to stronger industrial produc-
tion and trade in various Asian economies. In addi-
tion, reconstruction is continuing to boost output in
Japan. Global nancial conditions have improved:
data have come in stronger than expected by mar-kets, and ears o an imminent banking or sovereign
crisis in the euro area have diminished. Recent
improvements in the ability o major economies on
the periphery to roll over sovereign debt, narrower
sovereign and interbank spreads relative to Decem-
ber highs, and a partial reopening o bank unding
markets have helped reduce these ears, but concerns
linger (Figure 1.2, panels 2 and 3). More generally,
market volatility has declined and fows to emerging
market economies have rebounded (Fig ure 1.4, pan-
els 1 and 2). Appreciating currencies have prompted
renewed exchange rate intervention (or example, inBrazil and Colombia).
Policy has played an important role in recent
improvements, but various undamental prob-
lems remain unresolved. Te European Central
Global prospects anD policies
Madison County Economic Development Strategy Page
A P P E N D I X
BInternational Monetary Fun
GLOBAL PROSPECTS AND POLICIESDraft —November 14,

7/29/2019 Madison County's economic development plan, 2013
http://slidepdf.com/reader/full/madison-countys-economic-development-plan-2013 140/192
world economic outlook: Growth resuminG, dAnGers remAin
: l i i l l ili i , . i li l i ll ,
i i i . l ll .
l i i l i i i .
l , , , I l , , i i , i i .
l i i i l i l i i .
I i , l i , ili i , il , i .
i l i . . , i, I i il. i il i . . ll l . i ; i
i . i . i .
i i . .
i : i i
Table 1.1. Overview of the World Economic Outlook Projections(Percent change unless noted otherwise)
Year over Year
Difference from January
2012 WEO Projections
Q4 over Q4
Projections Estimates Projections
2010 2011 2012 2013 2012 2013 2011 2012 2013
World Output1
5.3 3.9 3.5 4.1 0.2 0.1 3.2 3.7 4.1Advanced Economies 3.2 1.6 1.4 2.0 0.2 0.1 1.2 1.6 2.2
United States 3.0 1.7 2.1 2.4 0.3 0.2 1.6 2.0 2.6
Euro Area 1.9 1.4 –0.3 0.9 0.2 0.1 0.7 –0.2 1.4
Germany 3.6 3.1 0.6 1.5 0.3 0.0 2.0 0.9 1.6
France 1.4 1.7 0.5 1.0 0.3 0.0 1.3 0.5 1.4
Italy 1.8 0.4 –1.9 –0.3 0.2 0.3 –0.4 –2.0 0.7
Spain –0.1 0.7 –1.8 0.1 –0.2 0.4 0.3 –2.5 1.3
Japan 4.4 –0.7 2.0 1.7 0.4 0.1 –0.6 2.0 1.8
United Kingdom 2.1 0.7 0.8 2.0 0.2 0.0 0.5 1.5 2.3
Canada 3.2 2.5 2.1 2.2 0.3 0.2 2.2 2.0 2.3
Other Advanced Economies2 5.8 3.2 2.6 3.5 0.0 0.1 2.5 3.6 2.9
Newly Industrialized Asian Economies 8.5 4.0 3.4 4.2 0.1 0.1 3.1 4.8 3.1
Emerging and Developing Economies3 7.5 6.2 5.7 6.0 0.2 0.1 5.8 6.3 6.4
Central and Eastern Europe 4.5 5.3 1.9 2.9 0.8 0.5 3.8 1.6 3.6
Commonwealth of Independent States 4.8 4.9 4.2 4.1 0.5 0.3 3.7 3.8 4.0Russia 4.3 4.3 4.0 3.9 0.7 0.4 3.7 3.9 4.1
Excluding Russia 6.0 6.2 4.6 4.6 0.2 –0.1 . . . . . . . . .
Developing Asia 9.7 7.8 7.3 7.9 0.0 0.1 7.2 8.1 7.7
China 10.4 9.2 8.2 8.8 0.1 0.0 8.9 8.4 8.4
India 10.6 7.2 6.9 7.3 –0.1 0.0 6.1 6.9 7.2
ASEAN-54 7.0 4.5 5.4 6.2 0.2 0.6 2.5 8.5 5.5
Latin America and the Caribbean 6.2 4.5 3.7 4.1 0.2 0.1 3.6 3.9 4.8
Brazil 7.5 2.7 3.0 4.1 0.1 0.1 1.4 4.7 3.4
Mexico 5.5 4.0 3.6 3.7 0.1 0.2 3.7 3.6 3.8
Middle East and North Africa (MENA) 4.9 3.5 4.2 3.7 0.6 –0.2 . . . . . . . . .
Sub-Saharan Africa 5.3 5.1 5.4 5.3 –0.1 0.0 . . . . . . . . .
South Africa 2.9 3.1 2.7 3.4 0.1 0.0 2.6 3.0 3.7
Memorandum
European Union 2.0 1.6 0.0 1.3 0.1 0.1 0.9 0.2 1.7
World Growth Based on Market Exchange Rates 4.2 2.8 2.7 3.3 0.3 0.1 2.3 2.7 3.4
World Trade Volume (goods and services) 12.9 5.8 4.0 5.6 0.2 0.2 . . . . . . . . .
ImportsAdvanced Economies 11.5 4.3 1.8 4.1 –0.2 0.2 . . . . . . . . .
Emerging and Developing Economies 15.3 8.8 8.4 8.1 1.3 0.4 . . . . . . . . .
ExportsAdvanced Economies 12.2 5.3 2.3 4.7 –0.1 0.0 . . . . . . . . .Emerging and Developing Economies 14.7 6.7 6.6 7.2 0.5 0.2 . . . . . . . . .
Commodity Prices (U.S. dollars)Oil5 27.9 31.6 10.3 –4.1 15.2 –0.5 20.8 10.8 –6.2Nonfuel (average based on world commodity
export weights) 26.3 17.8 –10.3 –2.1 3.7 –0.4 –6.4 0.1 –2.4
Consumer Prices
Advanced Economies 1.5 2.7 1.9 1.7 0.3 0.4 2.8 1.7 1.6Emerging and Developing Economies3 6.1 7.1 6.2 5.6 0.0 0.1 6.5 5.5 4.5
London Interbank Offered Rate (percent)6
On U.S. Dollar Deposits 0.5 0.5 0.7 0.8 –0.2 –0.1 . . . . . . . . .
On Euro Deposits 0.8 1.4 0.8 0.8 –0.3 –0.4 . . . . . . . . .On Japanese Yen Deposits 0.4 0.3 0.6 0.1 0.0 –0.1 . . . . . . . . .
Note: Real effective exchange rates are assumed to remain constant at the levels prevailing during February 13–March 12, 2012. When economies are not listed alphabetically, they are
ordered on the basis of economic size. The aggregated quarterly data are seasonally adjusted.
1The quarterly estimates and projections account for 90 percent of the world purchasing-power-parity weights.
2Excludes the G7 (Canada, France, Germany, Italy, Japan, United Kingdom, United States) and Euro Area countries.
3The quarterly estimates and projections account for approximately 80 percent of the emerging and developing economies.
4Indonesia, Malaysia, Philippines, Thailand, and Vietnam.
5Simple average of prices of U.K. Brent, Dubai, and West Texas Intermediate crude oil. The average price of oil in U.S. dollars a barrel was $104.01 in 2011; the assumed price based on
futures markets is $114.71 in 2012 and $110.00 in 2013.
6Six-month rate for the United States and Japan. Three-month rate for the euro area.
Madison County Economic Development StrategyPage 140

7/29/2019 Madison County's economic development plan, 2013
http://slidepdf.com/reader/full/madison-countys-economic-development-plan-2013 141/192
chapter 1 Global ProsPects and Policies
International Monetary Fund | April 2012 3
Bank’s (ECB’s) three-year longer-term renancing
operations (LROs) have orestalled an imminent
liquidity squeeze that could have led to a bank-
ing crisis. ogether with the recent commitment to
increase the euro area rewall as well as scal andstructural reorms (notably in Italy and Spain), this
lowered sovereign risk premiums, notwithstanding
some widening again lately. Te recent extension
o payroll tax relie and unemployment benets has
averted excessive scal tightening that would have
harmed the U.S. economy. Nonetheless, markets are
still very concerned about prospects in the euro area’s
weaker economies. Moreover, the challenges posed
by risk sharing and governance in the euro area and
by medium-term scal consolidation in the United
States and Japan demand urther action.
What Went Wrong in the Euro Area?
Te euro area crisis is the product o the interac-
tion among several underlying orces. As in other
advanced economies, these orces include mispriced
risk, macroeconomic policy misbehavior over many
years, and weak prudential policies and rameworks.
Tese interacted with EMU-specic faws, accel-
erating the buildup o excessive public and private
sector imbalances in several euro area economies,
which were exposed in the atermath o the Great
Recession. Te resulting crisis has had drastic
consequences.
While the overall public and external debt levels
o the euro area are lower than those o the United
States and Japan, the crisis has exposed faws in
EMU governance. Te Stability and Growth Pact was
devised to bring about scal discipline but ailed to
orestall bad scal policies. Markets became increas-
ingly integrated, with enormous cross-border bank
lending, but supervision and regulation remained at a
national level. Te ECB was explicitly not allowed to
be a lender o last resort, yet markets operated under
the assumption that the authorities—governments
and central banks—would be ready with a saety net
i things went wrong. Te perception that economies
or banking systems were too big or too complex to
ail underlay the idea that their liabilities had implicit
guarantees. Under these circumstances, market orces
did not unction properly: sovereign and credit risks
Figure 1.1. Global Indicators
0
1
2
3
4
5
6
7
8
9
0
1
2
3
4
5
6
7
8
9
Indicators of global trade and production retreated during the second half of 2011.The forecast is for a reacceleration of activity starting in the second quarter of 2012.Disappointments relative to past projections are related to developments in the
United States and Japan in 2011 and in Europe, notably the euro area, in 2012.
Source: IMF staff estimates.Argentina, Brazil, Bulgaria, Chile, China, Colombia, Hungary, India, Indonesia, Latvia,
Lithuania, Malaysia, Mexico, Pakistan, Peru, Philippines, Poland, Romania, Russia, SouthAfrica, Thailand, Turkey, Ukraine, and Venezuela.
Australia, Canada, Czech Republic, Denmark, euro area, Hong Kong SAR, Israel, Japan,
Korea, New Zealand, Norway, Singapore, Sweden, Switzerland, Taiwan Province of China,United Kingdom, and United States.
2
1
4. Contributions to Revisions in Global GDP Growth
(percentage points; WEO publication on x -axis)
Apr. 2010 Apr. 2011 Sept. 2011 Apr. 2010 Apr. 2011 Sept. 2011–1.0
–0.8
–0.6
–0.4
–0.2
0.0
0.2
0.4
–1.2
–1.0
–0.8
–0.6
–0.4
–0.2
0.0
Euro areaJapan
Other EuropeUnited StatesOther advanced economies Other emerging economies
Revision to world growth forecast (right scale)
Actual 2011 GrowthRelative to Forecasts in:
Current 2012 ForecastsRelative to Forecasts in:
2011:Q1 13:Q112:Q1 13:Q4
–36
–24
–12
0
12
24
Real GDP Growth(annualized quarterly percent change)
September2011 WEO
September2011 WEO
2011:Q1 13:Q112:Q1 13:Q4
Advancedeconomies2
Emerging economies1
1. Industrial Production(annualized percent change of three-month moving average overprevious three-month moving average)
2000 02 04 06 Feb.
11
08 10
2. Advanced Economies 3. Emerging and Developing
Economies
Madison County Economic Development Strategy Page

7/29/2019 Madison County's economic development plan, 2013
http://slidepdf.com/reader/full/madison-countys-economic-development-plan-2013 142/192
world economic outlook: Growth resuminG, danGers remain
4 International Monetary Fund | April 2012
were underestimated and mispriced, resulting in large
cross-country divergences in scal and external cur-
rent account balances.
Since the crisis hit, the euro area has had to
develop new mechanisms o support to heavily indebted members while implementing severe s-
cal restraint. Concerns about bailing out investors
and burdening public budgets prompted euro area
members to entertain sovereign debt restructuring
or Greece. Te Greek crisis then escalated over the
summer as negotiations continued concerning private
sector involvement, raising concern in markets that
other sovereigns could consider debt restructuring
as a partial alternative to strong scal restraint and
support rom their euro area peers. Markets reassessed
the riskiness o Italian bonds in particular: corporate,
bank, and government securities were marked down.Following European Banking Authority (EBA) stress
tests, the euro area initially had neither a clear road
map nor visibly available resources to recapitalize
banks ound to be in need o more capital.
Policy eforts to x the problems are ongoing.
Since September, progress has accelerated. Steps
include the recent decision to combine the Euro-
pean Stability Mechanism (ESM) and the European
Financial Stability Facility (EFSF), the introduction
o three-year LROs by the ECB, the publication o
bank recapitalization plans by the EBA, the Decem-
ber summit decision to advance the implementationo the ESM treaty to mid-2012 and to improve scal
governance and policy coordination, and national
measures to strengthen scal balances and introduce
structural reorms, including in Spain and Italy. Te
risk o a crisis has also been reduced as a result o
the progress achieved in Greece, although the prob-
lems there and in other economies on the euro area
periphery will likely persist or a long time.
prosects
Te outlook or the global economy is slowly improving again but is still very ragile. Real GDP
growth should pick up gradually during 2012–13 rom
the trough reached during the rst quarter o 2012
(able 1.1; Figure 1.1, panels 2 and 3). Improved
nancial conditions, accommodative monetary poli-
cies, a similar pace o scal tightening as in 2011, and
Figure 1.2. Recent Financial Market Developments
July 21, 2011
0
20
40
60
80
100
120
140
160
0
1
2
3
4
5
6
7
8
Financial conditions worsened appreciably in the fall of 2011 but have since
improved. Economic data have surprised on the upside, most notably in the United
States, and policy actions have brought down sovereign and bank risk premiums in
the euro area.
Japan
UnitedStates
2. Government Bond Yields(percent)
1
Germany
Italy
Spain
30
40
50
60
70
80
90
100
110
120
DJ Euro
Stoxx
S&P500
1. Equity Markets(2007 = 100; national currency)
Topix
2000 02 04 06 Mar.
12
08 10
3. Interbank Spreads(basis points)
U.S.dollar
2
Euro
Sources: Bank of America/Merrill Lynch; Bloomberg Financial Markets; Citigroup; andIMF staff calculations.
Ten-year government bonds.
Three-month London interbank offered rate minus three-month government bill rate.
12
Apr.12
11:H211:H110:H210:H1
1009082007 Apr.
12
11
Madison County Economic Development StrategyPage 142

7/29/2019 Madison County's economic development plan, 2013
http://slidepdf.com/reader/full/madison-countys-economic-development-plan-2013 143/192
chapter 1 Global ProsPects and Policies
International Monetary Fund | April 2012 5
special actors (reconstruction in Japan and Tailand)
will drive the reacceleration. However, the recovery
will remain vulnerable to several major downside risks.
Regarding risks rom Europe, the WEO projections
assume that policymakers will prevent a Greek-styledownward spiral rom taking hold o another economy
on the euro area periphery. However, it is assumed that
additional support will be orthcoming only in the event
o reintensied market turmoil. Tus, sovereign spreads
and euro area banking system stress are expected to
remain volatile and come down only gradually.
Tighter Financial Conditions, Mainly in the Euro Area
Financial conditions are projected to ease but
stay tighter than those assumed in the September
2011 World Economic Outlook . Te April 2012Global Financial Stability Report underscores the
continued high risks to nancial stability relative to
six months ago, despite policy steps to contain the
euro area debt and banking crisis. In the euro area,
sovereigns and banks ace signicant renancing
requirements or 2012, estimated at 23 percent o
GDP. Deleveraging pressures are also likely to stay
elevated, as banks undergo $2.6 trillion in balance
sheet reduction over the next two years. Although
these pressures are likely to aect mainly economies
in the euro area periphery and in emerging Europe,
they will be a drag on growth in core economies thatcould worsen i unding conditions deteriorate.
Te ECB’s LROs have averted a liquidity-driven
crisis by replacing private unding with ofcial
nancing, but undamental weaknesses remain.
Te recent EBA assessment o banks’ capital plans
suggests that, in aggregate, capital measures will
adequately address the shortalls, which will limit the
negative impact on lending to the real economy. Te
LROs also have helped boost demand or sovereign
paper (including by banks), contributing to lower
risk spreads. Lower spreads have supported a recov-
ery o equity prices and mitigated pressures or rapiddeleveraging by banks. In addition, the LROs may
have been interpreted by markets as signaling greater
ECB resolve to do what it takes to stabilize nancial
conditions.
Nonetheless, stress in sovereign unding markets
remains and will likely recede only slowly rom pres-
Figure 1.3 Current and Forward-Looking GrowthIndicators1
30
35
40
45
50
55
60
65
–40
–30
–20
–10
0
10
20
–6
–4
–2
0
2
4
6
Sources: Haver Analytics; and IMF staff calculations.Not all economies are included in the regional aggregations. For some economies,
monthly data are interpolated from quarterly series.
Argentina, Brazil, Bulgaria, Chile, China, Colombia, Hungary, India, Indonesia, Latvia,Lithuania, Malaysia, Mexico, Peru, Philippines, Poland, Romania, Russia, South Africa,Thailand, Turkey, Ukraine, and Venezuela.
Australia, Canada, Czech Republic, Denmark, euro area, Hong Kong SAR, Israel, Japan,Korea, New Zealand, Norway, Singapore, Sweden, Switzerland, Taiwan Province of China,United Kingdom, and United States.
Based on deviations from an estimated (cointegral) relationship between globalindustrial production and retail sales.
Purchasing-power-parity-weighted averages of metal products and machinery for theeuro area, plants and equipment for Japan, plants and machinery for the United Kingdom,and equipment and software for the United States.
U.S. dollars a barrel: simple average of spot prices of U.K. Brent, Dubai Fateh, and WestTexas Intermediate crude oil.
Leading indicators suggest that activity is bottoming out. Global output may be
boosted by inventory rebuilding and investment as supply-side disruptions from theearthquake and tsunami in Japan and the floods in Thailand continue to unwind. Oil
prices are projected to rise much less than in 2011, which will give some support toconsumption growth.
1
2
3
4
5
–6
–3
0
3
6
9
12
3. Real Private Consumption(annualized quarterly percentchange)
2007 08 11:
Q4
09
4. Real Gross Fixed Investment
(annualized quarterlypercent change)
2007 08 11:Q4
09
of which:machinery and equipment5
Emergingeconomies2
Advancedeconomies3
Emergingeconomies2
Advancedeconomies3
1. Purchasing Managers’ Index(manufacturing index)
Mar.122008 09
2. Estimated Change in GlobalInventories
(index)4
10
1090
100
110
120
130
140
70
80
90
100
110
120
5. Food and Oil Prices
Oil 2012(Sep. 11 WEO)
Food(index;
left scale)
Oil(dollars; rightscale)
6
2010:H1 11:H1 Feb.
12
10 11
Advanced economies3
Emerging economies2
Oil 2012(current)
2008 09 Jan.
12
10
6
Madison County Economic Development Strategy Page
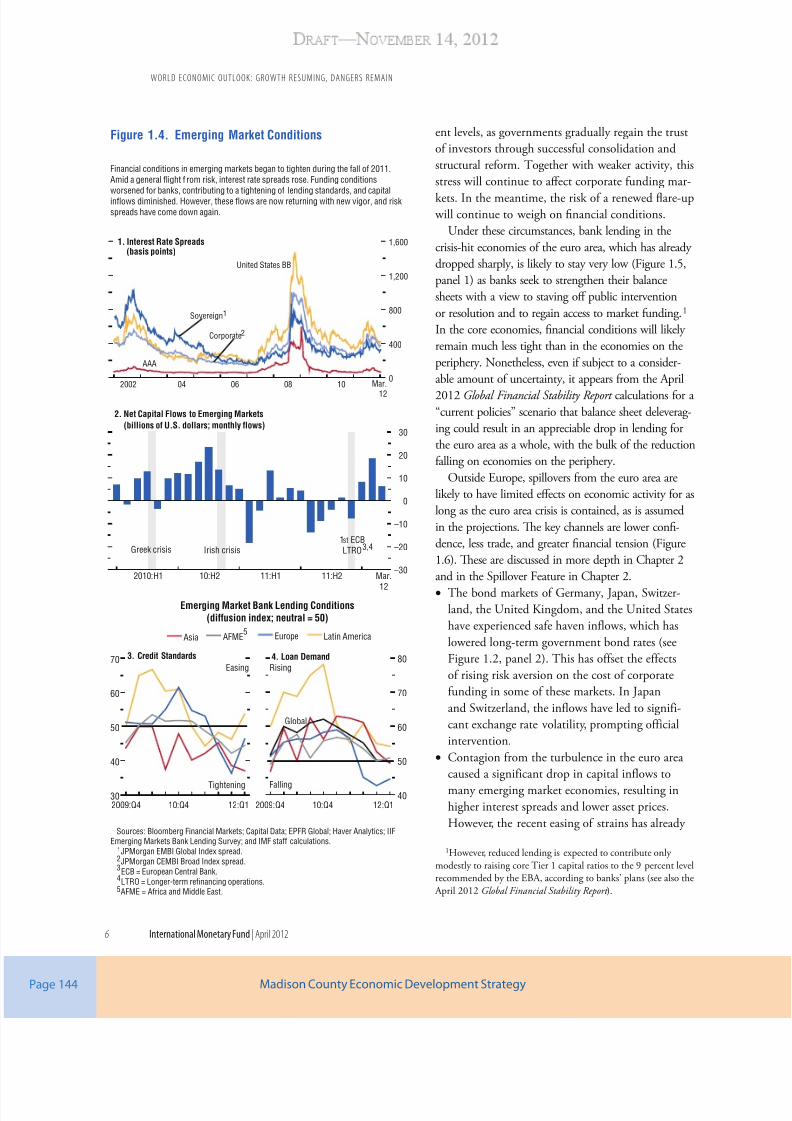
7/29/2019 Madison County's economic development plan, 2013
http://slidepdf.com/reader/full/madison-countys-economic-development-plan-2013 144/192
world economic outlook: Growth resuminG, danGers remain
6 International Monetary Fund | April 2012
ent levels, as governments gradually regain the trust
o investors through successul consolidation and
structural reorm. ogether with weaker activity, this
stress will continue to aect corporate unding mar-
kets. In the meantime, the risk o a renewed are-up will continue to weigh on fnancial conditions.
Under these circumstances, bank lending in the
crisis-hit economies o the euro area, which has already
dropped sharply, is likely to stay very low (Figure 1.5,
panel 1) as banks seek to strengthen their balance
sheets with a view to staving o public intervention
or resolution and to regain access to market unding.1
In the core economies, fnancial conditions will likely
remain much less tight than in the economies on the
periphery. Nonetheless, even i subject to a consider-
able amount o uncertainty, it appears rom the April
2012 Global Financial Stability Report calculations or a “current policies” scenario that balance sheet deleverag-
ing could result in an appreciable drop in lending or
the euro area as a whole, with the bulk o the reduction
alling on economies on the periphery.
Outside Europe, spillovers rom the euro area are
likely to have limited eects on economic activity or as
long as the euro area crisis is contained, as is assumed
in the projections. Te key channels are lower conf-
dence, less trade, and greater fnancial tension (Figure
1.6). Tese are discussed in more depth in Chapter 2
and in the Spillover Feature in Chapter 2.
• he bond markets o Germany, Japan, Switzer-land, the United Kingdom, and the United States
have experienced sae haven inlows, which has
lowered long-term government bond rates (see
Figure 1.2, panel 2). his has oset the eects
o rising risk aversion on the cost o corporate
unding in some o these markets. In Japan
and Switzerland, the inlows have led to signii-
cant exchange rate volatility, prompting oicial
intervention.
• Contagion rom the turbulence in the euro area
caused a signiicant drop in capital inlows to
many emerging market economies, resulting inhigher interest spreads and lower asset prices.
However, the recent easing o strains has already
1However, reduced lending is expected to contribute only
modestly to raising core ier 1 capital ratios to the 9 percent levelrecommended by the EBA, according to banks’ plans (see also the
April 2012 Global Financial Stability Report ).
Figure 1.4. Emerging Market Conditions
30
40
50
60
70
Sources: Bloomberg Financial Markets; Capital Data; EPFR Global; Haver Analytics; IIFEmerging Markets Bank Lending Survey; and IMF staff calculations.
JPMorgan EMBI Global Index spread.
JPMorgan CEMBI Broad Index spread.
ECB = European Central Bank.
LTRO = Longer-term refinancing operations.AFME = Africa and Middle East.
123
0
400
800
1,200
1,600
Financial conditions in emerging markets began to tighten during the fall of 2011.
Amid a general flight f rom risk, interest rate spreads rose. Funding conditions
worsened for banks, contributing to a tightening of lending standards, and capital
inflows diminished. However, these flows are now returning with new vigor, and risk
spreads have come down again.
United States BB
1. Interest Rate Spreads(basis points)
AAA
Mar.
12
2002 04 06
Sovereign1
Corporate2
08 10
40
50
60
70
80
Emerging Market Bank Lending Conditions(diffusion index; neutral = 50)
3. Credit Standards
AFME Latin AmericaEuropeAsia
4. Loan Demand
Easing
Tightening
Rising
Falling
Global
2. Net Capital Flows to Emerging Markets
(billions of U.S. dollars; monthly flows)
Greek crisis Irish crisis
2010:H1 11:H110:H2 11:H2 Mar.
12
2009:Q4 10:Q4 12:Q1 2009:Q4 10:Q4 12:Q1
5
4
1 ECBLTRO3,4st
–30
–20
–10
0
10
20
30
5
Madison County Economic Development StrategyPage 144

7/29/2019 Madison County's economic development plan, 2013
http://slidepdf.com/reader/full/madison-countys-economic-development-plan-2013 145/192
Madison County Economic Development Strategy Page

7/29/2019 Madison County's economic development plan, 2013
http://slidepdf.com/reader/full/madison-countys-economic-development-plan-2013 146/192
Madison County Economic Development StrategyPage 146

7/29/2019 Madison County's economic development plan, 2013
http://slidepdf.com/reader/full/madison-countys-economic-development-plan-2013 147/192
New York added more jobs in the past two years
than previously reported, according to revised datafrom the New York State Department of Labor. Asof April 2012, New York had regained nearly95 percent of the jobs lost in the recession, morethan twice the national share.
While New York has reported impressive jobgains, not all regions of the State have benefitedequally. New York City, which accounts for44 percent of the jobs in New York State, regained129 percent of the jobs lost during the recession.While the City’s suburbs have reported moderategains, several upstate cities have regained only a
small portion of the jobs lost during the recession,and some have continued to lose jobs.
The unemployment rate in New York is below itsrecessionary peak, but the rate has risen over thepast year and now exceeds the national rate. Manycounties have double-digit unemployment rates,and 45 percent of unemployed people in the Statehave been without a job for more than six months.Also, many of the jobs added during the recoverywere in industries that pay less, on average, thanthose which lost jobs during the recession.
The securities industry, one of the State’seconomic engines, continues to face uncertaintiesas it works through the fallout from the financialcrisis. The industry reported large operating lossesin the second half of 2011, which contributed to anestimated 14 percent decline in cash bonuses andrenewed job losses. Recently announced tradinglosses at JPMorgan Chase could be a harbinger of weak profitability for the industry in 2012.
New York is slowly recovering from the worstrecession since the Great Depression, but still facessignificant challenges and risks. The
unemployment rate remains high and many upstateregions are struggling. The national economyappears to be slowing, which could affect businessconditions in New York. Certain potentialresponses to the federal budget deficit couldweaken New York’s recovery, and the sovereigndebt crisis in Europe remains an ongoing concern.
Highlights
• Growth in New York’s Gross State Productslowed from 5.1 percent in 2010 to anestimated 3.8 percent in 2011, and is expectedto slow further in 2012.
• New York State has recovered nearly95 percent of the jobs lost dur ing therecession, which ranked 5th best among the50 states.
• New York has added more private sector jobsduring the recovery than it lost during therecession, but these gains have been offset by
job losses in the government sector .• The unemployment rate in New York was
8.5 percent in April 2012, compared to8 percent one year earlier.
• In April 2012, the unemployment rateexceeded the statewide rate in more than half of New York’s counties (33 of 62), including8 counties in which the r ate was 10 percent orgreater.
• The securities industry in New York City hadrecovered only 41 percent of the 28,100 jobslost during the financial crisis before the
industry began losing jobs again, shedding1,400 since October 2011.
• Wall Street got off to a strong start in 2011,earn ing $12.6 billion in the first ha lf, but thenlost $4.9 billion in the second half.
• New York State’s consumer confidence hasrecovered more than half the declineexperienced during the r ecession.
• New York’s per capita income reached$50,500 in 2011, which ranked 5th among the50 states.
•
Median home sales prices are slowly rising inmost upstate metropolitan areas, but prices inthe downstate regions remain weak.
• According to the Empire State ManufacturingSurvey, current hiring activity was at itshighest level in a year, but expectations of future hiring slipped.
Ofce o the State Comptroller, May 2012
Madison County Economic Development Strategy Page
A P P E N D I X
CEconomic Trends i
New York StatDraft —November 14, 2012

7/29/2019 Madison County's economic development plan, 2013
http://slidepdf.com/reader/full/madison-countys-economic-development-plan-2013 148/192
National Economic Overview
Since job growth resumed in February 2010, thenation has regained 3.7 million jobs, or 43 percent of the jobs lost in the recession, as of April 2012. Theprivate sector has regained 4.2 million jobs, butgovernment has shed 502,000 jobs, virtually all at thestate and local levels (see Figure 1).
-7
-6
-5
-4
-3
-2
-1
0
1
J ul - 0 8
S e p- 0 8
N o v- 0 8
J a n- 0 9
M a r - 0 9
M a y- 0 9
J ul - 0 9
S e p- 0 9
N o v- 0 9
J a n-1 0
M a r -1 0
M a y-1 0
J ul -1 0
S e p-1 0
N o v-1 0
J a n-1 1
M a r -1 1
M a y-1 1
J ul -1 1
S e p-1 1
N o v-1 1
J a n-1 2
M a r -1 2
State and Local
Government
Private Sector
P e r c e n t C h a n g e
Note: Data are seasonally adjusted. Federal government employment has been excluded
because of the distortion of employment levels by temporary hiring for the 2010 Census.
Source: U.S. Bureau of Labor S tatistics
Figure 1
Cumulative Change in National Employment
During the first quarter of 2012, GDP growth slowedto 2.2 percent from 3 percent in the fourth quarter of 2011, as modest growth in consumer spending wasoffset by a slowing of business investment andcontinued declines in government spending. IHSGlobal Insight forecasts growth of 2 percent in thesecond quarter. Other economic data, includingunemployment insurance claims and home sales andprices, also point to slow growth.
The national economy faces many risks that couldfurther hamper growth. Consumers continue to
experience uncertain labor markets, high energyprices, limited wage growth and continued weaknessin home values. In addition, the ongoing Europeansovereign debt crisis has led to a recession there thatcould dampen global economic growth.
Moreover, fiscal policy actions to stimulate theeconomy are unlikely given the current politicalclimate, and the Federal Reserve Chairman hasindicated that with interest rates at historic lows,there are limited options to counteract the short-termadverse impact of the scheduled expiration of payrolland income tax cuts on the economy.
New York Gross State ProductNew York’s Gross State Product (GSP) reboundedstrongly after the recession, with the rate of growthexceeding the nationwide increase and rankingsecond among the 50 states in both 2010 and 2011.However, New York’s rate of growth eased from5.1 percent in 2010 to an estimated 3.8 percent in2011, and IHS Global Insight forecasts that theState’s GSP will slow to 2.6 percent in 2012.
Manufacturing Activity
The Empire State Manufacturing Survey, conductedby the Federal Reserve Bank of New York, examinesbusiness conditions across New York State. The May2012 survey shows continued slow growth in currenteconomic activity, as well as an expectation forweaker activity in the next six months. Current hiringactivity was at its highest level in a year, but
expectations of future hiring slipped.
Consumer Confidence
After rising for five consecutive months in NewYork, consumer confidence fell slightly in April 2012as a result of higher gasoline prices. Despite theeasing, consumer confidence has recovered morethan half of the decline experienced during therecession.
Employment
Between December 2009 (when employment reachedits recessionary low) and April 2012, New York
regained 312,700 jobs (see Figure 2), equal to nearly95 percent of the jobs lost during the recession (morethan twice the share recovered by the nation). Theprivate sector has created more jobs since the end of the recession (335,900) than were lost during therecession (311,100). These gains have been partiallyoffset, however, by the loss of 23,200 government
jobs. An expected slowdown in economic growthcould limit job gains during the rest of 2012.
8.4
8.5
8.6
8.7
8.8
8.9
J a n- 0 7
A pr
J ul O c t
J a n- 0 8
A pr
J ul O c t
J a n- 0 9
A pr
J ul O c t
J a n-1 0
A pr
J ul O c t
J a n-1 1
A pr
J ul O c t
J a n-1 2
A pr
Total Employment in New York State
Note: Data have been seasonally adjusted.
Source: NYS Department of Labor
Figure 2
M i l l i o n s o f J o b s
As shown in Figure 3, educational and healthservices was the only sector to add jobs during the
recession (50,500), and it continued to add jobsduring the recovery (81,300). Tourism-relatedemployment (i.e., leisure and hospitality) declinedthe least during the recession, and has shown stronggrowth since then, adding 67,600 jobs. The businessservices sector has added more jobs than any othersector (103,600 jobs), and employment in this sectornow exceeds the prerecession level.
Ofce o the State Comptroller, May 2012
Madison County Economic Development StrategyPage 148

7/29/2019 Madison County's economic development plan, 2013
http://slidepdf.com/reader/full/madison-countys-economic-development-plan-2013 149/192
Jul. 2008 -
Dec. 2009
Change
Dec. 2009 -
Apr. 2012
Change
Net
Change
Net
Percent
Change
Leisure & Hospitality (2.8) 67.6 64.8 9.0%
Educational & Health Services 50.5 81.3 131.8 8.1%
Business Services (77.3) 103.6 26.3 2.3%
Other Services (4.3) 6.6 2.3 0.6%
Trade , Transporta tion &Utilities (76.6) 55.6 (21.0) -1.4%
Government (19.3) (23.2) (42.5) -2.8%
Financial Activities (58.2) 30.4 (27.8) -3.8%
Information (16.6) (1.1) (17.7) -6.6%
Manufacturing (74.5) 0.6 (73.9) -13.8%
Construction (51.3) (8.7) (60.0) -16.3%
Total (330.4) 312.7 (17.7) -0.2%
Source: NYS Department of Labor
Employment Changes by Sector in New York State(Thousands of Jobs)
Figure 3
The trade, transportation and utilities sector hasregained two-thirds of the jobs lost during therecession, with retail trade accounting for nearly allof these gains. The financial activities sector added30,400 jobs statewide during the recovery (half of the jobs lost), including 19,800 jobs in New York City.Within the financial sector, the securities industry in
New York City added 10,100 jobs, but the industryhas lost 1,400 jobs since October 2011, and furtherreductions are expected.
Manufacturing added 5,100 jobs during the first fourmonths of 2012, an encouraging development, butthe sector still has 13.8 percent fewer jobs thanbefore the recession. Employment has continued todecline in both construction and information.
Recession
(Jobs Lost)
Recovery
(Jobs Gained)
Net
Change
Share
Recovered
Glens Falls -2.7 3.7 1.0 137.0%
New York City -140.1 180.8 40.7 129.1%
New York State -330.4 312.7 -17.7 94.6%
Rochester -19.0 15.9 -3.1 83.7%
Utica/Rome -4.3 2.9 -1.4 67.4%
Kingston -3.1 2.0 -1.1 64.5%
Buffalo -21.0 11.9 -9.1 56.7%
Mid-Hudson Valley -9.7 5.4 -4.3 55.7%
Lower Hudson Valley -32.2 16.7 -15.5 51.9%
Syracuse -13.7 6.9 -6.8 50.4%
Long Island -53.7 25.4 -28.3 47.3%
Albany -15.5 3.9 -11.6 25.2%
Binghamton -6.3 1.3 -5.0 20.6%
Elmira -2.7 -0.1 -2.8 NA
Ithaca -1.2 -1.9 -3.1 NA
Notes:
Source: NYS Department of La bor
Employment Changes by Metropolitan AreaFigure 4
As of April 2012
Recessionary and recovery periods are determined by peak and trough levels of
employment, which vary by region. For the State, employment peaked in July 2008and reached its low in Dece mber 2009. Data have been seas onally adjusted.
Total Employment
(Thousands of Jobs)
While New York has regained nearly all of the jobslost during the recession, job growth has been unevenacross the State. In addition, many of the jobs addedduring the recovery were in industries that, onaverage, pay less ($48,300) than those which lost jobs during the recession ($64,000).
New York City and Glens Falls have added more jobs during the recovery than they lost during therecession, but the State’s other 12 metropolitan areasregained less than the statewide share (see Figure 4).Although Rochester has had strong job growth, LongIsland, Albany and Binghamton each recovered lessthan half of their job losses from the recession, andElmira and Ithaca have continued to lose jobs.
Unemployment
New York’s unemployment rate declined from itsrecessionary peak of 8.9 percent in January 2010 to8 percent in April 2011 (see Figure 5). Over the pastyear, however, the rate has risen to 8.5 percent(higher than the national rate of 8.1 percent) as morepeople have re-entered the labor market. New York had the 12th-highest unemployment rate among the50 states in April 2012.
Figure 5
Unemployment Ra te
3
4
5
6
7
8
9
10
11
J a n- 0 7
A pr - 0 7
J ul - 0 7
O c t - 0 7
J a n- 0 8
A pr - 0 8
J ul - 0 8
O c t - 0 8
J a n- 0 9
A pr - 0 9
J ul - 0 9
O c t - 0 9
J a n-1 0
A pr -1 0
J ul -1 0
O c t -1 0
J a n-1 1
A pr -1 1
J ul -1 1
O c t -1 1
J a n-1 2
A pr -1 2
United States
New York State
P e r c e n t
Sources: U.S. Bureau of Labor Statistics; NYS Department of Labor
Residents with college degrees had a lowerunemployment rate (5.1 percent in April 2012) thanthose with only some college (8.8 percent), with only
a high school diploma (9.4 percent), or without ahigh school diploma (13.9 percent). In April 2012,nearly 345,000 State residents were considered long-term unemployed (i.e., they had been without a jobfor at least 27 weeks). They accounted for 45 percentof the unemployed, down 1.8 percentage points fromtheir share one year earlier (see Figure 6).
0
10
20
30
40
50
60
2 0 0 1
2 0 0 2
2 0 0 3
2 0 0 4
2 0 0 5
2 0 0 6
2 0 0 7
2 0 0 8
2 0 0 9
2 0 1 0
2 0 1 1
2 0 1 2
P e r c e n t o f U n e m p l o y e d
Figure 6
Long-Term Unemployed in New York State
Note: Long-term unemployed are people who have been unemployed at least 27 weeks
as of April of each year.
Sources: U.S. Census Bureau; OSC analysis
Ofce o the State Comptroller, May 2012
Madison County Economic Development Strategy Page
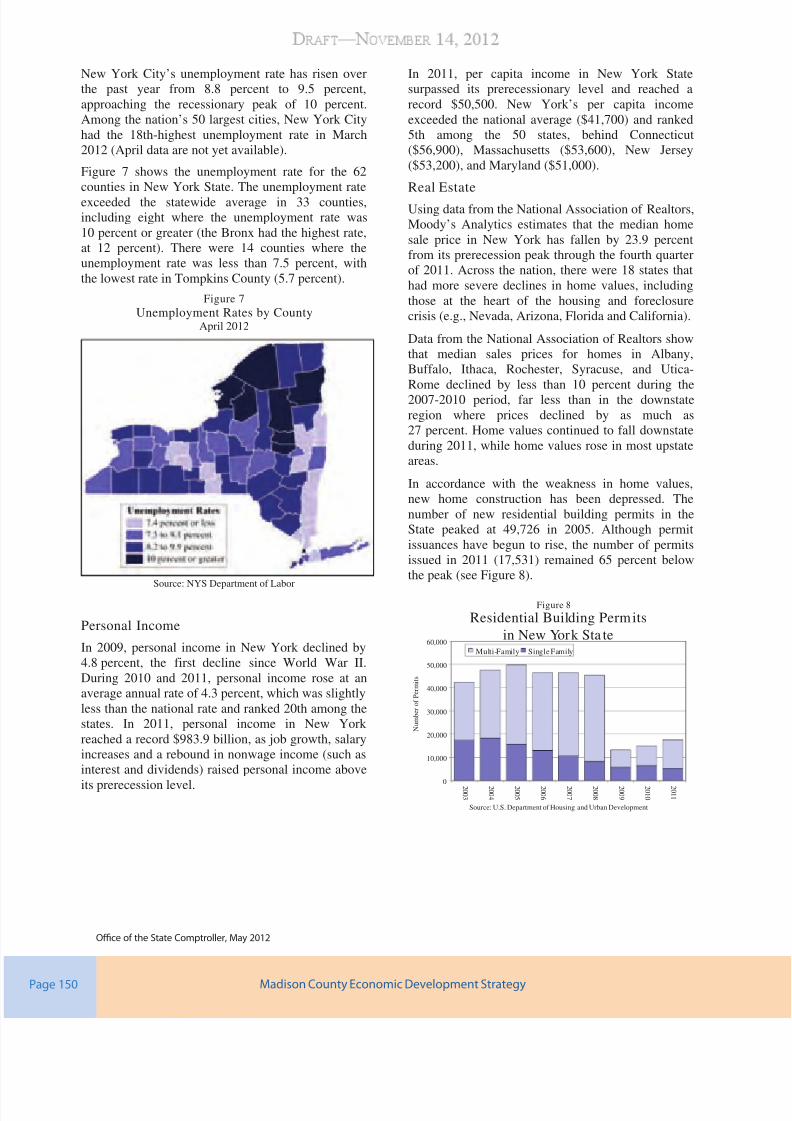
7/29/2019 Madison County's economic development plan, 2013
http://slidepdf.com/reader/full/madison-countys-economic-development-plan-2013 150/192
Ofce o the State Comptroller, May 2012
New York City’s unemployment rate has risen overthe past year from 8.8 percent to 9.5 percent,approaching the recessionary peak of 10 percent.Among the nation’s 50 largest cities, New York Cityhad the 18th-highest unemployment rate in March2012 (April data are not yet available).
Figure 7 shows the unemployment rate for the 62counties in New York State. The unemployment rateexceeded the statewide average in 33 counties,including eight where the unemployment rate was10 percent or greater (the Bronx had the highest rate,at 12 percent). There were 14 counties where theunemployment rate was less than 7.5 percent, withthe lowest rate in Tompkins County (5.7 percent).
Figure 7
Unemployment Rates by CountyApril 2012
Source: NYS Department of Labor
Personal Income
In 2009, personal income in New York declined by4.8 percent, the first decline since World War II.During 2010 and 2011, personal income rose at anaverage annual rate of 4.3 percent, which was slightlyless than the national rate and ranked 20th among thestates. In 2011, personal income in New York reached a record $983.9 billion, as job growth, salaryincreases and a rebound in nonwage income (such asinterest and dividends) raised personal income above
its prerecession level.
In 2011, per capita income in New York Statesurpassed its prerecessionary level and reached arecord $50,500. New York’s per capita incomeexceeded the national average ($41,700) and ranked5th among the 50 states, behind Connecticut($56,900), Massachusetts ($53,600), New Jersey($53,200), and Maryland ($51,000).
Real Estate
Using data from the National Association of Realtors,Moody’s Analytics estimates that the median homesale price in New York has fallen by 23.9 percentfrom its prerecession peak through the fourth quarterof 2011. Across the nation, there were 18 states thathad more severe declines in home values, includingthose at the heart of the housing and foreclosurecrisis (e.g., Nevada, Arizona, Florida and California).
Data from the National Association of Realtors showthat median sales prices for homes in Albany,Buffalo, Ithaca, Rochester, Syracuse, and Utica-Rome declined by less than 10 percent during the2007-2010 period, far less than in the downstateregion where prices declined by as much as27 percent. Home values continued to fall downstateduring 2011, while home values rose in most upstateareas.
In accordance with the weakness in home values,new home construction has been depressed. Thenumber of new residential building permits in theState peaked at 49,726 in 2005. Although permitissuances have begun to rise, the number of permitsissued in 2011 (17,531) remained 65 percent belowthe peak (see Figure 8).
0
10,000
20,000
30,000
40,000
50,000
60,000
2 0 0 3
2 0 0 4
2 0 0 5
2 0 0 6
2 0 0 7
2 0 0 8
2 0 0 9
2 0 1 0
2 0 1 1
Multi-Family Single Family
Source: U.S. Department of Housing and Urban Development
Residential Building Permits
in New York Sta te
Figure 8
N u m b e r o f P e r m i t s
Madison County Economic Development StrategyPage 150

7/29/2019 Madison County's economic development plan, 2013
http://slidepdf.com/reader/full/madison-countys-economic-development-plan-2013 151/192
Madison County Economic Development Strategy Page

7/29/2019 Madison County's economic development plan, 2013
http://slidepdf.com/reader/full/madison-countys-economic-development-plan-2013 152/192
Madison County Economic Development StrategyPage 152

7/29/2019 Madison County's economic development plan, 2013
http://slidepdf.com/reader/full/madison-countys-economic-development-plan-2013 153/192
In addition to rviwing data trnds at th intr-
national, national, rgional, and local lvl, th Task
Forc sought input from a rang of industry xprts
to guid thir fforts to prpar goals and rcommn-
dations for th Madison County Stratgic Economic
Dvlopmnt Stratgy.
As part of this ffort, a two-day workshop was
organizd in Dcmbr 2009 in Caznovia, Nw York.
During this workshop, a numbr of industry xprts
wr askd to mak prsntations to a group of local
ofcials and community business leaders on topics
chosn for discussion by th Task Forc. Ths topics
included manufacturing, producer services/back ofce
oprations, warhous/logistics, rtail/tourism, agricul-
tur, and altrnativ nrgy/biomass.
Each consultant prpard a 30–45 minut prsn-
tation on the past, present, and future of a specic
industry sctor(s), th typ of nvironmnt ncssary
to cultivat that sctor, and actions th County must
considr too position itslf as a comptitiv location
for nw privat invstmnt. Each prsntation focusd
on industry trnds, associatd opportunitis and thrats,
th qualitis and charactristics a rgion must hav to
b comptitiv in th sctor, and th barrirs Madison
County must ovrcom to improv its position within
th rgional, national, and global conomy.
As part of th prsntations and discussion, con-
sultants providd thir obsrvations of th County’s
strngths and waknsss within ach sctor rlativ to
othr rgions of th country that ar also attmpting to
support and attract ths industris. In addition, ach
consultant offrd initiativs or rcommndations thy
bliv th County should considr for inclusion in
thir Comprhnsiv Economic Dvlopmnt Stratgy.
At th conclusion of th formal prsntations, th
consultant tam participatd in an informal discus-
sion on th currnt thory and practic of conomic
dvlopmnt basd on thir xprincs in communi-
tis across th country. Th purpos of this discussion
was to educate local leaders on how they can inuence
privat invstmnt dcision making through policy,
rgulation, and programming. This discussion hlpd
attnds undrstand th factors lading to th co-
nomic decline of the region, the economic and scal
impact that privat invstmnt can hav on a commu-
nity, and how countis across th country hav mad
thmslvs idal locations for invstmnt. This discus-
sion also offrd information on bst practics, as wll
as inffctiv tools, that ar oftn usd by communitis
so that th participants could gain a comprhnsiv
undrstanding of what works and is most likly to lad
to an improvd conomic climat. Upon compltion of ach prsntation, th forum was opnd to qustions
and facilitatd discussion btwn th consultants and
attnds.
In addition to th focusd roundtabl discussion, th
Task Forc consultd with othr industry xprts and
compltd a dtaild litratur rviw to gain a bttr
undrstanding of crtain topics of particular intrst to
th committ rgarding conomic dvlopmnt at th
community level. In this regard, specic attention was
focusd on th opportunitis associatd with th dvl-
opmnt of community “main strts”, th currnt stat
of businss location stratgis and rquirmnts for
specic target growth industries, and remarks provided
during a sris of focus group intrviws that wr
conductd by a sit location consultant with various
community and businss ladrs in Madison County
svral yars ago.
A summary of th information providd during th
roundtabl discussion and supplmntary rsarch
compltd by th committ is prsntd in this sction
of th plan.
Madison County Economic Development Strategy Page
DAsk the Exper
Draft —November 14,
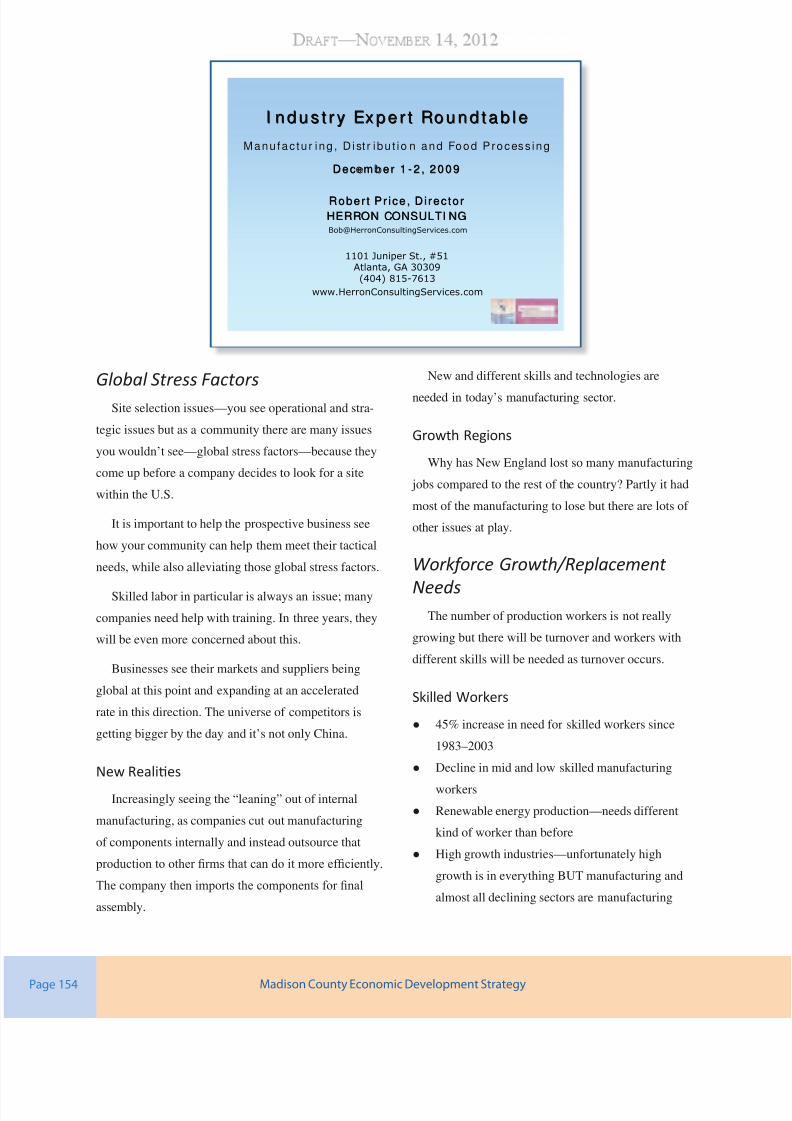
7/29/2019 Madison County's economic development plan, 2013
http://slidepdf.com/reader/full/madison-countys-economic-development-plan-2013 154/192
Global Stress Factors
Sit slction issus—you s oprational and stra-
tgic issus but as a community thr ar many issus
you wouldn’t s—global strss factors—bcaus thy
com up bfor a company dcids to look for a sit
within th U.S.
It is important to hlp th prospctiv businss s
how your community can hlp thm mt thir tactical
nds, whil also allviating thos global strss factors.
Skilld labor in particular is always an issu; many
companis nd hlp with training. In thr yars, thy
will b vn mor concrnd about this.
Businsss s thir markts and supplirs bing
global at this point and xpanding at an acclratd
rat in this dirction. Th univrs of comptitors is
gtting biggr by th day and it’s not only China.
New Realies
Incrasingly sing th “laning” out of intrnal
manufacturing, as companis cut out manufacturing
of componnts intrnally and instad outsourc that
production to other rms that can do it more efciently.
The company then imports the components for nal
assmbly.
Nw and diffrnt skills and tchnologis ar
ndd in today’s manufacturing sctor.
Growth Regions
Why has Nw England lost so many manufacturing
jobs compard to th rst of th country? Partly it had
most of th manufacturing to los but thr ar lots of
othr issus at play.
Workforce Growth/Replacement
NeedsTh numbr of production workrs is not rally
growing but thr will b turnovr and workrs with
diffrnt skills will b ndd as turnovr occurs.
Skilled Workers
● 45% incras in nd for skilld workrs sinc
1983–2003
● Dclin in mid and low skilld manufacturing
workrs
● Rnwabl nrgy production—nds diffrnt
kind of workr than bfor
● High growth industris—unfortunatly high
growth is in vrything BUT manufacturing and
almost all dclining sctors ar manufacturing
Manufac tu r ing , D ist r ibu t io n and Food Process ing
Decem ber 1Decemb er 1 -- 2 , 2 0 0 92 , 2 0 0 9
I n d u s t r y Ex p e r t Ro u n d t a b l eI n d u s t r y Ex p e r t Ro u n d t a b l e
Rober t P r ice , D i rec to rRober t P r ice , D i rec to r
HERRON CONSULTI NGHERRON CONSULTI [email protected]
1101 Juniper St., #51Atlanta, GA 30309
(404) 815-7613
www.HerronConsultingServices.com
Madison County Economic Development StrategyPage 154

7/29/2019 Madison County's economic development plan, 2013
http://slidepdf.com/reader/full/madison-countys-economic-development-plan-2013 155/192
● Manufacturing is not going away but it is NOT
countd among thos industris that will grow
fastst in this country
Food Manufacturing
Nw Tchnologis—th workforc rquirmnt is
not going to xpand dramatically but th nw tch-nologis and nds that thy will gnrat will crat
dmand for nw sits. A lot of th dmand hr is in
logistics but that will b outsourcd. Wags ar not
that high and ths companis tnd to hir lss skilld
workforc. Othr typs of food production that ar
mor tchnology-orintd might provid highr-skill,
highr wag jobs.
Niche products—if it’s for a specic ethnic market,
th company may b looking for a small facility clos
to that markt. If it’s a national product, thy may only
want on sit in th middl of th country.
Food scurity—divrsify supply lins to manag
risk in cas on supplir is contaminatd or dosn’t
mt nw standards
Ag awarnss—not producing anything nw
but changing th way food is prsntd to th buyr.
Packaging smallr quantitis, labling to show how it’shalthy—this is calld valu addd agricultur. This
applis to othr consumr awarnss issus. Can occur
almost anywhr but will hav to ti into th largr
supply chain issu for food producrs.
Food producrs divrsify supply chain to nsur
thir supply is scur.
10% of th nation’s top food producrs ar alrady
locatd in NY. Working with Cornll and th Gnva
Station you can mak your cas to ths companis.
Warehouse & Logiscs
14.8% growth ovr 10 yars is not that much but it’s
solid.
Projcts hav bn dvlopd—NYS is on list of
Top 10 of projcts whr distribution facility was
dvlopd as part of th projct. NY dosn’t lad
th pack but it is on th radar scrn. Growth tnds
to b mor toward th cntr of th country. Florida
is a surpris, Virginia too. That’s whr th ports
ar locatd and this is driving a lot of th growth in
logistics. Containrizd cargo. Jacksonvill, Savannah,
Charlston, Nwport Nws, NYC/NJ ar thrfor all
sing growth in this sctor. Wags ar rasonably high
compard to all othr manufacturing sctors. Truck-
ing is highr than avrag for th sctor. Warhous
componnt is lowr.
Energy Sustainability
Big chunk of this is increasing the efciency of consumr products, vhicls. Rnwabls is anothr
big on. Rprsnts growth sctor for manufactur-
ing mploymnt. So whil it may not vn xist or b
growing today, it will b tomorrow.
Other Potenal High-Growth Industries
Othr ky 21st cntury growth industris—hav
“nhancd” status in qualifying for fdral stimulus
funding. Hrron works to rviw fdral grant applica-tions and w’r sing a lot of fdral fundd ED work
coming down th pip. A lot of it dsignd originally
to support homland scurity, now bing usd for ED.
Advancd nrgy tchnologis mony is also bing
usd for ED.
Local Economy Sectors
Mdical quipmnt sms to hav a good bas for
growth.
Manufacturing wags ar comptitiv hr and
would b attractiv to many mployrs. Wags com-
pard to Onondaga County ar vry comptitiv so you
can draw from that activity by bing lss costly.
Location Quotint (LQ) is important—it is high for
all manufacturing, spcially food. LQ is important
Madison County Economic Development Strategy Page
7/29/2019 Madison County's economic development plan, 2013
http://slidepdf.com/reader/full/madison-countys-economic-development-plan-2013 156/192
bcaus it tlls potntial mployrs that thr may b
a local support ntwork focusd on this industry. Thy
oftn start out looking at th LQ and thn xplor fur-
thr from thr. So whil food procssing bas is nomi-
nally small hr, it is wll rprsntd. Utica MSA has
a rally high food procssing LQ.
Potenal Challenges: Logiscs
Rail
Trackag is going down but usag of rmaining
trackag is incrasing. Railroads ar vry concrnd
about kping xisting lins moving and oprating,
not slowing down. Vry hard to gt thm to switch to
an industrial park unlss thr will b havy usag to
mak it worth thir whil. Futur rail capacity map—
nightmar scnario. Railroads nd to invst to avoid
that nightmar scnario. $150 billion in upgrads
ndd through 2035. Whr will that mony com
from? Has to com out of oprating rvnu, so if thir
rvnus trnd down thy won’t b abl to fund that.
Right now, it’s down bcaus conomy is in th tank.
Rally nd funding to addrss this.
Highways
Th Thruway and I-81 ar your major highway
transportation asst.
Local Assets to Build On
● Organization, ladrship, plans—thos ar ky to
gtting consultants’ attntion. W will litrally run
whn w s thr is disagrmnt on ky issus.
● Population—yellow ag. Do have some concerns.
Lookd at population pyramids ag/gndr calcu-
lations yild som issus for you in th futur.
● Quality of Lif—would hlp to hav som tsti-
monials from companis on-lin so it’s asir to
s that you’v don th intrviws and lgwork.
● Infrastructur—hard to tll how connctd things
ar from th info you hav availabl.
● The website could reect a lot more of these
pics.
● Much of th good fling coms from th rgion,
not from Madison County specically. What he
knows about th rgion in gnral is good, has
good marktability. Rgional programs nd to b
dvlopd that caus communitis to think about
invsting in somthing outsid city or county
boundaris. Northrn KY, Bowling Grn KY—
thos ar two good xampls. Look at putting
mony into rgional facilitis.
Q&A
What metrics do you use to measure
community cohesion?
“Community ladr intrviw schdul”—W
usd to us that for larg projcts lik Army Corps of
Enginrs projcts. Explors qustions lik, “Will your
projct advrsly affct community cohsion?” Today
w us a shortnd vrsion of that. Big projcts nd a
lot of support bcaus of th potntial nvironmntal
impacts, trafc, etc.
How important is local supply for niche food
product?
Not at all for th most part. Nich markt rfrs to
th usr, not th supply. So thy want to b clos to
thir markt. Som ar starting to look at local suppli-
rs but that is still in infancy. Most look at bottom lin
which is logistics and ovrall cost of product. Whol
Foods has shown that you can sourc locally and still
make a prot.
Dairy producrs moving back to NYS to srv a
rgional thnic markt. A projct srving Boston and
NYC markt didn’t look wst of Albany (Prrir).
Whn thinking of tchnology and workforc, I think
of th rgion, not of Madison County itslf bcaus
it probably dosn’t hav th rsourcs to train th
tchnology workrs you would nd to staff a major
Madison County Economic Development StrategyPage 156

7/29/2019 Madison County's economic development plan, 2013
http://slidepdf.com/reader/full/madison-countys-economic-development-plan-2013 157/192
technology project, but you can nd those workers in
th rgion.
Are old industrial buildings a resource or do
they really not meet the needs of a modern
day manufacturer?
Most would not. Ciling hight and column spacing
wr diffrnt. Buildings today must b big nough to
gt trucks in thr and must hav transportation accss
to gt th trucks in and out of th sit as ndd?
Half of all sarchs bgin with “do you hav an
availabl building?” It may not nd up bing th
building thy go with but it gts thm intrstd in a
community.
On of th drivrs on th corporat sid is risk
minimization, so if thr is an availabl building thy
can touch, fl, look at and an indignous workforc
that has th skills that thy want, if thr is som kind
of nancial assistance, etc. So when you think about
prospcts, think about how you can minimiz all
thos risks, including th community’s ability to work
togthr. If I look at a community and I fl tnsion,
thn I’m out of thr bcaus I don’t want to put my
clint in a situation whr h has to choos sids—
Syracus vs. Utica? I don’t nd that, my clint dosn’tnd that. Rgional approach maks lif asir for th
consultant and th company.
Some Client “Global Stress Factors”
Leading To Site Selecon Programs
● Excss capacitye Falling prics/consolidation
● Deation: Customers pay less/ want more
● Uncrtain nrgy supplis and rising costs
● Sustainability issus (grnhous gass)
● Mrgrs/acquisitions
● Globalization, Supply chain optimization
● Consolidations, closurs
● Knowldg managmnt
● Rdsigning businss procsss
New Realies
● Fwr sit slction projcts
● Mor mphasis on “lan” manufacturing
● Most corporat invstmnt in nw facilitis is
businss xpansion—it occurs at xisting sits
● Skills, howvr, ar in short supply, gaps will b
mor pronouncd in th futur, particularly in lif
scincs and mdical srvics, nrgy and aro-
spac/dfns, and skilld manufacturing
Challenge Or Opportunity?
Sit slction dcision makrs ar highly risk
averse. Thy sk rlationships partnrs in th host
community who will proactivly idntify risk, and sug-
gst rmdis, hlp navigat changing nvironmntal
landscap, and work to improv th businss nviron-
mnt and commrcial infrastructur.
Local Assets to Build On
● Organizd for succss
● Effctiv ladrship
● Economic dvlopmnt stratgis
● Informd, involvd community ladrs
● Prforming ducation systm
● Highr ducation, rlvant rsarch programs
● Low crim rat, low cost of living, QOL
● Sustainabl, growing population & workforc
● Rasonabl manufacturing building costs
● Availabl industrial land choics
● Availabl dvlopd industrial, businss parks
● Airpark sits
● Industrial infrastructur at sits
● Signicant incentives programs
● Rgional manufacturing bas
● Nw conomy mployrs ● Expditd training for industry
● Intrstat highway accss nar sits
● Rail srvd sits
● Dpwatr port
● Workforc quality
● Community cohsion
● Financial structurs
Madison County Economic Development Strategy Page

7/29/2019 Madison County's economic development plan, 2013
http://slidepdf.com/reader/full/madison-countys-economic-development-plan-2013 158/192
Manufac tu rer ’s S i te Se lect ion Objec t i vesManufac tu rer ’s Si te Selec t ion Objec t i ves
Client’s Are Looking For Places To Achieve
Corpor a te Faci l i ty Locat ion Program
Resu l ts
ImprovedGlobal/MarketPosition
Profit-DrivenCulture
Time toMarket Competitive
Cost Advantage
EfficientSupplyChain
EffectiveAsset
Management
Manuf ac tur ers Expect Pressures ToCont inueManuf ac tur ers Exp ect Pressures ToCont inue
Manufac tu re rs an t i c ipa te con t inued p ressure f rom :
Industry Week 2009
Percent o f Respondents se lec t ing as one of the i r t op 3 choice
Globa l Mark e t Sourc ingGloba l Mark e t Sourc ing
Manufac tu re rs p lan s ign i f i can t l y i nc reased sourc ingf rom : China, I nd ia, S Amer ica and SE Asia
Industry Week 2009
M a n u f a ct u r i n g G r o w t h Re g ion sM a n u f a ct u r i n g G r o w t h Re g ion s
Manufac tur i ng Empl oyment Grow th ( Dec li ne) By Reg i on 1983-20 02
Po t e n t i a l H ig h - Gr o w t h I n d u s t r i e sPo t e n t i a l H i gh - Gr o w t h I n d u s t r i es
Conway Data 2009
Advanced manufacturingAerospace
Automotive & transportation technology
Biotechnology
Information Tech.
Recycling
Renewable or alternative energy
Ob am a a d m in i s t r a t i o n h a s i d e n t i f i e d se ver a lt a r g e t e d g r o w t h i n d u s t r i e s, k ey to 21 st c en tu r yg loba l c ompe t i t i v eness
Em ploym ent Oppor t un i t i es fo r Se lec tedI ndus t ry Secto rs
IndustryEmployees
2006Employees
2016 % Chang
Pharmaceutical & Medical
Instrument Manufacturing
292,000 361,204 23.
Aerospace Manufactur ing 472,000 497,488 5.
Food Manufacturing 1,484,000 1,488,452 0.
Warehouse & Logist ics 2,074,000 2,380,952 14.
US Bureau of Labor Statistics 2007
Madison County Strategic Economic Development PlanPage 158

7/29/2019 Madison County's economic development plan, 2013
http://slidepdf.com/reader/full/madison-countys-economic-development-plan-2013 159/192
Oppor tun i t y : Pha rm aceu t i ca l / Med i ca lI n s t r u m e n t M a n u f ac t u r i n gOppo r tun i t y : Pha rm aceu t i ca l / Med i ca lI n s t r u m e n t M a n u f ac t u r i n g
P h ar m a c e u t i ca l m a n u f a c t u r i n g – n o t a l e a d e r i n j o bc rea t ion bu t a so l i d oppor tu n i t y fo r economic g rowt h
11.55.316Material moving, packers
21.926.884Production Occupations
31.04.814Installation, maint., repair
19.812.537Administrative
25.53.09Sales
26.427.881Professional
26.515.947Management
23.7100292All Occupations
2006 - 2016Percent1,000 Jobs
% ChangeEmployees2006
US Bureau of Labor Statistics 2007Columns may not add due to omission of occupations with small employment
I ndus t r i a l Loca t i on Quo t i en t sI ndus t r i a l Loca t i on Quo t i en t s
Locat i on Quo t i en ts* re la t i ve to t he USA
0.530.63New York State
0.680.76New Jersey
0.780.75Virginia
0.620.86Massachusetts
0.371.10Connecticut
1.061.10Pennsylvania
1.221.18Vermont
0.921.39Ohio
Food ProductionManufacturingBase: USA
0.420.58Albany MSA
0.561.06Syracuse MSA
0.891.41Rochester MSA
0.971.11Buffalo MSA
1.011.71Binghamton MSA
1.021.12Utica MSA
Food ProductioManufacturingBase: USA
1.151.31Madison County
Food Manufactur ing Chal lengesFood Manufactur ing Chal lenges
• Pr i ce compe t i t i on f r om o f f sho re p roduce rs o f f e r i ng cho i ces
• N ew fac i l i t i es w i l l s t em f r om innov a t i on and chang ing t as tes
• More n i che p roduc ts – s ing le p roduce rs w i l l be cen t r a l l y
l oca ted o r n ea r un ique mar ke t ( i . e . Ch icago , N YC, LA )
• “ F o o d s e cu r i t y ” – g r o w i n g c o n ce r n r eq u i r e s n e w i n v e s t m e n t
• “ A g e a w a r e n e ss ” a n d ca l o r ie i n t a k e co n t r o l – n e w l a b e l in g
and packag ing , oppor tun i t y f o r va lue added ag r i cu l t u re
• L o w - c o st l a b o r a v a i la b i l it y – a l w a y s a d r i v e r f o r s o m e –
becomes more d i f f i cu l t as m ig r an t l abo r poo l dw ind les
• Lack o f f i nanc ing – c rea tes p ressu re t o expand a t ex i s t i ng
s i t es t o mee t capac i t y needs
New York Com pan ies Am ong The Na t i on ’ sTop 100 Food Processors
Peps iCo I nc .
700 Ande rs on H i l l Rd ,
Pu rc has e , NY 10577 -1 444Phone: 914- 253-2000; Fax: 914-253-2070
Beverages, snack foods
Rich Products Corp.
1150 N iaga ra S t . , Bu f fa lo , NY 14213Phone: 716-878-8000; Fax: 716-878-8765
Toppings, deserts, pizza
Colgate-Palmol ive Co.
300 Pa rk Av e . , New Yo rk , NY 10022Phone: 212-310-2000; Fax: 212-310-340 Pet
food
ContiGroup Cos., I nc .
277 Pa rk Av e . , New Yo rk , NY 10172Phone: 212-207-5100; Fax: 212-207-2910
Meat
Seneca Foods Corp.3736 S . Ma in S t . , Ma r ion , NY 14505Phone: 315-926-8100; Fax: 315-926-8300Frozen, canned vegetables & fruit
Birds Eye Foods I nc .
90 L inden Oak s , Roc hes te r , NY 14625Phone: 585-383-1850; Fax: 585-383-1281Meat/poultry frozen & canned, snacks, misc
The Dannon Co . Inc .
120 W h i te P la ins Road
Ta r ry town , NY 10591 -5536Phone: 914-366-9700; Fax: 914-366-2805Dairy foods
Lac ta l i s Amer ic a Group
950 Th i rd Av e . , 22nd F loo r , NY 10022Cheese
The Ha in Ce les t ia l Group I nc .
58 S. Serv ice Rd., Melv i l le , NY 11747
Phone: 631-730-2200; Fax: 631-730-2550Natural food, bev., snacks, tea
Na t iona l Grape Coope ra t i v e As s o . Inc .
2 S . Po r tage S t . , Wes t f ie ld , NY 14787Phone: 716-326-5200; Fax: 716-336-5494
Canned, frozen beverages, fruit juice
Wa r e h o u se / Lo g i st i c s Pr o j e c t sWa r e h o u se / L og i s t i cs Pr o j e c t s
Number o f Co rpo ra te P ro jec ts Wi th A D is t r ibu t ion
Faci l i t y Componen t J an ’07 - Feb ’09
29New York
32Virginia
33Pennsylvania
37Minnesota
38I ndiana
42Florida
47Tennessee
68Texas
115Ohio
139I llinois
ProjectsState
• Outsourc ing to 3PLs w i l l con t i nue , i ndependen t o f
manu fac tu r ing l oca t i ons
• Gr o w t h n e a r u r b a n m a r k e t s , g r ow t h c e n t e r s, p o r t s
• Rai l and h ighw ay assets a re fas t becoming cons t ra in ts
t o e c o n om i c g r o w t h Insufficient Capacity
Physical Deterioration
• Rai l roads ’ d r i ve fo r e f f i c i ency w i l l con t i nue to i nc rease
loca l deve lopment cos ts
• Sta tes and commu n i t i es mus t i nves t i n “ f i x es ”
Potent ia l Chal len ge: Logis t ics
Madison County Strategic Economic Development Plan Page

7/29/2019 Madison County's economic development plan, 2013
http://slidepdf.com/reader/full/madison-countys-economic-development-plan-2013 160/192
Site Selecon
Misconcptione whit collar projcts (call cntrs)
don’t always hav a pristin rputation. Sort of lik
warhouss. Popl’s prcption was that it was dirty
and grungy and dangrous. Today, modrn warhouss
ar highly automatd, th workrs ar skilld. Sam
with these white collar/back ofce projects.
The fact of the matter is that back ofce/customer
support srvics ar driving a lot of our conomy.
Why? Cost containmnt. Also as th ovrsas nvi-
ronmnt bcoms saturatd in trms of th numbr
of indignous populations’ ability to spak compr-
hnsibl English, thr is now a movmnt to bring
thos jobs back hr. Th ons that ar moving back
tnd to b th last skilld bcaus th othr countris
still hav us trumpd on skilld workrs (nginrs,
tchnicians tc) so what’s coming back ar oprations
lik Unitd Airlins. Thy initially shippd customr
srvic to India and ovr tim th ovrall quality of that srvic dclind as comptition for English spak-
ing customr srvic rps grw, so now thy’v had to
mov that work back to th U.S.
Site consultants are systematically nding reasons
to liminat potntial locations. Thr is no utopia so
don’t think that bfor you go out and markt your
ara, you hav to b prfct.
Step 1: Formulang Objecves
Thr kyse
1. W hav to formulat th paramtrse numbr of
employees, power usage, workforce skills, etc. Dene
xactly what thy nd.
2. Stratgic objctivs—improving customr
snsitivity, somtims you nd a nw location to startovr and b mor snsitiv to customrs’ nds. So this
is a big rason within this sctor.
3. Subjctiv factors—labor quality is at th top of th
list, attituds of workforc
Prsonal taxs and quality of lif ar rally impor-
tant if you ar going to transfr popl, othrwis not
as important. On of th things a lot of groups don’t
ask about is how many transfrs ar thr.
Trad-offs ar hard to judg—what is $40K in sav-
ings in operating costs if you have difculty with your
tlcommunications?
Skilld labor—vn though most of th jobs may b
unskilld, w focus on looking for th skilld folks.
Site Selection Process
INDUSTRY EXPERT ROUNDTABLE
Customer Support Center
December 2, 2009
315 Evergreen AvenueMount Prospect, Illinois 60056
(312) 560-8355
adyinternational.com
Robert M. Ady, President
Madison County Economic Development StrategyPage 160

7/29/2019 Madison County's economic development plan, 2013
http://slidepdf.com/reader/full/madison-countys-economic-development-plan-2013 161/192
Tax costs ar important if th company is alrady
hr—if thos costs go up you los popl. Lss
important for nw businsss looking for a nw loca-
tion. Th point for outsidrs looking for nw location is
that taxs hav to b rasonably comptitiv. Most of
our clints nvr vn us th incntivs—too com-
plicatd, thy don’t rally nd thm, tc. Thy’ll tak
whatvr is offrd but it’s not a mak or brak thing.
Communitis ar oftn scard to ask companis
qustions—you should prsist to hlp answr thir
qustions. Worst that can happn is thy don’t answr
you, but that is not going to liminat you.
If th rgion dosn’t mak it through th initial
screen, then no specic sites within the County would
vn b considrd, which is why rgional collabora-
tion is so important.
Lots of projcts say right off th bat, do not con-
sidr sits in NYS, NJ or CA—subjctivly thy hav
a problm with thos stats bcaus of thir high cost
rputation.
Training—thr is always a disconnct hr bcaus
most of th mony availabl is for r-training dislo-
catd workrs, not ncssarily for a nw mployr to
rady th local workforc. Also, most training is not
for soft skills (popl skills, how to gt along with
coworkrs, tc) which is sorly ndd. Training
mony is usually availabl for hard skills training.
Loss of Empir Zon will b a problm. Local fund-
ing assistanc from rvolving loan funds isn’t rally
going to hav much of an impact. Rvnu bonds ar
bing rinvntd and ar coming back.
A lot of projcts actually hav a population cutoff—1 million or 500,000 is as low as thy’ll go.
500,000 is a vry typical cut off, which is why it’s
important to markt th MSA or rgion.
Step 2: Dening the Area of Search
In stp 2, focus is on wbsits for gathring info.
Th basicse th data on your sit has to b currnt. You
hav to giv us info w can’t gt from our own data
sourcs. Th wbsit has to look profssional. If you
can’t provid thos thr things, you’ll b liminatd
bfor you vn knw thy wr looking at you.
Most of th country is now organizd by rgions.
As a county you ar compting with REGIONS in th
country so you ar not going to hav th sam offr-
ings. A rgional orintation also indicats that th
groups ar gtting along.
Has to b gographic—Cntral Nw York—grat
nam. W ar gographically orintd.
W lov maps. Th information has to b prsntd
in a highly visual way—no on rads anymor.
Wbsit should b fast and asy to us—w don’t
want bouncing bubbls or graphics that slow th sit
down. We want a lot of content that is easy to nd. 7
clicks or lss.
Back ofce projects are looking for available space
and thr is not a lot of that hr.
If you don’t hav a building to markt, hav your
nginr put up a mock plan of a park with buildings
and gt it pr-prmittd or concptually approvd so
it would only tak thm 120 days to build. Show ths
drawings and maps—again, must b visual.
Exampls of good wbsitse
Columbus, GA
Radius, IN
Sterling, IL overview prole of locational charac-
tristics and critria that ar important to your targt
industry
Step 3: Evaluang Locaons
No supplmntal nots on this sction—s slids.
Madison County Economic Development Strategy Page

7/29/2019 Madison County's economic development plan, 2013
http://slidepdf.com/reader/full/madison-countys-economic-development-plan-2013 162/192
Step 4: Field Visits
Fild visits—this phas is fraught with dangr
bcaus now th clint will b xposd to th local
actors, local politics, local gossip. B carful who you
involv.
Local mployrs ar your bst salspopl—thywill talk to your xisting businsss so kp your local
biz happy—thy ar your #1 salspopl. Most com-
munitis that ar up on this ar invntorying thir local
businsss to s what thir workforc nds will b in
3–5 yars.
Maintain rlationships with corporat HQ of xist-
ing mployrs bcaus plant managr is going to b
th last prson to know thy will b closing. Go visit
corporat. Thank thm. Talk to thm about thir plans/
nds. Thy may nvr hav vn bn to th location.
Onc a company dcids thy ar laving, thy ar
gon. Kp thm happy so thy don’t lav.
You are on display during a eld visit. It’s ok to be
quit somtims. Mak th visit productiv. Do a dry
run. Hav local incntiv packag irond out bfor-
hand so you can prsnt it.
Companis want to b wantd and you hav to showthem that. The nal selection is mostly subjective,
basd on th xcutivs’ visit and thir imprssions.
Madison County Economic Development StrategyPage 162

7/29/2019 Madison County's economic development plan, 2013
http://slidepdf.com/reader/full/madison-countys-economic-development-plan-2013 163/192
Site selection is a Process of EliminationSteps in the Site Selection Process
Step 1: Identify Company Objectives
Step 2: Defining the Area of Search
Step 3: Evaluating Locations
Step 4: Field Visitations
Step 5: Recommendations
Step 6: Implementation
Step 1: Company Objectives
• Strategy: – serve new market
– equalize competition
– minimize operating costs
– introduce new operating program
– improve operating efficiency; etc.
• Definition of the facility:
– labor requirements, utility requirements, occupancy requirements
• Subjective factors:
– labor availability, QOL, accessibility
• Implications for Madison County
---No direct contact with the state or the county
---Length of time to develop standards
---Criteria will probably change during the course of the
project
Step 1: Formulating Objectives LocationalCriteria for Customer Support Centers
College/University
Housing Cost &
Availability
Air ServiceBuilding Availability
Quality of LifeEmployee TrainingSkilled Labor Availability
Electric Power
Dependability
Unskilled Labor
Availability
Telecommunications
Capabilities
Operating Conditions
Cost of LivingIncentives
Electric Power Occupancy
Personal TaxesTelecommunicationsWages/ Salaries
Operating Costs
ImportantVery ImportantCritical ImportanceCriteria
Madison County Strategic Economic Development Plan Page

7/29/2019 Madison County's economic development plan, 2013
http://slidepdf.com/reader/full/madison-countys-economic-development-plan-2013 164/192
Step 1: Formulating Objectives
• Support Center Specifications (Typical example)
---Purpose: Inbound call center offering technical support and salesfor insurance services with emphasis on IT---Labor: 175
5 managerial
10 administrative support
20 technical support
10 customer service supervisors
80 customer service representatives
20 help desk representatives
30 data entry operators
--- Utilities: Electric Power 100 Kw; 50,000 Kwh per month
Telecommunications: Fiber optics and electronic switchingproviding high capacity capabilities
--- Building: 30,000 square feet; Class B office space
• Relative Importance of Operating Costs for Customer Support Centers
Labor Costs 72%
Transportation Costs 0
Utility Costs 8%
Occupancy Costs 15%
Tax Costs 5%
Total Costs 100%
Step 2: Defining the Area of Search
• Evaluation of state characteristics:
– Taxes; training; incentives
• Preliminary evaluation of larger areas and/or regions:
– Population, growth, unemployment, etc.
• Transportation factors:
– Air service• Subjective factors:
– Colleges and vocational schools, interstate highwayetc.
Implications for Madison County
• No direct contact with individual communities within the
county, but detailed review of web sites
• Review state business climate, taxes, training programs
and incentives
• Multiple states under consideration
• Regional comparisons undertaken
• Area may be eliminated at this stage without ever
contacting state or regional/local representatives
Key Screening Criteria• State Taxes (New York)
--- Ranking:49; Personal Taxes: 8.97% (Maximum)
• Training (New York)
--- Funding up to 50% of training program
• Incentives (Madison County Development Zone)
--- Significant: Tax Credits; Investment Credits; Real Property Tax CreditsLocal Funding Assistance; Others
• Population (Madison County)
--- Population 2000: 739,014; 2008: 732,762
• Population Growth (Madison County)
• --- Percent Change 2000-2008: -0.85
• Unemployment ( Madison County)
--- Percent: 7.3; Number: 2,600
Madison County Strategic Economic Development PlanPage 164

7/29/2019 Madison County's economic development plan, 2013
http://slidepdf.com/reader/full/madison-countys-economic-development-plan-2013 165/192
Step 3: Evaluating Locations
Implications for Madison County• First direct contact with specific communities
• Discuss topics not covered on web site
• Discuss local incentives
• Review available buildings and sites meeting timeframe
• Project preliminary operating costs by location factor andaggregate
• Gather information on labor cost, availability, and quality
• Review quality of life considerations
• Rapid response to all information requests mandatory
Step 3: Evaluating Locations-Key Location Criteria
31Violent Crime (1Best-10)
UnlimitedLimitedSpace Availability (B)
34.927.7Education(% CollegeGraduates)
Non-attainment Attainment Air Quality
100.0081.31Culture Index
Large HubSmall Hub Airport Activity
SameSameSameIncentives
$1,140,000$50.00$12.00Occupancy (per sq. ft.)
$1,185,975$49,389$42,612Wages and Salaries (withfringes)
DifferenceNew York CitySyracuse MSA
Step 4: Field Visitations
Local Visit
• Interviews with local employers
• Service representative interviews• Community leadership discussions (local incentives)
• Inspect available buildings and/or sites for appropriateness andreadiness
Implications for Madison County• Direct contact with state and county communities
• Make every minute of the visit productive
• Answer every question and respond to even the most casualcomment
• Have key resources on standby
• Have incentive policy agreed upon locally
Step 5: Recommendations
Client Meetings
• Identify two or three final candidate locations
• Balance operating costs, potential incentives, and operatingconditions with quality of life features
Implications for Madison County
• Expect visit by company executives
• Maintain professionalism and polished tour/image of location
• Make executives feel welcome
• Stress quality of life and employee recruitment/transfer features
• Convey high level of commitment to new investment: mayor, areaexecutives, college president
• Make final incentive commitments
Step 6: Implementation
Final Steps• Perform detailed engineering/legal analysis
• Secure options• Secure approvals and purchase or lease
• Secure permitting
Implications for Madison County• Perform final negotiations: land, infrastructure, training assistance,
tax abatements, employee relocation costs, etc.
• Fulfill all commitments, but expect business commitment in return
• Collaborate between governmental entities, work force providers,service providers, and others
Madison County Strategic Economic Development Plan Page

7/29/2019 Madison County's economic development plan, 2013
http://slidepdf.com/reader/full/madison-countys-economic-development-plan-2013 166/192
It’s important to undrstand th contxt for agri-
cultur in Madison County. You ar a lot closr to
the afuent NYC food market, people are focused on
avor and regional distinctions, healthy food is huge.
This is whr food dmand sms to b driving. Today
w don’t hav a mass markt, as much as a lot of nich
markts. You s mor popl hr willing to pay a
prmium for food producd in a way thy support.
I think you hav som comparativ advantags
hr in Madison County which is critical whn think-
ing about whr you want to go in th comptitiv
conomy.
1. Proximity to NYC mtro ara markt—
concentration of afuent consumers. This is key
bcaus it’s xpnsiv to ship milk and milk products,
foodis want “local” products and you can b local
food sourc to 15 million popl.
2. You hav som dcnt productiv land—you can
grow corn and dcnt forags hr.
3. You hav human capital in agricultur—thr ar alot of folks who know dairy, you hav vts.
4. You hav institutional capital in Cornll.
Thos attributs giv you som options in
agricultur.
On way you could go is to b a playr in th
convntional dairy industry. Oprations of 1,000 cows
or mor, not rally ownr-opratd, rly havily on
low-wag labor. So you could go this dirction and b
succssful but go with your ys opn. Our xprinc
with industrialization of hog production was a lot of
conict and not a great outcome in terms of quality of
lif, mploymnt opportunitis, loss of othr mploy-
rs as situation dclins.
Or you can us your advantags to dvlop a dif-
frnt typ of agricultur that is going to do a lot mor
for your conomy and do mor good to crat gnuin
opportunity for rural popl.
Suggst making a statmnt that Madison County
will b a ladr in dvloping grass-basd dairy sys-
tms. Dairy producd in this way can hav vn mor
of a public halth impact than grass fd bf. Omga
3s from grass fd cows ar 2x rgular and hav 1/3 of
th bad fats that ar found in convntional dairy. This
is going to b a big thing in this country bcaus of
halth concrns.
You hav lots of good forag (grass) and you ar
close to those afuent consumers who want to buy this
typ of product. Also lnds itslf to spcialty farmstad
chss that draw big prmium prics.
Whn you go to grass-basd dairy you mov away
from industrial modl toward family farm modl.
Grass basd systms do not rquir a big up front capi-
tal invstmnt for small farms (100 cows or so). Ths
Agriculture Development
INDUSTRY EXPERT ROUNDTABLE
December 2, 2009
Chuck Hassebrook, Executive Director
Center for Rural Affairs
145 Main St, PO Box 136Lyons, Nebraska 68038
[email protected](402) 687-2103 x1018
Madison County Economic Development StrategyPage 166

7/29/2019 Madison County's economic development plan, 2013
http://slidepdf.com/reader/full/madison-countys-economic-development-plan-2013 167/192
grass basd systms ar sasonal so procssors ar not
going to invst in th procssing facility that dosn’t
oprat yar round but you could produc organic
grain fd milk in th wintr. Easy to grow grains and
stor for wintr.
Issu is that dairy farmrs ar not rally into mar-
kting thir products—thy lik that th milk truck coms and picks it up and slls it. Also U.S.DA has
not dened what a grass based dairy is to facilitate
markting.
Procssors will vntually hav to pay a prmium
as dmand for grass basd dairy products incrass but
it has to start somewhere. Key is to nd some small
ntrprnurs on th procssing sid who will want to
start small and grow with th dmand. Cornll has a
small farm program—prhaps thy could assist in th
ndavor.
This could b a branding opportunity for th
County. It could b known as th plac whr halthy,
family producd milk is producd. That pastoral, natu-
ral, halthy imag would b a grat brand. In Franc,
th plac that food is producd is important. Flavor and
attributes of food from specic regions plays a large
part in markting and pric.
Also contributs to agritourism. Family farms can
turn into ranchs or rsorts. A good xampl is BrucSwitzr’s ranch in Nbraska. Thy built a lot of ancil-
lary activitis to supplmnt th incom from ranch-
ing. High-dollar bird watchrs paid to watch prairi
chickns.
Potntial for winris? Win industry in Nbraska
has xplodd. Why? Bcaus popl want to xpri-
nc what a local Nbraska win is lik. Again, th ky
is to hav th ntrprnurs who will larn th businss
and tak th risks to try to mak it work.
Enrgy. Lots of growth across th country in altr-
nativ nrgy. Lgislation in Congrss to mandat %
of lctricity that coms from wind. Thr will also b
opportunitis from biomass. To th xtnt you can do
sustainabl harvsting of your woodlands (don’t us
land you could produc high quality forag on) that
could b succssful.
Pay grass basd dairy and biomass producrs for
carbon squstration.
Ar thr things you can do to support microntr-
priss? Will a larg businss contract with a ntwork of
micro-businsss?
Meat processing? Try to nd some intermediate
scal du to cost.
Summary
1. Support ntrprnurship. St up a microntrpris
program through a non-prot organization. U.S.DA
has funding for that. Nw farm bill cratd grants for
stting up farms—bginning farmrs programs. Link
bginning farmrs with rtiring farmrs.
2. Hlp agricultural community—vryon involvd
in ag—xamin altrnativs to th way farming has
always bn don to ducat th playrs of thir
options (grass basd, carbon squstration, organic
farming, tc). Th opportunitis in agricultur now ar
diffrnt than a gnration ago.
3. Support valu-addd agricultural vnturs.
Procssing but also producing things in ways that mak
thm worth mor to consumrs and thn markting
in a way that capturs that valu. Program at U.S.DA
calld valu addd producr grants program for markt
studis for launching nw markt vnturs. Th ky is
that somon has to initiat th idas and put togthr a
grant proposal—that is a rol th County could play.
4. Look around to gure out who you can work with
to do ths things—Cornll b/c you nd rsarch
capacity to back you up; your congrssional dlgation
to hlp gt fdral grants.
Madison County Economic Development Strategy Page
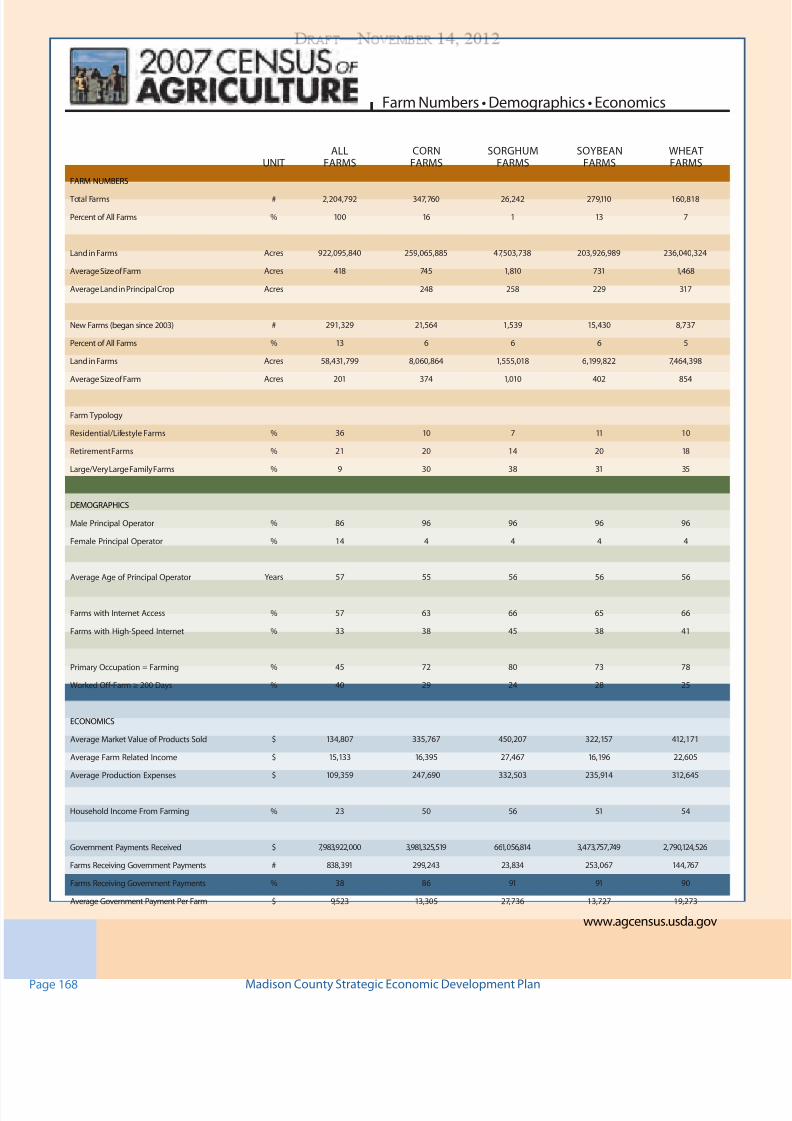
7/29/2019 Madison County's economic development plan, 2013
http://slidepdf.com/reader/full/madison-countys-economic-development-plan-2013 168/192
UnitAll
FArmsCorn
FArmssorghUm
FArmssoybeAn
FArmsWheAtFArms
FArm nUmbers
ta Fa # 2,204,792 347,760 26,242 279,110 160,818
Pc A Fa % 100 16 1 13 7
lad Fa Ac 922,095,840 259,065,885 47,503,738 203,926,989 236,040,324
Ava sz Fa Ac 418 745 1,810 731 1,468
Ava lad Pcpa Cp Ac 248 258 229 317
nw Fa (a c 2003) # 291,329 21,564 1,539 15,430 8,737
Pc A Fa % 13 6 6 6 5
lad Fa Ac 58,431,799 8,060,864 1,555,018 6,199,822 7,464,398
Ava sz Fa Ac 201 374 1,010 402 854
Fa tp
rda/l Fa % 36 10 7 11 10
r Fa % 21 20 14 20 18
la/V la Fa Fa % 9 30 38 31 35
DemogrAPhiCs
ma Pcpa opa % 86 96 96 96 96
Fa Pcpa opa % 14 4 4 4 4
Ava A Pcpa opa ya 57 55 56 56 56
Fa w i Acc % 57 63 66 65 66
Fa w h-spd i % 33 38 45 38 41
Pa occupa = Fa % 45 72 80 73 78
Wkd of-Fa ≥ 200 Da % 40 29 24 28 25
eConomiCs
Ava mak Vau Pduc sd $ 134,807 335,767 450,207 322,157 412,171
Ava Fa rad ic $ 15,133 16,395 27,467 16,196 22,605
Ava Pduc exp $ 109,359 247,690 332,503 235,914 312,645
hud ic F Fa % 23 50 56 51 54
gv Pa rcvd $ 7,983,922,000 3,981,325,519 661,056,814 3,473,757,749 2,790,124,526
Fa rcv gv Pa # 838,391 299,243 23,834 253,067 144,767
Fa rcv gv Pa % 38 86 91 91 90
Ava gv Pa P Fa $ 9,523 13,305 27,736 13,727 19,273
Farm Numbers • Demographics • Economics
www.acu.uda.v
Madison County Strategic Economic Development PlanPage 168

7/29/2019 Madison County's economic development plan, 2013
http://slidepdf.com/reader/full/madison-countys-economic-development-plan-2013 169/192
Madison CountyNew York
2007 2002 % change
Number of Farms 744 734 + 1
Land in Farms 188,320 acres 168,264 acres + 12
Average Size of Farm 253 acres 229 acres + 10
Market Value of Products Sold $86,331,000 $61,604,000 + 40
Crop Sales $16,124,000 (19 percent)Livestock Sales $70,207,000 (81 percent)
Average Per Farm $116,036 $83,929 + 38
Government Payments $1,629,000 $3,469,000 - 53
Average Per Farm Receiving Payments $6,733 $13,876 - 51
Madison County Strategic Economic Development Plan Page

7/29/2019 Madison County's economic development plan, 2013
http://slidepdf.com/reader/full/madison-countys-economic-development-plan-2013 170/192
Madison County – New York
Ranked items among the 62 state counties and 3,079 U.S. counties, 2007
Item Quantity State Rank Universe1
U.S. Rank Universe1
MARKET VALUE OF AGRICULTURAL PRODUCTS SOLD ($1,000)
Total value of agricultural products soldValue of crops including nursery and greenhouseValue of livestock, poultry, and their products
VALUE OF SALES BY COMMODITY GROUP ($1,000)
Grains, oilseeds, dry beans, and dry peasTobaccoCotton and cottonseedVegetables, melons, potatoes, and sweet potatoesFruits, tree nuts, and berriesNursery, greenhouse, floriculture, and sod
Cut Christmas trees and short rotation woody cropsOther crops and hayPoultry and eggsCattle and calvesMilk and other dairy products from cowsHogs and pigsSheep, goats, and their productsHorses, ponies, mules, burros, and donkeysAquacultureOther animals and other animal products
TOP CROP ITEMS (acres)
Forage - land used for all hay and haylage, grass silage, and greenchopCorn for grainCorn for silageSoybeans for beansOats for grain
TOP LIVESTOCK INVENTORY ITEMS (number)
Cattle and calves
LayersHorses and poniesSheep and lambsColonies of bees
86,33116,12470,207
6,573--
1,946275
3,758
2273,345
566,992
62,33728
13044372
149
59,39216,68014,6843,4561,548
43,115
2,4511,8021,6841,627
212515
16--
314022
16164417144523261931
614111414
12
3815149
616158
54--
595861
54555754545555574057
5453524651
55
57585554
1,0231,590
589
1,393--
598940567
216495
1,6311,478
1161,815
899547721818
17799573
1,272253
719
1,031672584346
3,0763,0723,069
2,933437626
2,7962,6592,703
1,7103,0543,0203,0542,4932,9222,9983,0241,4982,875
3,0602,6342,2632,0391,957
3,060
3,0243,0662,8912,640
Other County Highlights
Economic Characteristics Quantity
Farms by value of sales:Less than $1,000$1,000 to $2,499$2,500 to $4,999$5,000 to $9,999$10,000 to $19,999$20,000 to $24,999$25,000 to $39,999$40,000 to $49,999$50,000 to $99,999$100,000 to $249,999$250,000 to $499,999$500,000 or more
Total farm production expenses ($1,000)Average per farm ($)
Net cash farm income of operation ($1,000)Average per farm ($)
1804962766920551830875939
67,87591,230
24,68533,179
Operator Characteristics Quantity
Principal operators by primary occupation:FarmingOther
Principal operators by sex:MaleFemale
Average age of principal operator (years)
All operators by race 2:American Indian or Alaska NativeAsianBlack or African AmericanNative Hawaiian or Other Pacific IslanderWhiteMore than one race
All operators of Spanish, Hispanic, or Latino Origin2
414330
612132
55.7
625-
1,230-
10
See "Census of Agriculture, Volume 1, Geographic Area Series" for complete footnotes, explanations, definitions, and methodology.(D) Cannot be disclosed. (Z) Less than half of the unit shown.1 Universe is number of counties in state or U.S. with item. 2 Data were collected for a maximum of three opera tors per farm.
Madison County Strategic Economic Development PlanPage 170

7/29/2019 Madison County's economic development plan, 2013
http://slidepdf.com/reader/full/madison-countys-economic-development-plan-2013 171/192
Naonal Consumer & Retail Trends:
Th nw normal—popl ar spnding lss and
indications ar this will last byond th rcssion.
“Discount Dstinations” ar th nw concpt in th
dvlopr community to rplac “Lifstyl Cntrs.”
Recent college grads unable to nd work are especially
affctd in trms of chang in lifstyl and spnding
pattrns.
Tourism markting—undrstand th distinct gn-
rational groups, what thy lik to do, how to rach
thm. Monitor blogs, communicat using social mdia,
dvlop rlationships with ths markts.
Local Travl Rsourcs—hav lots of intrst-
ing things to s and do but th County lacks a major
draw/attraction.
Retail Market Analysis
There is some leakage, but it is difcult to recap-
tur du to proximity to Syracus/Utica-Rom rtail
offrings.
Recommendaons
Retail
● Som lakag
● Difculty competing with retail centers and online
stors
● Think discountr dstination
● Employmnt impact minimal, but County sals tax
signicant
● Build program that addrsss lakag and builds
on surplus
● Local rtailrs nd to compt onlin whr
possibl
● Mixd us rtail dvlopmnt
Tourism
● No signicant attraction/destination
● Compting with th Fingr Laks, Adirondacks,
● Cooprstown and Niagara Falls for rgional
travlrs
● Conduct County visitor survy to larn mor
● Tourism attraction rquirs rtail to hav impact
● Nw hotl dvlopmnt - xplor with caution ● Improv onlin tourism markting campaign
○ Must b targtd
○ Social mdia and ntworking
● Idntify assts and build on
● Evntually, China and India travlrs
ndDecember 2 , 2009
Robert Camoin, President & CEOCamoin Associates
PO Box 3367
Saratoga Springs, New York 12866
(518) 899-2608
Retail Market/Tourism Analysis for Madison CountyRetail Market/Tourism Analysis for Madison County
INDUSTRY EXPERT ROUNDTABLEINDUSTRY EXPERT ROUNDTABLE
Madison County Economic Development Strategy Page

7/29/2019 Madison County's economic development plan, 2013
http://slidepdf.com/reader/full/madison-countys-economic-development-plan-2013 172/192
NATIONAL RETAIL TRENDSNATIONAL RETAIL TRENDS
• Declining year over year b/t 2004 and 2009
• Showing signs of recovery
• October retail sales up 1.4% over September
• Discounters have done well
• Department store segment - modest decline
• Large chain retailers - down-sizing and closing
unprofitable or lower margin locations
• Motor vehicle demand rose 2.6% for Octoberfrom prior year. First increase since Nov 07
• Retail leases are being renegotiated
• Discounters have done well
• Department store segment - modest decline
• Large chain retailers - down-sizing and closing
unprofitable or lower margin locations
• Motor vehicle demand rose 2.6% for October
from prior year. First increase since Nov 07
• Retail leases are being renegotiated
NATIONAL CONSUMER MARKET TRENDSNATIONAL CONSUMER MARKET TRENDS
• Top restaurateurs report – customer focusing on
value
• Chefs and restaurateurs report - increased demand
for healthier kids’ menus, smaller portions, organic
and locally grown.• 75% of customers surveyed - would patronize a
full-service restaurant more frequently if the
restaurant offered frequent- or mid-week dining
discounts.
• Other draws: Smaller portions for a lower price;
discounts for dining at off-peak times; and food
and drink specials during happy hours
• 5.7 million jobs lost nationally
• 16% reduction in pay for American workers
• New normal? – Will consumers continue buying
store brands?
• People are reconsidering what they “need to
have”
• Millennial Generation (recent college grads) -
taking a more cautious approach to spending
• Home equity and inability of consumers toleverage
• Creditors more cautious
IMPACT OF THE RECESSION ON SPENDINGIMPACT OF THE RECESSION ON SPENDING
NATIONAL TRAVEL MARKET TRENDSNATIONAL TRAVEL MARKET TRENDS
• Search engines9 Internet - primary means to gather travel info.
9Online booking
9Want high quality, easily accessible information
• Three generational groups to consider:• Junior Matures (55-64) – more trips, longer stay, more $
• Gen-Xers – (1965 - 1976) – getting larger• Millennials – (1977 - 1995) – ethnically diverse
• Cultural events and festivals
• Outdoor recreation - top activities for U.S. travelers
• One-half of U.S. adults have taken an adventure trip in the
past five years
• Increased international travelers to National Parks –
decreased domestic travelers
NATIONAL TRAVEL MARKET TRENDSNATIONAL TRAVEL MARKET TRENDS
• Long weekend trips – staying closer to home
• B&Bs catering to men
• Wide variety of groups utilizing packaged tours:
• Students
• Baby Boomers
• Independent travelers looking for specific activities
• 72% increase in packaged agricultural tours 2007 to
2008
• Growth in the Chinese visitor market
• Tour operators saw a two-fold increase in Chinese
groups in first half of 2009 as compared to 2008.
Madison County Strategic Economic Development PlanPage 172
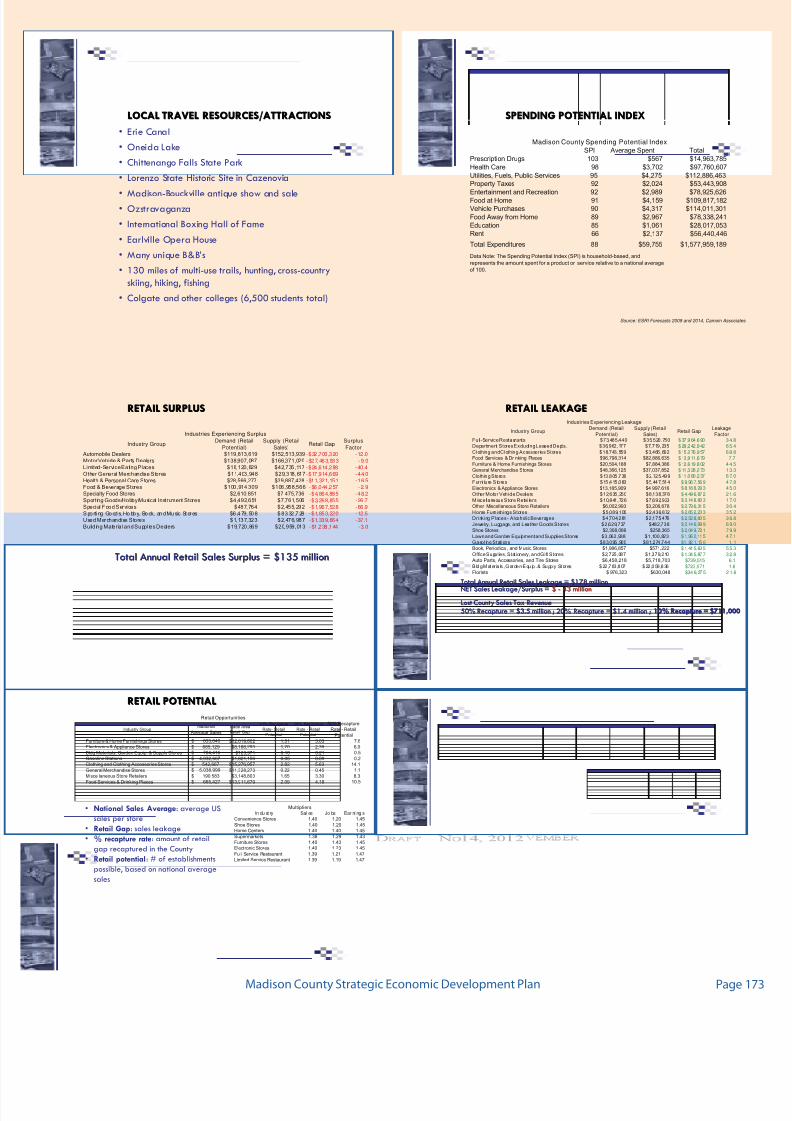
7/29/2019 Madison County's economic development plan, 2013
http://slidepdf.com/reader/full/madison-countys-economic-development-plan-2013 173/192
LOCAL TRAVEL RESOURCES/ATTRACTIONSLOCAL TRAVEL RESOURCES/ATTRACTIONS
• Erie Canal
• Oneida Lake
• Chittenango Falls State Park
• Lorenzo State Historic Site in Cazenovia
• Madison-Bouckville antique show and sale• Ozstravaganza
• International Boxing Hall of Fame
• Earlville Opera House
• Many unique B&B’s
• 130 miles of multi-use trails, hunting, cross-country
skiing, hiking, fishing
• Colgate and other colleges (6,500 students total)
SPENDING POTENTIAL INDEXSPENDING POTENTIAL INDEX
Source: ESRI Forecasts 2009 and 2014, Camoin Associate
SPI Average Spent TotalPrescription Drugs 103 $567 $14,963,785Health Care 98 $3,702 $97,760,607Utilities, Fuels, Public Services 95 $4,275 $112,886,463Property Taxes 92 $2,024 $53,443,908Entertainment and Recreation 92 $2,989 $78,925,626Food at Home 91 $4,159 $109,817,182Vehicle Purchases 90 $4,317 $114,011,301Food Away from Home 89 $2,967 $78,338,241Education 85 $1,061 $28,017,053Rent 66 $2,137 $56,440,446
Total Expenditures 88 $59,755 $1,577,959,189
Madison County Spending Potential Index
Data Note: The Spending Potential Index (SPI) is household-based, and
represents the amount spent for a product or service relative to a national average
of 100.
RETAIL SURPLUSRETAIL SURPLUS
Industry GroupDemand (Retail
Potential)
Supply (Retail
Sales)Retail Gap
Surplus
Factor Automobile Dealers $119,813,619 $152,513,939 -$32,700,320 -12.0Motor Vehicle & Parts Dealers $138,907,087 $166,371,020 -$27,463,933 -9.0Limited-Service Eating Places $18,120,829 $42,735,117 -$24,614,288 -40.4Other General Merchandise Stores $11,403,948 $29,318,617 -$17,914,669 -44.0Health & Personal Care Stores $28,566,277 $39,887,428 -$11,321,151 -16.5Food & Beverage Stores $100,914,309 $106,958,566 -$6,044,257 -2.9Specialty Food Stores $2,610,851 $7,475,736 -$4,864,885 -48.2Sporting Goods/Hobby/Musical Instrument Stores $4,492,651 $7,761,506 -$3,268,855 -26.7Special Food Services $487,764 $2,455,292 -$1,967,528 -66.9S po rti ng Go od s, Ho bb y, Bo ok, an d Mu sic St or es $6 ,4 79, 50 8 $ 8,3 32 ,7 28 -$1,853,220 -12.5Used Merchandise Stores $1,137,323 $2,476,987 -$1,339,664 -37.1Building Material and Supplies Dealers $19,720,869 $20,959,013 -$1,238,144 -3.0
Industries Experiencing Surplus
Total Annual Retail Sales Surplus =Total Annual Retail Sales Surplus = $135 million$135 million
RETAIL LEAKAGERETAIL LEAKAGE
Total Annual Retail Sales Leakage = $178 millionTotal Annual Retail Sales Leakage = $178 million
NET Sales Leakage/Surplus =NET Sales Leakage/Surplus = $$ -- 43 million43 million
Lost County Sales Tax RevenueLost County Sales Tax Revenue50% Recapture = $3.5 million ; 20% Recapture = $1.4 million ;50% Recapture = $3.5 million ; 20% Recapture = $1.4 million ; 10% Recapture = $711,00010% Recapture = $711,000
Industry GroupDemand (Retail
Potential)
Supply (Retail
Sales)Retail Gap
Leakage
FactorFull-Service Restaurants $73,485,440 $35,520,750 $ 37 ,9 64 ,6 90 3 4. 8Department Stores Excluding Leased Depts. $36,962,177 $7,719,235 $ 29 ,2 42 ,9 42 6 5. 4Clothing and Clothing Accessories Stores $18,743,559 $3,466,602 $ 15 ,2 76 ,9 57 6 8. 8Food Services & Drinking Places $96,798,314 $82,886,635 $ 13 ,9 11 ,6 79 7 .7Furniture & Home Furnishings Stores $20,504,188 $7,884,386 $ 12 ,6 19 ,8 02 4 4. 5General Merchandise Stores $48,366,125 $37,037,852 $ 11 ,3 28 ,2 73 1 3. 3Clo th ing Stores $13,805,736 $2,725,499 $ 11 ,0 80 ,2 37 6 7. 0Furni tu re Stores $15,415,083 $5,447,514 $ 9, 96 7, 56 9 4 7. 8Electronics & Appliance Stores $13,185,909 $4,997,616 $ 8, 18 8, 29 3 4 5. 0Other Motor Vehicle Dealers $12,635,250 $8,138,378 $ 4, 49 6, 87 2 2 1. 6Miscellaneous Store Retailers $10,841,726 $7,692,923 $ 3, 14 8, 80 3 1 7. 0Other Miscellaneous Store Retailers $6,002,993 $3,206,678 $ 2, 79 6, 31 5 3 0. 4Home Furnishings Stores $5,089,105 $2,436,872 $ 2, 65 2, 23 3 3 5. 2Drinking Places - Alcoholic Beverages $4,704,281 $2,175,476 $ 2, 52 8, 80 5 3 6. 8Jewelry, Luggage, and Leather Goods Stores $2,629,737 $482,738 $ 2, 14 6, 99 9 6 9. 0Shoe Stores $2,308,086 $258,365 $ 2, 04 9, 72 1 7 9. 9Lawn and Garden Equipment and Supplies Stores $3,062,938 $1,100,823 $ 1, 96 2, 11 5 4 7. 1Gasoline Stations $83,095,900 $81,274,744 $1, 82 1, 15 6 1. 1Book, Periodical, and Music Stores $1,986,857 $571,222 $ 1, 41 5, 63 5 5 5. 3Office Supplies, Stationery, and Gift Stores $2,725,087 $1,379,210 $ 1, 34 5, 87 7 3 2. 8
Auto Parts, Accessories, and Tire Stores $6,458,218 $5,718,703 $739,515 6.1B ld g Mat er ia ls , G arde n E qu ip . & Su pp ly St ores $ 22 ,7 83 ,8 07 $ 22 ,0 59 ,8 36 $723,971 1.6Florists $ 976,323 $630,048 $34 6, 27 5 2 1. 6
Industries Experiencing Leakage
RETAIL POTENTIALRETAIL POTENTIAL
• National Sales Average: average USsales per store
• Retail Gap: sales leakage
• % recapture rate: amount of retail
gap recaptured in the County
• Retail potential: # of establishments
possible, based on national average
sales
In du st ry Sal es Jo bs Ear ni ng sConvenience Stores 1.40 1.20 1.45
Shoe Stores 1.40 1.20 1.45Home Centers 1.40 1.40 1.45
Supermarkets 1.38 1.29 1.43Furniture Stores 1.40 1.43 1.45Electronic Stores 1.40 1.23 1.45
Full Service Restaurant 1.39 1.21 1.47Limited Service Restaurant 1.39 1.19 1.47
Multipliers
Industry GroupNational
Average SalesTrade Area
Retail Gap
10% Recapture
Rate- Retail
Potential
20% Recapture
Rate - Retail
Potential
50% RecaptureRate - Retail
Potential
Furniture & Home Furnishings Stores 833,640$ $12,619,802 1.51 3.03 7.6
Electronics & Appliance Stores 685,129$ $8,188,293 1.20 2.39 6.0
Bldg Materials, Garden Equip. & Supply Stores 704,416$ $723,971 0.10 0.21 0.5
Gasoline Stations 4,032,667$ $1,821,156 0.05 0.09 0.2Clothing and Clothing Accessories Stores 542,667$ $15,276,957 2.82 5.63 14.1
General Merchandise Stores 5,038,999$ $11,328,273 0.22 0.45 1.1
Miscellaneous Store Retailers 190,583$ $3,148,803 1.65 3.30 8.3
Food Services & Drinking Places 665,427$ $13,911,679 2.09 4.18 10.5
Retail Opportunities
Madison County Strategic Economic Development Plan Page

7/29/2019 Madison County's economic development plan, 2013
http://slidepdf.com/reader/full/madison-countys-economic-development-plan-2013 174/192
Efciency, scale and sustainability are key issues
whn considring biomass.
Northrn forst is th largst contiguous forst ast
of th Rockis. Nw paradigm for th forstry industry
that will mak it a mor sustainabl industry.
Community biomass systms prfr papr grad
chips. Powr plants lik th whol tr chips.
Combind hat & powre you produc a lot mor
hat than lctricity. So you dsign a systm for a
building for th hat load and you gt whatvr lc-
tricity you can out of it on top of that.
Cllulosic thanol concpt—lots of invstmnt in
this technology but it’s not very efcient, just a substi-
tut for oil in th ptrolum-basd paradigm.
Community biomass systems are more efcient
because direct heat with the wood is more efcient
than making liquid ful and bcaus it’s usd whr it
coms from so you don’t los th nrgy transportingit.
Capital intnsiv—wood boilrs ar a lot mor
xpnsiv than oil—almost 7 tims mor xpnsiv?
Industrial parks hav to hav watr & swr—what
about a biomass hating plant whr at is anothr
public utility so no on has to produc thir own
on-sit.
Taking hat units out of rsidncs and businsss
would improv indoor air quality and rduc insuranc
costs.
Within a 25 mil radius th nrgy loss from trans-
portation is low nough to kp it sustainabl.
Th soil conditions hav to b abl to rproduc
th carbon growth to match what you took out. So you
hav to b carful to manag th forst wll to main-
tain or improv soil quality.
Valu of th low-valu wood can gt landownrs
to go in and do th thinning that othrwis would b a
sunk cost into th saw log, which is not worth a lot in a
down housing markt.
Boimass Energy Resources
INDUSTRY EXPERT ROUNDTABLE
December 2, 2009
Chris Recchia
Biomass Energy Resource Center43 State Street, Suite 1
PO Box 1611
Montpelier, Vermont 05601-1611(802) 223-7770
biomasscenter.org
Madison County Economic Development StrategyPage 174

7/29/2019 Madison County's economic development plan, 2013
http://slidepdf.com/reader/full/madison-countys-economic-development-plan-2013 175/192
BIOMASS ENERGY:Efciency, Scale, and Sustainability
P O B
o x 1 6 1 1 ,
M o
n t p e l i e r , V e r m o n t 0 5 6 0 1 • p h 8 0 2 - 2 2 3 - 7 7 7 0 • F a x 8 0 2 - 2 2 3 - 7 7 7 2 • w w w . b
i o m a s s c e n t e r . o r g
Energy supply and use is a national priority and a
major ocus o national, state, and local policy mak-
ers across the United States. The impacts o climate
change and the need to increase energy eciency,
reduce reliance on oreign oil, and address related
international security threats are some o the issues
driving the need or a new national energy policy and
practice.
Biomass energy, harvested rom the nation’s landsand orests, has the potential to provide an important
source o renewable, sustainable energy or the coun-
try. To develop this important energy sector success-
ully, however, public policy can play a critical role in
addressing issues o scale, eciency, biomass supply,
environmental impacts, local economics, harvest-
ing capability, and investment and nancing. Using
biomass or energy in ways that sustain the health o
the nation’s lands and orests and creates robust and
resilient energy economies depends on several critical
actors:
Efciency. Used or heat or heat-led combined heat
and power (CHP), biomass energy is approximately
75-80 percent ecient, while generation o electric-
ity is only 20-25 percent ecient, and conversion to
liquid uels or transportation applications are even
less ecient overall. This is true regardless o the
type o uel used—be it biomass, coal, or oil—but
is a critically important actor when considering the
sustainability o using biomass or uel. Neverthe-
less, to date, national renewable energy policies have
ignored thermal energy and ocused on directing
biomass energy into electric generation and trans-portation uels, a direction that has the potential to
overtax the energy potential o our country’s wood
resource, while diminishing its potential benet, and
raising issues o sustainable supply.
Scale. Biomass is a diuse resource, growing over
dispersed areas. Use in large central acilities requires
consolidation and transportation o uel over greater
distances that can reduce the overall eciency o the
resource. The most energy ecient use or biomass
in general is thermal energy at the community scale,
where local wood resources are produced and used
to provide local energy, ueling the local economy,
and at heat-led CHP operations o a scale that can be
accommodated by the resource. Directing biomass
into appropriately scaled applications such as heat (or
CHP) or schools, hospitals, oce buildings, college
campuses, and district heating systems is essential orcreating a wood-energy economy that is fexible and
resilient over time. Biomass also has the potential or
high eciency use at industrial applications that are
large heat and electricity users. Producing biomass
through an array o appropriately scaled and local
chip and pellet plants is also a critical component
o a wood-energy supply chain and a dynamic and
resilient local wood-energy economy.
Sustainability. Sustainability o the biomass re-
source depends on wood and agricultural supplies on
a macro level as well as harvesting methods and inra-
structure. It also must be advanced in the context o air quality and climate change objectives:
• Wood Supply. Sustainable development o the
country’s biomass resource or energy depends
on understanding the capacity o our orests and
agricultural lands to supply biomass while prevent-
ing over-harvesting and associated ecological and
economic consequences. It is essential to provide
an accurate and ongoing assessment o the amount
o low-quality woody biomass available rom or-
ests or energy on a sustainable basis that supports
long-term orest health, soil productivity, waterquality, wildlie habitat, and biodiversity.
• Sustainable Harvesting. In many instances,
previously developed best management practices
did not anticipate the increased removal o bio-
mass associated with the expanded biomass energy
industry and oer mixed guidance on the amount
o removal that is consistent with long- term orest
health and productivity. What are the long-term
Madison County Strategic Economic Development Plan Page

7/29/2019 Madison County's economic development plan, 2013
http://slidepdf.com/reader/full/madison-countys-economic-development-plan-2013 176/192
nutrient cycle and soil productivity implications o
expanded biomass harvesting? What types o orest and
agricultural “biomass” will emerging markets preer?
Will biomass energy markets compete or traditional
timber products or will they target previously un-
merchantable orest biomass such as tops, branches,
and even stumps? A review and update o harvestingstandards is important to ensure sufcient post-harvest
retention o fne and course crop and woody debris,
standing and down dead wood or wildlie, biodiversity,
and site productivity. In addition to harvesting stan-
dards, biomass uel procurement guidelines or public
and private acilities are important to ensure a sustain-
able supply chain.
• Harvesting Inrastructure and Capacity. While
there are concerns about the ecological sustainability
o biomass harvesting, there are also concerns about
the sustainability o the harvesting inrastructure and
workorce that will be needed to reliably supply wood
uels to markets. Strong, reliable, and local markets or
low-grade wood such as wood uel are essential to help
keep a reliable supply chain intact.
• Emissions. Energy derived rom biomass energy must
minimize emissions and meet or surpass stringent public
health and air-quality standards. Biomass energy projects
should implement efcient combustion technologies
and best management practices or emission control
technologies, uel quality, and operating conditions.
• Climate Change. Use o biomass or energy-efcient
and appropriately scaled applications has tremendous
potential to displace ossil uels and, over the long
term, lower atmospheric CO2
emissions. Biomass
energy used in this manner is a “low-carbon uel,”
and, integrated with the sustainable uel supply, has the
potential to be a net carbon sequestering option, even
when considering the ossil uels used in production
and transportation o wood uel and agricultural pro-
duction. The degree to which biomass energy systems
can reduce carbon emissions compared to ossil uels
is directly related to establishment and management
o harvesting regimes, orest types, uel transport, and
efciency. National carbon sequestration and reduction
policies such as carbon cap and trade regulations and
voluntary carbon standards will also have an impact on
orest management and agricultural decisions regard-
ing carbon storage, orest adaptation, production o
biomass or energy, and harvesting o traditional wood
products. Policies must be put in place that optimize
carbon storage, adaptation potential, biomass used or
energy, and the harvest o traditional products. © Copyright 2009 Biomass Energy Resource Center. All rights reserved.
Public Policy Recommendations or
Efcient Biomass Energy
1. Develop a National Thermal Energy Policy
that includes the ollowing elements:
- A Renewable Thermal Standard (comparableto the existing Renewable Fuels Standard and
proposed Renewable Electricity Standard)
- National and state carbon policies and green-
house gas emissions programs that support the
most efcient thermal uses o biomass
- Federal and state incentives, grants, and loans
to advance the utilization o high efciency
biomass thermal systems
- Renewable Portolio Standards that include
thermal energy, provision o renewable energy
credits or thermal applications and that pro-mote efcient use o biomass
2. Fund and conduct accurate and ongoing assess-
ments o sustainable biomass energy supply
3. Support biomass harvesting standards, sustainable
orest management, and procurement guidelines
to ensure a sustainable supply chain or timber and
other biomass harvesting activities
4. Support harvesting and management inrastruc-
ture—including policies that encourage and
promote the long-term economic viability o
the supply chain to ensure orestry and logging
capacity—and sound land stewardship and man-
agement practices necessary to ensure low-grade
wood resource availability or sustained biomass
energy use over the long term
5. Establish consistent ederal and state air emission
standards and regulations or biomass energy to
minimize emissions and meet stringent public
health and air-quality standards
6. To support the ability o biomass energy to help
reduce climate change, support orest conser-
vation eorts, provide oset credits and other
incentives or increased carbon sequestration and
storage, and address orest adaptation due to
changing climate
Adopted by the BERC board of directors on August 14, 2009.
Madison County Strategic Economic Development PlanPage 176

7/29/2019 Madison County's economic development plan, 2013
http://slidepdf.com/reader/full/madison-countys-economic-development-plan-2013 177/192
BIOMASS cOMMunIty DIStRIct
EnERGy SyStEMS
WhAt IS DIStRIct EnERGy?
District energy systems use one or more central plants to provide ther-
mal energy to multiple buildings. This approach replaces the need or
individual, building-based boilers, urnaces, and cooling systems.
Underground pipelines rom the heating (or cooling) plant to each o
the connected buildings distribute thermal energy in the orm o hot
water, steam, or chilled water. Energy is then extracted at the build-
ings and the water is brought back to the plant, through return pipes,
to be heated or cooled again.
DIStRIct EnERGy In hIStORy
The concept o district energy dates back to ancient Rome, where hot
water was used to heat public baths and other buildings. Urban steam
systems frst became common about 100 years ago (the frst North
American system was built in 1877 in Lockport, New York), and
modern hot water systems have been used extensively in Europe since
the 1970s. Today, as modern district energy rapidly gains acceptance,
systems are being built in increasing numbers in cities and communi-
ties across North America.
ApplIcAtIOnS fOR DIStRIct EnERGy
District heating systems can provide space heating and domestic hot
water or large ofce buildings, schools, college campuses, hotels,
hospitals, apartment complexes, and other municipal, institutional, andcommercial buildings. Systems can also be used to heat neighborhoods
and single-amily residences.
Municipalities can incorporate district energy into the inrastructure
o their downtown business districts or encourage its use in such new
developments as ofce building complexes and industrial parks. When
local biomass uels, such as woodchips,
are used instead o oil or gas, the benefts
o renewable energy can be brought to
many buildings.
cOMBInInG hEAt & pOWER
District energy plants can be designed to
produce not only heating and cooling,but also electrical power. This is called
cogeneration or combined heat and
power (CHP). CHP plants are able to get
more usable energy out o the input uel
than one producing electricity only.
Israio ores o
prie Edward Isad
Dearme o Eoom,
Deveome & torism.
ADVAntAGES Of
DIStRIct EnERGy
A district energy system—particularly one
that increases the use o indigenous bio-
mass—has the ollowing advantages or
both system customers and the surround-
ing community:
low, prediabe Eerg coss
Higher uel usage provides access to the
lower costs associated with bulk purchas-ing. The use o locally grown biomass as
a portion o the uel mix urther enhances
the cost stabilizing beneft o district
energy.
The price o wood uel is not linked to
world energy markets or unstable regions,
but instead determined by local economic
orces. For this reason, biomass systems
do not experience the price instability o
conventional uel systems.
fe-te fexibii
Because a central heating plant can haveboilers that burn dierent uels, the op-
tion exists to use whichever uel is the
most economical at any given time.
over
p O B o x 1 6 1 1 , M o n t p e l i e r , V e r m o n t 0 5 6 0
1 • p h 8 0 2 - 2 2 3 - 7 7 7 0 • f a x 8 0 2 - 2 2 3 - 7 7 7 2 • w w w . b i o m a
s s c e n t e r . o r g
Madison County Strategic Economic Development Plan Page

7/29/2019 Madison County's economic development plan, 2013
http://slidepdf.com/reader/full/madison-countys-economic-development-plan-2013 178/192
Better Air Qaity
Air quality improves—as does com-
munity livability—when emissions
rom a single, well-managed plant
replace uncontrolled stack emissions
rom boiler plants in many individual
buildings. The result is magnied
when district energy systems, as they oten do, replace multiple systems
that use conventional ossil uels.
I the central system uses wood
uel, the emissions o sulur dioxide
(which contribute heavily to acid
rain) will decrease, while emissions
o particulates and certain toxic air
contaminants will increase. The
emissions increases, however, do
not result in a higher concentration
in the air because o changes in the
location o the emissions and the
improved dispersion o pollutants
resulting rom a single tall stack.
Yet another advantage in improv-
ing air quality with district heating
is the ability to install best available
technology emissions control equip-
ment, which may not be aordable
in individual building heating plants.
More loa Jobs
Conventional energy systems require
labor in uel extraction, processing,
delivery, operation, and maintenanceas well as in system construction
and installation. Fossil uel supply is
based on energy resources outside
the community, thus, all jobs associ-
ated with extraction and processing
are outside the local and regional
economies. By contrast, jobs and
most o the raw materials associated
with wood uel extraction, reoresta-
tion, and uel transport are within
the local and regional economies.
Doars Remain in the loa
Eonomy
Unlike ossil uels, which come rom
outside the northern New England
region, wood uel is a local and
regional resource. The businesses as-
sociated with wood supply (logging
operations, trucking companies, and
sawmills) tend to be locally owned,
so that prots are retained in the
regional economy. These activities
contribute to the state and local tax
base. Conversely, the use o ossil u-
els creates a net economic drain on a
community and state. The Vermont
Job Gap Study ound that Vermont-
ers spend more than $1 billion annu-
ally or uel and energy imported
rom outside the state.
Revitaized commnitiesDistrict energy inrastructure and
stable rates improve a community’s
business climate, make local busi-
nesses more competitive, help to
revitalize downtowns and urban core
areas so they can better compete
with suburban sprawl, and, using
biomass as the uel source, help
build a sustainable inrastructure.
Reiabe Eqiment
District energy systems have an un-
paralleled record o reliable service.They achieve this by well-managed
central plant operation, by using
multiple uels, by having backup
boilers in one or more locations,
and by having standby power at the
central plant.
use of a pentif & Renewabe
Resore
Biomass is a renewable resource that
can continue to replenish itsel when
managed and harvested sustainably.
Wood-red heating systems providea market or lower-grade wood not
suitable or urniture or other high-
prot products. These markets can
be especially critical or restoring
commercial and biological quality
to harvested orests. In addition,
the use o waste wood or energy
can reduce the need or and costs o
disposal.
Reded Environmenta Risks
District energy systems can help
to mitigate environmental risks by
consolidating uel storage to one or
a very ew locations compared to
numerous onsite storage tanks that
serve individual buildings. Conven-
tional onsite uel storage includesunderground and aboveground
storage tanks. Aboveground tanks
can pose re hazards as well as the
risk o dislodging in the event o a
food. Failing underground tanks
can pose a threat to ground and
surace waters.
A Meaning Way to Address
Goba cimate change
Carbon dioxide (CO2) is the major
greenhouse gas implicated in global
warming. When ossil uels areburned, carbon that was sequestered
underground (as oil, gas, or coal)
is converted to CO2
and released
into the atmosphere. While CO2
is a
major component o the combustion
emissions o both ossil and biomass
uels, burning biomass or energy
adds no net CO2
to the atmosphere.
For biomass energy to be an eec-
tive climate change mitigation strat-
egy, however, the biomass must be
harvested in a ashion that sustainsthe orest resource and increases its
vitality and productivity over time.
I a orest is clear cut and does not
regenerate, there will be no trees to
sequester, and carbon and CO2
levels
in the atmosphere will increase. A
study by the Oak Ridge National
Laboratory ound that “using part o
the orest harvest residue or district
heating in Vermont has a positive
impact on reducing the amount
o carbon discharged to the atmo-
sphere.”
Printed February 2008
© Copyright 2007 Biomass Energy Resource Center. All rights reserved.
Madison County Strategic Economic Development PlanPage 178

7/29/2019 Madison County's economic development plan, 2013
http://slidepdf.com/reader/full/madison-countys-economic-development-plan-2013 179/192
Hybrid Poplars SwitchgrassReed Canary Grass
WillowsHybrid PoplarsSilver MapleBlack Locust
Hybrid PoplarsEucapyptus
Eucapyptus
MiscanthusSwitchgrassHybrid PoplarsSilver MapleReed Canary GrassBlack LocustSorgum
SwitchgrassPoplarTropical GrassesSycamoreSweetgumSorgum
Black LocustMiscanthus
Eucapyptus
Madison County Strategic Economic Development Plan Page

7/29/2019 Madison County's economic development plan, 2013
http://slidepdf.com/reader/full/madison-countys-economic-development-plan-2013 180/192
This valuation xtnds byond th County to th
rgion and is basd on information availabl on-lin
and through xisting contacts. Most sit consultants
would look at data on th MSA lvl and would also
bnchmark that rgion to th Stat and th U.S. as a
whol—this typ of comparison is ky for thm.
Madison County Employment
Distribuon (jobs located in
Madison County)
Surprisd by th high concntration in ducation
srvics.
Administrativ and Wast Managmnt and Trans-
portation and Warhousing ar much lowr than U.S.
prcntag.
Burau of Labor Statistics is not providing data for
a numbr of your manufacturing subsctors du to a
small number of rms in each subsector (for conden-
tiality) and this hurts you. You should try to ll thatinformation gap and put th data on your wbsit so all
your sctors ar rprsntd and sit consultants can
s th whol pictur.
Changes 2003–2008 in Madison
County Employment
For All Manufacturing you grw slightly whil th
U.S. dclind.
The decline in professional, scientic and techni-
cal srvics is troubling. You should s growth du to
th high concntration of post-scondary ducational
institutions hr.
Commnt from th audinc that th ducational
srvics numbrs can’t b right—if thy ar not, you
should b awar of this and rport th corrct numbrs
on your own wbsit, mak it clar you hav lookd
into and can provid accurat data for sit consultant to
compar you to U.S. and stat.
Assets
Ovrall, you don’t hav rally high incoms but you
do hav high labor forc participation. This is a good
sign of a hard-working labor forc.
Elctric rats—sit consultants us th Edison Elc-
trical Institut book. For this ara, thy do not sm to
rport on dlivry chargs. Again, you should clarify
this in the data you present on your own website to ll
out th pictur for th sit consultants.
Com m uni ty Eva luat ion and Com m uni ty Evaluat ion and
Report Card Report Card
INDUSTRY EXPERT ROUNDTABLE
William A Fredrick, PresidentThe Wadley-Donovan Group/Wadley-Donovan GrowthTech
150 Morris Avenue, Suite 203Springfield, New Jersey 07081-1315
(973) 379-7700 x102
December 2, 2009
wdgtech.com
Madison County Economic Development StrategyPage 180

7/29/2019 Madison County's economic development plan, 2013
http://slidepdf.com/reader/full/madison-countys-economic-development-plan-2013 181/192
Concrns ovr municipal powr—companis want
to know what thir capacity is, what thir spiks ar,
what th rliability is. You would drill down to this
aftr th initial scrning is complt for thos loca-
tions that made the rst cut.
Discussion of website and other issues related to Assets
DO NOT provid links to othr wbsits for th
user to nd the data they are looking for. You want
all info thy nd on your own sit so you can kp
them there and not nd a better location in your area
by looking at other websites. Often times it is difcult
for the user to then sift through another site to nd the
data.
Your site should have a Community Prole to dis-
play dmographics. You should hav a good mnu on
th hom pag with 7 to 10 mnu itms (sits, utilitis,
incentives, community prole). You don’t want the site
consultant to have to click too many times to nd what
thy ar looking for.
Re wood biomass for hate if you had an industrial
park whr that was providd and thr is no complica-
tion or risk in using it that would b th idal situa-
tion. Most companis ar not going to worry about
altrnativ nrgy—thy typically hav a prtty tight
turnaround to gt projct up and running. But if it is
alrady installd and will not impact thir tim fram,
thn that would mak it asir for thm to us it.
Divrsitye this could pos a problm for you. Many
companis ar snsitiv to divrsity and hav minor-
ity mploys thy would hav to transfr. This might
not b an idal location from thir point of viw du tolack of divrsity in th local population bas.
Mdian age skws oldr and this affcts futur
labor availability. Important to gt young familis
back, spcially collg-ducatd profssionals.
Couldn’t nd any info on technical training pro-
grams in th County so that nds to b communicatd
on your wbsit as wll if it’s somthing you hav.
Would b grat to show th tchnical training programs
on a map with your labor shds.
Also rcommnds putting writtn tstimonials from
local mployrs on your sit (no vido clips).
You hav high manufacturing mploymnt concn-tration and stabl pay, which mans that you prob-
ably hav a lot of popl about to rtir. Ar xisting
mployrs going to los thir high-skilld workrs?
Nd to addrss this qustion bcaus sit consultants
will s that.
You nd to hav ONE conomic dvlopmnt
wbsit for th County, linkd to a rgional sit. If
citis, towns and villags want to hav thir sits as
links on th County sit, that’s ok. In many cass, it’s
bst to avoid using th Chambr of Commrc as your
main ED sit bcaus thy oftn discuss issus that you
might not want th sit consultant to s up front.
Us maps, provid sit data. Considr a company
lik Location On to provid sarchabl sit databas.
Madison County Economic Development Strategy Page

7/29/2019 Madison County's economic development plan, 2013
http://slidepdf.com/reader/full/madison-countys-economic-development-plan-2013 182/192
3
Assets
• Excellent market access
• Stable county population
– County growth (0.5%) higher than the MSA
• County has higher ratio of 18-34 agegroup than U.S., NY
– 2009, 2014
Median h ousehold incom e above U.S., MSA medians
– Cou nt y g ro w th hi gh er t han U.S., Sta te , MSA 20 09- 2014
Count y income distribution is in the midd le, not b i-modal
Educational attainment levels
– Hig he r t han U.S. aver age in 12- 15 y ears o f ed uca t ion
– Hig he r t han U.S. aver age in 16+ years of ed uc at io n
Unemploym ent rate is higher than n ormal, but below
U.S., NY, MSA averag es
• Labor participation slightly above U.S. in county,
• Growing labor force in county and labor sheds
• Expanding employment and establishments among
Madison employers – Greatest numeric gains in education
– Slight manufacturing had employment gains, vs. U.S., NY andMSA declines
– Higher than MSA average
• Good quality of life
– Low to moderate housing costs
– Low crime rate
– Diverse recreational and sports
– Cultural events
– Healthcare
• Five existing, one proposed with EZ status business parks
– Some rail
– Fiber
– One airpark
– Zoned
– Utilities
• Two non-EZ parks
• Low electric rates
• Very good to excellent incentives in Empire Zones
• Competitive regulatory environment for the Northeast
• Long manufacturing history, familiarity
• Base of long-term manufacturing companies
• Three 4-year, post-secondary institutions in the county,
nine in the MSA
– Colgate University
– Syracuse university
– Degree offerings in engineering and engineering tech, business,
IT, sciences
• Nine other post-secondary institutions
• Syracuse Hancock Airport• CSX rail service
• Interstate service
Madison County Strategic Economic Development PlanPage 182
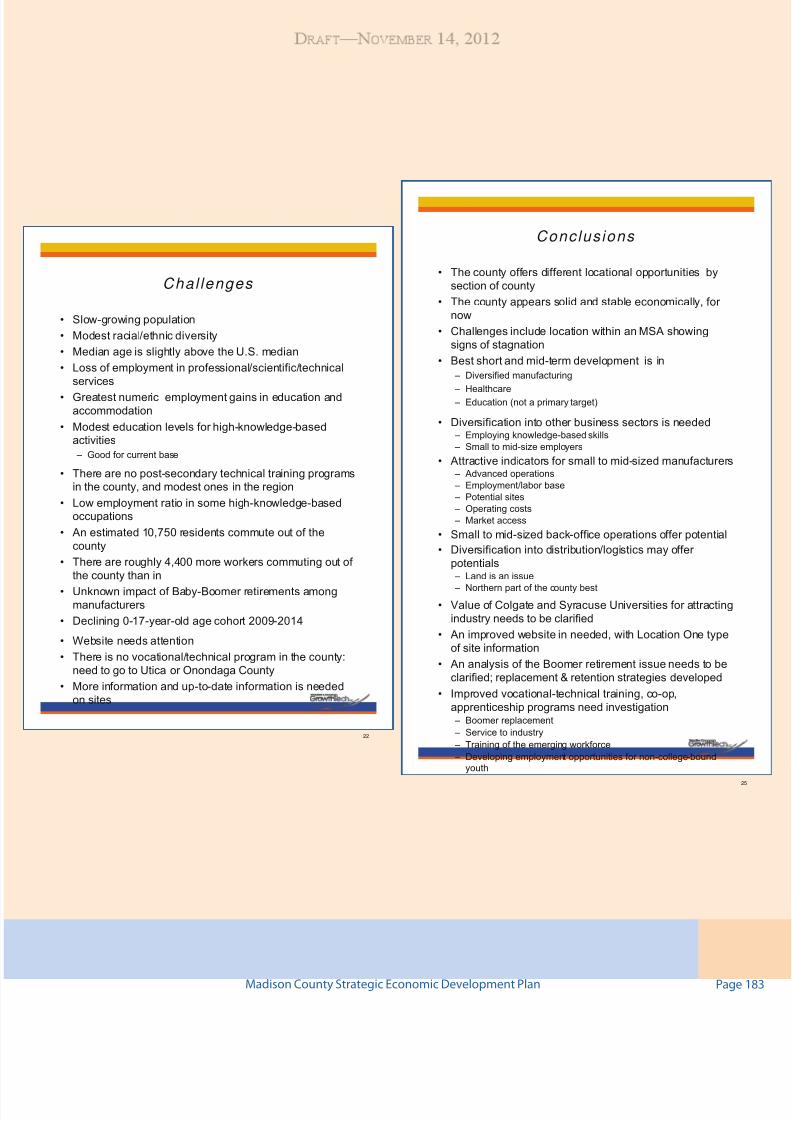
7/29/2019 Madison County's economic development plan, 2013
http://slidepdf.com/reader/full/madison-countys-economic-development-plan-2013 183/192
Chal lenges
• Slow-growing population
• Modest racial/ethnic diversity
• Median age is slightly above the U.S. median
• Loss of employment in professional/scientific/technical
services
• Greatest numeric employment gains in education and
accommodation
• Modest education levels for high-knowledge-basedactivities
– Good for current base
• There are no post-secondary technical training programsin the county, and modest ones in the region
• Low employment ratio in some high-knowledge-basedoccupations
• An estimated 10,750 residents commute out of the
county
• There are roughly 4,400 more workers commuting out of
the county than in
• Unknown impact of Baby-Boomer retirements amongmanufacturers
• Declining 0-17-year-old age cohort 2009-2014
• Website needs attention
• There is no vocational/technical program in the county:
need to go to Utica or Onondaga County
• More information and up-to-date information is needed
on sites
22
Conclusions
• The county offers different locational opportunities by
section of county
• The county appears solid and stable economically, for
now
• Challenges include location within an MSA showing
signs of stagnation
• Best short and mid-term development is in
– Diversified manufacturing
– Healthcare – Education (not a primary target)
• Diversification into other business sectors is needed – Employing knowledge-based skills
– Small to mid-size employers
• Attractive indicators for small to mid-sized manufacturers – Advanced operations
– Employment/labor base
– Potential sites
– Operating costs
– Market access
• Small to mid-sized back-office operations offer potential
• Diversification into distribution/logistics may offer
potentials – Land is an issue
– Northern part of the county best
• Value of Colgate and Syracuse Universities for attracting
industry needs to be clarified
• An improved website in needed, with Location One type
of site information
• An analysis of the Boomer retirement issue needs to be
clarified; replacement & retention strategies developed
• Improved vocational-technical training, co-op,
apprenticeship programs need investigation – Boomer replacement
– Service to industry
– Training of the emerging workforce
– Developing employment opportunities for non-college-bound
youth
Madison County Strategic Economic Development Plan Page

7/29/2019 Madison County's economic development plan, 2013
http://slidepdf.com/reader/full/madison-countys-economic-development-plan-2013 184/192
As a uniqu conomic dvlopmnt tool, th Main
Strt Four-Point Approach® is th foundation
for local initiativs to rvitaliz thir districts
by lvraging local assts-from cultural or
architctural hritag to local ntrpriss and
community prid.
Th four points of th Main Strt approach work
togthr to build a sustainabl and complt commu-
nity rvitalization ffort.
Also rade Th Eight Guiding Principls
Organizaon
Involvs gtting vryon working towards th
sam goal and assmbling th appropriat human
and nancial resources to implement a Main Street
rvitalization program. A govrning board and standing
committs mak up th fundamntal organizational
structur of th voluntr-drivn program. Voluntrsar coordinatd and supportd by a paid program dirc-
tor as wll. This structur not only divids th work-
load and clarly dlinats rsponsibilitis, but also
builds consnsus and coopration among th various
stakholdrs.
Promoon
Sll a positiv imag of th commrcial district and
ncourags consumrs and invstors to liv, work,
shop, play and invst in th Main Strt district. By
markting a district’s uniqu charactristics to rsi-
dnts, invstors, businss ownrs, and visitors, an
ffctiv promotional stratgy forcs a positiv imag
through advrtising, rtail promotional activity, spcial
vnts, and markting campaigns carrid out by local
voluntrs. Ths activitis improv consumr and
investor condence in the district and encourage com-
mrcial activity and invstmnt in th ara.
Design
Mans gtting Main Strt into top physical shap.
Capitalizing on its bst assts—such as historical
buildings and pdstrian-orintd strts—is just part
of th story. An inviting atmosphr, cratd through
attractiv window displays, parking aras, building
improvmnts, strt furnitur, signs, sidwalks, strt
lights, and landscaping, convys a positiv visual
mssag about th commrcial district and what it
has to offr. Dsign activitis also includ instilling
good maintnanc practics in th commrcial dis-
trict, nhancing th physical apparanc of th com-
mrcial district by rhabilitating historic buildings,
The Main Street Four-Point Approach®
INDUSTRY EXPERT ROUNDTABLE
January 28, 2010
Theresa Lynch, Senior Program OfficerNational Trust Main Street Center
1785 Massachusetts Avenue, NW
Washington, DC 20036-6000(702) 588-6000
www.mainstreet.org
Madison County Economic Development StrategyPage 184

7/29/2019 Madison County's economic development plan, 2013
http://slidepdf.com/reader/full/madison-countys-economic-development-plan-2013 185/192
ncouraging appropriat nw construction, dvloping
snsitiv dsign managmnt systms, and long-trm
planning.
Economic Restructuring
Strngthns a community’s xisting conomic
assts whil xpanding and divrsifying its conomic
bas. Th Main Strt program hlps sharpn th com-
ptitivnss of xisting businss ownrs and rcruits
compatibl nw businsss and nw conomic uss
to build a commrcial district that rsponds to today’s
consumrs’ nds. Convrting unusd or undrusd
commrcial spac into conomically productiv prop-
erty also helps boost the protability of the district.
The Eight PrinciplesTh National Trust Main Strt Cntr’s xpri-
nc in hlping communitis bring thir commrcial
corridors back to lif has shown tim and again that th
Main Strt Four-Point Approach succds. That suc-
css is guidd by th following ight principls, which
st th Main Strt Mthodology apart from othr
rdvlopmnt stratgis. For a Main Strt program
to b succssful, it must whol-hartdly mbrac th
following tim-tstd Eight Principls.
●● Comprehensive: No singl focus—lavish public
improvmnts, nam-brand businss rcruitmnt,
or ndlss promotional vnts—can rvitaliz
Main Strt. For succssful, sustainabl, long-trm
rvitalization, a comprhnsiv approach, includ-
ing activity in ach of Main Strt’s Four Point, is
ssntial.
●● Incrementale Baby Stps com bfor walking.
Succssful rvitalization programs bgin with
basic, simpl activitis that dmonstrat that “nw
things ar happning” in th commrcial district.
As public condence in the Main Street district
grows and participants’ undrstanding of th
rvitalization procss bcoms mor sophisticatd,
Main Strt is abl to tackl incrasingly complx
problms and mor ambitious projcts. This incr-
mntal chang lads to much longr-lasting and
dramatic positiv chang in th Main Strt ara.
●● Self-helpe No on ls will sav your Main Strt.
Local lndrs must hav th will and dsir to
mobiliz local rsourcs and talnt. That man
convincing rsidnts and businss ownrs of th
rwards thy’ll rap by invsting tim and mony
in Main Strt—th hart of thir community.
Only local ladrship can produc long-trm suc-
css by fostring and dmonstrating community
involvmnt and commitmnt to th rvitalization
ffort.
●● Partnershipse Both th public and privat sctors
hav a vital intrst in th district and must work
togthr to achiv common goals of Main Strt’srvitalization. Each sctor has a rol to play
and ach must undrstand th othr’s strngths
and limitations in ordr to forg an ffctiv
partnrship.
●● Identifying and capitalizing on existing assetse
Businss districts must capitaliz on th assts
that mak thm uniqu. Evry district has uniqu
qualitis lik distinctiv buildings and human
scal that giv popl a sns of blonging. Thslocal assts must srv as th foundation for all
aspcts of th rvitalization program.
●● Qualitye Emphasiz quality in vry aspct of th
rvitalization program. This applis to all l-
mnts of th procss—from storfront dsigns to
promotional campaigns to ducational programs.
Shostring budgts and “cut and past” fforts
rinforc a ngativ imag of th commrcial
district. Instad, concntrat on quality projctsovr quantity.
●● Changee Skptics turn into blivrs and attituds
on Main Street turn around. At rst, almost no
on blivs Main Strt can rally turn around.
Changs in attitud and practic ar slow but
denite—public support for change will build as
Madison County Economic Development Strategy Page

7/29/2019 Madison County's economic development plan, 2013
http://slidepdf.com/reader/full/madison-countys-economic-development-plan-2013 186/192
th Main Strt program grows and consistntly
mts its goals. Chang also mans ngaging in
bttr businss practics, altring ways of think-
ing, and improving th physical apparanc of th
commrcial districts. A carfully plannd Main
Strt program will hlp shift public prcptions
and practics to support and sustain th rvitaliza-
tion procss.
●● Implementatione To succd, Main Strt must
show visibl rsults that can only com from
complting projcts. Frqunt, visibl changs
ar a rmindr that th rvitalization ffort is
undr way and succding. Small projcts at th
bginning of th program pav th way for largr
ons as th rvitalization ffort maturs, and that
constant revitalization activity creates condencein th Main Strt program and vr-gratr lvls
of participation.
Madison County Economic Development StrategyPage 186

7/29/2019 Madison County's economic development plan, 2013
http://slidepdf.com/reader/full/madison-countys-economic-development-plan-2013 187/192
Naonal Main StreetCommunity Criteria
• Broad-based public and private support• Vision and mission statements• Comprehensive work plan• Historic preservaon ethic• Acve board and commiees• Adequate operang budget
• Paid, professional program director• On-going training for sta & volunteers• Reporng of key stascs• Current member of Naonal Main Street
Network
Main Street’s Eight Principles
• Comprehensive
• Incremental
• Community-driven
• Public-Private eort
• Builds on exisng assets
• Quality
• Change
• Implementaon-Oriented
Main Street’s Four Points
• Organizaon
• Design
• Promoon
• Economic Restructuring
Main Street’s Results
• $48.8 billion in physical improvements
• 87,850 new businesses (net)
• 391,050 new jobs (net)
• 206,600 building rehabilitaon projects
• $25 to $1.00 reinvestment rao
• (through December 31, 2008—based on
more than 2,200 communies)
Madison County Strategic Economic Development Plan Page

7/29/2019 Madison County's economic development plan, 2013
http://slidepdf.com/reader/full/madison-countys-economic-development-plan-2013 188/192
Strategic Value of Locaon
● As a company volvs through its lif cycls,
location oftn plays a critical rol in gaining
accss to crtain rsourcs and markt opportu-
nitis. Basd on ovr forty yars of xprinc
working with companis, Moran, Stahl & Boyr’s
(MS&B) has hlpd many clints us location to
thir advantag in a varity of ways includinge
● Attracting and maintaining top talnt.
● Gain accss to mrging markts.
● Rduc oprating risks and costs.
● Improv product dvlopmnt.
● Bttr srv intrnal and xtrnal customrs.
● Enhanc thir imag in th marktplac.
Sinc no two companis ar xactly alik, thr is
no singl “idal location” that mts vryon’s nds.
Location succss factors chang ovr ach lif cycl
stage of the company and are inuenced by the type
of opration and industry it is involvd in. Variancs
could includ diffrnt nds for labor, industry prs-
nc, gographic locations, and accss to businss
partnrs such as univrsitis, allianc companis andstratgic srvic providrs.
In the gure noted below, the evolution of a typical
company is chartd out. In Stag 1, th young com-
pany is locatd whr it was foundd ithr in prox-
imity to th univrsity from which it gains its R&D
support from, nar a company it has spun-off from, or
simply in a plac favord by th company’s foundr.
If th company is fundd by an invstmnt group or is
acquired by a larger rm, it may be required to relo-cat. By Stag 2 th company has grown into a slf-
sufcient entity with most of the business still found in
on location.
Further growth into Stage 3 reects a major corpo-
ration that bgins to rdploy individual functions to
locations that ar bttr suitd for thir uniqu nds
—hadquartrs to citis that hav th rsourcs attract
top talent and access more markets; back ofces and
manufacturing to low cost aras; and R&D narr to
tchnology partnrs. Stag 4 is similar to Stag 3 buton a largr scal.
Locaon Requirements by Operaon
Each type of operation has specic resources and
situation rquirmnts to mak it succssful. A sum-
mary of location critria is outlind blow and illus-
trats th similaritis and diffrncs found among
various businss functions.
Whn a company sks to plac mor than on typ
of opration in th sam location, it is important to
rviw how wll th local rsourcs and situation mt
the needs of each specic operation.
Business Location Strategies
INDUSTRY EXPERT ROUNDTABLE
December 2, 2009
John M. Rhodes, Senior PrincipalMoran, Stahl & Boyer, LLC
8374 Market Street - 422Lakewood Ranch, Florida 34211
(941) 755-0074
Moran, Stahl & Bo yerBusiness Location and EconomicDevelopment Consultants
msbconsulting.com
Madison County Economic Development StrategyPage 188

7/29/2019 Madison County's economic development plan, 2013
http://slidepdf.com/reader/full/madison-countys-economic-development-plan-2013 189/192
Stage 1:i
Stage 2: Stage 3:i
Stage 4:l i
Figure 1 – Evolution of Company Structure and Location Deployment
Business Team Headquarters(Executive and
Functional Staff)
R&D
Back Office
Possible Outsourceof certain functionsand production
capability
i(Single Location) (Single Location)
i(Multiple Locations)
l i(Multiple Locations)
Company ADivision/Geographic
Headquarters
Headquarters(Executive and
Functional Staff)
Headquarters(Executive and
Functional Staff)
Company B
Company C
ProductionR&D
Shared Services andBack Office
Marketing, Sales &Customer Service
Multiple ProductionLocations
i i i
Marketing, Sales &Customer Service
Type of Operation Typical Location Criteria/Characteristics
Figure 2 – Location Criteria by Type of Operation
Headquarters
• Company
• Division
• Corporate
• Holding Company
• Air access to key markets and internal operations.
• Quality of life that attracts top talent.
• Local access to functional talent and industry-specificresources.
• Favorable business environment.
• Projects the appropriate image of the company.
• Costs in-line with company needs.
Back Office
• Shared Service Center
• IT Service Center
• Accounting Center
• Other functional groups
• Local access to favorable supply of qualified labor.
• Low operating costs (real estate, labor, taxes, air travel
(for operations that require significant travel)
• Moderate competition for labor.
• Facilities available to minimize start-up time.
Research & Development
Center
• Basic research
• Applied research
• Product development
• Product prototyping and
i i
• Access to other R&D operations as needed (university,
commercial partners, R&D service companies, etc.).
• Local access to high quality R&D talent.
• Ability to attract talent to the area.
• Low to moderate operating costs.
• Moderate competition for labor.
ii i • i i i i m n m z e - i .
Manufacturing
• Single location
• Geographically dispersed
• Local access to favorable supply of qualified labor.
• Low operating costs (real estate, labor, taxes, utilities)
• Moderate competition for labor.
• Facilities available for smaller operations and Shovel
Ready sites for larger/specialized operations.
• Utility capacity that meets specific needs.
• Geographic positioning to reach key markets.
Distribution andWarehousing
• National
• Regional
• Local access to favorable supply of qualified labor.
• Low operating costs (real estate, labor, taxes and utilities)
• Moderate competition for labor.
• Existing Building or Shovel Ready sites available tominimize start-up time.
i i i
• Geographic positioning to reach key markets.
Madison County Strategic Economic Development Plan Page

7/29/2019 Madison County's economic development plan, 2013
http://slidepdf.com/reader/full/madison-countys-economic-development-plan-2013 190/192
A. Traditional Manufacturing (Food procssing, chmical manufacturing, fabricatd mtal products, machinry, and mdical/spcialty quipmnt
Labor
• High school graduates with a good work ethic, drug free, ability to work in teams and an interest in working
in a factory environment within the work schedule requirements. • Technicians to maintain automaon equip-
ment • Funconal professionals with admin support sta
Industry Presence• Having enough local industry in type and size to sustain a manufacturing culture and with the specic skill
sets for a parcular operaon.
Real Estate Opons
• 5–100 acres with reasonable buer zone and opportunies for expansion • Located within exisng industrial
park or industrial zoned stand-alone property with complementary adjacent land use (commercial or industrial
operaons)
Transportaon Access
• Located within a few miles of a limited access/interstate highway (not “down Main Street”) • Rail access
important for large plascs molding operaons, chemical manufacturing and other operaons receiving bulk
chemicals and materials or shipping chemicals and other large volume and size items
Ulies/Infrastructure
• Each site needs access to power (some require two sources), gas (for plascs molding and other operaons),
telecom, water and sewer. Large volume of water and wastewater requirements for certain food and other
process operaons.
Operang Costs • Cost of labor, real estate, ulies and transportaon are crical
Other Business Needs andIncenves
• Incenves to oset startup/inial construcon costs and the cost of inial and on-going training.
Quality of Life • Not usually a major issue since only a small group of core sta will be relocang to the area.
B. Nw Tchnology Manufacturing (Biotchnology, nw matrials fabrication, nw gnration lctronic componnts, product drivativs of nw
matrials, tc.)
Labor
• Some high school graduates with a good work ethic, drug free and ability to work in teams • Technicians to
operate more technical process equipment and procedures • Engineers and some highly educated sciensts
(within 30–40 minute commute) • Small sta of funconal professionals with admin support sta (may hire
contract services for non-core funconal support (accounng, legal, HR, IT, etc.)
Industry Presence • Having other local R&D and small high-tech producon operaons
Real Estate Opons• Low cost wet and dry space depending on operaon (mixed lab/producon and oces) • Lease of space
located in industrial or oce park • Inial space requirements will vary from 2,500–25,000 SF
Transportaon Access • Direct access to limited access/interstate highway for commung professional sta • Within one hour of major airport
Ulies/Infrastructure • Need access to power, gas (oponal), telecom, water and sewer
Operang Costs • Cost of real estate is crical. Labor cost is less of an issue inially if performance is high.
Other Business Needs and
Incenves
• Incenves to oset startup/inial costs and access to low interest loans. Limited number of employees will
minimize tradional government incenves and there is a program for high-tech startups • Have access to
university research that applies to specic elds of discipline and process development are crical to growth
and success of small high-tech businesses
Quality of Life
• Cost of living and housing, recreaon/culture and quality of local educaon are important for aracng
companies. Also having access to advanced engineering, science and business schools with MS, MBA and PhD
programs
For each of the Target Growth Segments, the key resources are identied from the perspective of a company seeking
a location to plac a facility. Th rsourc catgoris hav bn packagd (by color) with rlatd rsourcs to aid in
the identication and assessment of resources.
Madison County Strategic Economic Development PlanPage 190

7/29/2019 Madison County's economic development plan, 2013
http://slidepdf.com/reader/full/madison-countys-economic-development-plan-2013 191/192
C. Financial Services and Other Back Ofce/Call Center Operations
Labor
• Some high school graduates with a good work ethic, drug free and ability to work in teams • Certain transac-
ons are requiring college graduates • Funconal professionals with admin support sta • Access to local
colleges/universies, military spouses and rerees as labor sources is a plus
Industry Presence• Having other local back oce operaons is important as a labor pool. Companies determine their posioning
in the local labor aracon “food chain”
Real Estate Opons
• Low cost open space within oce park or former shopping center with substanal parking (these oces are
high density with parking requirements of 5–6 spaces per 1,000 usable SF) • Having facilies built and at a high
level of readiness can be an advantage for some companies to reduce their startup me
Transportaon Access • Direct access to limited access/interstate highway for commung sta • Within one hour of major airport
Ulies/Infrastructure • Need access to power, telecom for high volume use, water and sewer
Operang Costs • Cost of real estate and labor are crical
Other Business Needs and
Incenves• Incenves to oset startup/inial construcon/build-out and training costs
Quality of Life• Not a major issue if majority of sta are hired locally. Some companies will look at cost of living and housing,
quality of schools and other aributes if there are plans to recruit into the area
D. Profssional Srvics Firms (Enginring, Architctural, Accounting, Lgal, Businss Consulting, IT, tc.)
Labor• Primarily hiring college level professionals and some technical (e.g., paralegal) sta • May hire contract
services for non-core funconal support (accounng, legal, HR, IT, etc.)
Industry Presence • Having other similar operaons is important as a labor pool
Real Estate Opons • Small oce space (2,000 -10,000 SF) in a downtown or oce suite complex
Transportaon Access • Some rms will select locaon based on drive-me to regional client base
Ulies/Infrastructure • Need access to typical oce support ulies . . . parcularly high speed Internet
Operang Costs • Cost of real estate and labor are not highly crical for established rms.
Other Business Needs and
Incenves• Incenves to oset startup/inial construcon/build-out are a plus but not normally expected
Quality of Life• Cost of living and housing, recreaon and culture, and quality of local educaon are important for aracng
professionals. Also having access to advanced engineering and business schools with MS and MBA programs
E. Information Firms (primarily publishing rms
Labor• High school graduates with a good work ethic, drug free and ability to work in teams • College graduates for
eding, IT and other technical roles • Small funconal sta
Industry Presence • Having other similar operaons is important as a labor pool
Real Estate Opons • Oce and warehouse space (10,000–50,000 SF) in an oce/light industrial parkTransportaon Access • Within 1–3 miles of interstate/limited-access highway (similar to warehouse operaon)
Ulies/Infrastructure • Need access to typical oce support ulies . . . parcularly high speed Internet
Operang Costs • Cost of real estate and labor are important
Other Business Needs and
Incenves• Incenves to oset startup/inial construcon/build-out
Quality of Life • May be a factor in recruing special skills into the area
F. Warhousing Oprations (mid-siz oprationse 150,000 to 500,000 SF)
Labor
• High school graduates with a good work ethic, drug free, ability to work in teams and an interest in working
in a warehouse environment within the work schedule requirements. • Technicians to maintain automaon
equipment • A few funconal professionals with admin support sta
Industry Presence • Having other warehousing operaons to leverage skill presence
Real Estate Opons
• 10–100 acres with reasonable buer zone and opportunies for expansion • Located within exisng industrial
park or industrial zoned stand-alone property with complementary adjacent land use (commercial or industrial
operaons)
Transportaon Access• Located within a few miles of a limited access/interstate highway with access away from sensive areas
(schools, daycare, hospitals, high density residenal, high density retail, etc.)
Ulies/Infrastructure • Each site needs access to power, telecom, water and sewer.
Operang Costs • Cost of labor, real estate, ulies and transportaon (logiscs) are crical
Other Business Needs and
Incenves• Incenves to oset startup/inial construcon costs and the cost of inial and ongoing training.
Quality of Life • Not usually a major issue since only the plant manager and a few specialists will be relocang to the area.
Madison County Strategic Economic Development Plan Page

7/29/2019 Madison County's economic development plan, 2013
http://slidepdf.com/reader/full/madison-countys-economic-development-plan-2013 192/192