mapping the social business sector in...
TRANSCRIPT

/businesswales.gov.wales/socialbusinesswales
Social Business Wales
Mapping the Social Business Sector in WalesApril 2017

Authors: Oliver Allies and Jessica Irving,Wavehill Ltd
Commissioned and published by Social Business Wales.
Social Business Wales is funded by theEuropean Regional Development Fund andWelsh Government. It is delivered by theWales Co-operative Centre and is part of theBusiness Wales service.
Wales Co-operative CentreY Borth13 Beddau WayCaerphillyCF83 2AX
0300 111 [email protected]
The Wales Co-operative Development and Training CentreLimited (trading as the Wales Co-operative Centre) is aregistered society under the Co-operative and CommunityBenefit Societies Act 2014, number 24287 R.
Rydym yn croesawu gohebiaeth yn Gymraeg a Saesneg.Ni fydd oedi os byddwch yn gohebu â ni yn Gymraeg.
AcknowledgementsWe would also like to thank the many individualswho gave their time to assist in the research, allof whom were important to the writing of thisreport. This report would not have been possiblewithout these contributions.

01 Mapping the Social Business Sector in Wales
Contents/Figures/Tables
FiguresFigure 2.1: Which, if any, of the following terms 15would you use to describe your organisation?(Respondents could provide more than one answer)
Figure 2.2: Respondent social businesses 16by Business Wales sector
Figure 2.3: Please outline your organisation’s 17legal status
Figure 3.1: Main social or environmental 18objectives as identified by organisations
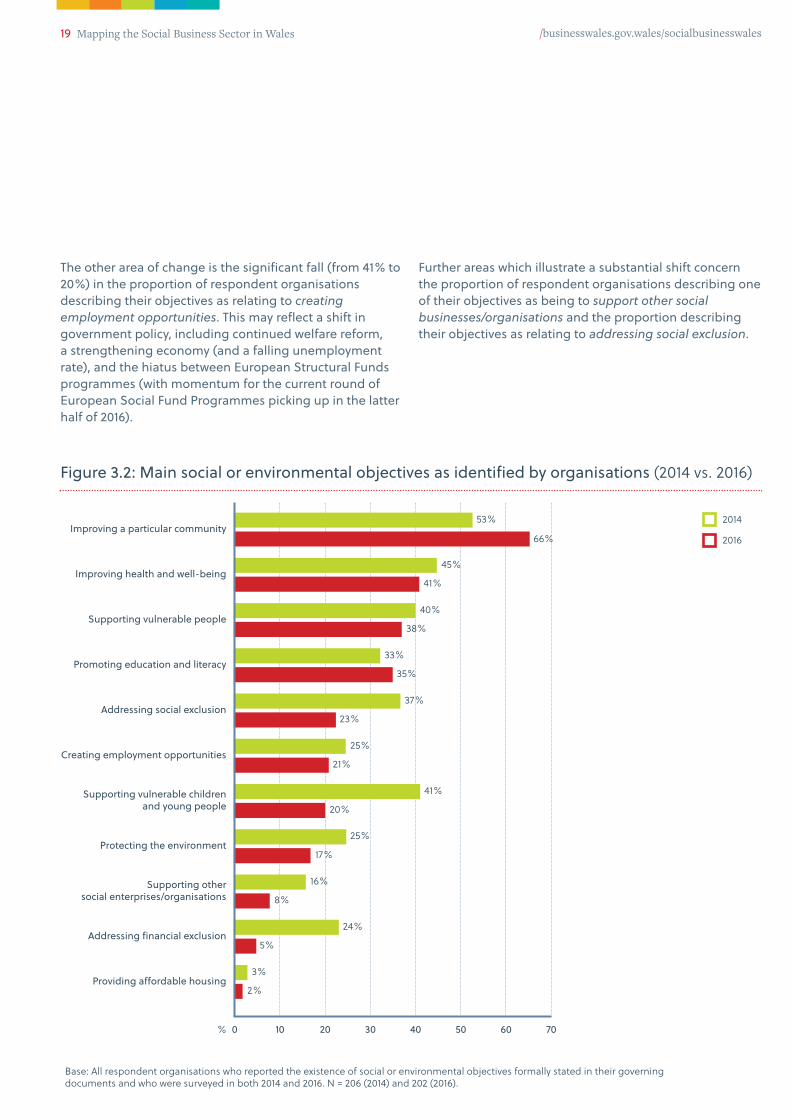
Figure 3.2: Main social or environmental objectives 19as identified by organisations (2014 vs. 2016)
Figure 3.3: Proportion of an organisation’s directors 20or leadership team by age bracket (2014 vs. 2016)
Figure 4.1: Proportion of all identified social 23businesses by local authority area compared to stock of all businesses
Figure 4.2: Social business as a proportion of total 24business stock by local authority area
Figure 4.3: Location of social businesses against 25areas of deprivation – all of Wales
Figure 4.4: Location of social businesses against 25areas of deprivation – south/south east Wales
Figure 4.5: What year did your organisation start 26trading?
Figure 4.6: Percentage of social businesses by 27turnover size band – comparisons of 2016 and 2014 surveys
Figure 4.7: Percentage of matched social businesses 28by turnover size band – comparisons of matchedbusinesses – 2014–2016
Figure 4.8: Percentage of turnover earned through 30trade
Figure 4.9: What do you do with any surplus/profit 30that you generate? (Tick all that apply)
Figure 4.10: Including yourself, if applicable, 31approximately how many paid staff are currently employed in your organisation as a whole in Wales?
Figure 4.11: Proportion of volunteers by size band 32
Executive Summary 03
1 Introduction 111.1 Definition 111.2 Methodological Approach 111.3 Policy Background 13
2 A Profile of the Sector 152.1 Type of Social Business 152.2 Operational Sectors 162.3 Legal Status 17
3 Governance of Social Businesses 183.1 Objectives of Participant Organisations 183.2 Senior Management Teams 20
4 Scale and Scope of Social Businesses 224.1 Location 224.2 Age 264.3 Size of Social Businesses 274.4 Trading Patterns of Social Businesses 304.5 Employment and Volunteering in the Sector 314.6 Measurement of Social Impact 38
5 Social Business Performance 405.1 Business Capabilities 405.2 Performance 425.3 Promotional Activity 46
6 Looking to the Future 486.1 Expectations and Optimism 486.2 Barriers to Growth and Funding 496.3 Enablers 536.4 Securing Financial Support 54
7 Summary of Findings 56
Annex 1: Partner Organisations 58
Annex 2: Phase 1 Survey 59
Annex 3: Follow-up Survey 65
/businesswales.gov.wales/socialbusinesswales

02 Mapping the Social Business Sector in Wales
Contents/Figures/Tables
Figure 5.4: What new products and services have 44you developed? (Open response, coded)
Figure 5.5: Please explain how you have attracted 44new customers or clients
Figure 5.6: Please tell us what geographical areas 45you have expanded into
Figure 5.7: Are you registered on the Sell2Wales 45website by company size (turnover)?
Figure 5.8: Are you on Twitter or Facebook? 46
Figure 6.1: Turnover expectations for the next 48two to three years
Figure 6.2: Self-reported barriers to sustainability 50or growth for social businesses
Figure 6.3: Self-reported barriers to sustainability 51or growth for social businesses – matched respondents from the 2014 and 2016 surveys
Figure 6.4: Where did you apply for finance? 54
TablesTable 1.1: Organisation definitions 11
Table 4.1: The entire social business sector in 29Wales split by turnover bands
Table 6.1: Barrier patterns when comparing 52size/income source of social businesses
Figure 4.12: Comparison (2014 and 2016 survey 33responses) of the number of volunteers per social business amongst matched business respondents
Figure 4.13: Over the course of the last 12 months, 34has your organisation employed any of the following?
Figure 4.14: The number of local authority areas 35that respondent businesses operate across
Figure 4.15: The number of local authorities that 35respondent businesses operate across – matchedrespondents from the 2014 and 2016 surveys
Figure 4.16: What is the main source of income 36that your organisation receives? (Tick all that apply)
Figure 4.17: What is the main source of income 37that your organisation receives? (Tick all that apply)
Figure 4.18: What main tool or method does 38organisation use to measure your social impact?
Figure 5.1: On a scale where 1 is rated as very poor 41and 5 is very strong, how capable would you say your business is at the following?
Figure 5.2: In the last 12 months, has your 42organisation…?
Figure 5.3: In the last 12 months, has your 43organisation…? – matched respondents from the 2014 and 2016 surveys
/businesswales.gov.wales/socialbusinesswales

03 Mapping the Social Business Sector in Wales
Executive Summary
through innovative delivery and defining services indirect response to their community’s needs. In thecurrent environment, which sees uncertainty regardingthe effects of Brexit and potential massive investment in large-scale infrastructure projects via City Deals, social businesses offer a ‘ground-up’, community-ledapproach to economic and community development,and (crucially) are owned and controlled by thecommunities they support.
Overview of findingsSocial businesses in Wales form a dynamic, growing sector. This researchestimates that the sector is worth £2.37 billion to the Welsh economy, supports approximately 40,800 jobs, and offers opportunities to volunteer to approximately 48,000 – 58,000 people. The sector supports growth, jobs, and access to training and employment.
Social businesses are often found in areas of social deprivation, supportingcommunities, offering jobs and training and often providing services that thepublic and private sectors would struggle to maintain. They make an importantcontribution to the drive to fight poverty in Wales.
/businesswales.gov.wales/socialbusinesswales
£2.37 bnResearch estimates that thesector is worth £2.37 billionto the Welsh economy
40,800Approximately 40,800 jobsare supported
58,000Between 48,000 – 58,000opportunities are availableto volunteers
In 2016, social businesses were diversifying, becoming lessreliant on grants, more innovative and more likely to tradedirectly with other businesses and the general public.Social businesses are working across a wide range ofsectors, supplying goods and services as well as making an important contribution to the cohesion of thecommunities within which they are based.
Social businesses are often formed as a result of issuesidentified at a grassroots level by a local community. They plug gaps in provision and, in some cases, grow

04 Mapping the Social Business Sector in Wales
Executive Summary continued
ApproachThis report describes the social business sector1
in Wales following a survey of almost half of thebusinesses operating in the sector. The researchprovides an update on previous research undertakenon the sector in 2014.
The social business sector in Wales was mappedthrough the provision of contact lists from variousorganisations serving/supporting businesses operatingin the sector. Following the collation and de-duplicationof the data, a total of 1,698 organisations were identifiedas operating in the social business sector in Wales, a 16%increase on the number identified in 2014.
A telephone survey was conducted and attempts weremade to contact all businesses listed. The phased surveyexplored an organisation’s background and then, whereconsent was given, took the form of a follow-up surveywhich explored business capabilities and recentperformance as well as future perspectives onperformance and barriers.
The survey took place between September andDecember 2016. A total of 810 organisations respondedto the initial phase, representing 48% of the sector. Of these, 715 (88%) agreed to participate in the follow-up survey.
/businesswales.gov.wales/socialbusinesswales
The survey took place betweenSeptember and December 2016. A total of 810 organisationsresponded to the initial phase,representing 48% of the sector.
1,698The number of businessesoperating in Wales in thesocial business sector was1,698
1 “Social business” is an umbrella term that refers to a variety oforganisation types, including co-operatives/mutuals, social enterprises,and employee-owned businesses.

05 Mapping the Social Business Sector in Wales /businesswales.gov.wales/socialbusinesswales
06 Mapping the Social Business Sector in Wales
Executive Summary continued
Background of Social Businesses+ Almost two thirds (65%) of respondents self-identified
as social enterprises, whilst 46% self-identified ascharities.
+ Social businesses most frequently operate in financialand professional services, retail, creative services, tourism and care service sectors.
+ Seventy-two per cent of social businesses describedtheir main social or environmental objectives as seekingto improve a particular community, whilst almost halfseek to improve health and well-being.
Key findings Scale and Scope of Social Businesses + Using turnover data from respondent businesses,
the entire sector is worth an estimated £2.37 billion to the Welsh economy, a significant increase on 2014estimations.
+ The sector supports 40,800 paid jobs and 48,000 –58,000 volunteers.
+ The typical size of a social business (in turnover) hasincreased. Growth in the scale of social businesses in Wales has led to a closing of the gap (in terms of size profile) to social businesses throughout the UK.
+ In comparison with the 2014 figures, trade with the general public has leaped (57% vs. 41%) withcorresponding declines in trade with the public and private sectors.
+ Social businesses tend to be far younger than privatesector businesses.
+ Social businesses are often located in areas ofdeprivation, with clusters of social businesses found (for example) in Merthyr Tydfil and along the Heads of the Valleys, in Llanelli and in Swansea.
/businesswales.gov.wales/socialbusinesswales
£2.37 bnThe entire sector is worth anestimated £2.37 billion to theWelsh economy
57%In comparison with the 2014 figures, trade with thegeneral public has leaped to 57% vs. 41%
65%Almost two thirds (65%) ofrespondents self-identifiedas social enterprises
Social businesses are oftenlocated in areas of deprivation.
07 Mapping the Social Business Sector in Wales
Looking to the future + Sixty-nine per cent of social businesses expect
turnover to increase over the next two to three years.
+ The lack of/poor access to funding was the mostcommonly identified constraint on business growth.Over half of respondents identified additional barriers,particularly insufficient staffing/volunteers, the impactof Brexit, and public sector austerity measures.
+ Social businesses identified the need for support withgrant applications, marketing and finance to helpgrow and sustain their businesses.
Performance of Social Businesses+ Eighty-four per cent of respondents attracted new
customers or clients in the last 12 months, whilst 24% attracted investment to expand during the same period.
+ New products or services were most frequentlydeveloped in education/training, leisure/culture orsupport services. These are all areas to which localauthorities/other public sector bodies are typicallylooking to outsource.
+ When asked about their perceived businesscapabilities, social businesses reported being mostcapable of financial management and peoplemanagement, whilst they are least capable ofaccessing external finance and marketing.
+ The lack of/poor access to finance/funding was mostcommonly referred to as a barrier to sustainability/growth; however, the proportion referring to it as abarrier has fallen when compared to 2014. Theproportion of social businesses identifying timepressures as a growth constraint on their business has doubled when compared to the 2014 survey.
/businesswales.gov.wales/socialbusinesswales
84%Eighty-four per cent ofrespondents attracted newcustomers or clients in thelast 12 months
24%Twenty-four per cent ofrespondents attractedinvestment to expandduring the last 12 months
69%Sixty-nine per cent of socialbusinesses expect turnoverto increase over the next twoto three years
The lack of/poor access tofinance/funding was mostcommonly referred to as a barrier to sustainability/growth.

08 Mapping the Social Business Sector in Wales
Executive Summary continued
Recent trends The proportion of businesses earning more of their incomethrough trade continues to grow. Across the survey, 50% ofrespondent businesses described earning at least 50% oftheir income through trade. Amongst those businesseswho responded to both the 2014 and 2016 surveys therehas been an increase in the proportion earning over half of their income from trade (from 57% in 2014 to 66% in2016). Conversely, the proportion of respondent businessesdescribing being hindered by the inability to secureappropriate finance has fallen, with a third of respondentbusinesses describing poor access to funding as a barrierto sustainability/growth of their organisation.
Eighty-four per cent of respondent businesses haveattracted new customers or clients in the last 12 months,whilst 24% have attracted investment to expand during the same period. When businesses who responded to both the 2014 and 2016 surveys are compared, there is a large jump in the proportion of the same businessesstating that they had attracted new customers or clients(from 61% to 87%).
Social businesses are becoming very successful in growing the markets that they serve.
Where external investment had been sought, it was mostcommonly in relation to developmental projects for newschemes, indicating confidence and expansion within the sector. Confidence in the sector is, again, evidentwhere respondent businesses were asked about theirexpectations of turnover for the next 2-3 years. More than two thirds (69%) expected turnover to increase during that period, whilst just 6% of respondents expected turnover to decrease.
/businesswales.gov.wales/socialbusinesswales
Where external investment had been sought, it was mostcommonly in relation todevelopmental projects for newschemes, indicating confidenceand expansion within the sector.
50%Across the survey, 50% ofrespondent businessesdescribed earning at least50% of their incomethrough trade
66%There has been an increasein the proportion earningover half of their incomefrom trade from 57% in 2014to 66% in 2016
6%Only 6% of respondents expected turnover todecrease in the next 2-3 years

09 Mapping the Social Business Sector in Wales /businesswales.gov.wales/socialbusinesswales

10 Mapping the Social Business Sector in Wales
Executive Summary continued
Collectively, therefore, there is clear evidence of a growing,increasingly confident and entrepreneurial social businesssector that is built upon strengthening foundations. Thechallenges emerging are primarily those synonymous with a growing sector, particularly in relation to resource(staffing/volunteer) constraints. Interestingly, however, the nature of support desired is largely familiar, with anemphasis on support in applying for finance and onsupport in relation to marketing and promotional activities for social businesses.
The report suggests that the sector has experienced realgrowth in the two years since the last in-depth researchwas carried out. It offers a snapshot of a sector that isdynamic and responsive and is constantly looking toevolve and offer new products and services. The increasein turnover, jobs and volunteer opportunities supported by the sector will have an impact on local economies,community cohesion, and individual people’s potential to develop themselves through paid employment, workexperience, and training. The social benefits of thesebusinesses have tangible effects which are having apositive impact on communities throughout Wales.
ConclusionsExpectationsBusinesses are seeking to grow through accessing newmarkets (geographical), serving new customers, andthrough the development of new products or services.Education/training provision, leisure/culture activity and generic support services were identified as areas inwhich social businesses were looking to develop newproducts/services. These are all areas from which thepublic sector is typically looking to withdraw in responseto austerity measures, and suggest that social businessesare actively positioning themselves to respond to theseopportunities.
An expanding sector is not without its headaches,however, with the proportion of respondent businessesidentifying time pressures as a growth constraint on theirbusiness having doubled when compared to the 2014survey, whilst a further 39 respondents cited staffing/volunteering resources as a constraint on their business.
Similarly, there is a concern about the tradingenvironment for social businesses, with the issues arisingfrom Brexit and, in particular, its impact on Europeanfunding alongside public sector cuts identified as likelyconstraints on social businesses going forward.
/businesswales.gov.wales/socialbusinesswales
The social benefits of these businesseshave tangible effects which are having a positive impact on communitiesthroughout Wales.
11 Mapping the Social Business Sector in Wales
1 | Introduction
1.2 | Methodological Approach1.2.1 | Need for the ResearchExtensive research on the social business sector is crucialto developing an understanding of what is happening “on the ground” in the sector and, in response, helpsshape the nature of support that the sector requires tofacilitate its growth and sustainable development. Therapid evolution of the sector and the markets it servesnecessitates the capture of up-to-date information on how the sector is performing, the challenges it faces, andwhat helps and what hinders businesses operating withinthe sector, to ensure that any policy response is reflectiveof identified needs.
1.2.2 | Identifying Organisations in the Social Business SectorBusinesses operating in the social business sector are nottypically associated with a specific industrial sector.Consequently, identifying businesses that may operate inthe sector through published information is challengingand resource-intensive.
This report describes the social business sector in Walesand, in doing so, provides an update on previous researchundertaken on the sector in 2014. The research thatunderpins this report is far more comprehensive thanprevious research, with around half of all businessesidentified as operating in the sector having beeninterviewed. The report provides detailed insight into theperformance of the sector, alongside the issues andopportunities faced by social businesses.
This first chapter provides a brief background to theresearch and the approach taken in conducting theresearch.
1.1 | Definition“Social businesses” is an umbrella term that refers to avariety of organisation types, including co-operatives/mutuals, social enterprises and employee-owned businesses. A detailed description of what each ofthese terms means is set out in Table 1.1 below:
/businesswales.gov.wales/socialbusinesswales
Description
A co-operative is an autonomous association of persons united voluntarily to meettheir common economic, social and cultural needs and aspirations through a jointlyowned and democratically controlled enterprise.
A social enterprise is a business with primarily social objectives and whose surplusesare principally reinvested for that purpose in the business or the community, ratherthan being driven by the need to maximise profit for shareholders and owners.
They have three key characteristics:+ They have a social, community or ethical purpose.
+ They operate using a commercial business model.
+ They have a legal form appropriate to ‘not-for-personal-profit’ status and social ownership.
The Employee Ownership Association describes employee-owned businesses asbusinesses that are totally or significantly owned by their employees.
Employee ownership can take one of three forms: + Direct employee ownership – using one or more tax-advantaged share plans,
employees become registered individual shareholders of a majority of the shares in their business.
+ Indirect employee ownership – shares are held collectively on behalf ofemployees, normally through an employee trust.
+ Combined direct and indirect ownership – a combination of individual and collective share ownership.
Organisation type
Co-operatives
Social Enterprises
Employee-Owned Businesses
Table 1.1: Organisation definitions

12 Mapping the Social Business Sector in Wales
1 | Introductioncontinued
1.2.3 | The SurveyThere were essentially two strands to the telephone surveywhich involved a census-based approach to the survey(where an attempt was made to contact all identifiedsocial businesses). The initial strand focused on the profileof the organisation, its size, constitution, sector, andgeographical area of operation. On completion of theinitial survey, respondents were asked whether they wouldbe willing to answer further questions. Where a willingnesswas expressed to continue with the survey, the secondstrand was completed with the respondent and exploredtopics such as self-perception of business capabilities,recent performance, perceptions of collaboration, andfuture perspectives on performance and barriers.
The survey took place between September and December2016. A very high rate of response was achieved and a totalof 810 organisations responded to the initial strand 1survey, representing 48% of the sector. Of these, 715 (88%)agreed to participate in the follow-up survey.
An alternative approach to utilising published datasets (asis traditionally the case when undertaking a businesssurvey) is therefore necessary. The Wales Co-operativeCentre (WCC) provided Wavehill with the directory ofcontacts from the 2014 research, whilst a series of keypartners across Wales who regularly engage and supportsocial businesses also provided further contact details ofsocial businesses2 . The contact lists were combined, withany duplicate businesses being removed. The final list hasacted as a population from which to survey. The numbersof organisations identified through the research aresummarised below.
+ 2,140 organisations identified as being within the socialbusiness sector in Wales
+ 442 organisations removed, as cleansing of dataidentified them as duplicates or where businesses werefound to have ceased operating or where no details ofthe business could be found (despite more than 10telephone calls, emails and web searches for theorganisation).
Ultimately, this left 1,698 organisations identified asoperating in the social business sector in Wales. This is16% higher than the number identified in 2014 (when asimilar approach to identification took place) and whilstthis may, in part, be due to expansion within the sector, it is also likely to be the result of adopting a more thoroughapproach to the identification of the organisations.
/businesswales.gov.wales/socialbusinesswales
2 A list of key partners contributing to the identification of thesocial business population is presented in annex 1.
Ultimately, this left 1,698 organisationsidentified as operating in the socialbusiness sector in Wales.

13 Mapping the Social Business Sector in Wales
1.2.5 | Building an Evidence BaseThe overwhelming majority of social businessesresponding to the survey (85%) agreed with theirorganisation’s contact information and business activitybeing included in the Business Wales Directory, an onlinedirectory of all businesses (including social businesses) inWales. Their placement in the directory will likely offeradditional supply chain and promotional opportunities tothe sector.
1.3 | Policy BackgroundThere is continued recognition of the critical role that socialbusinesses play in delivering services within Wales, withtheir importance expressed in a host of key policies. InJune 2015, for example, the then-Minister for Finance andGovernment Business announced the Wales ProcurementPolicy Statement, which includes several principles ofparticular relevance to social businesses.
Principle Three sets out that value-for-moneyconsiderations should include benefits to society, theeconomy and the environment. It requires the Welshpublic sector to identify areas of expenditure “which canbe reserved for suppliers with a workforce of 30% or moredisadvantaged workers”, and requires the public sector to“identify areas of expenditure which can be reserved forsuppliers with a social ethos e.g. Co-operatives andMutuals at first tender.”
Principle Four requires social, economic and environmentalbenefits to be an “integral consideration” in procurement.This can include providing recruitment and trainingopportunities for disadvantaged people. Social businessesare well placed to benefit from this principle, as manyalready deliver in these areas.
1.2.4 | Comparing 2014 and 2016 SurveyFindingsThroughout the report, comparisons are made toresponses to the 2014 survey. In 2014, the survey tool wasvery similar to that used in 2016, with many questionsworded the same in both surveys. In 2014, initial responseswere gathered through an online survey; however, atelephone survey was used to boost the sample size andfor conducting the follow-up survey (with a censusapproach to sampling adopted). In 2014, 344 respondentscompleted the strand 1 survey, whilst 305 completed thefollow-up survey. The 2016 survey therefore provides asignificant jump in the number of responses and acorresponding increase in the robustness of the data (dueto the volume of responses secured).
The initial reliance on online approaches to engagement in 2014 is one discrepancy in the approach when comparedto the 2016 survey. This may have influenced the nature ofsocial businesses who were willing or able to respond tothe survey in 2014 when compared to 2016. Furthermore,the 2016 survey involved more extensive engagementtechniques than did the 2014 survey, including, forinstance, contacting organisations outside of core officehours. This may have influenced the types of respondentorganisations that were engaged in the survey (enablingthe engagement of organisations that operated part-time,e.g. in the evening).
Aside from the small discrepancies, the similarities inmethodology, sampling and survey questions mean thatthe evidence base can be usefully compared between thetwo surveys to track trends and identify emerging andfading issues. To strengthen the robustness of thesecomparisons, any trends in response have been testedfurther by matching social businesses who responded to both the 2014 and 2016 surveys to provide a directcomparison of response trends to specific questions.
/businesswales.gov.wales/socialbusinesswales

14 Mapping the Social Business Sector in Wales
1 | Introductioncontinued
EU Funding and PolicySupport for social businesses to respond to theopportunities presented through policy development isoffered by a host of sources, including via EU funding,most prominently delivered by the Wales Co-operativeCentre under its ‘Social Business Wales’ operation as partof the wider Welsh Government and EU-funded BusinessWales service.
More widely, social businesses are regularly involved asthird party providers in the delivery of activity (includingemployability) schemes funded via EU monies.Consequently, following the referendum in which thedecision was made to leave the EU, on 29th March 2017 theUK triggered Article 50, confirming that the UK willofficially leave the EU (with two years allotted fornegotiations regarding the EU exit). Leaving the EU doesnot necessarily mean an end to the structural funding thatWales has enjoyed as part of the EU. In October 2016, theChancellor guaranteed continued funding after the UK hasleft the EU for all projects which meet UK priorities andvalue-for-money criteria, and which secured EU fundingbefore the exit. In keeping with the devolution settlement,it will be for the Welsh Government (WG) to determinehow EU funds are spent in Wales, in line with its priorities,whilst the UK remains within the EU. However, whetherWales will continue to benefit from similar levels of fundingto those which it has gained via structural funds followingthe UK’s exit from the EU remains to be seen.
The recent Programme for Government3 cements thisapproach to procurement while expressing the aim thatprocurement should bring economic, social andcommunity benefits to Wales. This is also reflected inrecent legislation4. The Well-being of Future Generations(Wales) Act (2015) embeds in decision making arequirement to consider the positive social andenvironmental impacts of different ways of doing business.
More recently, an Action Plan for “Alternative deliverymodels in public service delivery” was published inMarch 2016 to provide a framework for local decisions to be made on alternative delivery models (ADMs) inspecific service areas and underpinned by the well-beingprinciple set out in the Well-being of Future Generations(Wales) Act (2015). It recognises the benefit of enablingcollaboration between local government, the localcommunity and third sector organisations in makingdecisions about whether services should be delivereddifferently, e.g. through social businesses.
The Action Plan follows the Social Services and Well-being (Wales) Act (2014), which provided greateropportunities for social businesses in the provision ofsocial services, including “the promotion by localauthorities of social enterprises, co-operatives, user ledservices and the third sector in the provision in their areasof care and support and support for carers.” It enshrinesthe process of rolling out new models of delivery acrossWales and encourages communities to find collectivesolutions to service delivery.
/businesswales.gov.wales/socialbusinesswales
3 Taking Wales Forward 2016-2021, Welsh Government. 4 For example, the Well-being of Future Generations (Wales) Act (2015), the Social Services and Well-being (Wales) Act (2014), and the WalesProcurement Policy Statement.
In October 2016, the Chancellor guaranteedcontinued funding after the UK has left the EU for all projects which meet UK prioritiesand value-for-money criteria, and whichsecured EU funding before the exit.

15 Mapping the Social Business Sector in Wales
2 | A Profile of the Sector
2.1 | Type of Social BusinessRespondent businesses were asked to outline which of aseries of terms they would use to describe theirorganisation. The range of terms offered to respondentorganisations reflect those contained within the thirdsector self-selection criteria on the Sell2Wales website.Figure 2.1 below illustrates that two thirds (65%) ofrespondents self-identified their organisation as a socialenterprise, whilst almost half (46%) self-identified theirorganisation as a charity. Just 4% described theirorganisation as a “social firm”5, whilst a similar proportiondescribed themselves as a “supported business”6.
A further 6% of respondents (47/810) described theirorganisation as an “other type of third sector body”, whichincluded 10 community interest companies and eightRegistered Social Landlords/Housing Associations.
Key findings+ Almost two-thirds (65%) of respondent businesses
self-identified as social enterprises, whilst 46% self-identified as charities
+ Financial and professional services, retail, creativeservices, tourism, and care services were the mostcommonly identified sectors within which socialbusinesses operate
/businesswales.gov.wales/socialbusinesswales
5 A social firm is where 25% of your workforce are disabled or disadvantaged and where 50% of your income is made through commercial activity6 A supported business is one whose main aim is the social and professional integration of disabled or disadvantaged persons, where at least 30% of theemployees are disabled or disadvantaged workers. The definition of supported businesses has changed in the Public Contracts Regulations 2015, from anorganisation where at least 50% of the employees are disabled to an organisation where at least 30% of the employees are disabled or disadvantaged. Therecent change in definition is likely to be an influential factor in why so few organisations identify themselves as such.
Figure 2.1: Which, if any, of the following terms would you use to describeyour organisation? (Respondents could provide more than one answer)
SocialEnterprise
Charity Co-operative Mutual Other type ofthird sector
body
Social Firm SupportedBusiness
0
10
20
30
40
50
60
70
%
65%
46%
11% 9%6% 4% 4%
N = 810

16 Mapping the Social Business Sector in Wales
2 | A Profile of the Sectorcontinued
2.2 | Operational SectorsRespondents were then asked to describe what the mainactivity of their business was and, specifically, what goodsor services do you provide? The responses have beenanalysed and categorised against a series of sectorsidentified by Business Wales in their directory in Figure 2.2below. It should be noted that businesses could beassigned to more than one sector, which a significantproportion did, reflecting the diverse portfolio nature oforganisations operating within the sector.
/businesswales.gov.wales/socialbusinesswales
Figure 2.2: Respondent social businesses by Business Wales sector
N = 734
Miscellaneous 212
82
71
69
64
61
39
31
25
22
17
9
7
6
6
5
5
3
Finance and Professional Services
Retail
Creative Services
Tourism
Care Services
Property Management Services
Education and training
Energy and Environmental Goods and Services
Health Care and complementary Therapy
Farming and Forestry
Information, Communication Technology
Language/Translation
Construction
Food and Drink
Advanced Materials and Manufacturing
Transport
Marine
The distribution of responses shows a high proportion oforganisations where some of their main activities/serviceswere difficult to categorise in the Business Wales sectorsand, therefore, have been included in miscellaneous.Other popular sectors included the financial andprofessional services, retail and creative services sectors.

17 Mapping the Social Business Sector in Wales
The survey results also suggest that 47% of organisationshave members, with a median membership count of 1007
(the mean average was 893 members, owing to a smallnumber of very large member organisations skewing thedata). Eighty-six per cent of membership organisationselected members to their management board.
2.3 | Legal StatusRespondents were then asked about their organisation’slegal status. Figure 2.3 below illustrates that mostrespondents worked for a company limited by guarantee,whilst 15% operated as charities and a similar proportionoperated as Community Interest Companies. The chartalso compares the responses to those received in 2014, inwhich there is a tangible (although statisticallyinsignificant) increase in the proportion describing theirbusiness as a Charitable Incorporated Organisation, butgenerally there is a high degree of consistency in thedistribution of responses when the two surveys arecompared, suggesting that the nature of respondentbusinesses to both surveys was broadly similar.
/businesswales.gov.wales/socialbusinesswales
7 A small number of very large organisations skewed the mean number of members to 893; for this reason, the median figure has been presented.
Figure 2.3: Please outline your organisation’s legal status
Base: All respondents were able to outline their organisation’s legal status. N = 777, 2016 and 323, 2014.*”Registered Charity” was not included as an option in the 2014 survey.
Company Limited by guarantee (CLG)51%
Charitable Incorporated organisation
Community Interested Company (CIC)
Registered Charity*
Other
Industrial and Provident Society (IPS) –Co-operative Society
Industrial and Provident Society (IPS) –Community Benefit Society
Unincorporated Organisation
Company Limited by Shares (CLS)
0% 20 40 60
53%
2014
9%
15%
18%
15%
10%
15%
4%
10%
5%
3%
6%
3%
4%
2%
3%
1%
2016

18 Mapping the Social Business Sector in Wales
3 | Governance of Social Businesses
3.1 | Objectives of Participant OrganisationsThe clear majority of respondent organisations (94%,733/781) confirm that their organisation has a clear socialor environmental mission that is set out in their governingdocuments. When asked to expand upon these objectives,the most popular response (71%) related to improving aparticular community (either geographically defined orunited by a common characteristic, e.g. religiousorientation, ethnicity, age group).
Figure 3.2 opposite provides a direct comparison of thosesocial business respondents who were engaged in boththe 2014 and the 2016 survey to enable a direct comparisonof responses to be made. The chart illustrates a largeincrease in the proportion of respondent organisationsdescribing their objectives as supporting a specificcommunity.
Key findings+ Seventy-two per cent of social businesses seek to
improve a particular community, whilst almost halfseek to improve health and well-being
+ There has been a large increase in the proportion ofsocial businesses citing improve a particularcommunity as one of their organisation’s objectives;conversely, there has been a large fall in theproportion of social businesses describing creatingemployment opportunities as one of theirorganisation’s objectives
+ Over a quarter (27%) of representatives in seniormanagement teams are over the age of 65
+ Thirty-two per cent of senior management teams aremajority-led by women, which is significantly higherthan across mainstream businesses in which, forexample, 24% of SMEs (in Wales) are majority-led bywomen (in the UK, just 21% of SMEs are majority-ledby women)
/businesswales.gov.wales/socialbusinesswales
Figure 3.1: Main social or environmental objectives as identified by organisations
Improving a particular community 72%
Improving health and well-being 44%
Supporting vulnerable people 39%
Promoting education and literacy 36%
Addressing social exclusion 29%
Creating employment opportunities 23%
Supporting vulnerable children and young people 22%
Protecting the environment 18%
Supporting other social enterprises/organisations 10%
Addressing financial exclusion 7%
Providing affordable housing 5%
0 10 20 30 40 50 60 70 80%
Base: All respondent organisations who reported the existence of social or environmental objectivesformally stated in their governing documents (N = 733, 2016).
19 Mapping the Social Business Sector in Wales
Further areas which illustrate a substantial shift concernthe proportion of respondent organisations describing oneof their objectives as being to support other socialbusinesses/organisations and the proportion describingtheir objectives as relating to addressing social exclusion.
The other area of change is the significant fall (from 41% to20%) in the proportion of respondent organisationsdescribing their objectives as relating to creatingemployment opportunities. This may reflect a shift ingovernment policy, including continued welfare reform, a strengthening economy (and a falling unemploymentrate), and the hiatus between European Structural Fundsprogrammes (with momentum for the current round ofEuropean Social Fund Programmes picking up in the latterhalf of 2016).
/businesswales.gov.wales/socialbusinesswales
Figure 3.2: Main social or environmental objectives as identified by organisations (2014 vs. 2016)
Base: All respondent organisations who reported the existence of social or environmental objectives formally stated in their governingdocuments and who were surveyed in both 2014 and 2016. N = 206 (2014) and 202 (2016).
Improving a particular community53%
0 10 20 30 40 50 60 70%
66%
Improving health and well-being45%
41%
Supporting vulnerable people40%
38%
Promoting education and literacy33%
35%
Addressing social exclusion37%
23%
Creating employment opportunities25%
21%
Supporting vulnerable children and young people
41%
20%
Protecting the environment25%
17%
Supporting other social enterprises/organisations
16%
8%
Addressing financial exclusion24%
5%
Providing affordable housing3%
2%
2014
2016

20 Mapping the Social Business Sector in Wales
3 | Governance of Social Businessescontinued
3.2.2 | EthnicityNinety-six per cent of representatives in senior managementteams were described by respondent businesses as WhiteBritish (or Welsh, English and Scottish). The remaining 4%were described as White Other, Asian or Asian British, orBlack or Black British. This is very similar to the profile ofbusiness owners/directors across Wales (with 95% of directorsand owner managers in Welsh SMEs described as beingWhite British, Welsh, English or Scottish)9.
3.2.3 | Age ProfileThe age profile of leadership is presented below alongsidecomparisons to the 2014 responses. Senior management10
within organisations is most commonly made up ofindividuals aged between 45 and 64 (as they were in 2014);however, there has been a large increase in the proportion ofthe workforce aged over 65 (from 18% in 2014 to 27% thisyear). This age profile, combined with evidence of a growingsector, suggests that a high replacement demand for seniormanagement representatives will be imminent as those overthe age of 65 enter retirement.
3.2 | Senior Management Teams3.2.1 | GenderRespondent businesses were asked about the demographicof their organisation’s directors or leadership team. Fifty-five per cent of representatives in senior managementteams are male, which is slightly higher than in 2014 (whenthe proportion stood at 52%).
Furthermore, 32% of senior management teams aremajority-led by women, which is (again) slightly down onfindings from the 2014 survey (35%); however, thesefluctuations are small enough to be down to a sample error.
The proportion of women-led businesses remainssignificantly higher than across mainstream businesses inwhich, for example, 24% of SMEs in Wales are majority-ledby women (across the UK, just 21% of SMEs are majority-ledby women)8.
/businesswales.gov.wales/socialbusinesswales
8 Small Business Survey, BIS (2015) – Published June 20169 Ibid.10 Respondents were asked the following: “Could you please tell me how many of your organisation’s directors or leadership team,
including trustees and non-executive directors, fall into the following categories?”
Figure 3.3: Proportion of an organisation’s directors or leadership teamby age bracket (2014 vs. 2016)
16-24 25-44 45-64 65+0
10
20
30
40
50
60
%
3% 2%
23%20%
56%52%
18%
27%
Base: All respondents who could respond (N = 693, 2016 and 275, 2014).
2014
2016

21 Mapping the Social Business Sector in Wales /businesswales.gov.wales/socialbusinesswales
This age profile, combined with evidence of a growing sector, suggests that a highreplacement demand for senior managementrepresentatives will be imminent as those overthe age of 65 enter retirement.

22 Mapping the Social Business Sector in Wales
4 | Scale and Scope of Social Businesses
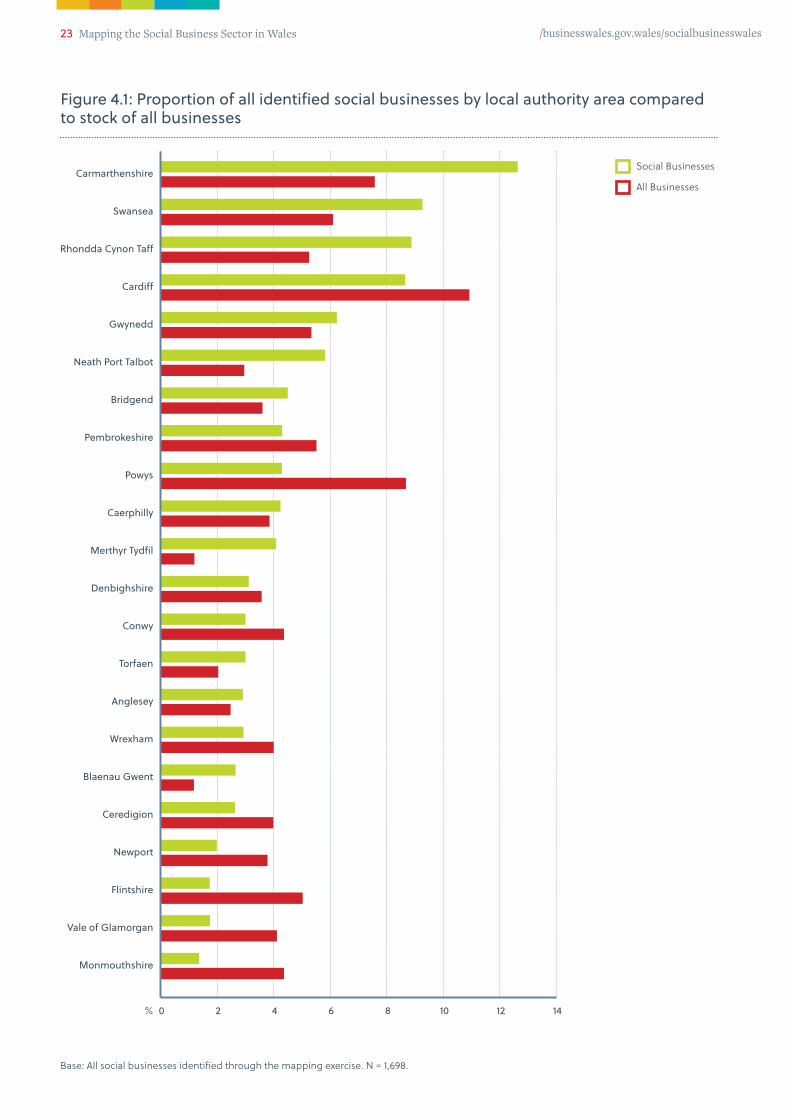
4.1 | Location 4.1.1 | Where Are Social Businesses Located?Figure 4.1 below shows in which local authority theidentified social businesses are located. It presents theseas a proportion of total businesses for the sector andcompares these with the proportional breakdown by local authority for all businesses, regardless of sector. It isevident that Carmarthenshire has a higher concentrationof social businesses than expected (with 12.6% of all Welshsocial businesses based in Carmarthenshire compared to7.6% of all businesses), as do RCT (8.9% compared to5.3%), and Merthyr Tydfil (where 4.1% of all socialbusinesses are located compared to just 1.2% of allbusinesses). Whilst there are likely to be multiple factorsinfluencing the location (a very comprehensive database ofsocial businesses was obtained for certain areas, forexample, as part of the mapping process), the chart showsa tendency for those local authority areas synonymous withhigher levels of deprivation to have a higher concentrationof social businesses, whilst those areas outside of theseareas tend to convey a lower concentration of socialbusinesses (Flintshire has 1.7% of Wales’ social businessesyet 5% of Wales’ entire business stock, and Powys (4.3%and 8.75%) and Monmouthshire exhibit similar trends:1.4% and 4.4% respectively).
Key findings+ Using turnover data from respondent businesses, it is
possible to estimate that the entire sector is worth£2.37 billion to the Welsh economy, a significantincrease on 2014 estimations
+ It is estimated that the sector supports 40,800 paidjobs and 48,000–58,000 volunteers
+ The typical size of a social business has increasedwhen 2014 and 2016 data are compared, with the sizeprofile of social businesses in Wales closing the gapon social businesses throughout the UK
+ In comparison with the 2014 figures, trade with thegeneral public has leaped (57% vs. 41%), withcorresponding declines in the extent to which socialbusinesses serve the public and private sectors
+ Social businesses tend to be far younger than privatesector businesses
+ Detailed mapping identifies that social businessesoften locate in areas of deprivation, with clusters ofsocial businesses along the Heads of the Valleys andin Swansea and Carmarthen
+ Almost two thirds (63%) of respondents operateacross just one local authority area
+ Thirty-nine per cent of social businesses do notmeasure their social impact
This section explores the scale of organisations operatingin the social business sector in terms of the size and theirgeographical scale of operation.
/businesswales.gov.wales/socialbusinesswales
Carmarthenshire
Swansea
Rhondda Cynon Taff
Cardiff
Gwynedd
Neath Port Talbot
Bridgend
Pembrokeshire
Powys
Caerphilly
Merthyr Tydfil
Denbighshire
Conwy
Torfaen
Anglesey
Wrexham
Blaenau Gwent
Ceredigion
Newport
Flintshire
Vale of Glamorgan
Monmouthshire
The chart shows a tendency for those localauthority areas synonymous with higherlevels of deprivation to have a higherconcentration of social businesses.
23 Mapping the Social Business Sector in Wales /businesswales.gov.wales/socialbusinesswales
Figure 4.1: Proportion of all identified social businesses by local authority area comparedto stock of all businesses
Base: All social businesses identified through the mapping exercise. N = 1,698.
Carmarthenshire
Swansea
Rhondda Cynon Taff
Cardiff
Gwynedd
Neath Port Talbot
Bridgend
Pembrokeshire
Powys
Caerphilly
Merthyr Tydfil
Denbighshire
Conwy
Torfaen
Anglesey
Wrexham
Blaenau Gwent
Ceredigion
Newport
Flintshire
Vale of Glamorgan
Monmouthshire
0 2 4 6 8 10 12 14%
Social Businesses
All Businesses

24 Mapping the Social Business Sector in Wales
4 | Scale and Scope of Social Businesses continued
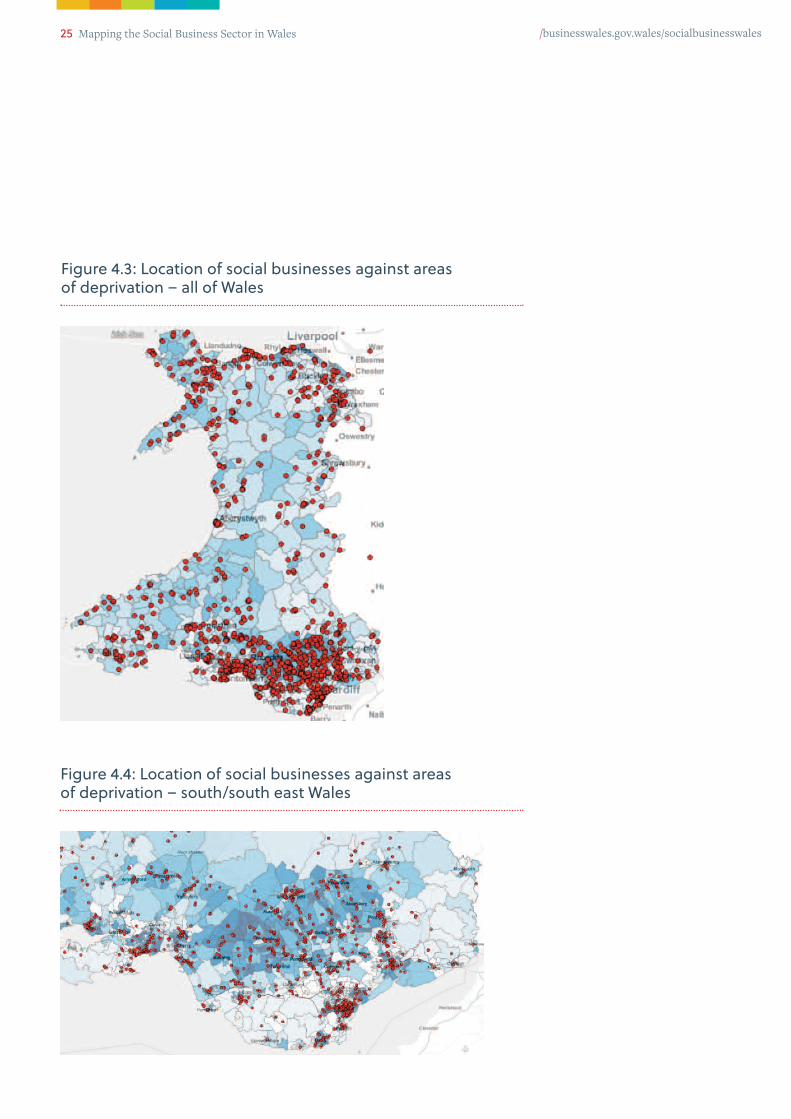
Indices of Multiple Deprivation) in the location in whichthey are based — the darker the colour, the higher thelevels of derivation within an area. The mapping is basedon 85% (1,441 of the businesses identified)11.
The subsequent map zooms in on south and south eastWales because there is a higher density of socialbusinesses in these areas (reflecting the higher density of population there). The map illustrates a significantpresence of social businesses along the Welsh Valleys andaround the Heads of the Valleys (Tredegar, Ebbw Vale, andMerthyr Tydfil), strengthening the assertion that socialbusinesses are more likely to be found in areas sufferingfrom higher levels of deprivation than are mainstreambusinesses.
The stock of social businesses within each local authorityarea has then been compared to the entire business stockto provide an estimation of the proportion of socialbusinesses (as a percentage of all businesses) in each localauthority area. Figure 4.2 below presents this analysis andillustrates that, once again, the highest proportions ofsocial businesses as a percentage of business stock aretypically found in those local authorities that experiencehigher levels of social and economic deprivation (and inareas in West Wales and the Valleys that have alsobenefitted from higher levels of EU Structural Funds).
Further analysis of the location of social businesses ispresented in the map below, which presents the locationof businesses throughout Wales and maps them againstthe level of deprivation (in accordance with the Wales
/businesswales.gov.wales/socialbusinesswales
Figure 4.2: Social business as a proportion of total businessstock by local authority area
Mer
thyr
Tyd
fil
Blae
nau
Gw
ent
Nea
th P
ort T
albo
t
Rhon
dda
Cyno
n Ta
ff
Carm
arth
ensh
ire
Swan
sea
Torfa
en
Brid
gend
Angl
esey
Gw
yned
d
Caer
phill
y
Den
bigh
shire
Card
iff
Pem
brok
eshi
re
Wre
xham
Conw
y
Cere
digi
on
New
port
Pow
ys
Vale
of G
lam
orga
n
Flin
tshi
re
Mon
mou
thsh
ire
0
1
2
3
4
5
6
%
Base: All social businesses identified through the mapping exercise that could be assigned to a local authority area (N = 1,601).
11 Some postcodes were incomplete, incorrect or unable to match against MSOA boundaries.
5.5%
3.5%3.1%
2.7% 2.7%2.4% 2.3%
2.0% 1.9% 1.9% 1.8%
1.4% 1.3%1.1% 1.1%1.2%1.2%
0.8%0.8% 0.7% 0.6% 0.5%
25 Mapping the Social Business Sector in Wales /businesswales.gov.wales/socialbusinesswales
Figure 4.3: Location of social businesses against areasof deprivation – all of Wales
Figure 4.4: Location of social businesses against areasof deprivation – south/south east Wales

26 Mapping the Social Business Sector in Wales
4 | Scale and Scope of Social Businesses continued
15% of SMEs. Comparing the responses to the 2014 surveywith those to the 2016 survey suggests that the sector isbeginning to mature, as in 2014, 39% of respondentorganisations were less than five years old, higher than the31% of the 2016 survey12. Collectively, the data arecomparable with Social Enterprise UK research13, whichidentifies that 6% of respondents to their survey had beenoperating for less than one year, whilst one quarter ofrespondents to their survey had been in operation for lessthan three years.
4.2 | Age4.2.1 | How Well Established Are Organisationsin the Social Business Sector?Survey respondents were asked in what year theirorganisation had started trading. Figure 4.5 compares theresponses to the survey conducted in 2016 to those to the2014 survey and to those to the UK-wide small businesssurvey (conducted in 2015). The chart illustrates that socialbusinesses are typically far younger than private sectorsmall and medium-sized enterprises (SMEs), with almostone third (31%) less than five years old compared to just
/businesswales.gov.wales/socialbusinesswales
Figure 4.5: What year did your organisation start trading?
0
5
10
15
20
25
30
35
40
45
50
%
5% 4%1% 1% 2% 3%
less than 1 year
1 year 2 years 3 years 4-5 years 6-10 years 11-20 years over 20 years
ago
12 There is no longer a specific Wales-wide operation to directly support social businesses in starting up (unlike when the 2014 survey took place). This may have influenced the reduction in start-up businesses identified. 13 State of Social Enterprise Survey 2015, Social Enterprise UK14 UK-wide responses to the Small Business Survey (2015)
Base: All social businesses able to recall the year of registration (N = 297, 2014 and 801, 2016; all SMEs, 15,50214).
8%6% 6% 6%
8%9%
5%
13%15%
21% 21% 22% 24% 23%26%
43%
18%
10%
2014
All SMEs ( 2015)
2016

27 Mapping the Social Business Sector in Wales
30% in the previous year. Conversely, 28% of respondentsreported turnover in excess of £250,000 compared to just21% in 2014.
The figures also suggest that social businesses in Wales areclosing the gap, in terms of scale, on social businessesacross the rest of the UK. In the State of Social EnterpriseReport 201516, 32% of respondents had turnover below£50,000 (compared to 39% in this survey) and 16% over£1m (compared to 14% in this survey); in both instances thegap has narrowed since the previous survey wasundertaken.
4.3 | Size of Social Businesses4.3.1 | TurnoverTo gain an insight into the size of respondentorganisations, respondents were asked to provide anestimate of their turnover in their last financial year ofoperation15 , with a total of 729 businesses doing so.
Figure 4.6 below presents the distribution of turnover bysize and compares this to the responses from the 2014survey. The chart shows a trend towards higher turnoveramongst respondent businesses, with 26% of respondentsreporting turnover of less than £25,000 in 2016, a fall from
/businesswales.gov.wales/socialbusinesswales
15 Twenty-seven respondents had not traded for a complete financial year and 71 preferred not to disclose this information.16 State of Social Enterprise Report 2015, SEUK
Figure 4.6: Percentage of social businesses by turnover size band – comparisons of 2016 and 2014 surveys
0
5
10
15
20
25
30
35
%
30%
26%
13% 13% 14%
16%
22%
18%
8% 8%
4% 4%
7%
2%2% 2%2% 3%3%
7%
Under orequal to£25,000
£25,001 to£50,000
£50,001 to£100,000
£100,001 to£250,000
£250,001 to£500,000
£500,001 to£1m
£1.01m to£2.5m
£2.51 to £5m £5.01m to£10m
More than£10m
Base: All social businesses willing/able to provide exact turnover or banded turnover data for the previous financial year. N = 729, 2016 and 317, 2014.
2014
2016

28 Mapping the Social Business Sector in Wales
4 | Scale and Scope of Social Businesses continued
The table below also estimates the total size of the socialbusiness sector by “scaling up” the responses to thesurvey to be reflective of the entire known sector (basedon the assumption that the un-interviewed respondentbusinesses from the social business sector mirror thosewho have been interviewed). The analysis also includesadjustments for the addition of the water company Glas Cymru — a known “outlier” with very high turnover.
The total value of the sector, based on the estimatedturnover of known and identifiable social businesses in Wales, is estimated at £2.37 billion, which is a 40%increase on estimations in 2014. The larger numbers of social businesses identified through more thoroughresearch, combined with the evident growth in turnoveramongst businesses within the sector, have led to thisgrowth.
To investigate these changes further, businesses from the2016 survey were matched, where possible, to thosebusinesses that responded to the previous survey toprovide an exact match of the organisations surveyed.Ultimately, 178 of the same businesses provided turnoverfigures for both surveys and the distribution of theirresponses is presented in Figure 4.7 below. The chartpresents a similar picture to that of the survey-wide chartand illustrates clear growth in turnover amongst therespondent organisations, with the proportion withturnover of less than £50,000 falling from 43% to 37%.
The distribution of social businesses in terms of size withinthe sector remains highly skewed, with a very smallnumber of organisations contributing much of the value.Table 4.1 below illustrates that less than 5% of the sectoraccounts for almost 80% of its monetary value.
/businesswales.gov.wales/socialbusinesswales
Figure 4.7: Percentage of matched social businesses by turnover size band – comparisons of matched businesses – 2014–2016
0
5
10
15
20
25
30
35
%
27%
23%
16%14%
15%
19%
24% 25%
6% 7%
3%4%
3%4%
1%1% 1%2% 2%2%
Under orequal to£25,000
£25,001 to£50,000
£50,001 to£100,000
£100,001 to£250,000
£250,001 to£500,000
£500,001 to£1m
£1.01m to£2.5m
£2.51 to £5m £5.01m to£10m
More than£10m
Base: Respondent businesses who responded to both 2014 and 2016 surveys. N = 178.
2014
2016

29 Mapping the Social Business Sector in Wales /businesswales.gov.wales/socialbusinesswales
Turnover No. of Social Businesses % of Social Businesses Value % of All Value
Under £25,000 472 27.3% £4,851,144 0.3%
£25,001 to £50,000 211 12.2% £7,859,248 0.4%
£50,001 to £100,000 256 14.8% £18,639,545 0.9%
£100,001 to £250,000 313 18.1% £52,825,716 3.4%
£250,001 to £500,000 145 8.4% £53,912,087 2.5%
£501,000 to £1m 109 6.3% £79,432,859 2.5%
£1.01m to £2.5m 116 6.7% £196,194,611 6.2%
£2.51m to £5m 28 1.6% £108,192,181 5.1%
£5.01m to £10m 24 1.4% £171,430,453 10.3%
>£10m 55 3.2% £1,680,926,584 68.4%
Total 1,730 100% £2,374,264,428 100%
Base: 729 respondents who were willing to provide an estimate.
Table 4.1: The entire social business sector in Wales split by turnover bands
The total value of the sector, based on theestimated turnover of known andidentifiable social businesses in Wales, is estimated at £2.37 billion, which is a 40% increase on estimations in 2014.

30 Mapping the Social Business Sector in Wales
4 | Scale and Scope of Social Businesses continued
of income from trade. The data confirm the trends evidentfrom all respondents, with the proportion earning at least51% of income through trade rising from 57% in 2014 to66% in 2016. Conversely, the proportion earning less than25% of income through trade has fallen from 34% in 2014to 23% amongst the directly matched businesses in 2016.Collectively, these figures provide a comprehensiveevidence base of a strengthening, more commerciallyorientated and growing sector.
4.4.2 | Destination of SurplusFigure 4.9 below presents the destination of any surplus orprofits generated, and illustrates that the vast majority ofrespondents reinvest at least a portion of their surplus intheir business.
4.4 | Trading Patterns of Social Businesses4.4.1 | Sources of IncomeIt was found that half of respondent businesses earnedover three quarters of their turnover from trade, asignificant increase from 2014 (41%); for another 12%, tradeaccounted for over half of turnover. These organisationsare considered established social businesses, with thefollowing 11%, earning between 25% and 50%, consideredemerging17. Just over one-quarter (27%) received no morethan 25% of their turnover from trading activities; however,this is a significant fall from the previous survey, where36% of respondent businesses earned less than 25% fromtheir trading activities.
It was possible to match 206 respondent businesses fromthe 2014 and 2016 questions to enable a direct comparison
/businesswales.gov.wales/socialbusinesswales
Figure 4.8: Percentage of turnover earned through trade
0
10
20
30
40
50
60
%
26%24%
10%
3%8%
11%16%
12%
41%
50%
0% to 15% 16% to 25% 26% to 50% 51% to 75% 76% to 100%
2014
2016
Base: All respondents (N = 827, 2016 and 337, 2014).
Figure 4.9: What do you do with anysurplus/profit that you generate?
40
30
20
10
0
50
60
70
80
90
100
%
88%
26%
9%
2%
Re-invest togrow/
sustain thebusiness
Utilise forcommunity/
social,environmentalor charitable
benefit
Other Distribute to members
Base: All respondents (N = 827).

31 Mapping the Social Business Sector in Wales
the 2014 survey didn’t explicitly refer to their Wales-basedoperations only — this may be a factor in the slightreduction evident.
The responses equate to a mean average of 22 employeesper organisation (although this is heavily skewed to largerbusinesses), as the median (mid-point) average is fouremployees per organisation. When these figures are usedto calculate total employment in the sector across Wales itequates to an estimated 40,800 people employed in thesocial business sector in Wales, a 7% increase onemployment in the sector in 2014.
To gain further insight into patterns of employmentgrowth, respondent businesses were asked how many staffthey employed a year ago, and then their expectations ofemployment in 12 months’ time. On average, respondentbusinesses expected a 5.3% increase in employmentduring that 24-month period.
4.5 | Employment and Volunteering in the SectorRespondents were asked to estimate the number of full-time and part-time employees employed in their Wales-based organisation (as some were employed byorganisations operating across multiple countries).
Figure 4.10 below combines the number of part-time andfull-time employees for each organisation and maps itagainst the responses obtained from the 2014 survey. Theanalysis shows a mixed picture with an increase in theproportion of respondents who have no paid staff but alsoan increase in the proportion of respondent businessesconsidered of a small or medium size (employing between11 and 249 employees). It should be noted that there was aslight difference in the specific question asked ofrespondents between the two surveys, with 2016specifically referring to their organisation in Wales, whilst
/businesswales.gov.wales/socialbusinesswales
Figure 4.10: Including yourself, if applicable,approximately how many paid staff arecurrently employed in your organisation as awhole in Wales?
0
10
20
30
40
50
60
70
%
18%
23%
60%
51%
16% 18%
4%
6%
2% 2%
None Micro (1-10)
Small (11-49)
Medium (50-249)
Large(250 plus)
2014
2016
Base: All respondents who felt able to estimate the number ofWales-based employees. N = 797, 2016 and 282, 2014.

32 Mapping the Social Business Sector in Wales
4 | Scale and Scope of Social Businesses continued
4.5.1 | Volunteers Similar to 2014, there is a large base of social businessesthat have no employees (39% had no full-time employeesin both studies). The sector is, however, a rich source ofopportunity for volunteers. Eighty-seven per cent oforganisations use volunteers to some extent (an increasefrom 80% in 2014), with an average (mean) of 33.7volunteers per organisation (a significant increase from 26 in 2014), although the figure for a ‘typical’ socialbusiness (the median) is 12.
Businesses were then asked what proportion of theirworkforce is made up of people who are disadvantaged in the labour market. (However, respondent businessesmay not have been fully aware of the definition ofdisadvantaged.)18 Sixty-two per cent of respondents(414/668) did not employ (or were not aware of employing)anyone that they perceived to be disadvantaged. Of thosewho did, 83% of respondents (211/254) estimated that theymade up less than 10% of the total workforce.
/businesswales.gov.wales/socialbusinesswales
18 Respondents were provided with examples of the disadvantaged — “those who are long term unemployed, ex-offenders, people with disabilities etc.”. EU definitions of the disadvantaged are broader, describing a person as disadvantaged who: has not been in regular paid employment for the previous 6 months, or has not attained an upper secondary educational/vocational qualification, or is over 50, or lives as a single adult with one or more dependants,or who works in a profession where there is a gender imbalance and belongs to the underrepresented group or is a member of an ethnic minority, andrequires linguistic, vocational or work experience to enhance prospects of stable employment. See: Community Benefits: Delivering Maximum Value for theWelsh Pound – 2014, Welsh Government.
Figure 4.11: Proportion of volunteers by size band
0
5
10
15
20
25
30
35
%
20%
13%14%
13% 13%
17%
27% 27%
8% 8%
3%5%
0 volunteers
1-4 volunteers
5-9 volunteers
10-24 volunteers
25-49 volunteers
50-99 volunteers
100-249 volunteers
1%2%
250+volunteers
Base: All respondents able to provide an estimate of volunteers in their organisation. N = 819, 2016 and 334, 2014.
2014
2016
14%16%

33 Mapping the Social Business Sector in Wales
relate not only to the significant increase in the number of volunteers reported by respondent businesses, but alsoto the identification of more businesses within the sector.However, the application of a purely telephone-basedapproach to the survey may have led to the engagementof a greater proportion of volunteer-orientatedorganisations than were identified in the previous survey.
To offset any influence that adjustment in the approachhas had, the increase in volunteering across matchedrespondent social businesses has been applied to theentire dataset to provide an alternative estimate ofvolunteering opportunities. Using this approach, it is estimated that there are 48,500 volunteeringopportunities in the social business sector. It isreasonable to assume that the actual figure forvolunteering opportunities lies somewhere between the two figures.
Further matched analysis has been undertaken to comparethe exact same respondents to the 2016 survey with thosewho responded to the 2014 survey. Ultimately, through thisprocess, 188 respondent businesses were identified inwhich there were meaningful responses to these questionsfor both 2014 and 2016. Collectively, these 188 businessesreported having 5,885 volunteer opportunities in 2014, butare now reporting 6,347 volunteer opportunities (anincrease of almost 10%). Figure 4.12 below maps thisdistribution and illustrates that the proportion of matchedrespondents with at least 25 volunteers has risen from 29%in 2014 to 36% in 2016.
Based on the prevalence of volunteering acrossrespondent organisations, it is estimated that there are atotal of 57,200 volunteer opportunities in the socialbusiness sector in Wales. This is an increase of 49% on thefigures obtained in 2014. Primarily, this would appear to
/businesswales.gov.wales/socialbusinesswales
Figure 4.12: Comparison (2014 and 2016 survey responses) of the number of volunteers per social business amongst matched business respondents
0
5
10
15
20
25
30
35
%
14%12%
11%10%
15%
19%
30%
24%
10% 9%
4%
7%
0 volunteers
1-4 volunteers
5-9 volunteers
10-24 volunteers
25-49 volunteers
50-99 volunteers
100-249 volunteers
1%2%
250+volunteers
Base: All respondent businesses who responded to both surveys and felt able to estimate their organisation’s volunteer numbers in both surveys. N = 188.
2014
2016
14%
18%

34 Mapping the Social Business Sector in Wales
4 | Scale and Scope of Social Businesses continued
4.5.2 | How Large a Geographical Market AreSocial Businesses Looking to Serve?Respondents were asked across how many localauthorities in Wales their organisation deliversservices/products. The data have been compared withresponses in 2014 and illustrate an increase in theproportion of respondent organisations that operateacross just one local authority, whilst there has been a fallin the proportion of respondent organisations operatingthroughout Wales. This perhaps supports the hypothesisthat social businesses are largely driven by need in a givenarea (particularly as almost three quarters of respondentsdescribed their organisation’s role as serving a specificcommunity — see Figure 3.1 in Section 3), rather thanresponding to opportunities regardless of geographicallocation.
When only those businesses who responded to both the2014 and 2016 surveys are analysed (direct matches), thedata present a slightly different picture. It illustrates aslight increase in respondent organisations operating inonly one local authority area and a reduction in theproportion who operate throughout Wales. Collectively,this provides further evidence of social businessestargeting specific communities.
/businesswales.gov.wales/socialbusinesswales
Figure 4.13: Over the course of the last 12months, has your organisation employed any of the following
20
15
10
5
0
25
30
35
%
30%28%
20%
12%11%
9%
Free
lanc
ers
Shor
t ter
m w
ork
plac
emen
ts
Supp
ort
wor
kers
Seas
onal
wor
kers
Zero
hou
rsco
ntra
cts
Appr
entic
es
Base: All respondent businesses. N = 833.
With regard to other forms of employment in socialbusinesses, just short of one-third of social businesses hirefreelancers (30%), closely followed by short-term workplacements (28%).

35 Mapping the Social Business Sector in Wales /businesswales.gov.wales/socialbusinesswales
Figure 4.14: The number of local authority areas that respondentbusinesses operate across
0
10
20
30
40
50
60
70
%
53%
63%
6%8%7% 7% 6%
11%
3% 3% 2%3%
17%
11%
1 2 3 4 5 6-19 All Wales
2014
2016
Base: All respondents able to provide details about their geographical areas of trading. N = 809, 2016 and 341, 2014.
Number of Local Authority Areas
Figure 4.15: The number of local authorities that respondent businesses operateacross – matched respondents from the 2014 and 2016 surveys
0
10
20
30
40
50
60
70
%
61% 62%
6% 7%7% 7% 6%10%
2% 2% 2%5%
14%11%
1 2 3 4 5 6-19 All Wales
2014
2016
Base: All respondents able to provide details about their geographical areas of trading. N = 282, 2016 and 282, 2014.
Number of Local Authority Areas

36 Mapping the Social Business Sector in Wales
4 | Scale and Scope of Social Businesses continued
Forty per cent (316/810) of organisations stated thatgovernment and public sector grants were a main sourceof income for their organisation, whilst 41% referred to“other” grants as a main source of their organisation’sincome. The proportion of social businesses stating thattheir main source of income is that of grants received fromthe public sector has fallen by a statistically significantmargin (from 49% to 40%) and is likely to be a reflectionon the impact of public austerity measures.
4.5.3 | CustomersThe most common customers of social businesses are thegeneral public (57%, 462/810 of organisations), followed bythe public sector (24%, 188/810) and the private sector(17%, 135/810). Just 15% (122/810) trade with the third sector,and 10% (67/810) trade with other social businesses. Incomparison with the 2014 figures, trade with the generalpublic has leaped (57% vs. 41%), with correspondingdeclines in the extent to which social businesses serve thepublic and private sectors.
/businesswales.gov.wales/socialbusinesswales
Figure 4.16: What is the main source of income that your organisation receives? (Tick all that apply)
Trading with the general public41%
0 10 20 30 40 50 60 70%
57%
Other grants34%
41%
Grants from the government/local authority/public sector 40%
Donations (including throughfundraising and crowdfunding)
31%
25%
Trading with the public sector (e.g. through service level agreements
28%
24%
Trading with the private sector 19%
17%
Trading with third sector organisations (e.g. charities, voluntary groups)
21%
15%
Trading with other social enterprises10%
10%
Other12%
10%
Membership loans/fees 2%
Rental income 1%
2014
2016
Base: All 2016 respondents (N = 810); 2014 survey (N = 337).Note: Two new categories — Membership Loans/Fees and Rental Income — have been included in the 2016 research through coding of ‘other’ replies.
49%

37 Mapping the Social Business Sector in Wales
Twenty-four per cent of organisations received asubstantial body of their income through donations (24%).
To explore these findings in more depth, analysis ofmatched respondents was undertaken. The patternsdisplayed above are replicated when comparing the samerespondents from 2014 to those from 2016, illustrating aclear shift in the focus of the sector over the last two years.
/businesswales.gov.wales/socialbusinesswales
Figure 4.17: What is the main source of income that your organisation receives?(Tick all that apply)
Trading with the general public40%
0 10 20 30 40 50 60 70%
60%
Other grants39%
41%
Grants from the government/local authority/public sector 38%
Donations 32%
27%
Trading with the private sector 18%
22%
Trading with the public sector (e.g. through service level agreements 21%
Trading with third sector organisations (e.g. charities, voluntary groups)
23%
20%
Trading with other social enterprises12%
12%
2014
2016
Base: All respondents able to respond to the question (“other” and “don’t know” excluded). N = 206, 2016 and 206, 2014.
49%
26%
38 Mapping the Social Business Sector in Wales
4 | Scale and Scope of Social Businesses continued
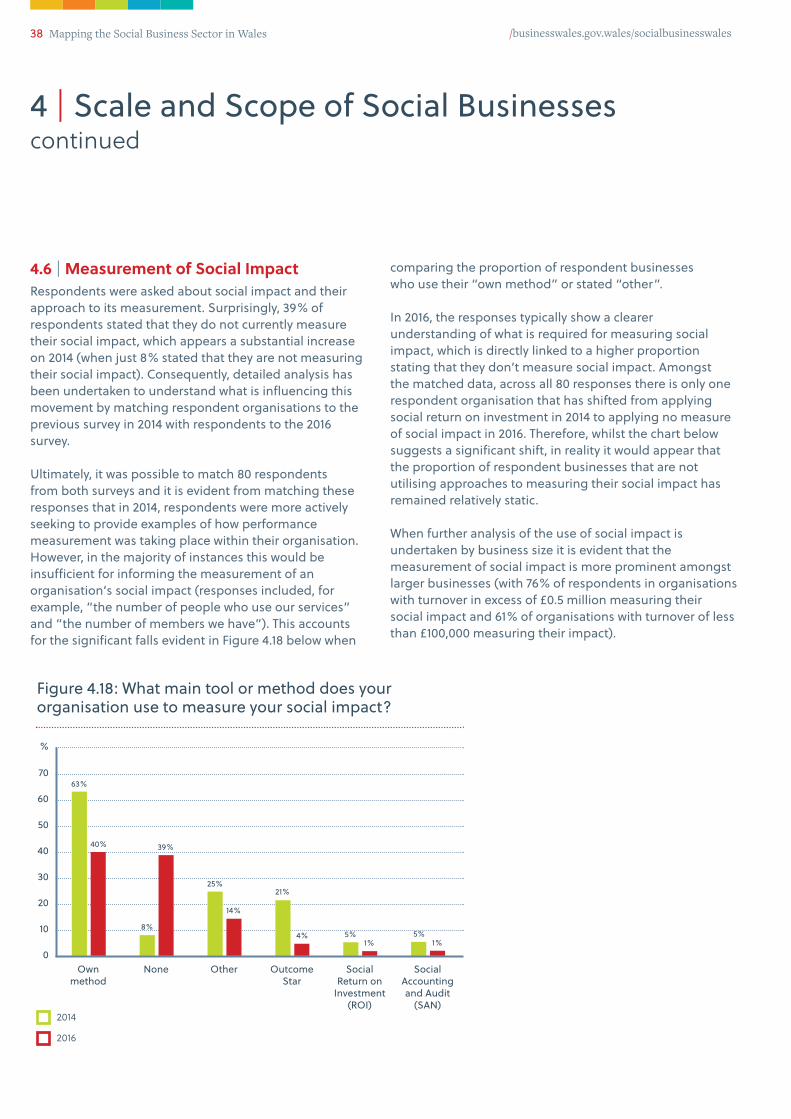
comparing the proportion of respondent businesses who use their “own method” or stated “other”.
In 2016, the responses typically show a clearerunderstanding of what is required for measuring socialimpact, which is directly linked to a higher proportionstating that they don’t measure social impact. Amongst the matched data, across all 80 responses there is only onerespondent organisation that has shifted from applyingsocial return on investment in 2014 to applying no measureof social impact in 2016. Therefore, whilst the chart belowsuggests a significant shift, in reality it would appear thatthe proportion of respondent businesses that are notutilising approaches to measuring their social impact hasremained relatively static.
When further analysis of the use of social impact isundertaken by business size it is evident that themeasurement of social impact is more prominent amongstlarger businesses (with 76% of respondents in organisationswith turnover in excess of £0.5 million measuring theirsocial impact and 61% of organisations with turnover of lessthan £100,000 measuring their impact).
4.6 | Measurement of Social ImpactRespondents were asked about social impact and theirapproach to its measurement. Surprisingly, 39% ofrespondents stated that they do not currently measuretheir social impact, which appears a substantial increaseon 2014 (when just 8% stated that they are not measuringtheir social impact). Consequently, detailed analysis hasbeen undertaken to understand what is influencing thismovement by matching respondent organisations to theprevious survey in 2014 with respondents to the 2016survey.
Ultimately, it was possible to match 80 respondents from both surveys and it is evident from matching theseresponses that in 2014, respondents were more activelyseeking to provide examples of how performancemeasurement was taking place within their organisation.However, in the majority of instances this would beinsufficient for informing the measurement of anorganisation’s social impact (responses included, forexample, “the number of people who use our services”and “the number of members we have”). This accounts for the significant falls evident in Figure 4.18 below when
/businesswales.gov.wales/socialbusinesswales
Figure 4.18: What main tool or method does yourorganisation use to measure your social impact?
0
10
20
30
40
50
60
70
%
63%
40% 39%
8%
14%
5%1%
25%21%
5%1%
4%
Ownmethod
None Other OutcomeStar
SocialReturn on
Investment(ROI)
SocialAccountingand Audit
(SAN)2014
2016

In 2016, the responses typically show a clearerunderstanding of what is required for measuring socialimpact, which is directly linked to a higher proportionstating that they don’t measure social impact.
39 Mapping the Social Business Sector in Wales /businesswales.gov.wales/socialbusinesswales

40 Mapping the Social Business Sector in Wales
5 | Social Business Performance
5.1 | Business CapabilitiesThe second strand of the social business survey explored,in some depth, perception amongst respondents of thecapabilities of their organisation.
Respondents were asked to rate, on a five-point scale,their level of capability regarding six key competencies(Figure 5.1). The highest average scores were in financialmanagement (4.1) and people management (3.9), whilethe lowest were in accessing external finance (3.4) andmarketing (3.3). The ratings are similar to those suppliedby respondents in the 2014 survey.
Further analysis was undertaken by organisation size andwhilst there are slight trends of improving scores asbusinesses grow, they typically represent an averageincrease of 0.2–0.4 per indicator (when comparingbusinesses with less than £500,000 turnover with thosewith turnover in excess of £1m), thereby suggesting thatself-perception of business capability is relativelyconsistent regardless of size.
Key findings+ Eighty-four per cent of respondent businesses have
attracted new customers or clients in the last 12months, whilst 24% have attracted investment toexpand during the same period
+ Where businesses developed new products orservices these most commonly related toeducation/training, leisure/culture or support services– these are all areas from which localauthorities/other public sector bodies are typicallylooking to withdraw
+ Respondent businesses typically perceive that theirorganisation is most capable of financialmanagement and people management, whilst theyare least capable of accessing external finance andmarketing
+ The lack of/poor access to finance/funding was mostcommonly referred to as a barrier tosustainability/growth for respondent socialbusinesses; however, the proportion referring to it asa barrier has fallen when compared to 2014
+ The proportion of respondent businesses identifyingtime pressures as a growth constraint on theirbusiness has doubled when compared to the 2014survey (from 12% to 24%)
+ Only 6% had been hindered in their application forfinance in the last 12 months, down from 20% in 2014
+ Financial support (where it had been sought) hadmost commonly been accessed for developmentprojects — for new schemes
/businesswales.gov.wales/socialbusinesswales

41 Mapping the Social Business Sector in Wales /businesswales.gov.wales/socialbusinesswales
Figure 5.1: On a scale where 1 is rated as very poor and 5 is very strong, how capablewould you say your business is at the following?
0 2 2.5 30 3.5 4 4.5 5
Financial management4.0
4.1
3.9
4.0
3.7
3.7
3.7
3.6
3.6
3.4
3.3
3.8
3.8
People management, such as recruitment and delegation
Developing and implementing a business plan and strategy
Developing new products and services
Making effective use of availabletechnology
Accessing external finance
Marketing
2014
2016
Base: All respondents who answered the follow-up survey (N = 715). N.B. The marketing response was a new option in 2016 and, therefore, no comparative data are available.

42 Mapping the Social Business Sector in Wales
5 | Social Business Performancecontinued
markets (33% in 2016 vs. 34% in 2014). The proportion ofrespondents reporting having attracted investment toexpand in the previous year has leapt 10 percentage pointssince 2014. There has been a similar increase of enterprisesexpanding into new geographical areas. Taken together,the results indicate a buoyant sector growing at a healthyrate.
5.2 | PerformanceThe respondents were asked about how their organisationhad performed last year, and whether there had been anyparticular indicators of development (Figure 5.2). Inresponse, 84% of organisations reported that they hadattracted new customers or clients, a statistically significantincrease of 24 percentage points since the 2014 research.Comparable proportions had developed new products andservices (both samples at 49%) and diversified into new
/businesswales.gov.wales/socialbusinesswales
Figure 5.2: In the last 12 months, has your organisation…?
Attracted new customers or clients
0 10 20 30 40 50 60 70 80 90 100%
Developed new products and services 49%
49%
Diversified into new markets33%
Attracted investment to expand18%
28%
Expanded into new geographical areas16%
21%
Won business as part of a consortium4%
8%
None of these11%
7%
17%
4%
4%
2%
2%
1%
1%
1%
Other
Replicated or franchised
Merged with another organisation
Acquired another organisation
2014
2016
Base: All respondents who answered the follow-up survey in 2016 (N = 715) compared with 2014 (N = 242).‘Other’ responses included partnership working (n = 9), works in development (n = 4), restructuring or changing company status (n = 3), and installation ofnew equipment/change in services (n = 3).
34%
60%
84%

43 Mapping the Social Business Sector in Wales
Enterprises that diversified into new markets in the pastyear were asked to cite examples of these. Responses wereextremely varied, with the largest proportion (19%) havingexpanded operations to incorporate new client groups inthe past year.
The subsequent chart (Figure 5.3 below) presents matchedrespondents from both the 2014 and 2016 survey andillustrates very similar patterns to those outlined above,with a significant, striking jump in the proportion ofrespondent organisations describing that they hadattracted new customers or clients over the last 12 months,thereby providing further evidence of strong performanceacross the sector.
/businesswales.gov.wales/socialbusinesswales
Figure 5.3: In the last 12 months, has your organisation…? –matched respondents from the 2014 and 2016 surveys
Attracted new customers or clients
0 10 20 30 40 50 60 70 80 90 100%
Developed new products and services 48%
50%
Diversified into new markets30%
Attracted investment to expand17%
27%
Expanded into new geographical areas16%
21%
Won business as part of a consortium4%
8%
Replicated or franchised4%
4%
1%
1%
1%
3%
10%
7%
21%
4%
Merged with another organisation
Acquired another organisation
None of these
Other
2014
2016
Base: All respondents who answered both the 2014 follow-up survey and the 2016 follow-up survey. N = 160, 2016 and N = 160, 2014.
32%
61%
87%

44 Mapping the Social Business Sector in Wales
5 | Social Business Performancecontinued
increasing evidence of local authorities and other publicsector bodies looking to withdraw from delivering.
Responding social businesses who reported havingattracted new customers or clients in the past year wereasked how they had achieved this. Figure 5.5 belowillustrates the importance of word of mouth/reputation,whilst marketing, particularly digital marketing, has alsoplayed a prominent role in facilitating this expansion.
On a similar basis, where respondents describeddeveloping new products or services they were asked toexpand upon these points slightly. The responses havebeen categorised and are presented in Figure 5.4 below.The most commonly cited elements (education/trainingprovision, leisure/culture activity and support services) areall elements that may have been developed in response topublic sector austerity measures, with associated
/businesswales.gov.wales/socialbusinesswales
Figure 5.4: What new products and services have you developed? (Open response, coded)
Education/Training 19%
Leisure/cultural activity 19%
Support service/Activity 19%
Retail product 17%
Retail service 13%
Non-specified 9%
Refurbishments/upgrading/new building/aspect 7%
Business support service/activity 3%
Environmental 2%
0 2 4 6 8 10 12 14 16 18 20%
ase: All respondents who reported the development of new products and services. N = 347.
Figure 5.5: Please explain how you have attracted new customers or clients
Word of mouth /Reputation 28%
Digital marketing 18%
New product or service/Expansion 16%
Going out to potential customers/direct marketing 12%
Press/magazine/radio/flyers/posters/advertisement 10%
Partnerships/contracts 10%
Nature off business/On-going 10%
Networking 7%
Marketing (non-specific)
Referrals
Other
7%
6%
4%
0 5 10 15 20 25 30 35 40%

45 Mapping the Social Business Sector in Wales
5.2.2 | Securing ContractsThe survey results show that 41% of social businesses inWales who were able to respond stated that theirorganisation was registered on the Sell2Wales website(10% of respondents were unsure whether they areregistered), which is a very similar rate of response to thatof the 2014 survey. Figure 5.7 below compares theproportion of respondents registered on Sell2Wales bybusiness size (turnover). The chart highlights the clearrelationship between business size and propensity toregister for Sell2Wales.
5.2.1 | Areas of ExpansionWhere respondents described expanding into newgeographical markets (21%, 150/714) they were asked wherethese markets were located. Figure 5.6 below shows thedistribution of the geographical areas into whichorganisations have expanded, and illustrates that whilstthe majority of expansion has been within Wales, almosthalf (42%) have expanded into the home nations and onein seven has expanded their organisation overseas.
/businesswales.gov.wales/socialbusinesswales
Figure 5.6: Please tell us what geographicalareas you have expanded into
0
10
20
30
40
50
60
70
80
90
100
%
87%
42%
14% 14%
LocalAuthorities
in Wales
Elsewhere in theUK, excluding
Wales
Elsewhere in theEU, excluding
the UK
Elsewhereworldwide,
excluding EU
Base: 150 respondents who had expanded into new geographical areas.
Figure 5.7: Are you registered on the Sell2Waleswebsite by company size (turnover)?
0
10
20
30
40
50
60
70
80
90
100
%
31%
41%
51%
60%
68%
81%
70% 70%
88%
Base: All respondents who provided turnover details and knew whether theywere registered on Sell2Wales. N = 748.
£25,
000
–£5
0,00
0
£50,
001 –
£100
,000
£100
,001
–£2
50,0
00
£250
,001
–£5
00,0
00
£500
,001
–£1
m
£1.0
1m –
£2.5
m
£2.5
1m –
£5m
£5.m
–£1
0m
>£10
m

46 Mapping the Social Business Sector in Wales
5 | Social Business Performancecontinued
5.3 | Promotional ActivityMost organisations actively promote their status as socialbusinesses in the marketing of their services either to agreat extent (45%) or to some extent (32%) (collectively aproportion that mirrors responses to the 2014 survey),suggesting that those who recognise themselves as socialbusinesses are proud of the brand and continue toperceive that it resonates with the markets they serve.
As for promotion over social media, over half of socialbusinesses are active on both Facebook and Twitter (58%).Nearly a quarter (23%) use Facebook alone, whilst 15% ofrespondents use neither.
5.2.3 | Joint Bidding Nineteen per cent (143/726) of social businesses haveentered into joint-bidding arrangements with otherorganisations to tender for public sector work (a decreasefrom 40% in 2014), although only 3% report that they do soregularly. Of the organisations who entered into joint-bidding arrangements at least once, the most commontypes of organisations with which social businesses partnerare co-operatives or employee-owned businesses (48%,69/143) or other third sector businesses (43%, 61/143).
/businesswales.gov.wales/socialbusinesswales
Figure 5.8: Are you on Twitter or Facebook?
0
10
20
30
40
50
60
%
58%
23%
15%
2%
BothFacebook
and Twitter
Facebook only Neither Twitter only
Base: 804 respondents.

47 Mapping the Social Business Sector in Wales /businesswales.gov.wales/socialbusinesswales
Most organisations actively promote theirstatus as social businesses in the marketingof their services either to a great extent (45%) or to some extent (32%).

48 Mapping the Social Business Sector in Wales
6 | Looking to the Future
6.1 | Expectations and OptimismThe majority of our sample of social businesses arepositive about their immediate future, with 69% expectingturnover to increase in the next two to three years, andonly 6% anticipating that it will decrease. Interestingly, thisis an identical breakdown of responses in the previous2014 survey and suggests the perception of buoyancy inthe sector in the forthcoming years. The most commonmeans of achieving this growth was given as attractingnew customers or clients (46% of respondents) anddeveloping new products and/or services (31%). Lesscommon are plans to attract investment to expand (15%)and diversify into new markets (12%).
Just 3% of those respondent businesses who earn over50% of their turnover through trade expect turnover todecrease over the next two to three years, compared to10% of respondent businesses who secure less than 50%of their turnover through trade.
Key findings+ Sixty-nine per cent of respondent businesses expect
turnover to increase over the next two to three years,while 6% expect it to decrease — these proportionsmirror the responses to the 2014 survey
+ The lack of/poor access to funding was the mostcommonly identified constraint on business growth;over half of respondents identified barriers other thanthose offered in the survey, which most commonlyrelated to insufficient staffing/volunteers, the impactof Brexit, and public sector austerity measures
+ When asked what support they required to helpsustain/grow their business the most commonresponses related to support with grant applications,marketing and finance
+ Financial support was most commonly sought fordevelopment projects (amongst 53% of businessrespondents who had sought financial support)
/businesswales.gov.wales/socialbusinesswales
Figure 6.1: Turnover expectations for the nexttwo to three years
Increase 69%
Stay the same 25%
Decrease 6%

49 Mapping the Social Business Sector in Wales
To test the accuracy of these trends, comparisons ofrespondent businesses matched from both surveys havebeen undertaken (see Figure 6.3). The data illustrate similarpatterns to the responses to the wider survey with tangiblefalls in finance/funding (from 43% to 37%) but increases intime pressures (9% to 18%), the lack of marketing expertise(8% to 17%) and, as a reversal of the trend above, anincrease in the proportion citing the economicclimate/recession as a barrier (19% to 25%).
6.2 | Barriers to Growth and FundingRespondents were asked “what are the three mostsignificant barriers to your organisation’s sustainabilityand/or growth?”. Figure 6.2 (see next page) presents thedistribution of the responses received and compares theseto the responses from the 2014 survey. The responses showthat other barriers that were not included in the listpresented were most commonly identified by respondentbusinesses (further exploration of these can be found onthe following pages). Financial barriers were cited by onethird of respondents. Whilst this clearly remains a barrier,the proportion describing as such has fallen significantlyfrom 44% of respondents. Conversely, the proportionciting time pressures as a barrier to their growth hasdoubled from 12% in 2014 to 24% in 2016. This appears toreinforce the confidence that social businesses have intheir business capabilities (see Figure 5.1 in the previoussection).
/businesswales.gov.wales/socialbusinesswales
The proportion citing time pressures as abarrier to their growth has doubled from 12% in 2014 to 24% in 2016

50 Mapping the Social Business Sector in Wales
6 | Looking to the Futurecontinued
/businesswales.gov.wales/socialbusinesswales
Figure 6.2: Self-reported barriers to sustainability or growth for social businesses
Other30%
0 10 20 30 40 50 60%
51%
Lack of/poor access to finance/funding
44%
33%
Time pressures24%
Economic climate/recession29%
22%
Cash flow18%
18%
Lack of marketing expertise16%
Understanding/awareness of socialenterprise amongst general
public/customers
3%
9%
Prohibitive commissioning/procurement with public services
Difficult to attract appropriatelyskilled/experienced
non-executive directors or trustees
Regulatory issues (e.g. health and safety)
Affordability of finance
None/no barriers
Understanding/awareness of socialenterprise amongst banks and support organisations
Lack of appropriate managerialskills/experience
Lack of financial expertise
Lack of access to/poor advice/business support
5%
8%
9%
7%
2%
4%
7%
4%
4%
3%
3%
7%
3%
2%
3%
3%
3%
2014
2016
12%
12%

51 Mapping the Social Business Sector in Wales /businesswales.gov.wales/socialbusinesswales
Figure 6.3: Self-reported barriers to sustainability or growth for social businesses –matched respondents from the 2014 and 2016 surveys
Lack of/poor access to finance/funding
Economic climate/recession
43%
0 10 20 30 40 50 60%
37%
Time pressures
19%
25%
Cash flow
18%
Lack of marketing expertise
13%
18%
Prohibitive commissioning/procurement with public services
8%
17%
Lack of financial expertise
9%
Understanding/awareness of socialenterprise amongst general
public/customers
2%
6%
Difficult to attract appropriatelyskilled/experienced
non-executive directors or trustees
Regulatory issues (e.g. health and safety)
Lack of appropriate managerialskills/experience
Affordability of finance
Understanding/awareness of socialenterprise amongst banks and support organisations
Lack of access to/poor advice/business support
3%
6%
8%
6%
2%
2%
3%
2%
2%
4%
4%
4%
4%
7%
2014
2016
9%
4%

52 Mapping the Social Business Sector in Wales
6 | Looking to the Futurecontinued
+ Thirty-nine respondents (11% of “other” barriers)outlined how insufficient staffing and volunteercapacity/resources and the associated inability to recruitappropriately skilled staff to their organisation acted asa constraint on the sustainability and growth of theirorganisation
+ Thirty-four respondents (9% of “other” barriers)referred to public sector cuts as a key barrier to thegrowth of their business.
The likelihood of barriers amongst respondent businesseswas compared with business size (turnover) and theproportion of income that a social business obtainsthrough trade to see if any patterns emerged amongst thesector. The patterns identified are presented in the tablebelow.
Furthermore, the nature of barriers described in the“other” category has been analysed and identifies severalcommon themes:+ Forty-three respondents (12% of those who described an
“other” barrier) raised concerns regarding governmentpolicy, specifically the likely impact arising from “Brexit”
/businesswales.gov.wales/socialbusinesswales
Barrier Proportion of Social Businesses Proportion of Social Businesseswith T/O <£0.5m with T/O >£0.5m
Lack of marketing expertise 17% 6%
Prohibitive commissioning/ 4% 17%procurement with public services
Cash flow 19% 7%
Barrier Proportion of Social Businesses Proportion of Social Businesses with <50% of Income through Trade with >50% of Income through Trade
Lack of/poor access 44% 25%to finance/ funding
Forty-three respondents (12% of those whodescribed an “other” barrier) raised concernsregarding government policy, specifically thelikely impact arising from “Brexit”
Table 6.1: Barrier patterns when comparing size/income source of social businesses

53 Mapping the Social Business Sector in Wales
Twenty-one per cent of respondents referred to the needfor support with marketing.
Marketing Support “Specialist support in marketing and mentoring.Promotion of our events.”
“Special training in marketing would be really helpful, aswe lost the person who did our marketing due to lack offunding.”
A further 20% of respondents referred to the need forfinancial support to address the barriers that they haveencountered.
Finance“Revenue funding to hire a treasurer/management staff tohelp us create budgets and future plans.”
“The availability of core funding which was on a mid-tolong-term basis. This embraces the other two barriers. If you have funding you can secure personnel.”
Finally, 23% of respondents were more generic in theirrequests, asking for any type of support/assistance, whilstapproximately 13% of respondents couldn’t think of anysupport that would help overcome the barriers that theycurrently encounter.
6.3 | EnablersRespondents were asked in an open-answer questionabout the support they felt would best address the barriersto the sustainability or growth they identified.
Twenty-five per cent of respondents felt that meetingfunders or, alternatively, receiving support in their fundingapplications would assist them in better understanding therequirements for securing funding.
Meeting Funders/Grant Application Support“I would like more support for funding. I would like us tohave more information about grant availability andapplication process. Some practical support to help us gainmore income.”
“Opportunities to meet funders is the main support weneed. Support with the grant application process.”
/businesswales.gov.wales/socialbusinesswales
25%Twenty-five per cent ofrespondents felt thatmeeting funders or,alternatively, receivingsupport in their fundingapplications would assistthem
21%Twenty-one per cent ofrespondents referred to theneed for support withmarketing
23%23% of respondents weremore generic in theirrequests, asking for any typeof support/assistance

54 Mapping the Social Business Sector in Wales
6 | Looking to the Futurecontinued
Financial support was most commonly sought fordevelopmental projects or new schemes (53%), a likelyreflection on the structure and entrepreneurialism in thesector currently, whilst just over a quarter (27%) soughtworking capital to cover cash flow, followed by propertypurchasing and refurbishment (25%) and acquisition ofequipment and/or vehicles (20%).
Of the organisations that did not apply for finance in thelast 12 months, 60% (an increase from 56% in 2014) reportthat this decision was made because they did not requireit. Of note, only 6% said that they were hindered inapplying for appropriate finance due to the lack ofknowledge of where to find it, compared with one fifth(20%) in 2014.
6.4 | Securing Financial SupportSixty-one per cent of social businesses in our sample hadapplied for new sources of finance for their organisationsin the past 12 months, a decrease from 66% in 2014. Grantswere overwhelmingly the most popular form of fundsapplied for (90%), over loans (8%, an increase from 4% in2014). Typically, applications were made to a grant-makingtrust or foundation (59% of applications), governmentfunds (29%) or a local authority (26%). Interestingly, whileapplications for grants have increased since 2014 (59% vs.50%), applications to government and local authoritiesshow comparative decreases (see Figure 6.4 below). This islikely to be in response to the reduction in the availabilityof public sector funding.
/businesswales.gov.wales/socialbusinesswales
Figure 6.4: Where did you apply for finance?)
Grant makingtrust or
foundation
Governmentfund
Local authority0
10
20
30
40
50
60
%
50%
59%
36%
29%
32%
26%
Base: Respondents who had applied for new sources of finance for their organisations in the past 12 months (N = 436) compared with 2014 figures (N = 163).
2014
2016

55 Mapping the Social Business Sector in Wales /businesswales.gov.wales/socialbusinesswales
Financial support was most commonly sought for developmental projects or new schemes (53%), a likely reflection on the structure andentrepreneurialism in the sector currently.

56 Mapping the Social Business Sector in Wales
7 | Summary of Findings
Scale of the SectorRespondents to the survey have tended to be larger,employ more people, and benefit from a higher level ofvolunteering than those to previous surveys whichcollectively have led to large increases in estimations ofthe scale of the sector. The social business sector in Walesis estimated to:
+ Employ an estimated 40,800 people in paid jobs
+ Provide between 48,000 and 58,000 volunteeropportunities
+ Generate income/sales of around £2.37bn annually in the Welsh economy.
Throughout the survey there are indications of a growingand maturing social business sector. The proportion ofbusinesses earning more of their income through tradecontinues to grow. Across the entire survey, 50% ofrespondent businesses described earning at least 50% oftheir income through trade. Amongst those businesseswho responded to both the 2014 and 2016 surveys therehas been an increase in the proportion earning over half oftheir income from trade (from 57% in 2014 to 66% in 2016).Conversely, the proportion of respondent businessesdescribing being hindered by the inability to secureappropriate finance has fallen, with a third of respondentbusinesses describing poor access to funding as a barrierto sustainability/growth of their organisation.
Size and Location of Social BusinessesThe collation and verification of data on social businessesin Wales has identified 16% more businesses in the sectorthan previously, with current estimates suggesting that1,698 businesses are operating in the sector.
Whilst these figures may, in part, be a reflection of organicgrowth of the sector (through business start-ups), it is also(given the age of businesses surveyed) likely that anincrease may be a result of a more thorough identificationand verification research exercise.
The mapping of the identified social businesses shows thatthese organisations are often found in areas ofdeprivation, including along the Valleys and around theHeads of the Valleys (particularly in and around MerthyrTydfil), in addition to Swansea and Llanelli. Furthermore,social businesses most commonly describe their objectiveas supporting their local community and tend not tooperate over too large a geography. Collectively, this showsa tendency for social businesses to establish themselves inlocations in which they can respond to an identified need.
/businesswales.gov.wales/socialbusinesswales
16%The collation and verificationof social businesses in Waleshas identified 16% morebusinesses in the sectorthan previously
40,800Employ an estimated 40,800people in paid jobs
£2.37bnGenerate income/sales ofaround £2.37bn annually in the Welsh economy

57 Mapping the Social Business Sector in Wales
An expanding sector is not without its headaches, however,with the proportion of respondent businesses identifyingtime pressures as a growth constraint on their businesshaving doubled when compared to the 2014 survey, whilsta further 39 respondents cited staffing/volunteeringresources as a constraint on their business.
Similarly, there is a concern about the trading environmentfor social businesses, with the issues arising from Brexitand, in particular, its impact on European fundingalongside public sector cuts identified as likely constraintson social businesses going forward.
Despite evidence of a growing, maturing sector, theevidence identified an apparent fall in the proportion ofsocial businesses seeking to measure their social impact.The data show that 39% of respondent businesses do notmeasure their social impact, which is far higher than theproportion in 2014 (8%). Further analysis of theseresponses may help to identify the influential factorsbehind this change.
Collectively, therefore, there is clear evidence of a growing,increasingly confident and entrepreneurial social businesssector that is built upon strengthening foundations. Thechallenges emerging are primarily those synonymous witha growing sector, particularly in relation to resource(staffing/volunteer) constraints. Interestingly, however, thenature of support desired is largely familiar, with anemphasis on support in applying for finance and onsupport in relation to marketing and promotional activitiesfor social businesses.
Recent Trends and ExpectationsEighty-four per cent of respondent businesses haveattracted new customers or clients in the last 12 months,whilst 24% have attracted investment to expand during thesame period. When businesses who responded to both the2014 and 2016 surveys are compared, there is a large jumpin the proportion of the same businesses stating that theyhad attracted new customers or clients (from 61% to 87%).Collectively, this evidence illustrates that social businessesare being very successful in growing the markets that theyserve.
Where external investment had been sought, it was mostcommonly in relation to developmental projects for newschemes, again indicating confidence and expansionwithin the sector. Confidence in the sector is, again,evident where respondent businesses were asked abouttheir expectations of turnover for the next 2–3 years. Morethan two thirds (69%) expected turnover to increase duringthat period, whilst just 6% of respondents expectedturnover to decrease.
Businesses are seeking to grow through accessing newmarkets (geographical), serving new customers, andthrough the development of new products or services.Interestingly, education/training provision, leisure/cultureactivity and generic support services were identified as theareas in which social businesses were looking to developnew products/services. These are all areas from which thepublic sector is typically looking to withdraw in response toausterity measures, and suggest that social businesses areactively positioning themselves to respond to theseopportunities.
/businesswales.gov.wales/socialbusinesswales
24%24% have attractedinvestment to expandduring the last 12 months
69%Sixty-nine per cent of socialbusinesses expect turnoverto increase over the next twoto three years
39%The data show that 39% ofrespondent businesses donot measure their socialimpact

58 Mapping the Social Business Sector in Wales
Annex 1: Partner Organisations
The following organisations were extremely helpful inassisting with the mapping exercise by providing lists ofsocial businesses from their respective clientlists/databases.
+ Bangor Business School, Bangor University + Blaenau Gwent County Borough Council + Carmarthenshire County Council+ Ceredigion County Council+ Development Trusts Association Wales+ Gwynedd Community Enterprises Forum + Merthyr Tydfil County Borough Council+ WCVA+ Wrexham County Borough Council
/businesswales.gov.wales/socialbusinesswales

59 Mapping the Social Business Sector in Wales
Annex 2: Phase 1 Survey
Section 2 – Organisation overview
Social business is a term used to describe businessesoperating within the social economy, which could includeemployee-owned businesses, co-operatives or socialenterprises, amongst others. Social businesses are definedas “businesses with primarily social objectives whosesurpluses are principally reinvested for that purpose in thebusiness or community, rather than being driven by theneed to maximise profit for shareholders and owners”.Does this describe your organisation? Is your organisationindependent, i.e. not a wholly owned subsidiary or tradingarm of another organisation, i.e. a co-operative, or anemployee-owned business?
[A co-operative is an autonomous association of personsunited voluntarily to meet their common economic, socialand cultural needs and aspirations through a jointly ownedand democratically controlled enterprise. Employee-owned businesses are totally or significantly owned bytheir employees, through either direct share ownership, atrust, or a combination thereof.]
Q1. Can I just check whether you perceive yourorganisation to be a Social Business? (Please tick onlyone)• Yes• No
Q2. Which, if any, of the following terms would you useto describe your organisation? (Please tick all thatapply)• Social Enterprise (a business with primarily social
objectives and whose surpluses are reinvested for thatpurpose in the business or in the community, ratherthan being driven by the need to deliver profit toshareholders and owners).
• Mutual (an organisation owned by, and run for thebenefit of, their current and future members).
• Social Firm (where 25% of your workforce are disabledor disadvantaged and where 50% of your income ismade through commercial activity).
Social Businesses in Wales Survey
Section 1 – Contact information
Contact Information – please can you confirm if the detailsbelow are correct and amend if necessary
• Trading name of your Social Business• Business postal address of your Social Business• Business postcode of your Social Business• Business location of your Social Business• Business phone number of your Social Business• Business email address of your Social Business• Business website of your Social Business
S1. Can I check what your role is within the organisation? • Owner• Managing Director / CEO• Partner Finance Director / Manager• HR Director / Manager• Other director• Departmental Manager• Other manager• Administrator / Secretary• Non-executive Director / Trustee• Other, please specify
/businesswales.gov.wales/socialbusinesswales

60 Mapping the Social Business Sector in Wales
Annex 2: Phase 1 Surveycontinued
Section 3 – Social and environmental aims
Q5. Does your organisation have a clear social orenvironmental mission that is set out in its governingdocuments? (Please tick only one)• Yes• No• Don’t know
Q6. What are your organisation's main social and/orenvironmental objectives?
Q6a. Please code below:• Improving a particular community• Creating employment opportunities• Supporting vulnerable people• Improving health and well-being• Promoting education and literacy• Addressing social exclusion• Protecting the environment• Addressing financial exclusion• Supporting vulnerable children and young people• Providing affordable housing• Supporting other social enterprises/organisations• Don't know
• Charity (“a charitable organisation that raises incomemainly through grants and fundraising activities”).
• Supported business or Supported EmploymentProgramme whose main aim is the social andprofessional integration of disabled or disadvantagedpersons, where at least 30% of the employees aredisabled or disadvantaged workers.
• Co-operative (an association of people united to meetcommon economic and social needs through a jointlyowned enterprise. A co-operative is organised by andfor its members, who come together to provide a sharedservice from which they all benefit).
• Other type of third sector body, please specify
Q2a. Please enter where applicable:• Company / CIC Number• Charity Number• Society Number
Q3. Please outline your organisation’s legal status.[Prompt using answers below if required]
Q3a. Please code below:• Company Limited by Guarantee (CLG)• Company Limited by Shares (CLS)• Industrial and Provident Society (IPS) –
Co-operative Society• Industrial and Provident Society (IPS) –
Community Benefit Society• Community Interest Company (CIC)• Sole proprietorship• Partnership• Other, please specify
Q4. Could you confirm if your organisation is also:(Please tick all that apply)• Part of a chain of social businesses• The trading arm of a charity [Go to 4a]• A subsidiary of a private sector organisation [Go to 4a]• A trading arm of a public sector organisation [Go to 4a]• None of the above• Don't know
Q4a. Please state who your parent organisation is.
/businesswales.gov.wales/socialbusinesswales

61 Mapping the Social Business Sector in Wales
Q11. What do you do with any surplus/profit that yougenerate? (Please tick all that apply)• Reinvest to grow/sustain the business• Utilise for community, social, environmental orcharitable benefit• Distribute to members• Move to a trust on behalf of the employees• Other, please specify
Q12. In which areas of Wales does your organisationoperate? (Please tick all that apply)• All of Wales• Bridgend • Blaenau Gwent• Caerphilly• Cardiff• Carmarthenshire • Ceredigion• Conwy • Denbighshire• Flintshire • Gwynedd• Isle of Anglesey• Merthyr Tydfil• Monmouthshire• Neath Port Talbot• Newport• Pembrokeshire • Powys• Swansea • Torfaen• Rhondda Cynon Taf• Vale of Glamorgan • Wrexham
Section 4 – Trading-related information
Q7. What year did your organisation start trading?(Please note that this also includes primary purposetrading, service level agreements, etc.)
Q8. What is the main business activity of yourorganisation? What goods or services do you provide?(Please ensure that you have a clear and accuratedescription to enable us to identify in which sector theyoperate)
Q9. What are the main sources of income that yourorganisation receives? (Please tick all that apply)• Trading with the public sector (e.g. through service level
agreements) • Trading with the private sector • Trading with third sector organisations (e.g. charities,
voluntary groups) • Trading with other social enterprises • Trading with the general public • Grants from the government/local authority/
public sector • Other grants • Donations• Don’t know• Other, please specify
Q10. Approximately how much of your organisation'stotal income is generated from trading activities, i.e. anyactivity that generates an income, including servicelevel agreements, primary purpose trading, etc.? (Pleasetick only one)• 0% to 15%• 16% to 25%• 26% to 50%• 51% to 75%• 76% to 100%• Don't know
/businesswales.gov.wales/socialbusinesswales

62 Mapping the Social Business Sector in Wales
Annex 2: Phase 1 Surveycontinued
Q17. Turnover/total income
Q17a. Approximately what % of your turnover is fromyour Wales-based offices?
Q18. Does your organisation operate on a membershipbasis? (Please tick only one)• Yes• No • Don’t know
Q18a. How many members do you have?
Q18b. Does your organisation elect members to yourmanagement board? (Please tick only one)• Yes• No • Don’t know
Q13a. Does your organisation have any offices outside ofWales?• Yes• No
Q14. Does your organisation trade in other areas of theUK? (Please tick only one)• Yes• No • Don’t know
Q15. Does your organisation export overseas? (Pleasetick only one)• Yes• No • Don’t know
Q16. Please could you confirm your organisation’sapproximate turnover/total income in the last financialyear by ticking one of the bands below, or by writing theapproximate number in the box below: (Please tick onlyone) • Under £25,000• £25,001 to £50,000• £50,001 to £100,000• £100,001 to £250,000• £250,001 to £500,000• £501,000 to £1m• £1.01m to £2.5m• £2.51m to £5m• £5.01m to £10m• More than £10m• Not traded for a complete financial year• Made a loss• Rather not say
/businesswales.gov.wales/socialbusinesswales

63 Mapping the Social Business Sector in Wales
Q22. Approximately how many of your paid workforcelive within 10 miles of your office location?
Q23. Approximately what proportion of your paidworkforce is made up of people who are disadvantagedin the labour market (e.g. long-term unemployed, ex-offenders, people with disabilities, etc.)?
Q24. Approximately how many people did you employ(in paid employment) in your Wales-based offices 12months ago?
Q25. How many people do you expect to employ (in paidemployment) in your Wales-based offices in the next 12months?
Section 5 – Staff/volunteers
Q19. Including yourself, if applicable, approximately howmany paid staff are currently employed in yourorganisation as a whole in Wales?• Full-time• Part-time
Q20. How many volunteers does your organisationcurrently have in Wales?
Q21. Over the course of the last 12 months, has yourorganisation employed any of the following?
Yes No
Support workers
Short-term work placements
Apprentices
Freelancers
Seasonal workers
Zero-hour contracts
Other, please describe nature of role
/businesswales.gov.wales/socialbusinesswales

64 Mapping the Social Business Sector in Wales
Annex 2: Phase 1 Surveycontinued
Q30. Would you also be happy for the information thatyou have just provided to be passed on to BusinessWales to populate their new online business directory? • Yes• No
Q31. In the future, the Wales Co-operative Centre wouldlike to contact your organisation with information abouttraining, events and other activities. Is this okay? • Yes• No
Q32. We have a few more additional questions that wewould like to ask. Would you be happy to speak to mefor a little bit longer — it will only take 5 to 10 minutes?Or would you be happy for me to call you back at a moreconvenient time? • Yes, I am happy to answer a few more questions now –
go to link for in-depth survey
• Yes, I am happy to answer more questions at a moreconvenient time – arrange callback
• I do not want to be contacted in the future for atelephone interview
Section 6 – Final few questions
Q26. Are you registered on Sell2Wales? (Please tick onlyone)• Yes• No • Don’t know
Q27. Are you on Twitter or Facebook? • Yes, on both – please record your Twitter handle below• Yes, on Twitter only – please record your Twitter handle
below• Yes, on Facebook only• No, not on either• Don't know• Please record your Twitter handle here:
Q28. Are you registered for VAT? (Please tick only one)• Yes• No • Don’t know
Q29. We would like to include your organisation’scontact information and business activity in an onlinedirectory of social businesses in Wales, which will beheld by the Wales Co-operative Centre. Is this okay?(This will include only your organisation’s name,telephone number, email address and website address) • Yes• No
/businesswales.gov.wales/socialbusinesswales

65 Mapping the Social Business Sector in Wales
Annex 3: Follow-up Survey
Social Businesses in Wales Survey – Follow-up interview
Q1. I’d like to ask about the range of tasks that you needto carry out when running a business, and for you to tellme how capable you think your organisation is of doingthem. Therefore, including any external expertise thatyou might use, on a scale of 1 to 5, where 1 is rated asvery poor and 5 as very strong, how capable would yousay your business is of…?
Q2. Thinking about the last 12 months, has yourorganisation…? • Diversified into new markets• Expanded into new geographical areas• Developed new products and services• Replicated or franchised• Attracted new customers or clients• Attracted investment to expand• Acquired another organisation• Merged with another organisation• Won business as part of a consortium• None of these• Other, please specify
Q2a. Other, please specify and explain how/what.
Q2b. Please describe any new markets into which youhave diversified.
/businesswales.gov.wales/socialbusinesswales
1 2 3 4 5
People management, such as recruitment and delegation
Developing and implementing a business plan and strategy
Developing new products and services
Making effective use of available technology
Accessing external finance
Financial management
Marketing

66 Mapping the Social Business Sector in Wales
Annex 3: Follow-up Surveycontinued
Q4. How does your organisation plan on achieving thisincrease…? • Diversifying into new markets• Expanding into new geographical areas• Developing new products and/or services• Replicating or franchising• Attracting new customers or clients• Attracting investment to expand• Acquiring another organisation• Merging with another organisation• Winning business as part of a consortium• None of these• Other, please specify
Q5. Has your organisation applied for new sources offinance for your organisation in the past 12 months? • Yes• No• Don’t know
Q6. For which form of finance did you apply?• Grant• Loan• Overdraft• Mortgage• Equity• Leasing/HP• Crowdfunding • Don’t know • Other, please specify
Q7. Where did you apply for this finance?• Bank • Social bank • Building society • Credit union • Specialist social investment organisation • Government fund • Local authority • Venture capitalist • Grant-making trust or foundation • Peer-to-peer/crowdfunding website or organisation • Friends and/or family • Community Development Finance Institution (CDFI) • Don't know• Other
Q2c. Please tell us the geographical areas into which youhave expanded:
Yes No
Local authorities in Wales
Elsewhere in the UK, excluding Wales
Elsewhere in the EU, excluding the UK
Elsewhere worldwide, excluding the EU
Q2d. Please tell us what new products and services youhave developed.
Q2e. Please explain more about this (replicated orfranchised).
Q2f. Please explain more about this (how you haveattracted new customers or clients/from where).
Q2g. Please explain more about this (attracted newinvestment from where).
Q2h. Please explain more about this (acquired anotherorganisation).
Q2i. Please explain more about this, who/why (mergedwith another organisation).
Q2j. Please explain more about this (won business aspart of a consortium). With whom did you partner, andwhy?
Q3. Thinking about the next 2–3 years, do you think yourturnover will increase, decrease or stay the same…?• Increase • Decrease • Stay the same
/businesswales.gov.wales/socialbusinesswales

67 Mapping the Social Business Sector in Wales
Q11. What main tool or method does your organisationuse to measure your social impact?• None• Social Return on Investment (SROI) • Social Accounting and Audit (SAN) • Outcomes Star • Local Impact Measurement Tool • Social Impact Tracker • Your Value • Self Smart • Lamplight • Rickter Scale • Ecco • Questant Process • Own method, please specify • Don't know• Other, please specify
Q12. To what extent has your organisation entered intojoint-bidding arrangements, i.e. as a consortium orpartnership to tender for public sector work?• Regularly enter into joint-bidding arrangements • Have occasionally entered into joint-bidding
arrangements • Have entered into joint-bidding arrangements once • Have never entered into joint-bidding arrangements –
go to Q15 • Don’t tender for public sector work – go to Q15 • Don't know
Q13. If you have entered into joint-biddingarrangements, with whom are these arrangements?• Other social businesses (such as social enterprises,
mutuals, co-operatives or employee-owned businesses)• Other third sector organisations • Private sector organisations • A combination of the above – describe • Other, please specify
Q14. When entering into joint-bidding arrangements,how many partner organisations are typically involved?• More than 5, including your organisation • 3–5, including your organisation • 2, including your organisation • It varies from contract to contract
Q8. For what are you using this finance or capital?• Working capital (e.g. to cover cash flow)• Development capital (e.g. to develop new services or
plans)• Equipment/vehicle acquisition• Property purchase/refurbishment • To finance payment by results contracts • Don't know • Other
Q9. Why has your organisation decided not to apply fornew sources of finance or capital in the past 12 months?• No finance required • Cost of finance • Knowing where to find appropriate finance • Confidence and skills to take on investment finance • Restrictions of legal form • Thought you would be rejected • No security • Willingness of board or trustees to take on the risk • Economic conditions • Don't know• Other, please specify
Q10. To what extent does your organisation promoteyour social business status in marketing itsgoods/services?• To a great extent• To some extent • Not very much • Not at all • Not applicable • Don’t know
/businesswales.gov.wales/socialbusinesswales

68 Mapping the Social Business Sector in Wales
Annex 3: Follow-up Surveycontinued
Q16. What support would best address the barriers tosustainability or growth that you identified? (Openanswer, prompt if required, i.e. training, mentoring,opportunities to meet funders, specialist support inmarketing, finance, etc.)
Q17. Finally, could you please tell me how many of yourorganisation’s directors or leadership team, includingtrustees and non-executive directors, fall into thefollowing categories?
Male
Female
White British
White other
Asian or Asian British
Black or Black British
Mixed
Chinese
Other
16–24
25–44
45–64
65+
Q15. What are the three most significant barriers to yourorganisation’s sustainability and/or growth currently? • Lack of/poor access to finance/funding • Affordability of finance • Cash flow • Lack of appropriate managerial skills/experience • Difficult to attract appropriately skilled/experienced
non-executive directors or trustees • Time pressures • Prohibitive commissioning/procurement with public
services • Lack of access to/poor advice/business support • Understanding/awareness of social enterprise amongst
banks and support organisations • Understanding/awareness of social enterprise amongst
general public/customers • Regulatory issues (e.g. health and safety) • Lack of financial expertise • Lack of marketing expertise • Economic climate/recession • None/no barriers
/businesswales.gov.wales/socialbusinesswales
