marketing metrics and roi - marketing sensei - jeffrey research... · marketing metrics and roi how...
TRANSCRIPT

Marketing Metrics and ROI
How to Set Up a Measurement System That Can Double Your Profitability Page 1
Marketing Metrics and ROI: How to Set Up a Measurement System
That Can Double Your Profitability
Small Business Edition: For Owners, CEOs, and Marketing Executives
Joseph Raymond Roy
http://www.marketing-metrics-made-simple.com/index.html
October 7, 2009
Copyright © 2009 by Joseph Raymond Roy. Permission is hereby granted to copy and republish this work, provided attribution is given.

Marketing Metrics and ROI
How to Set Up a Measurement System That Can Double Your Profitability Page 2
Contents Chapter 1 The Measurement Process Page 3 Chapter 2 Defining Your Results Page 11 Chapter 3 Assessing Your Results Page 16 Chapter 4 Tracking Your Results Page 27 Chapter 5 Adjusting Your Program Page 38

Marketing Metrics and ROI
How to Set Up a Measurement System That Can Double Your Profitability Page 3
Chapter 1
The Measurement Process This eBook shows you practical techniques for measuring the results of your marketing program. These techniques will:
1. Help you determine the profitability (ROI, Return on Investment) of your program.
2. Help you adjust your program to achieve the highest possible profitability.
If you have never measured marketing profitability before, this chapter will introduce you to the measurement process. The next four chapters expand on the four steps of the process. If you already have a profitability-measurement system in place, this chapter and the next four chapters may help you strengthen your measurement system and identify profits you’ve overlooked. Most measurement systems unintentionally understate profitability. In a moment, I’ll explain a major reason why. But first, I need to cover something fundamental. I need to define two terms as used throughout this eBook.

Marketing Metrics and ROI
How to Set Up a Measurement System That Can Double Your Profitability Page 4
Definition of the Term “Results” Marketing programs, including advertising and public relations (PR) programs, can produce three types of results:
1. Awareness: The target audience knows something about your company, product or service.
2. Perception: The target audience thinks about your company, product or
service in a certain way.
3. Behavior: The target audience does something (e.g., buys your product or service), or refrains from doing something (e.g., doesn’t boycott your company).
There are effective measurement techniques for each type of result. However, in this eBook you and I are interested primarily in behavior, because only behavior affects profitability directly. In Chapter 2, I discuss awareness-measurement techniques and perception-measurement techniques, but only in connection with behavior-measurement techniques. So, when I use the term “results” without any modifiers, I mean actual behavior. Definition of the Term “Measurement” By “measurement,” I mean a specific four-step process:
1. Defining: Defining the results that your program intends to promote.
2. Assessing: Assessing the dollar values of these potential results.
3. Tracking: Tracking actual results and determining whether your program promoted them.
4. Adjusting: Adjusting your program based on the tracking; doing more of
what works well, and less of what works not so well.
Marketing Metrics and ROI
How to Set Up a Measurement System That Can Double Your Profitability Page 5
In this eBook, I refer to this Defining-Assessing-Tracking-Adjusting process as “the DATA process.” Successful practitioners of results measurement repeat the DATA process continuously. They define, assess, track, and adjust – and keep repeating. On every repetition of the four-step process, they make their programs more profitable, often double or triple, until the programs reach a point where, for all practical purposes, they can’t be optimized any further. One of my clients named this point “optimization nirvana.” Here is a streamlined example of the entire DATA process. In the next four chapters, we’ll discuss the four steps in detail. A Streamlined Example This is an example of a small-business owner who successfully measures and optimizes a marketing program. The owner is a composite of three of my clients, and all names used here are fictitious. Keep in mind that the same process can scale to meet the needs of the largest marketing program; so, no matter how much your company grows, the process will still work. I chose a small-business example in order to introduce the techniques of the DATA process in a simple way. Meet Dr. Mary Smith Mary Smith, D.C., is a chiropractor in Jackson, Michigan, population 36,000. She has one office, which is in a visible, convenient location – in a strip mall on a state highway. Three years ago, she purchased the practice from John Wilson, D.C., who was retiring. Dr. Wilson accepted a ten-year note from Dr. Smith. Now, three years later, many of Dr. Wilson’s former patients are still with Dr. Smith. Several new patients sign up each month – most are patient referrals. Others hear about Dr. Smith from the Yellow Pages or newspaper ads. Still others find her web site, which provides a lot of useful health information.

Marketing Metrics and ROI
How to Set Up a Measurement System That Can Double Your Profitability Page 6
In total, she spends about $22,000 per year on advertising and public relations. She’s making a comfortable living, and her practice is growing steadily, but she still has a lot of space in her calendar. She’d like to take on new patients faster. One Tuesday morning, looking at an especially sparse page in her calendar, she wonders if she should expand her marketing program. But she’s prudent, so before spending any more money, she pauses and asks herself a good question: “What’s working now?” That evening, after she closes the office, she sits down with a yellow pad, a pencil, and a printout of her patient list. She checks off the names of the patients she inherited from Dr. Wilson, and tries to remember how she attracted the others. She’s able to identify the sources of some patients, but not most. She promises herself that, starting tomorrow, she will try to identify the source of every new patient. She plans to do this for six months and then analyze the results, just before the annual cutoff date for Yellow Pages advertising. But this evening, before she leaves the office, she asks herself a few more questions. Defining the Results First she asks: “What’s the purpose of my marketing program?” She writes, “Attract new patients who otherwise might not have become patients. Get them to call the office.” She has defined the specific behavior that her program intends to promote. Her answer is an obvious one, but it’s not the only possible answer. For example, the program could possibly have been designed to persuade her patients to stay with her over a longer period than they do now, or to return for treatment after they’ve lapsed, or to take advantage of additional services such as nutritional counseling. Every one of these behaviors would increase her revenue and profit. But so far, Dr. Smith has determined that she will measure her program based on a single result: attract new patients. She has decided to do only one thing at a time.

Marketing Metrics and ROI
How to Set Up a Measurement System That Can Double Your Profitability Page 7
Assessing the Dollar Value Now she asks herself another question: “What is a new patient worth to me?” First, she writes down the easy part of the answer: “Typical office visit = $40.” For the next part of the answer, she has to spend two hours going through her patient files. She calculates that, on average, each patient comes in twice per month for 30 months – a total of 60 visits. She multiplies 60 times $40. On average, each patient represents $2,400 of revenue. Then she asks, “What’s my incremental cost to serve one new patient?” She figures that the direct cost is only an occasional small expense for heat packs and other supplies. Now, it’s true that she also has overhead costs such as rent, utilities, equipment depreciation, receptionist’s wage and benefits, and the monthly payments to Dr. Wilson. However, the addition of a modest number of new patients won’t increase these costs. She knows that at some point she would need to increase her receptionist’s hours or move to a larger office, but she doesn’t want to grow that large before she pays off her note. So she assumes that all the revenue goes to pretax profit. Therefore the total profit from (the “lifetime value” of) a new patient is $2,400. (By the way, many of us in marketing, advertising and public relations overlook lifetime value. When we calculate the value of a new customer, we use the profit from the first sale, ignoring the value of repeat sales. In many industries, repeat sales generate most – even all – of the profit. This is a major reason we tend to understate our profitability. I’ll cover other reasons in Chapter 3.) Dr. Smith has completed her assessment. She has assessed the dollar value of the kind of behavior that her marketing program intends to promote. Satisfied with her work so far, she goes home.
Marketing Metrics and ROI
How to Set Up a Measurement System That Can Double Your Profitability Page 8
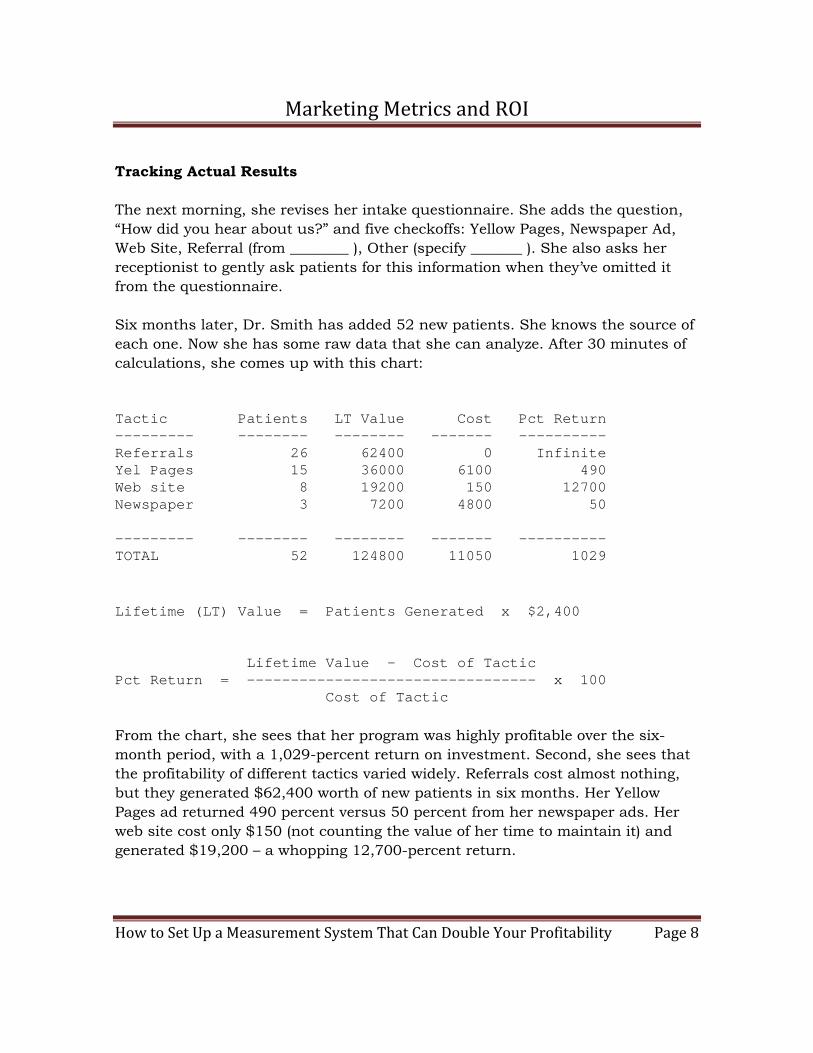
Tracking Actual Results The next morning, she revises her intake questionnaire. She adds the question, “How did you hear about us?” and five checkoffs: Yellow Pages, Newspaper Ad, Web Site, Referral (from ________ ), Other (specify _______ ). She also asks her receptionist to gently ask patients for this information when they’ve omitted it from the questionnaire. Six months later, Dr. Smith has added 52 new patients. She knows the source of each one. Now she has some raw data that she can analyze. After 30 minutes of calculations, she comes up with this chart: Tactic Patients LT Value Cost Pct Return --------- -------- -------- ------- ---------- Referrals 26 62400 0 Infinite Yel Pages 15 36000 6100 490 Web site 8 19200 150 12700 Newspaper 3 7200 4800 50 --------- -------- -------- ------- ---------- TOTAL 52 124800 11050 1029 Lifetime (LT) Value = Patients Generated x $2,400 Lifetime Value - Cost of Tactic Pct Return = --------------------------------- x 100 Cost of Tactic From the chart, she sees that her program was highly profitable over the six-month period, with a 1,029-percent return on investment. Second, she sees that the profitability of different tactics varied widely. Referrals cost almost nothing, but they generated $62,400 worth of new patients in six months. Her Yellow Pages ad returned 490 percent versus 50 percent from her newspaper ads. Her web site cost only $150 (not counting the value of her time to maintain it) and generated $19,200 – a whopping 12,700-percent return.

Marketing Metrics and ROI
How to Set Up a Measurement System That Can Double Your Profitability Page 9
Adjusting the Program Referrals are working well, so she sets up a program to promote more referrals. She writes letters to all patients, suggesting that if they’re pleased with her service, they may want their friends to derive the same benefits. Yellow Pages advertising is working well, so she increases the size of her ad. She offsets most of the additional cost by canceling her newspaper ads, which are less profitable. She continues to maintain and enhance her web site. During the next six months, she adds 121 new patients. Her rate of adding new patients has more than doubled, because she has optimized her program. She’s doing more of what works well. For six more months, the same rate of new patients continues. When her Yellow Pages ad again comes up for renewal, she keeps the same size ad, but writes more effective copy. This change, plus a few refinements in her referral program, further increases the rate at which she adds new patients. She outsources most of the maintenance of her highly profitable web site, giving her some more time to treat patients. Her calendar fills up completely. Because she doesn’t want to outgrow her office, she stops accepting new patients except to fill vacancies. She refers all other new patients to another chiropractor. Dr. Smith has fully optimized her marketing. She has reached “optimization nirvana.” A Comment on the Example To streamline this example, I omitted two minor calculations that my real-life clients actually made.
Marketing Metrics and ROI
How to Set Up a Measurement System That Can Double Your Profitability Page 10
When Dr. Smith estimated the average length of time a patient stays with the practice, she had been in practice for only three years. The average length would keep rising, yielding an increasing lifetime value. In a young business like this one, the average length of a customer relationship should be recalculated periodically, until there’s enough history for the average to stabilize. To calculate lifetime value, Dr. Smith simply multiplied the price of a visit ($40) times two visits per month times 30 months, producing $2,400. However, $2,400 received over 30 months has slightly less value than a lump sum of $2,400 at the beginning of the 30 months. A more accurate lifetime value would be the present value of the 30-month revenue stream. As I’ll describe in detail later, you won’t need to fuss with this level of detail until you have your measurement program under way and you are looking to fine-tune it. Remember: this same process, in an expanded form, can meet the needs of the largest and most complex marketing programs. In the next four chapters, I give you detailed descriptions of all four steps in the DATA process. The level of detail will enable you to adapt the process to any program you may be running.
# # #

Marketing Metrics and ROI
How to Set Up a Measurement System That Can Double Your Profitability Page 11
Chapter 2
Defining Your Results In Chapter 1 you saw a dramatized example of a four-step process for measuring bottom-line results:
1. Defining: Defining the results that your program intends to promote.
2. Assessing: Assessing the dollar values of these potential results.
3. Tracking: Tracking actual results and determining whether your program promoted them.
4. Adjusting: Adjusting your program based on the tracking; doing more of
what works well, and less of what works not so well. Now let’s go to work on your measurement system. We begin with Defining. In order to measure the results of your program, you must first define what your program is supposed to do. You can’t measure what you can’t define. In this step, we’re not concerned with numbers. We simply want to identify the kinds of results that your program intends to promote – or could incidentally promote. Here’s a list of 25 kinds of results, organized into two groups: results that primarily increase revenue and results that primarily reduce expenses. This is a comprehensive but not necessarily all-inclusive list of possible results. Keep in mind that only a small fraction of these may apply to your company and the industry(ies) you operate in.

Marketing Metrics and ROI
How to Set Up a Measurement System That Can Double Your Profitability Page 12
Results That Increase Revenue
• More sales leads
• Increased closing ratio, a/k/a conversion rate (a higher percentage of leads become customers)
• Shorter sales cycles
• More new customers
• Larger sales to existing customers, consisting of:
• More units per sale, or
• Higher-ticket products or services, or
• Upsells (sales of related products or services)
• More-frequent sales to existing customers
• Longer customer relationships or reduced attrition or re-activation of
inactive customers
• Additional distributors or licensees for your products or services
• Additional suppliers whose products or services you can resell profitably
• Additional strategic alliances
• More-successful liquidation of unneeded assets (e.g., real estate, machinery, patents)

Marketing Metrics and ROI
How to Set Up a Measurement System That Can Double Your Profitability Page 13
Results That Reduce Expenses
• Sales of higher-margin products or services (reduced cost of goods sold)
• Fewer product returns or fewer refunds for service errors
• Reduced product or service liability
• Avoidance of lawsuits against your company
• Avoidance of regulatory action against your company
• Quicker or less-expensive resolution of regulatory challenges
• Avoidance of grassroots community action against your company
• Avoidance of boycotts, vandalism and sabotage
• Prevention of crime against employees
• Reduced shrinkage
• Fewer accidents
• Increased productivity per employee (reduced labor cost per revenue dollar)
• Lower recruiting costs
• Reduced employee turnover

Marketing Metrics and ROI
How to Set Up a Measurement System That Can Double Your Profitability Page 14
Right now, you may be reflecting that you’ve never defined your marketing program’s goals in this way. If so, you’re not alone. In marketing, there is an unfortunate tradition of stating goals only in terms of awareness and perception (mental states). For example: increase awareness of Product X; create favorable community attitude toward ABC Company; improve employee morale. There’s nothing wrong with those goals. Just go one step further and identify the results that these mental states could lead to. You can do this by drawing what I call “Hypothetical Chains of Causation.” For example, if your ads increase a prospect’s awareness of Product X, that prospect probably becomes “warmer” than a prospect who hasn’t heard of Product X. Your salesperson may close the warm prospect earlier, especially if the prospect also sees good PR on Product X during the sales cycle. So the Hypothetical Chain of Causation is: awareness → familiarity → confidence → earlier decision → shorter sales cycle In the next hour, you can make a small but productive start. Print out a copy of that list of 25 kinds of results. Lay it down next to the goals page of your marketing plan (if your plan isn’t written out, you can do this exercise mentally). Then ask yourself how each of your goals could lead to one or more of the results on the list. One Step at a Time Notice that I say “could lead to.” At this point, don’t worry about whether your program actually does lead to a result, or how to track the result, or how to put a value on the result. Those questions are covered in later chapters. At this point, just think hypothetically. Identify every kind of result that your program could possibly promote. Draw Hypothetical Chains of Causation. Write everything down. I promise: It gets easier once you get into it! If you’re having trouble, here’s another technique that can help. Many big company CEOs use this one. They don’t have a name for it, but I call it “Zero-Based Intuitive Measurement.”

Marketing Metrics and ROI
How to Set Up a Measurement System That Can Double Your Profitability Page 15
Imagine that your program never existed – that your company had never spent one cent, or one minute of effort, on marketing. What previous results would not have happened? What future results may not happen? If you spend an hour or two on this exercise, you’ll achieve the definition you need for your first round of measurement. Remember, you’re going to be refining the process from year to year, so your first round need not be fancy. The important thing is to get started.
# # #

Marketing Metrics and ROI
How to Set Up a Measurement System That Can Double Your Profitability Page 16
Chapter 3
Assessing Your Results After you have defined the kinds of results your program intends to promote, you assess the dollar value of each type of potential result. For some kinds of results – especially sales-related results – I’ll show calculations that you can use to achieve precise assessments. For other kinds of results, precise calculations may be difficult if not impossible; in these cases, I’ll suggest methods that you can use to make reasonable estimates. Let’s begin with the more-precise type of situation: sales-related results. The Value of Incremental Sales For the value of incremental sales, you generally want to use the gross margin of the incremental sales. You don’t want to use net sales because this number doesn’t reflect the cost of goods sold. Conversely, you don’t want to use net income, because this number reflects expenses such as selling, general and administrative expenses and research, development and engineering expenses. For example: Let’s assume that you started a new (incremental) advertising program, that it cost $50,000 in its first year, that it promoted $600,000 in incremental sales during the same year, and that the gross profit from these sales was $200,000.

Marketing Metrics and ROI
How to Set Up a Measurement System That Can Double Your Profitability Page 17
If you subtract your incremental advertising dollars ($50,000) from the incremental gross profit generated ($200,000), you see that you have generated $150,000 of incremental operating profit. Stated differently: The effect of your advertising added $200,000 to operating profit, and the cost of your advertising subtracted $50,000 from operating profit, for a net increase of $150,000. In terms of operating profit, your return on investment (ROI) is $150,000 / $50,000 = 3 times the amount invested. ROI is usually stated as a percentage; your ROI is 300 percent. In this example, I assumed that all the sales generated by your advertising had the same gross profit. However, in many actual cases you may generate sales of products or services with widely different gross profits. In those cases, you would need to average the gross profit numbers. And I also assumed that all of the sales generated were one-shot sales to existing customers. But it’s important to determine whether your marketing program helped create new customers, because the value of adding a new customer can be very significant. The Value of a Customer As I mentioned in Chapter 1, most marketers unintentionally understate the profitability of marketing programs because they overlook the lifetime value of a new customer (or client, or patient, or patron). In many industries – for example, catalog sales – repeat sales typically generate all the profit. In other words, many companies are willing to acquire new customers at break-even or even at a loss, in the expectation of making many additional sales to these new customers. Now, this may or may not be typical in your industry, but I mention it here to demonstrate that many profitable companies stake their businesses on the predictability of lifetime value. They are able to do this successfully because lifetime value can be calculated and predicted with good precision.

Marketing Metrics and ROI
How to Set Up a Measurement System That Can Double Your Profitability Page 18
Whatever industry you are in, the lifetime value of a customer to your company is the gross profit from all the purchases that customer makes, for as long as he remains a customer. To calculate lifetime value, you need to know three numbers: (1) the average value of a sale, (2) the average number of sales to each customer per year, and (3) the average number of years a customer stays with your company. If your company doesn’t routinely calculate and record these kinds of numbers, you or your sales manager may need to look back through the sales records for some raw data. You don’t have to look at literally all the records. Instead, you can take a statistical sample – say, five percent – and extrapolate the numbers you find. However, in your sampling, be sure to go back several years, because many of your customers may be long-standing customers. Average value of a sale: If the average sale includes a mix of different products (or services), take a weighted average of the gross margins on the different products, and multiply this number times the average number of units in a sale. For example, if your weighted average gross margin is $3 per unit and your average sale is 100 units, the average value of a sale is $300. Average number of sales per year, per customer: In many industries, customers buy several times per year. So, in your sampling, be sure to determine how many times your customers buy, because this significantly affects your profitability calculation. Lifetime: The average number of years a customer stays with your company.

Marketing Metrics and ROI
How to Set Up a Measurement System That Can Double Your Profitability Page 19
The Calculation Lifetime value equals the average value of a sale, times the average number of sales per year, times the lifetime in years. For example, if the average value of a sale is $3,000, and the average customer buys four times per year for five years, then the lifetime value of a customer is $3,000 x 4 x 5 = $60,000. I’ve simplified this example in order to produce round numbers for discussion. If, in your real-world measurement, you want to be more precise, you can calculate the present value of the customer’s purchases over the lifetime, which would yield a number lower than $60,000. To get the present value, assume $3,000 received every three-month period, assume that there will be 20 of these three-month periods, assume a prevailing rate of interest per period, and plug the numbers into a PC-based software package, such as “TValue,” that’s designed to calculate present value. Or, you can do it the old-fashioned way and use a financial calculator. Or do it the easy way – ask your accountants. For companies who haven’t performed this calculation before, the lifetime value of a customer can come as a pleasant surprise. Often it’s much, much higher than anyone assumed. This information is especially important in retail companies, where employees may tend to underestimate the value of a customer who makes frequent small purchases. The purchases may be small, but they add up. For example, many people patronize the same dry cleaner for decades. If a dry cleaner finds that his average customer stays for 10 years, his average customer could be worth more than $5,000 – even in this workaday business where a single transaction rarely exceeds $50.

Marketing Metrics and ROI
How to Set Up a Measurement System That Can Double Your Profitability Page 20
The Value of a Prospect From the lifetime value of a customer, you can calculate the value of a prospect. All you need to know is the closing ratio, a/k/a conversion rate. The closing ratio for new customers is the number of new customers that your salespeople (or partners, or reps, or direct marketing programs, etc.) create per qualified prospect contacted. For example, if your people close one out of four, your ratio is 0.25. To determine the value of a prospect, simply multiply the lifetime value of a new customer by the closing ratio. For example, if a new customer is worth $60,000 and the ratio is 0.25, then the value of a prospect is $60,000 x 0.25 = $15,000. The Value of a Lead Now we can answer the most frequently asked measurement question: How much is a sales lead worth? You’ve already gathered most of the numbers you need in order to answer this question. All you need now is one more number: How many qualified prospects do you get per raw lead? For example, if you get one prospect per ten leads, this ratio is 0.1. Multiply the value of a prospect by this ratio and you have the value of a lead. For example, if a prospect is worth $15,000, as in the example above, then a raw lead is worth $15,000 x 0.1 = $1,500. This calculation, too, may be pleasantly surprising to many companies.
Marketing Metrics and ROI
How to Set Up a Measurement System That Can Double Your Profitability Page 21
Increasing the Lifetime Value You now have the tools to assess the value of several other sales-related results: Larger Sales to Existing Customers Suppose your marketing program helps your salespeople increase the size of the average sale (through more units per sale; or higher-ticket products or services; or upsells). This can be a very large contributor to profits, and often is a key element in the profitability of a marketing program. If you increase the average sale by, say, 25 percent (with the same gross margins), you’ve increased the lifetime value of a customer. Assuming that the larger sales continue, lifetime value is now worth 1.25 times (125 percent) what it was before. Likewise, the value of a prospect is now worth 1.25 times as much as before, and so is the value of a lead. More-Frequent Sales to Existing Customers If your marketing program can induce customers to buy more times per year, this also increases the lifetime value of a customer. If the norm is four times per year and you increase it to five, the lifetime value is now worth 1.25 times (125 percent) what it was before. The value of a prospect and the value of a lead are also worth 1.25 times as much as before. Longer Customer Relationships If your program can increase the length of customer relationships – by reducing attrition or by re-activating inactive customers – you can add to profitability. If, for example, you increase the average lifetime of a customer from four years to five years, you’ve again multiplied lifetime value (and hence the value of a prospect and a lead) by 1.25. Combining the Increases Often, you can combine different results to produce geometrically larger results. That is to say, the various increases do not add; they multiply:

Marketing Metrics and ROI
How to Set Up a Measurement System That Can Double Your Profitability Page 22
If you increase the average sale by 25 percent and the frequency of sales by 25 percent and the lifetime of a customer by 25 percent, the combined effect of this across-the-board increase is not 75 percent, but 95 percent (1.25 x 1.25 x 1.25 = 1.95). If, instead of 25 percent, you achieve a 40-percent increase across the board, the combined effect is not 120 percent, but 174 percent (1.40 x 1.40 x 1.40 = 2.74). Three More Sales-Related Results Here are three more kinds of sales-related results. These are generally less significant than what we’ve covered already, but they may be important in your situation, so we include them for completeness. Sales of Higher-Margin Products or Services Your marketing program may help sell higher-margin products or services. You can calculate the improvement if you know the margins involved. For example, let’s assume for simplicity that your company is selling only one product, with a margin of 30 percent. If you replace that product with a new product, and the new product has a margin of 40 percent, multiply 10 percent by the sales volume to get the dollar value of this improvement. Shorter Sales Cycles If your company has a long sales cycle, and your marketing program helps shorten it (PR, especially, can help with this), you add to operating profit by helping the company recognize revenue sooner. To calculate the value of this improvement, you need to figure the gross profit on the accelerated sales, and the number of months or weeks you have cut from the cycle. Then you calculate the present value of having those gross profit dollars sooner.

Marketing Metrics and ROI
How to Set Up a Measurement System That Can Double Your Profitability Page 23
Another effect of a shorter sales cycle is that it may move a significant amount of revenue into an earlier fiscal quarter or year. Increased Closing Ratio It’s possible (although uncommon) for marketing to help your salespeople close more prospects. It’s uncommon because closing ratios depend very heavily on the individual salesperson’s experience level and typically, each salesperson improves his ratio slowly over the years. However, if you find that your program does increase the closing ratio, you can readily calculate the value of this improvement. Determine the gross profit per year at the old (lower) closing ratio and the gross profit per year at the new (higher) ratio. Then subtract the old gross profit from the new gross profit. If you can assume the improvement is “permanent,” you’ll want to extrapolate over several years. When the Data May Reside Outside the Marketing Department There are several kinds of calculable results that may involve people outside of marketing. For example:
• Fewer product returns or fewer refunds for service errors
• Reduced product or service liability
• Prevention of crime against employees
• Fewer accidents
• Increased productivity per employee
• Lower recruiting costs
• Reduced employee turnover

Marketing Metrics and ROI
How to Set Up a Measurement System That Can Double Your Profitability Page 24
If your marketing program is expected to help achieve any of these kinds of results, it’s usually quite easy to determine the value of a potential improvement. Someone in the company probably knows the value of an improvement, because that same person probably has calculated or estimated the (unacceptably high) cost of the current situation; otherwise, the situation wouldn’t have come to management’s attention. For example, if your company is trying to reduce employee turnover, someone knows what turnover is costing the company right now. Therefore, it’s a simple matter to calculate what a potential 10-percent reduction would be worth in terms of operating profit. Please remember: At this point, you’re simply trying to determine the value of a potential result. You’re not trying to determine if your program can achieve the result or has achieved the result. All you want to know at this point is how to calculate, or at least estimate, the value of a potential result. Unique or Unusual Situations Sometimes a marketing campaign is designed to help achieve a result that the company pursues rarely, or has never pursued before. For example, a company may want to enter into its first strategic alliance, and may want to use public relations to attract other companies and to build the perceived value of a strategic alliance.

Marketing Metrics and ROI
How to Set Up a Measurement System That Can Double Your Profitability Page 25
Or, a company that has never been boycotted may be faced with a potential boycott, and may want to use public or community relations to head off the boycott. Other unique or unusual results could include:
• Additional distributors or licensees for your products or services
• Additional suppliers whose products or services you can resell profitably
• More-successful liquidation of unneeded assets (e.g., real estate, machinery, patents)
• Avoidance of lawsuits against your company
• Avoidance of regulatory action against your company
• Quicker or less-expensive resolution of regulatory challenges
• Avoidance of grassroots community action against your company
• Avoidance of vandalism and sabotage
When you sit down to estimate the value of one of these results, you have three valuable resources at your disposal. The first resource is your fellow managers – someone may have already begun an estimate that has not yet come to your attention. The second resource is secondary research. By using LexisNexis, Factiva or Google, or by enlisting research experts, you may find articles, books and case studies on the situation in question. If so, you will be on your way toward a reasonable estimate. The third resource is primary research. This may be more time-consuming, but depending on the importance or severity of the situation, it may be worth doing. In this research, you directly contact companies who have faced the situation before. Naturally, you would approach only companies who are not competitors of your company.
Marketing Metrics and ROI
How to Set Up a Measurement System That Can Double Your Profitability Page 26
If you approach other companies and ask for guidance, you can discover a gold mine of information and advice. Even without setting up formal “benchmarking” programs, you may be surprised at the willingness of strangers to help you. Often they are motivated by benevolence or just plain ego (pride in having solved a problem or achieved a result).
# # #

Marketing Metrics and ROI
How to Set Up a Measurement System That Can Double Your Profitability Page 27
Chapter 4
Tracking Your Results To review, there are four steps to effective results measurement:
1. Defining: Defining the results that your program intends to promote.
2. Assessing: Assessing the dollar values of these potential results.
3. Tracking: Tracking actual results and determining whether your program promoted them.
4. Adjusting: Adjusting your program based on the tracking; doing more of
what works well, and less of what works not so well. In Chapter 3, we discussed several ways to put a dollar value on the results (behaviors) that your marketing program promotes (or could possibly promote). Now let’s move on to tracking the actual results. Three Approaches to Tracking There are three basic approaches to tracking the results of any tactic or program:
1. Forward Tracking, which you must establish before you launch the tactic or program.
2. Coincident Tracking, which you can start doing while the tactic or
program is running.
3. Reverse Tracking, which you can start doing after the tactic or program is completed.

Marketing Metrics and ROI
How to Set Up a Measurement System That Can Double Your Profitability Page 28
In addition, there are special situations in which your job of tracking is vastly simplified. These are situations in which you can safely assume that all (or most) of the results are attributable to your tactic or program. Forward Tracking Forward Tracking is the most accurate way to measure the effectiveness of any marketing program. To use Forward Tracking, you build some kind of tracking mechanism into each tactic that you want to measure. This is exactly what direct-response advertisers do. Let’s take a look at some common tracking mechanisms, and then discuss how you can adapt them to your program. Some of these tracking mechanisms are recent, such as web analytics; some are a century old, such as the coded coupon. Remember, this is just a sample of tracking mechanisms, for purposes of discussion. It is not a catalog of all tracking mechanisms. Web Analytics Solutions For any business you do on the web, your tracking can be almost fully automatic and almost effortless, thanks to web analytics solutions such as Google Analytics. With these solutions, you can determine how much revenue (and hence profit) is generated by each piece of web content, each banner ad, and each email. You can track the sale from the visitor’s first click to the conversion. Response Cards As you know, some hard-copy sales letters and catalogs include response cards, a/k/a bounce-back cards. If the reader wants to order a product or service (or receive more information before deciding), he mails back the response card. The card contains a code that identifies which promotion the reader responded to. When the advertiser receives the cards, he can track which promotions produced which orders or inquiries. (Today, with the popularity of toll-free telephone numbers and the web, these cards are used less frequently than they used to be; however, they are still popular in some industries.)

Marketing Metrics and ROI
How to Set Up a Measurement System That Can Double Your Profitability Page 29
Telephones, Departments, Coupons A sales letter or catalog may direct the reader to call a toll-free number and have his credit card handy. The toll-free number is assigned only to this specific promotion, so when that line rings, the advertiser knows which promotion triggered the call. By the way, the popularity of this tracking mechanism was a major reason for the explosive growth of toll-free numbers. Similarly, a newspaper ad may direct the reader to call a certain local telephone number, or a certain extension; or to ask for a (real or fictitious) department or a (real or fictitious) person. Or, the ad may direct the reader to visit a retail store and bring in a cents-off coupon cut from the ad (this mechanism was pioneered by the advertising genius Claude Hopkins in the early 20th century). Or, the ad may direct the visitor to ask to see a specific salesperson, or ask about a special offer by name. All of these are tracking mechanisms. Because they use Forward Tracking, direct-response advertisers can precisely calculate the results of every promotion they run. They can also test different versions of a promotion. You may notice this in your own snail-mail mailbox or email input folder. Today you receive a sales letter from, say, a financial newsletter. Next week, you receive the same letter, but with a different headline or a different subscription price. The advertiser is testing different versions. Borrow a Few Mechanisms from the Direct-Response People You can use the same kind of Forward Tracking, even if your tactic is not specifically designed as a direct-response tactic. A great many business owners and marketers ignore this great opportunity. For example, a Boston-area bank used a simple Forward-Tracking technique to determine the impact of its minority outreach program, which included seminars, brochures and videos. The bank kept a record of each person who attended a seminar or requested a brochure or video.

Marketing Metrics and ROI
How to Set Up a Measurement System That Can Double Your Profitability Page 30
Months later, the bank was able to compare these prospects’ names with the names of new customers. This comparison revealed which tactics introduced new customers to the bank. There was some overlap of tactics (such as when a prospect attended a seminar and requested a video), and it’s possible that some prospects would have become customers without the outreach program. However, this simple analysis produced data reliable enough to make budget decisions for the next year. Similarly, a large law firm measured the impact of its partners’ speeches. Although we don’t tend to think of speeches as direct-response ads, the firm treated them as such, and arranged to track the leads from every speech. Here’s how: After a partner spoke, an assistant announced that anyone could leave a business card and receive a complimentary one-year subscription to the firm’s newsletter on the topic that the speech had covered (the newsletters normally were available only to the firm’s clients). The firm kept a list of these names, and was able to use this list to determine whether a new client was attracted to the firm by hearing a partner’s speech. A manufacturer used tracking to measure its new-product publicity in industrial trade magazines. In some magazines, tracking was automatic, because the magazines included reader service cards, a/k/a bingo cards, which enabled readers to request more information. However, many magazines didn’t include these cards, so the company made sure that its new-product press releases included a special toll-free telephone number, as opposed to its corporate switchboard number or the number used in its advertising. If a resulting new-product article included the “PR” number, the company would know which leads came from the publicity. This is especially useful when you’re doing publicity and advertising simultaneously for the same product. (I believe this technique was pioneered by Greg Jarboe, president and co-founder of SEO-PR, a search engine optimization firm. A pioneer of PR measurement in the high-tech world, Mr. Jarboe was urging marketers to use techniques like this more than two decades ago, when he was at Lotus Development Corporation.)

Marketing Metrics and ROI
How to Set Up a Measurement System That Can Double Your Profitability Page 31
As you can see from these examples, a tracking system doesn’t have to be complicated or tedious. It’s often merely a matter of finding a way to capture prospects’ names. When you have these names on file, organized by tactic, you can do your analysis at any time. Your raw data is always at your disposal. Coincident Tracking Another way to track leads is what I call Coincident Tracking. In sales situations, it’s generally known as Point-of-Sale Tracking. Coincident Tracking is the most commonly used tracking approach, because it’s easy to do and it requires no advance planning. In Coincident Tracking, you don’t need to have built a tracking mechanism into the tactic. Instead, you capture the tracking information as the result occurs (i.e., the tracking is coincident with the result). We’ve all experienced this as consumers. For example, you move to a new city and buy a home. You telephone a local oil company to set up an account. The receptionist takes your name, address and telephone number, and then asks, “And how did you hear about Acme Oil?” You say, “The real-estate broker recommended you,” or “I saw your Yellow Pages ad,” or, “I saw the sign on your building.” Your answer goes into the oil company’s database. If the company is an astute marketer, it is frequently analyzing this database to see how well its various marketing tactics are working. For example, in addition to running Yellow Pages ads and having a big sign on its building, the company may be encouraging specific real-estate brokers to recommend Acme Oil to home buyers. Although Coincident Tracking is used mostly in sales situations, it can be applied in other situations. For example, a general manager of a factory has a perennial need for a certain kind of skilled worker. He uses two ongoing tactics to attract these workers: (1) he runs ads in the local paper and (2) he runs a referral program in which employees earn bonuses by referring applicants.

Marketing Metrics and ROI
How to Set Up a Measurement System That Can Double Your Profitability Page 32
As each applicant applies, the HR director asks how the applicant heard about the opening. Eventually, if the general manager determines that one tactic is significantly outperforming the other, he can shift some or all of his spending toward the more-effective program. In other words, he can optimize. Key Advantage and Disadvantage The key advantage of Coincident Tracking is that you can decide to start doing it when your tactic is already in place; you don’t have to set up the tracking mechanism in advance. The key disadvantage of Coincident Tracking is, it’s not as accurate as Forward Tracking, because people don’t always recall where they heard about a product, service, company, job opening or other situation. This difficulty of remembering is especially true for publicity. When people learn about something from an ad, they usually recall that they learned it from an ad, but when people learn about something from publicity, they often recall it as word-of-mouth or general knowledge. This is the unique subliminal power of publicity. For example, even after a multi-decade avalanche of tourism publicity from Costa Rica, many people who decide to vacation in Costa Rica insist that they never saw any articles about the country. They recall that they heard about it from friends, or that they “just always wanted to go there” (even people who would not be able to locate Costa Rica on a map). In other words, the subliminal power of publicity has a downside: the difficulty of measuring publicity by means of Coincident Tracking. Whenever possible, it’s better to use Forward Tracking – by generating and tracking inquiries.
Marketing Metrics and ROI
How to Set Up a Measurement System That Can Double Your Profitability Page 33
Reverse Tracking If you’re just getting started in measurement, and you’re using a new Forward-Tracking or Coincident-Tracking system, you may have to wait for weeks or months for your data to accumulate, before you can do any meaningful measurement. However, while you’re waiting, you can try Reverse Tracking. Often, it isn’t as accurate as Forward Tracking or Coincident Tracking, but it may give you some useful indications. It’s a way to jump-start your measurement system. What you do is select a random sample (say, five percent) of recent sales or other kinds of results and find out where they originated. Then you carefully extrapolate these numbers to measure the effectiveness of the tactics that were used. Or, if your files contain only a few dozen sales or results, you can track all the history, as opposed to taking a sample. This will increase the likelihood of an accurate analysis. The beauty of Reverse Tracking is that you can use it to measure a program that’s already completed – even a program that was completed years ago by a predecessor. A Simple Example Here’s an example of Reverse Tracking. A small consulting firm decided to begin measuring its advertising and publicity programs. The firm established a few Forward-Tracking mechanisms and began to accumulate measurement data. While the new (Forward-Tracked) data was accumulating, the officers of the firm looked back in the client files to see if they could determine or recall how the clients were attracted to the firm. Most of the clients had been brought in through personal networking, because the firm’s officers were widely known in their industry.

Marketing Metrics and ROI
How to Set Up a Measurement System That Can Double Your Profitability Page 34
However, the records also contained a pleasant surprise: several clients had become aware of the firm by reading magazine articles about the firm (the client files contained notes about inquiries that the articles triggered). For the first time, the firm’s officers recognized that their modest publicity efforts over the years had been very profitable. Recall that “Dr. Smith” the chiropractor (Chapter 1) used two types of tracking. She began by doing some Reverse Tracking, from her own memory. Then she immediately set up a Coincident-Tracking system (asking new clients how they heard about her practice). Special Situations All three approaches to Tracking – Forward, Coincident, and Reverse – have one thing in common: they are ways of identifying and isolating the causes of results. They are ways of accurately attributing a result to one cause vs. another. In most situations, you can’t measure the effectiveness of a tactic or program without employing some kind of tracking. But there are exceptions. In some situations, you can reasonably assume that all (or most) of the results came from your tactic or program. In these special situations, you don’t need to do any formal tracking. Instead, you just do before-and-after measurements and assume that your tactic or program caused the change. Preventing Electrocution For example, an electric utility launched an advertising program to promote safety consciousness. The program warned contractors and homeowners about the dangers of accidental electrocution. During the years that the program was running, the number of electrocution accidents decreased significantly.

Marketing Metrics and ROI
How to Set Up a Measurement System That Can Double Your Profitability Page 35
The electric company assumed that its safety advertising was the sole cause of the reduced accident rate. This was a reasonable assumption because: (1) No other major advertising or public relations program about safety was in place during the same period; (2) normally, human behavior does not change quickly over a large demographic base (in this case, the customers of the electric company). A Garish Sign Here’s a more mundane example. An apartment complex in Texas was suffering from a low occupancy rate. To attract new tenants, the managers placed a portable sign in front of the rental office, announcing a special reduced rate for all rents. (It was one of those garish signs on wheels, with arrows, flashing lights, and movable plastic letters.) Occupancy rates quickly increased. The managers could reasonably assume that the new sign was the sole cause, because they didn’t change anything else during the period. They also knew that the walk-in traffic in their office increased while the sign was up. Naturally, many walk-ins spontaneously mentioned that they came in because they noticed the sign (a passive form of Point-of-Sale Tracking). But the managers didn’t need to track this data. They knew their hokey sign worked. Retailing Lends Itself to Special Situations In retailing, there are many similar special situations: limited-time offers, clearance sales, and so on. To measure the effectiveness of these events, you can of course opt to use Forward-Tracking mechanisms such as coupons. Or you can use Point-of-Sale Tracking. But normally you won’t need to bother. These events are so clear-cut that the results normally isolate themselves. Most retailers just watch the “blip” in sales or store traffic during the event, and that’s probably good enough for most results-measurement calculations of this kind.

Marketing Metrics and ROI
How to Set Up a Measurement System That Can Double Your Profitability Page 36
One exception would be an event that you promote via multiple advertising vehicles. For example, if you’re running a special sale, you may want to know how many people came as a result of newspaper ads, versus radio commercials, versus store signage. In this case, you would use one or more forms of tracking, as we discussed before. Safe Driving Here’s a special situation that’s unrelated to sales or marketing. A Fortune 500 electronics company opened a large office in a quiet suburban neighborhood. Although the company had conscientiously cooperated with the town to place traffic signs at the approaches to the office, many employees were driving too fast on the way to and from work. Understandably, the company’s neighbors began to complain. The company launched a corrective program, consisting of (1) internal communications reminding employees that they must drive safely in the surrounding suburban neighborhood and (2) a community relations program that informed the neighbors of the company’s efforts and encouraged the neighbors to identify any violators. This program was inexpensive but very effective. It achieved two results: (1) an overall improvement in employees’ driving habits (at least near the office!) and (2) community awareness that the company was paying attention to complaints and taking them seriously. Because the company could reasonably assume that no other major changes occurred during this period, it could attribute the new level of safety and neighborliness to the corrective program. Special situations save you time and effort because you don’t have to do formal tracking – you can just measure the results before and after your tactic or program. But be careful. Make sure you have eliminated all other possible causes of the results. It’s easy to overlook causes, so you may want to “sanity-check” your assumptions with outside counsel. If your company uses an ad agency or PR agency, and you believe your agency people are objective in these matters, ask for their help.

Marketing Metrics and ROI
How to Set Up a Measurement System That Can Double Your Profitability Page 37
If you don’t have outside counselors of this kind, at least test your assumptions with respected people in your network (people who don’t work in marketing often notice things that we marketers overlook). Or, ask me. I am always pleased to take a look at a proposed measurement system. Call me toll-free at 800-521-0490. Now let’s move on to the Adjusting step of the process: adjusting your program to make it more profitable. This is where you get the real payoff from measurement. It is not uncommon for small businesses to double their marketing ROI in one year by using this method.
# # #

Marketing Metrics and ROI
How to Set Up a Measurement System That Can Double Your Profitability Page 38
Chapter 5
Adjusting Your Program Ultimately, measurement helps you adjust and optimize your program. If you’re using multiple tactics to produce one kind of result, measurement is the best way to decide how to allocate resources among these tactics. Most companies allocate marketing resources based on tradition, inertia, percentages of sales, guesswork, ego, politics, or a combination of these. They can’t optimize because they don’t measure. As a direct result, they unwittingly limit their performance, and sometimes miss enormous opportunities in the marketplace. But if you determine what’s working in the real world, your company can emulate the elite marketers: companies such as Amazon, American Express, and McDonald’s, who have built optimization into their operating methods. The concept of optimization is simple: keep shifting resources from less-effective tactics to more-effective tactics. However, the implementation can take many different forms and can proceed at different rates. Because I don’t know the specifics of your program, I can’t give you specific advice. However, I can offer you some general comments and prudent guidelines. The style and speed of your optimization should be appropriate to: The size of your overall marketing program: If you are running a large, comprehensive program, a re-allocation of resources from Tactic A to Tactic B may be a small percentage of your spending. Conversely, if Tactics A and B are your whole program, a change could be significant. Generally speaking, you should make moderate changes. It’s like pruning a bush; if you prune away too much of the bush at one time, shock may damage the bush. Your company’s market position: If you’re the market leader, you may be able to afford to make bigger or faster changes than a small challenger could.

Marketing Metrics and ROI
How to Set Up a Measurement System That Can Double Your Profitability Page 39
Your corporate culture: If your company is (or you personally are) very risk-averse – if you place more value on avoiding mistakes than seizing opportunities – you may want to move slowly. Conversely, if your company prefers to seize opportunities, you may want to move more boldly. Start with a Pilot Especially if your company has a well-developed (as opposed to new or small) marketing program, it is usually prudent to establish measurement and optimization systems in stages. In other words, don’t try to measure everything at once, or change everything at once. Select a few tactics and run a pilot. How you select any tactic is up to you. However, two good selection criteria are: It looks like an EASY tactic to measure: Some tactics are easy to measure, some are difficult, and most are somewhere in between. You can gain experience and confidence more quickly if you start with an easier challenge. Remember the Chinese proverb: “To move a mountain, begin by carrying off the small stones.” It’s an IMPORTANT tactic to measure: You may have one tactic that’s so important that you want to tackle it first. That’s fine, unless it also appears to be among the most difficult to measure. You may want to gain some measurement experience before you change an important tactic that (by luck or by design) may be well-optimized already. After you get your first round of meaningful measurement data, you can take your first crack at optimizing your program. Whatever your situation, err on the side of caution. For example, if you have two tactics aimed at promoting one kind of result, you may find that the stronger tactic is much more effective than the weaker one. It would be tempting to just eliminate the weaker tactic and reassign all of the funds to the stronger tactic. This is what “Dr. Smith” the chiropractor did (Chapter 1). However, her program was simple and her results were decisive.

Marketing Metrics and ROI
How to Set Up a Measurement System That Can Double Your Profitability Page 40
On the first round, you may want to reassign only a portion of the funds, because: (1) The weaker tactic may in fact support the stronger tactic in some way; (2) you may find a way to significantly strengthen the weaker tactic, as you gain more experience. Again, I am at your disposal. If you are still not sure where or how to start, call me for a free evaluation. I am always pleased to spend an hour or two at no charge. It’s just a cost of doing business. So don’t hesitate. Call me toll-free at 800-521-0490. In any event, I wish you the best of success with your new measurement system.
# # #