monitoraggio)molecolare)e)citofluorimetrico) nella)leucemia ... sabina chiaretti.pdf ·...
TRANSCRIPT

Monitoraggio molecolare e citofluorimetrico nella Leucemia Acuta Linfoblas5ca Ph+
dell’adulto Sabina Chiare+, MD, PhD
Divisione di Ematologia ‘Sapienza’ Università di Roma

BCR-‐ABL: oncogenic ac5vity
The BCR-‐ABL1 gene is causal of malignant transformaBon
3 mechanisms: Ø Altered adhesion properBes
Ø Mitogenic acBvity: RAS pathway, MAP (mitogen-‐acBvated protein) kinase pathways, JAK-‐STAT pathway, PI3 kinase pathway, c-‐Myc pathways
Ø Apoptosis inhibiBon

Percen
tage of cases
Age cohorts
1-‐5
5-‐10
10-‐14
14-‐18
18-‐25
25-‐30
30-‐40
40-‐50
50-‐60
0
10
20
30
40
50
60 ETV6/RUNX1
E2A/PBX1
MLL/AF4
BCR /ABL
ETV6/RUNX1 p<0.0001 E2A/PBX1 p=0.06 MLL/AF4 p<0.0001 BCR/ABL p<0.0001
BCR/ABL1 incidence in different age cohorts
Chiare+ S et al. Haematologica 2013

Prognosis of BCR/ABL1+ ALL in the pre-‐TKI era
Kantarjian H et al. Cancer 2004
Overall survival Disease remission duration

Prognosis of BCR/ABL1+ ALL in the TKI era -‐ DFS-‐
Ribera J et al. Haematologica 2010;95:87-‐95 Foà et al Blood. 2011;118:6521-‐8. Bassan R et al. JCO 2010;28:3644-‐3652

MRD
Schrappe M. Blood 2012

Parameter
Day 71 aHer induc5on
P
Week 16 aHer consolida5on
P N Mol CR Mol Fail
N Mol CR Mol Fail
n % ± SD n % ± SD n % ± SD n % ± SD Standard risk
DFS 434 335 62 ± 3 99 35 ± 6 < .0001 424 335 68 ± 3 89 28 ± 5 < .0001
OS 434 335 80 ± 3 99 47 ± 6 < .0001 424 335 81 ± 3 89 43 ± 6 < .0001
High risk
DFS 145 72 66 ± 8 73 32 ± 6 < .0001 80 49 64 ± 8* 31 18 ± 8* < .0001
OS 146 72 72 ± 8 74 49 ± 7 .0005 80 49 71 ± 9 31 41 ± 10 .003
Outcome aHer 5 yr. according to molecular response aHer induc5on (day 71) and consolida5on (week 16) in BCR/ABL-‐
pa5ents
Gökbuget N et al. Blood 2012;120:1868-1876

Molecular response rate in relation to chemotherapeutic treatment phases- BCR/ABL-‐ pa5ents
Gökbuget N et al. Blood 2012;120:1868-1876
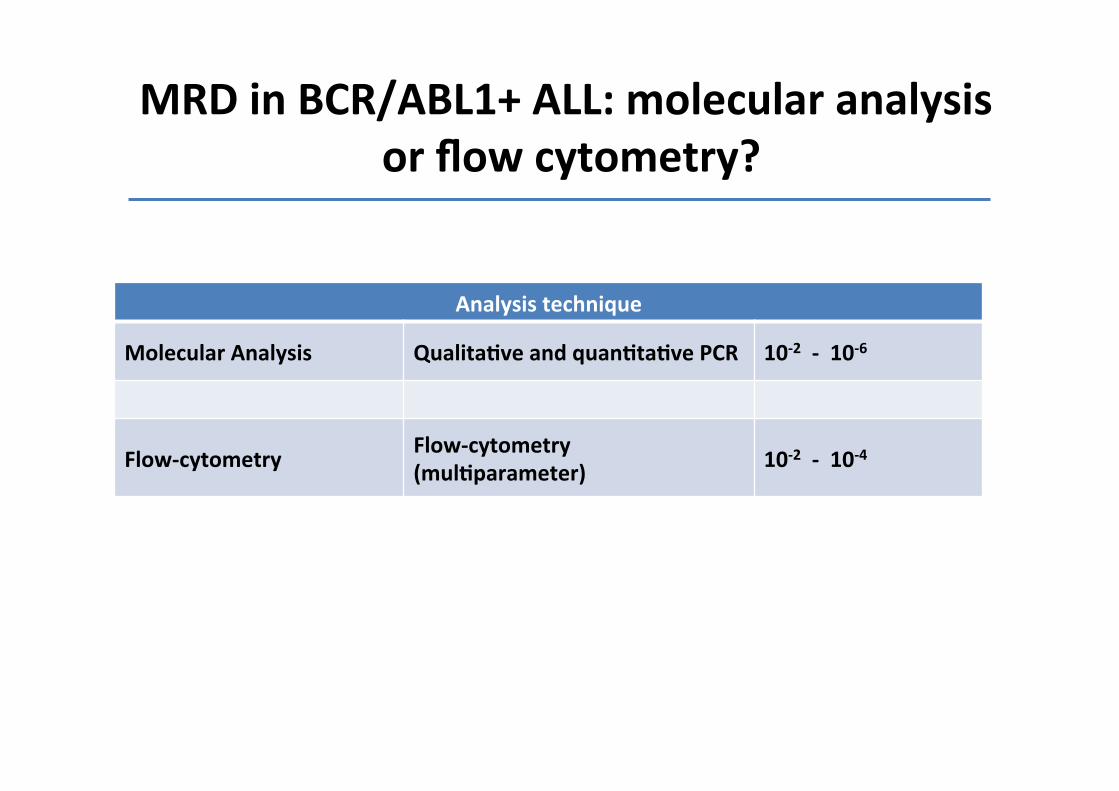
MRD in BCR/ABL1+ ALL: molecular analysis or flow cytometry?
Analysis technique
Molecular Analysis Qualita5ve and quan5ta5ve PCR 10-‐2 -‐ 10-‐6
Flow-‐cytometry Flow-‐cytometry (mul5parameter) 10-‐2 -‐ 10-‐4

Ø IdenBficaBon of aberrant phenotpyes at diagnosis
Ø AnBgenic combinaBon for MRD
Ø AcquisiBon: 300.000-‐500.000 events for MRD
Ø SensiBvity: 10-‐2 -‐ 10-‐4
Flow cytometry

BCR/ABL1+ common-‐ALL CD38 Heterogeneous
CD66c+ CD13 + CD33 +
San Miguel et al, 2001
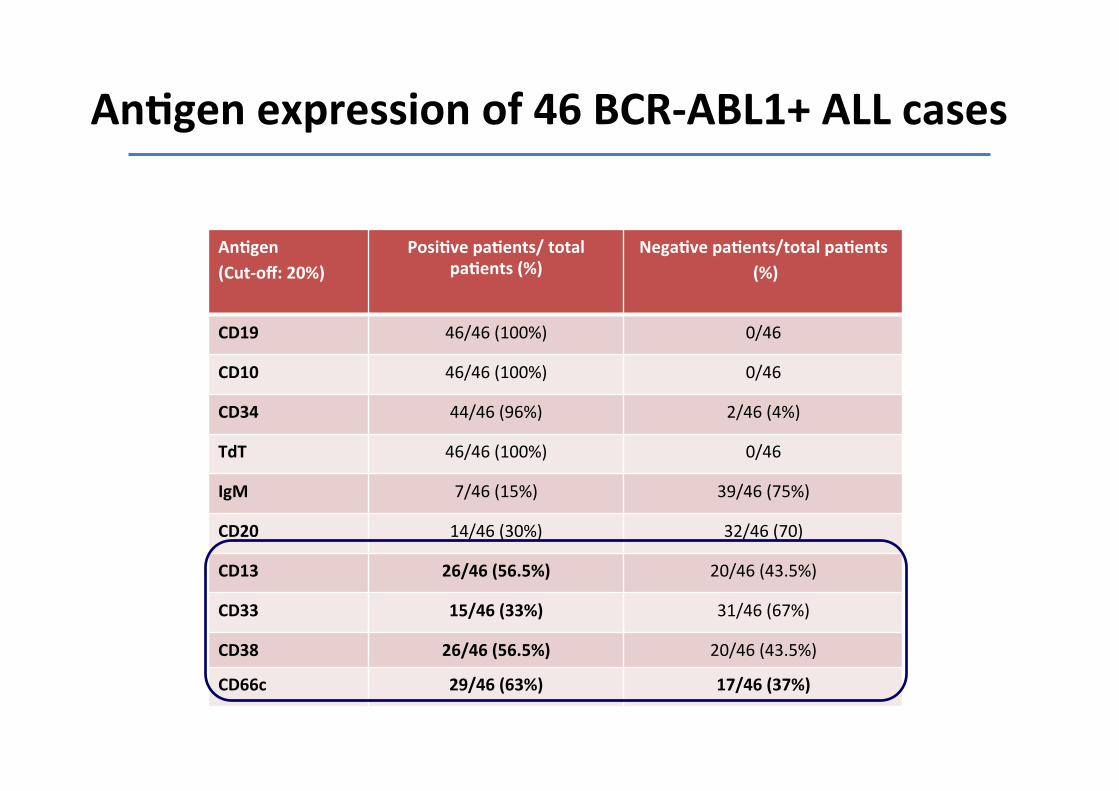
An5gen (Cut-‐off: 20%)
Posi5ve pa5ents/ total pa5ents (%)
Nega5ve pa5ents/total pa5ents (%)
CD19 46/46 (100%) 0/46
CD10 46/46 (100%) 0/46
CD34 44/46 (96%) 2/46 (4%)
TdT 46/46 (100%) 0/46
IgM 7/46 (15%) 39/46 (75%)
CD20 14/46 (30%) 32/46 (70)
CD13 26/46 (56.5%) 20/46 (43.5%)
CD33 15/46 (33%) 31/46 (67%)
CD38 26/46 (56.5%) 20/46 (43.5%)
CD66c 29/46 (63%) 17/46 (37%)
An5gen expression of 46 BCR-‐ABL1+ ALL cases

CD19
R1
CD34
R1+R2
CD38
CD10
R2 R3
R8 R4
CD19
CD38
R1
CD34
R1+R2
CD10 R2
R3
R8 R4
Diagnosis Post-‐inducBon
1 x 10⁶ cells analyzed
No leukemic cells at morphological observaBon
Flow cytometry: MRD+ case

CD19
R1+R2 R1
CD34 CD38
CD10
R8 R4 R2
R3 R1
CD34 CD19
R1+R2
CD10
CD38
R2 R3
R8 R4
1 x 10⁶ cells analyzed
No leukemic cells at morphological observaBon
Diagnosis Post-‐inducBon
Flow cytometry: MRD-‐ case

q Polymerase Chain Reac5on (PCR) and RT-‐PCR: § At the onset of the disease, allows the detecBon of
fusion genes: BCR/ABL1 § Allows quanBficaBon during follow-‐up widely used
q IG/TCR Sequencing: § IdenBficaBon of specific IG/TCR rearrangements, typical
of the leukemic clone. Allows quanBficaBon during follow-‐up rarely used
Molecular analysis

Pros and cons
Pros Cons
Molecular analysis § Rapid § Highly sensi5ve (10-‐2 -‐ 10-‐6) § Target stability
§ RNA instability
§ Limited to molecularly + pa5ents
§ Standard criteria for MRD nega5vity
Flow cytometry Rapid
Quan5ta5ve (10-‐2 -‐10-‐4 ) Informa5on on “normal” cells
Low nr of cells during/aHer therapy Regenera5on of B cells precursors Immunophenotypic shiH Rela5vely expensive
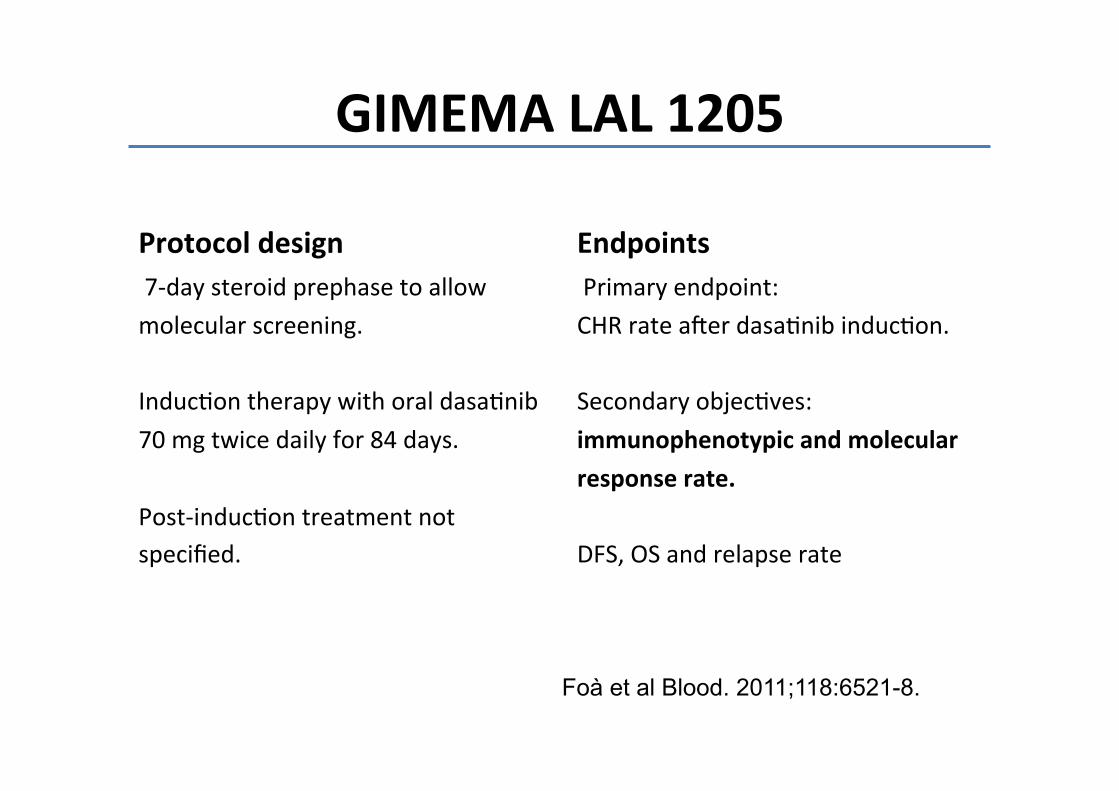
GIMEMA LAL 1205
Protocol design 7-‐day steroid prephase to allow molecular screening.
InducBon therapy with oral dasaBnib 70 mg twice daily for 84 days. Post-‐inducBon treatment not specified.
Endpoints Primary endpoint: CHR rate aler dasaBnib inducBon. Secondary objecBves: immunophenotypic and molecular response rate. DFS, OS and relapse rate
Foà et al Blood. 2011;118:6521-8.

Immunophenotype
<0.01%
≥0.01%
p=0.0397
Molecular
MRD: Immunophenotype vs PCR at day +85. Associa5on with DFS
<10-‐3
≥10-‐3
p=0.0094
GIMEMA LAL 1205
Foà et al Blood. 2011;118:6521-‐8.
Both techniques are associate with DFS; however, immmunophenotype is not selected by mulBvariate analysis.

Ribera J et al. Haematologica 2010;95:87-‐95
Spanish CSTIBES02 trial
Both techniques show that MRD clearance occurs early and provide comparable results.
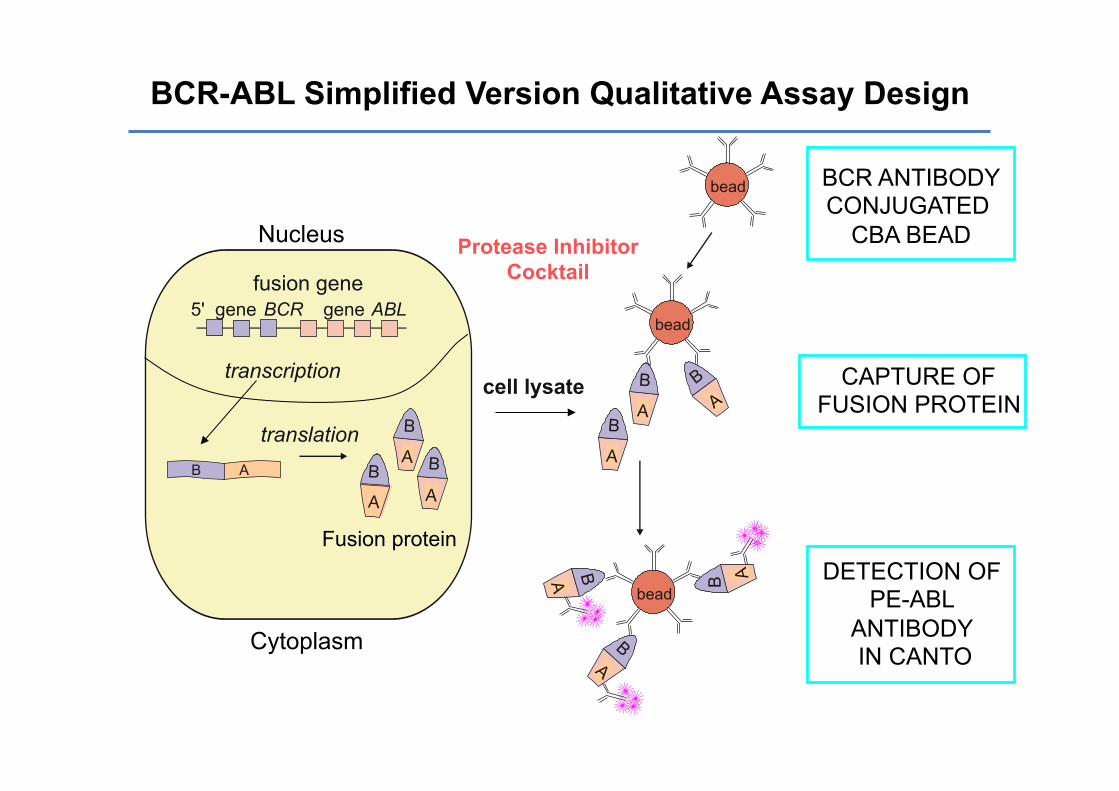
5' gene BCR gene ABL fusion gene
transcription
translation cell lysate
B A
B A
bead
bead
B A B A
BCR-ABL Simplified Version Qualitative Assay Design
CAPTURE OF FUSION PROTEIN
DETECTION OF PE-ABL
ANTIBODY IN CANTO
BCR ANTIBODY CONJUGATED
CBA BEAD
A B B A
B A B
A
Nucleus
Cytoplasm
Fusion protein
bead
Protease Inhibitor Cocktail
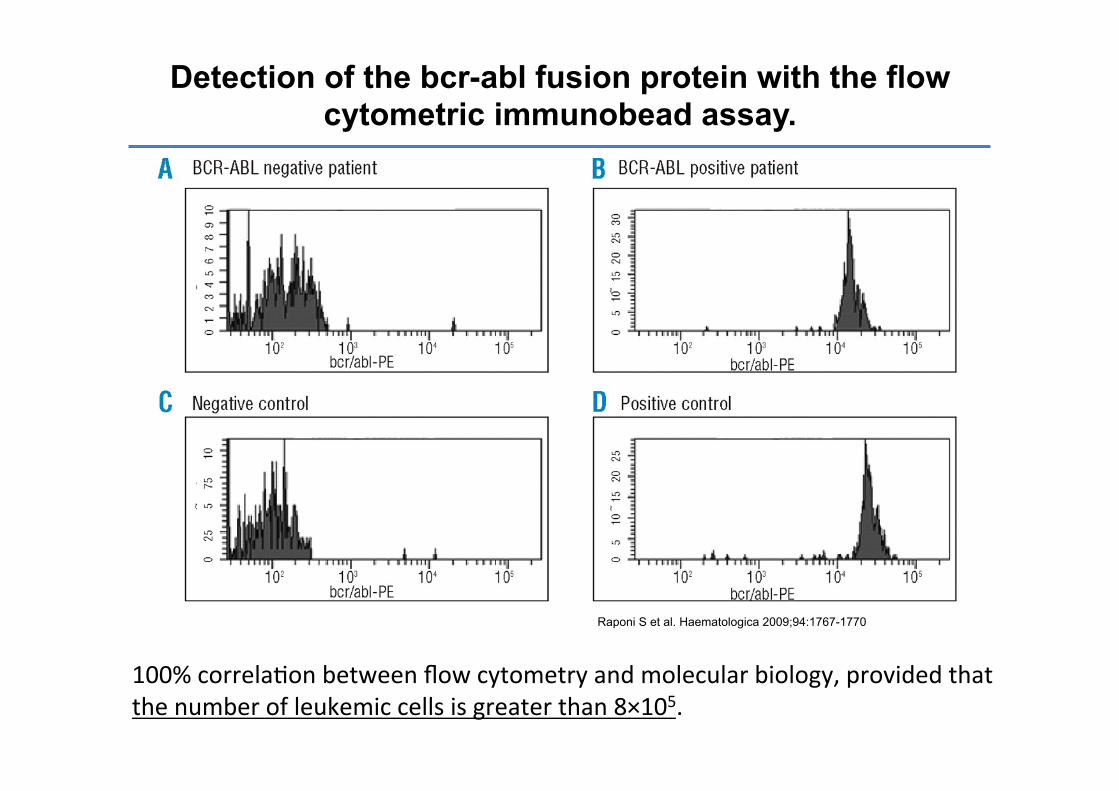
Detection of the bcr-abl fusion protein with the flow cytometric immunobead assay.
Raponi S et al. Haematologica 2009;94:1767-1770
100% correlaBon between flow cytometry and molecular biology, provided that the number of leukemic cells is greater than 8×10⁵.
Open ques5ons
• What is the best approach for MRD negaBve paBents?
• What is the best approach for MRD posiBve paBents?

Open ques5ons
• What is the best approach for MRD negaBve paBents?
• What is the best approach for MRD posiBve paBents?
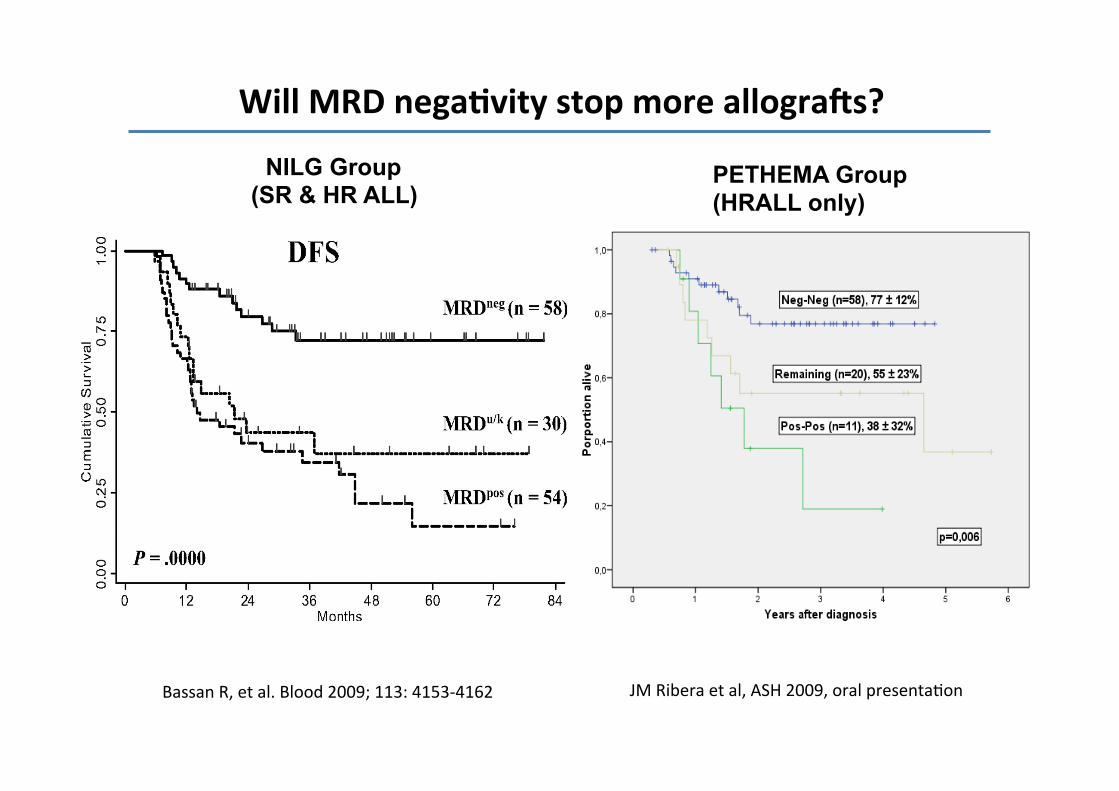
Will MRD nega5vity stop more allograHs?
JM Ribera et al, ASH 2009, oral presentaBon Bassan R, et al. Blood 2009; 113: 4153-‐4162
NILG Group (SR & HR ALL)
PETHEMA Group (HRALL only)

Open ques5ons
• What is the best approach for MRD negaBve paBents?
• What is the best approach for MRD posiBve paBents?

Bispecific an5-‐CD19/an5-‐CD3 • Blinatumomab (MT-‐103), BiTE • A bispecific single-‐chain anBbody
derivaBve designed to link B cells and T cells resulBng in T-‐cell acBvaBon and a cytotoxic T-‐cell response against CD19 expressing cells.
• Promising results in phase I studies, parBcularly on MRD clearance.
• A mulBcenter, mulBnaBonal protocol aimed at treaBng MRD in ALL ongoing started.
• Study ongoing also for relapsed/refractory ALL

Blinatumomab in ALL BCR/ABL1+ ALL
3/5 achieved MRD negativity
4/11 (regardless of MRD status) patients not receiving allogeneic HSCT after blinatumomab had Ph+ ALL; 2 are in CCR with TKI
Topp MS, et al. JCO 2011; 29: 2493-2498 Topp MS, et al. Blood 2012; 120:5185-5187

Conclusions • MRD detecBon can be perfomed by both molecular or flow cytometry
• Both are predicBve of DFS
• Molecular analysis likely to be more sensiBve, although flow-‐cytometry could be useful as well
• Blinatumomab might represent a valid approach for BCR/ABL1+ MRD+ paBents
