pacific between two types of el niño contrasting the … the flow patterns... · d’autre part,...
TRANSCRIPT

Full Terms & Conditions of access and use can be found athttp://www.tandfonline.com/action/journalInformation?journalCode=tato20
Download by: [National Taiwan Normal University] Date: 28 April 2017, At: 00:05
Atmosphere-Ocean
ISSN: 0705-5900 (Print) 1480-9214 (Online) Journal homepage: http://www.tandfonline.com/loi/tato20
Contrasting the Flow Patterns in the EquatorialPacific Between Two Types of El Niño
Li-Chiao Wang & Chau-Ron Wu
To cite this article: Li-Chiao Wang & Chau-Ron Wu (2013) Contrasting the Flow Patterns inthe Equatorial Pacific Between Two Types of El Niño, Atmosphere-Ocean, 51:1, 60-74, DOI:10.1080/07055900.2012.744294
To link to this article: http://dx.doi.org/10.1080/07055900.2012.744294
Published online: 21 Nov 2012.
Submit your article to this journal
Article views: 132
View related articles
Citing articles: 2 View citing articles

Contrasting the Flow Patterns in the Equatorial PacificBetween Two Types of El Niño
Li-Chiao Wang and Chau-Ron Wu*
Department of Earth Sciences, National Taiwan Normal University, Taipei, Taiwan
[Original manuscript received 28 September 2011; accepted 12 August 2012]
ABSTRACT Outputs based on the National Centers for Environmental Prediction (NCEP) Global Ocean DataAssimilation System (GODAS) are adopted to contrast the current variations in the equatorial Pacific betweentwo types of El Niño. The model fully resolves the equatorial currents. We found that the central PacificEl Niño (CP-El Niño) corresponds well with previous El Niño studies in that both the eastward EquatorialUndercurrent (EUC) and westward South Equatorial Current (SEC) weaken. On the other hand, the easternPacific El Niño (EP-El Niño) displays a distinct circulation pattern. The North Equatorial Countercurrent(NECC) strengthens in the developing phase and persists into the peak of the warm event, whereas the northernbranch of the SEC (SECn) also intensifies during the mature phase and lasts for about six months. The SouthEquatorial Countercurrent (SECC) strengthens during the decaying phase of the EP-El Niño. The shifting ofthe wind stress curl associated with the thermocline variability is chiefly responsible for the unique currentperformance of the EP-El Niño. It is worth noting that the air–sea interaction plays an important role in thecurrent variability not only during a CP-El Niño but also during an EP-El Niño.
RÉSUMÉ [Traduit par la rédaction] Nous adoptons les sorties basées sur le système GODAS (Global Ocean DataAssimilation System) des NCEP (National Centers for Environmental Prediction) pour mettre en évidence lesvariations de courant dans le Pacifique équatorial entre les deux types d’El Niño. Le modèle représente complètementles courants équatoriaux. Nous trouvons que l’El Niño du centre du Pacifique (CP-El Niño) correspond bien auxétudes précédentes sur l’El Niño puisque le sous-courant équatorial (EUC) vers l’est et le courant sud-équatorial(SEC) vers l’ouest faiblissent. D’autre part, l’El Niño de l’est du Pacifique (EP- El Niño) affiche une configurationde circulation distincte. Le contre-courant nord-équatorial (NECC) se renforce dans la phase de développement etpersiste jusqu’au maximum du réchauffement, tandis que la branche nord du SEC (SECn) s’intensifie aussi durant laphase de maturité et persiste pendant environ six mois. Le contre-courant sud-équatorial se renforce durant la phasede dissipation de l’EP-El Niño. Le changement du rotationnel de la tension du vent lié à la variabilité thermoclineest principalement responsable du comportement particulier du courant de l’EP-El Niño. Il est à remarquer quel’interaction air–mer joue un rôle important dans la variabilité du courant, non seulement durant un CP-El Niñomais aussi durant un EP-El Niño.
KEYWORDS EP-El Niño; CP-El Niño; Equatorial Pacific currents; wind stress curl
1 Introduction
The significance of ocean–atmosphere interactions in the tro-pical Pacific Ocean has been recognized and documented(e.g., Bjerknes, 1969; Philander, Yamagata, & Pacanowski,1984). Understanding the dynamics of the equatorial PacificOcean is essential to the global climate. The seasonal cycleis one of the predominant fluctuations in the region (Yu &McPhaden, 1999), resulting ultimately from solar radiationand the coupled air–sea–land interaction (Li & Philander,1996). Beyond the seasonal time scale, the climate variabilitydemonstrates an interannual variation related to the El Niño-Southern Oscillation (ENSO) (e.g., Philander, 1990).Because the variability of atmospheric anomalies is sensitiveto variations in sea surface temperature (SST), the description
of ENSO in previous studies is often based on SST variability,which has been studied extensively. However, the equatorialcurrents and the processes that modulate their circulation pat-terns have not been discussed as extensively because of thelack of measurements in the region. The variability of theequatorial current is not well understood at interannual orlonger time scales, and the dynamics involved is worthfurther investigation. The current fluctuations in the regionare largely influenced by atmospheric conditions, which inturn are modulated by the ENSO phenomenon.
Among the studies of the tropical Pacific Ocean circulation,there are only a few capable of providing sufficient data todescribe the mean flow pattern from contemporaneous obser-vations. For example, Yu and McPhaden (1999) described the
*Corresponding author’s email: [email protected]
ATMOSPHERE-OCEAN 51 (1) 2013, 60–74 http://dx.doi.org/10.1080/07055900.2012.744294La Société canadienne de météorologie et d’océanographie

annual cycle of zonal currents along the equator based on theTropical Ocean Global Atmosphere (TOGA) Tropical Atmos-phere Ocean (TAO) project array. In the western PacificOcean, hydrographic sections and Acoustic Doppler CurrentProfiler (ADCP) observations collected between 1984 and1991 were used in a dynamical interpretation of the mean cir-culation (Gouriou & Toole, 1993). The termination of theEquatorial Undercurrent (EUC) has been examined with his-torical hydrographic data in the eastern Pacific Ocean(Lukas, 1986). Although these measurements have shedsome light on the mean circulation in the region, much lessis known about the interannual variability related to ENSO.Two pioneering studies found that the currents in the equator-ial Pacific Ocean are considerably altered during ENSOevents. Using hydrographic sections and ADCP data, Del-croix, Eldin, Radenac, Toole, and Firing (1992) documentedcurrent variations during the 1986/87 El Niño and the sub-sequent La Niña. The same sections were further examinedby Johnson, Mcphaden, Rowe, and Mctaggart (2000) to inves-tigate the equatorial flow fluctuation during the 1997/98El Niño.Complex features of the evolution of ENSO have recently
been recognized and studied. These studies suggest thatthere are two different types of El Niño (Ashok, Behera,Rao, Weng, & Yamagata, 2007; Kao & Yu, 2009; Kug, Jin,& An, 2009; Yeh et al., 2009). Table 1 summarizes the charac-teristics and classifications of the El Niño events. In Table 1,the definition of El Niño Modoki is base on the location ofthe SST anomalies (Ashok et al., 2007). During El NiñoModoki, SST anomalies appear to be associated with a horse-shoe pattern in the central Pacific Ocean. The monthly indicesand anomaly fields are seasonally averaged over the periodfrom June to September (December to February) as theboreal summer (winter) values. Kao and Yu (2009) pointed
out that during the eastern Pacific El Niño (EP-El Niño),SST anomalies emerge from the coast of South America, pro-pagate westward to the central Pacific Ocean and decay off theequator. In the central Pacific El Niño (CP-El Niño), SSTanomalies first appear around the date line, develop andmature into a V-shaped anomaly structure extending towardthe subtropics in both hemispheres and then decay in the equa-torial central Pacific Ocean. Kug et al. (2009) found anddefined the cold tongue (CT) El Niño; it has a pattern oflarge SST anomalies in the eastern Pacific Ocean during thesummer. The maximum value of the warm SSTs is locatedin the coastal region of the eastern boundary. The SSTanomalies of the warm pool (WP) El Niño are mostly confinedto the central Pacific Ocean during the boreal summer. Abroad seasonal mean from September to the following Febru-ary is taken to classify the El Niño events.
In this study, we follow the definition and methodology ofKao and Yu (2009). The canonical El Niño is significant inEP-El Niño. This new type of El Niño, which is differentfrom the canonical El Niño in both the location of themaximum SST anomalies and its tropical mid-latitude telecon-nections, is the CP-El Niño. The two types of El Niño havetheir own evolution processes and thermocline structures,bringing distinct modulations to the ocean currents.
To have a better description of the equatorial current patternon the ENSO time scale, the analyses have to contrast currentpatterns of the two types of El Niño. The limited measure-ments in the equatorial Pacific Ocean are not suitable for thelonger time scale study. In this study, we use an oceanmodel product to investigate the equatorial current variabilityand the way it is associated with the different types of El Niño.The paper is structured as follows. In Section 2 we describe thedataset used in this study. In Section 3, spatial and temporalvariations of assimilated equatorial currents using the dataset
Table 1. Classification of the El Niño events.
Canonical type New typeThe third type (cannot be
classified yet)
El NiñoModoki
Canonical El Niño El Niño Modoki
Ashok et al.(2007)
SSTA: warm in the eastern Pacific; with eastward Kelvinwaves
SSTA: warm in the central Pacific; withouteastward Kelvin waves
Years: Years:The other events. 1979/80, 1986/87,
1990/91, 1991/92,1992/93, 1994/95,2002/03, 2004/05
EP- and CP-ElNiño
EP- El Niño CP- El Niño
Kao and Yu(2009)
SSTA: warm in the eastern Pacific associated withthermocline variations, surface winds
SSTA: warm in the central Pacific influenced bythe atmospheric forcing
Years: Years:1972/73, 1976/77, 1982/83, 1997/98 1991/92, 1994/95, 2002/03, 2004/05, 2006/07
CT and WP ElNiño
CT El Niño WP El Niño The third type
Kug et al.(2009)
SSTA: warm in the Niño-3 (5°S–5°N, 90°W–150°W) SSTA: warm in the Niño-4 (5°S–5°N, 150°W–
160°E)SSTA: warm in Niño-3.4(5°S–5°N, 120°W–170°E)
Years: Years: Years:1972/73, 1976/77, 1982/83, 1997/98 1977/78, 1990/91, 1994/95, 2002/03, 2004/05 1986/87, 1987/88, 1991/92
Equatorial Pacific Currents during Two Types of El Niño / 61
ATMOSPHERE-OCEAN 51 (1) 2013, 60–74 http://dx.doi.org/10.1080/07055900.2012.744294Canadian Meteorological and Oceanographic Society

are presented. The distinct evolution patterns of the currentsassociated with a CP-El Niño and an EP-El Niño and theirforcing mechanisms are also described. Section 4 concludesthis paper.
2 Data
The current velocity and 20°C isotherm depth anomaly dataused in this study are based on the National Centers forEnvironmental Prediction (NCEP) Global Ocean Data Assim-ilation System (GODAS) product (Behringer & Xue, 2004).The GODAS domain extends from 75°S to 65°N with a hori-zontal resolution of 1/3° × 1/3°. The model has 40 levels with10 m resolution near the sea surface and is forced by momen-tum, heat and freshwater flux from the NCEP atmospheric rea-nalysis 2 (R2) (Kanamitsu et al., 2002). The temperatureprofiles assimilated in GODAS include those from theTOGA experiment TAO, the Prediction and ResearchMoored Array in the Atlantic (PIRATA) project, the TriangleTrans-Ocean Buoy Network (TRITON) moorings, expendablebathythermographs (XBTs), and Argo profiling floats. Inaddition to temperature, a synthetic salinity profile is com-puted for each temperature profile using a local T-S climatol-ogy based on annual mean fields of temperature and salinityfrom the National Oceanic Data Center (NODC) WorldOcean Database.Surface wind stress data back to 1948 are provided by the
NCEP/National Center for Atmospheric Research (NCAR)reanalysis project. Monthly averages on global grids (2.5° ×2.5°) are available from the Climate Diagnostics Center ofthe Earth System Research Laboratory, National Oceanicand Atmospheric Administration (NOAA) (http://www.cdc.noaa.gov/).
3 Results and discussiona The Equatorial CurrentsThe assimilated mean circulation pattern for the Pacific equa-torial current is plotted in Fig. 1a, which is consistent with theobservational mean flow pattern in the region (e.g., Lukas,2001). The equatorial zonal currents consist of a westward-flowing wide-range surface current, the South EquatorialCurrent (SEC), which is located between about 8°S and3°N. Following the definition of Wyrtki (1974), the SEC isfurther split into northern and southern branches by theequator, hereafter called the SECn and SECs, respectively.To the north, the eastward-flowing current is the North Equa-torial Countercurrent (NECC; between about 5°N and 10°N).North of the NECC, there is an intense westward current, theNorth Equatorial Current (NEC; between about 10°N and20°N). The NEC is the southern limb of the North Pacific sub-tropical gyre and is upstream of the Kuroshio. The SouthEquatorial Countercurrent (SECC) extends eastward fromthe western boundary region, but it only reaches the centraland eastern Pacific intermittently.
A vertical profile along the equator averaged from approxi-mately 2°N to 2°S using GODAS data is shown in Fig. 1b. Themost prominent currents here are the subsurface eastwardEUC (red shading) and the westward SEC (blue shading).The EUC is the strongest equatorial current that travelsacross the Pacific. It originates at about 140°E, strengthensand reaches its maximum speed between 155°W and 125°Wand weakens considerably east of 90°W. The assimilatedresults from GODAS agree well with observations (Johnson,Sloyan, Kessler, & Mctaggart, 2002; Yu & McPhaden,1999). Furthermore, the core of the EUC gets closer to thesea surface as it flows eastward, which in turn feeds the equa-torial upwelling. This shoaling process largely influences theSST in the eastern Pacific Ocean, where the air–sea interactionis important. As a result, the EUC plays an important role inboth seasonal and interannual fluctuations around the equator-ial region (Gu & Philander, 1997), as well as in the climateresponse to global warming (Cai & Whetton, 2000). Thestrong EUC prevails at depths up to 400 m, while the relativelyweaker SEC is limited to the upper 50 m. The GODAS resultis very similar to the velocity profile plotted by Lukas (2001)based on the ocean assimilation/reanalysis product fromNOAA/NCEP.
Figures 2a to 2c show the annual cycle of zonal currents onthe equator at 165°E, 140°W and 110°W, respectively. Thesections have previously been used to describe the annualcycle of the equatorial currents (Yu & McPhaden, 1999). Fol-lowing Keenlyside and Kleeman (2002), the annual cycle isdescribed in terms of velocity anomalies (i.e., with climatol-ogy removed). The structures of the annual cycle at all threelocations are similar. There is an eastward intensification ofthe currents, occurring between March and July, whichextends from the surface to the depth of the EUC. At 165°E,the EUC is strongest in July, and the depth of the core islocated at about 60–150 m (Fig. 2a). At 140°W, the EUCcore is located at 60 m depth, and the fastest flow occurs inMay (Fig. 2b). At 110°W, the EUC is strongest during Apriland May, and the core shoals to approximately 25 m(Fig. 2c). These annual cycle patterns agree well with thosefrom the TAO array data, except for a slight discrepancyin the magnitude of the current velocity (Figs 2d to 2f;Keenlyside & Kleeman, 2002).
b Spatial Variations Associated with the CP- and EP-ElNiñoThe modulation of the equatorial currents by the two types ofEl Niños is now investigated. Figure 3 shows meridional vel-ocity profiles along 140°W in the boreal winter, including thecomposited normal year, CP-El Niño and EP-El Niño. Weaveraged from December to February of the following year,defined as the boreal winter, which was identified as themature phase of El Niño by Kug et al. (2009, Kug, Choi,An, Jin, & Wittenberg, 2010). In the boreal winter of normalyears, eastward currents include the EUC and NECC (Fig.3a). The EUC is located in the thermocline from 20 m to300 m and its core is near 140 m. It is trapped in the equatorial
62 / Li-Chiao Wang and Chau-Ron Wu
ATMOSPHERE-OCEAN 51 (1) 2013, 60–74 http://dx.doi.org/10.1080/07055900.2012.744294La Société canadienne de météorologie et d’océanographie

region between 2°S and 2°N. The NECC, centred at 7°N, hasits maximum velocity near 50 m depth. Westward currentsinclude the SECn, SECs and NEC. The SECn is present atapproximately 3°N and is strongest in the central Pacificbetween 90°W and 140°W. The SECs, centred at approxi-mately 5°S, is relatively weaker at 140°W but has a widerrange than that of the SECn. The NEC is located between10°N and 20°N and is very weak at 140°W.During a CP-El Niño winter, the EUC is significantly wea-
kened near its core (Fig. 3b). The SECn becomes weaker andnarrower, probably because of the weakening easterly tradewinds at the equator (Johnson et al., 2002). On the otherhand, the SECs becomes a little stronger than in a normalyear at 140°W. The NEC is also stronger during a CP-ElNiño than during a normal year. The flow patterns during aCP-El Niño agree well with previous El Niño studies (e.g.,
Johnson et al., 2002; Keenlyside & Kleeman, 2002; Lukas,2001; Yu & McPhaden, 1999).
The velocity profile during the EP-El Niño (Fig. 3c) maturephase is significantly different from that during a CP-El Niño.The westward SECn, which weakens during a CP-El Niñocompared with those in normal years, merges with the SECsand strengthens at 140°W during an EP-El Niño. The eastwardEUC weakens and descends to more than 600 m depth, prob-ably as a result of the depression from the strong SEC. Thisfeature is not consistent with the earlier finding that theEUC disappeared during the 1997/98 El Niño (e.g., Johnsonet al., 2002). We suggest that the EUC still exists but isdepressed and descends to a lower depth because of the inten-sification of the SEC during an EP-El Niño. A similar patternis seen in other ocean data assimilation models, such as theSimple Ocean Data Assimilation (SODA) Parallel Ocean
Fig. 1 (a) Mean surface circulation (averaged from 0 to 50 m) in the equatorial Pacific Ocean based on GODAS model assimilation (units are m s−1). The shadingindicates the current intensity. The contour interval is 0.05 m s−1. (b) Vertical velocity profile along the equator averaged from approximately 2°N to 2°Sfrom the assimilated annual mean (units are m s−1). The contour interval is 0.1 m s−1. Red and blue shading indicate the eastward and westward current,respectively.
Equatorial Pacific Currents during Two Types of El Niño / 63
ATMOSPHERE-OCEAN 51 (1) 2013, 60–74 http://dx.doi.org/10.1080/07055900.2012.744294Canadian Meteorological and Oceanographic Society

Fig. 2 The annual cycle of zonal currents on the equator from the model assimilation at (a) 165°E, (b) 140°W and (c) 110°W, respectively (units are m s−1). (d) to (f)are the same as (a) to (c), but are based on TAO array data (adapted from Fig. 2 of Keenlyside & Kleeman, 2002 by permission of the American GeophysicalUnion). The contour interval is 0.05 m s−1.
64 / Li-Chiao Wang and Chau-Ron Wu
ATMOSPHERE-OCEAN 51 (1) 2013, 60–74 http://dx.doi.org/10.1080/07055900.2012.744294La Société canadienne de météorologie et d’océanographie

Fig. 3 Composited meridional velocity profiles from GODAS along 140°W in winter of (a) normal years, (b) CP-El Niño, (c) EP-El Niño. Red and blue shadingindicate the eastward and westward current (units are m s−1). The contour interval is 0.1 m s−1.
Equatorial Pacific Currents during Two Types of El Niño / 65
ATMOSPHERE-OCEAN 51 (1) 2013, 60–74 http://dx.doi.org/10.1080/07055900.2012.744294Canadian Meteorological and Oceanographic Society

Program (POP), version 1.4.2, and the Geophysical FluidDynamics Laboratory (GFDL) Coupled Model Assimilation(figures not shown).A composite of the spatial circulation patterns in the equa-
torial Pacific Ocean for the normal, CP-El Niño and EP-ElNiño winters are plotted in Fig. 4. During a normal winter,the SECn and SECs are obviously separated from eachother. The SECn persists until the dateline and extends west-ward intermittently thereafter, whereas the SECs seems to becapable of reaching the western Pacific basin (Fig. 4a). Theeastward NECC located between 4°N and 9°N, and the sub-surface current EUC, is not obvious at 50 m depth.However, in the mature phase of a CP-El Niño, the NECC
strengthens and the EUC shoals up to the sea surface westof 170°E (Fig. 4b). The SECn becomes much weaker and isconfined east of 120°W. The SECs is blocked by the shoalingEUC and is not able to reach the western boundary.
The circulation during an EP-El Niño has a distinctivepattern. Most of the previous studies indicate that the EUCobviously weakens as it flows eastward during an El Niño.In this study, we found that these earlier findings are validonly during a CP type of El Niño. The EUC strengthensfrom the onset till the mature phase of an EP-El Niño(figure not shown) and merges with the NECC, surging east-ward. This unusual performance of the eastward currents issupposed to be a great disturbance in the westward currents.
Fig. 4 As in Fig. 1a, but for winter of (a) normal years, (b) CP-El Niño, (c) EP-El Niño.
66 / Li-Chiao Wang and Chau-Ron Wu
ATMOSPHERE-OCEAN 51 (1) 2013, 60–74 http://dx.doi.org/10.1080/07055900.2012.744294La Société canadienne de météorologie et d’océanographie

Fig. 5 Composited velocity anomalies of SECn during the evolution of El Niño. In (a) the EP-El Niño and (b) the CP-El Niño. Positive values (red shading) indicatewestward anomalies, whereas negative values (blue shading) indicate eastward anomalies. The data are averaged over the region 0 to 7°N approximately,and depths from 0 to 300 m. The contour interval is 0.02 m s−1.
Equatorial Pacific Currents during Two Types of El Niño / 67
ATMOSPHERE-OCEAN 51 (1) 2013, 60–74 http://dx.doi.org/10.1080/07055900.2012.744294Canadian Meteorological and Oceanographic Society

Fig. 6 As in Fig. 5 except for the NECC. Positive values (red shading) indicate eastward anomalies, and negative values (blue shading) indicate westwardanomalies. The data are averaged over the region 3.5°N–10°N approximately and depths from 0 to 500 m. The contour interval is 0.01 m s−1.
68 / Li-Chiao Wang and Chau-Ron Wu
ATMOSPHERE-OCEAN 51 (1) 2013, 60–74 http://dx.doi.org/10.1080/07055900.2012.744294La Société canadienne de météorologie et d’océanographie

However, the SECn and SECs also merge and strengthen.These two merged current systems being in oppositedirections and equally strong, counteract each other around170°W. This unusual pattern appears only during an EP-ElNiño and is far from what has been discussed in earlier ElNiño studies. The strengthening region of the eastward EUCduring the mature phase of an EP-El Niño is confined towest of the dateline, whereas it weakens significantly east ofthe dateline, where the merged SECn and SECs is exception-ally vigorous. The intense westward currents suppress theeastward EUC and NECC around the equator, which producesan unusual flow pattern during an EP-El Niño (Fig. 4c). More-over, it is often observed that the NEC tends to migrate north-ward as it flows westward during an El Niño. Figure 4c showsthat the NEC is at approximately 16°N latitude when it reachesthe western Pacific Ocean boundary. The bifurcation point ofthe NEC is much farther north during an EP-El Niño thanduring a CP-El Niño.
c Temporal Variations of the Equatorial CurrentsTo place emphasis on the interannual variability, we remove theannual cycle signal and deal with the velocity anomalies inthe subsequent analysis. We indentified the phases of El Niño
evolution according to Kug et al. (2009, 2010). The developingphase occurs from March to November, the mature phase fromDecember to February of the following year, and the decayphase from February to October. Figures 5 and 6 present com-posites of the velocity anomalies of the main equatorial currentsduring the evolution of an EP-El Niño and a CP-El Niño. For thewestward SECn, positive values (red shading) indicate westwardanomalies, and negative values (blue shading) indicate eastwardanomalies. The westward SECn weakens during the onset of anEP-El Niño. Immediately after the mature phase, the SECnstrengthens and reaches its maximum in the central PacificOcean around 140°W–170°W (Fig. 5a). The strengthening ofthe SECn persists into the following year. During a CP-ElNiño, the SECn tends to be weakened (Fig. 5b), which is inagreement with the behaviour of the SECn observed in previousEl Niño studies (e.g., Johnson et al., 2002). The SECn during aCP-El Niño is generally weaker in the central Pacific Ocean.Though it seems to recover for a time in the western PacificOcean, its intensity is still weak compared with the strong andcontinuous SECn during an EP-El Niño.
Figure 6 presents the velocity anomalies of the evolution ofthe NECC. For the eastward NECC, positive values (redshading) indicate eastward anomalies, and negative values
Fig. 7 Velocity intensity pattern of (a) the SECn during the mature phase together with (b) the NECC during the developing phase of the two EP El Niño events.The black line indicates the 1982/83 event, and the red line indicates the 1997/98 event (units are m s−1). (c) and (d) show the t value of the SECn and NECCduring the composited EP-El Niño (black line). The red line denotes the 95% confidence level. The light-blue colour highlights the significant zone.
Equatorial Pacific Currents during Two Types of El Niño / 69
ATMOSPHERE-OCEAN 51 (1) 2013, 60–74 http://dx.doi.org/10.1080/07055900.2012.744294Canadian Meteorological and Oceanographic Society
(blue shading) indicate westward anomalies. During an EP-ElNiño, the NECC strengthens across the entire Pacific basin,and the surge in the eastern Pacific Ocean is particularly con-spicuous (Fig. 6a). The eastward surface NECC is reinforcedimmediately after leaving the western boundary, with muchmore intensification taking place to the east of 150°W. Thestrengthening persists for several months into the maturewarm phase. Compared with the EP type of El Niño, theCP-El Niño usually behaves close to the seasonal climatology(Fig. 6b).A statistical significance check was carried out to demon-
strate that the composite analysis (for EP-El Niño events) isrepresentative of the EP type of El Niño. The compositeresult is investigated statistically using the one-sample t-test
t = �x− μ
SD�x
where x̄ is the variable considered, μ is the mean, and SD is thestandard error at the 95% confidence level. Figures 7a and 7bshow the velocity pattern (absolute value, for clarity) of the
SECn and the NECC during the two EP-El Niño events.The 1982/83 event (black line) and the 1997/98 event (redline) behave similarly except that the NECC intensity of the1997/98 event is larger than that of the 1982/83 event (Fig.7b), and the longitude of the maximum velocity differs slightly.Figures 7c and 7d show the t value of zonal currents during theEP-El Niño. The red lines denote the 95% confidence level,and the significance zone is highlighted in blue. During theEP-El Niño, the significance zone for the SECn is from approxi-mately 105°W to 160°E, and the significance zone for theNECCis from approximately 95°W to 150°E. The range mentioned inFigs 5 and 6 falls into this significance zone, indicating that thecomposite result of the EP-El Niño is meaningful. A similar stat-istical significance check was done for the CP-El Niño, and itscomposite result is also significant (figure not shown).
Moreover, a Welch t-test (Welch, 1947) was used to assessthe significance of the difference between means of currentvelocities during the EP-El Niño and the CP-El Niño.Unlike the Student’s t-test that is based on a pooled varianceestimate, the Welch t-test compares variables of unequal sizeand variance. The statistical t value to test whether themeans are different or not can be calculated as
t = X1 − X2
SX1−X2
,
where
SX1−X2=
���������s21n1
+ s22n2
√,
and X1, X2 represent the means of the EP-El Niño and theCP-El Niño, respectively; S is the variance; s1 and s2 representthe variance of EP-El Niño and CP-El Niño, respectively; n1and n2 are the sample sizes. The degree of freedom (df) wascalculated using the Welch–Satterthwaite equation:
df = (s21/n1 + s22/n2)2
(s21/n1)2/(n1 − 1)+ (s22/n2)
2/(n2 − 1).
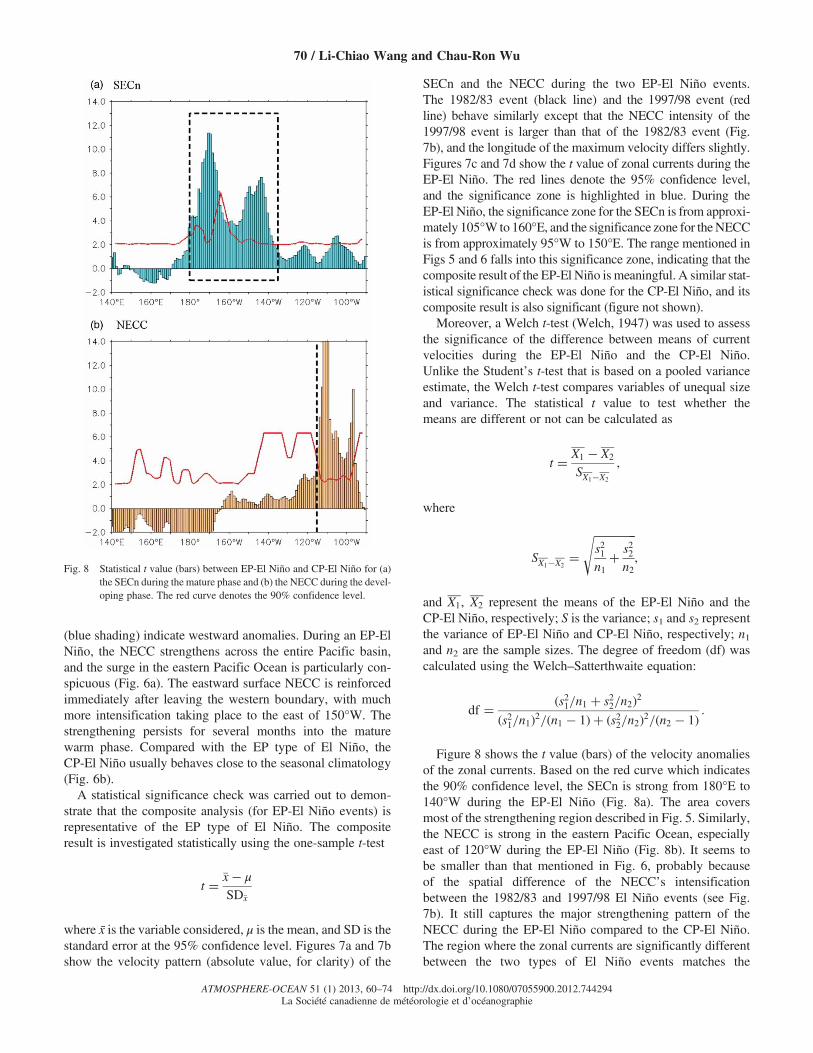
Figure 8 shows the t value (bars) of the velocity anomaliesof the zonal currents. Based on the red curve which indicatesthe 90% confidence level, the SECn is strong from 180°E to140°W during the EP-El Niño (Fig. 8a). The area coversmost of the strengthening region described in Fig. 5. Similarly,the NECC is strong in the eastern Pacific Ocean, especiallyeast of 120°W during the EP-El Niño (Fig. 8b). It seems tobe smaller than that mentioned in Fig. 6, probably becauseof the spatial difference of the NECC’s intensificationbetween the 1982/83 and 1997/98 El Niño events (see Fig.7b). It still captures the major strengthening pattern of theNECC during the EP-El Niño compared to the CP-El Niño.The region where the zonal currents are significantly differentbetween the two types of El Niño events matches the
Fig. 8 Statistical t value (bars) between EP-El Niño and CP-El Niño for (a)the SECn during the mature phase and (b) the NECC during the devel-oping phase. The red curve denotes the 90% confidence level.
70 / Li-Chiao Wang and Chau-Ron Wu
ATMOSPHERE-OCEAN 51 (1) 2013, 60–74 http://dx.doi.org/10.1080/07055900.2012.744294La Société canadienne de météorologie et d’océanographie

Fig. 9 (a) Wind stress curl pattern and (b) 20°C isotherm depth anomalies in September 1997. The contour interval for the wind stress curl is 0.5 × 10⁻⁷ N m−3 andfor the isotherm depth is 10 m.
Fig. 10 As in Fig. 9 except for June 1998.
Equatorial Pacific Currents during Two Types of El Niño / 71
ATMOSPHERE-OCEAN 51 (1) 2013, 60–74 http://dx.doi.org/10.1080/07055900.2012.744294Canadian Meteorological and Oceanographic Society

strengthening pattern discussed earlier, demonstrating that thezonal currents intensify significantly during the EP-El Niñocompared to the CP-El Niño.
d Forcing MechanismIn this study, we demonstrate that both the SECn and EUCweaken, whereas the NECC becomes stronger during theCP-El Niño. This finding somehow matches the earlierdescription for the equatorial current variability during ElNiño events. It is important to note that both the SECn andEUC strengthen at the warm peak of the EP-El Niño.Because the EUC shoals toward the sea surface, it mergeswith the NECC and counteracts the westward SEC aroundthe equator. Thus, the current circulation displays a differentpattern than shown in previous studies which indicates thatboth currents weaken during an El Niño.The reason for the current variability can be linked to the
effects of wind stress curl (WSC). The meridional migrationof the positive WSC exhibits a seasonal cycle. We furtherfound that the zero WSC line shifts much further southduring the EP-El Niño than during the CP-El Niño. Forexample, in September 1997, the zero WSC line is situatednear the equator (Fig. 9a), which is farther south than duringthe developing phase of the CP-El Niño (figure not shown).A near-symmetric WSC is shown across the equator with posi-tive values to the north (approximately 10°N, 170°E) andnegative to the south (approximately 10°S, 170°E), both ele-vating the thermocline (Fig. 9b, the negative value represents
a shallower thermocline). The 20°C isotherm depth (D20)anomalies used in this study are based on the GODASmodel assimilation. The D20 is generally situated close tothe equatorial thermocline and is often used as a proxy forthe thermocline depth (e.g., Ji & Leetmaa, 1997; Kessler,1990). The raised D20 implies shoaling of the EUC, whichis found to merge and intensify the NECC during the maturephase of the EP-El Niño. The large and positive WSC in thenorthwestern equatorial Pacific Ocean also promotes Ekmanpumping in the region, resulting in a thermocline ridge. Theridge causes a meridional sea level gradient, which furtherintensifies the eastward NECC, especially east of 120°Wnear the eastern boundary. The strengthening of the NECClasts almost five months.
In addition to the migration of the WSC pattern, the inten-sity of the WSC also contributes to the different evolution pat-terns under the two types of El Niño events. We found that thepositive WSC in the northwestern Pacific is much larger in theEP-El Niño than that in the CP-El Niño during the developingphase. The stronger WSC results in large thermocline depthvariations during the developing phase of the EP-El Niño.The D20 in the western Pacific Ocean is found to be almost100 m shallower than in the eastern Pacific Ocean (figurenot shown). This east–west D20 gradient fits well with the pre-condition of the warm water discharge process, according tothe recharge-discharge oscillator theory (e.g., Jin, 1997;Wyrtki, 1985). Because the subsurface EUC flows mainlyalong the thermocline, the EP-El Niño with a large east–
Fig. 11 Schematic diagram illustrating the flow patterns between the eastward NECC and the westward SECn during El Niño evolutional phases. The colouredarrows indicate the currents, and the solid red line indicates the variation of the thermocline around the equator.
72 / Li-Chiao Wang and Chau-Ron Wu
ATMOSPHERE-OCEAN 51 (1) 2013, 60–74 http://dx.doi.org/10.1080/07055900.2012.744294La Société canadienne de météorologie et d’océanographie

west D20 gradient can strengthen the EUC from the develop-ing phase to the mature peak of the EP-El Niño.The intensification of the surface SEC is different from that
of the subsurface current. As the NECC intensifies during thedeveloping phase, it transports surface warm water eastwardand accumulates in the eastern Pacific Ocean. The zonal sealevel gradient (or westward pressure gradient force) strength-ens, which intensifies the surface SEC during the EP-El Niño.In addition to sea level gradient, the intensified trade windsalso play a critical role in the SEC intensification. The SECsand SECn merge and flow westward close to the equatorduring the EP-El Niño (Fig. 4c). From the mature phase tothe decaying phase of the EP-El Niño, the easterly tradewinds intensify and prevail around 120°W–160°E along theequator. The easterly winds drive the SEC downwind and con-tribute significantly to its intensification along the equatorwhere the Coriolis force tends to be very weak. On the otherhand, the zonal sea level gradient is much weaker during theCP-El Niño, when the easterly trade winds also relax. Thus,the westward SEC weakens during the CP-El Niño.When evolving into the decaying phase, the WSC pattern
migrates even farther northward and far from the equator,and a strong negative WSC (centred at approximately 10°S,175E°) dominates in the southwestern Pacific Ocean(Fig. 10a). The large and negative WSC elevates the thermo-cline (or decreases the sea level) in the southwestern PacificOcean (Fig. 10b), resulting in meridional pressure gradientanomalies around the equator, which drives a strongerSECC eastward over the approximate region 5°S–15°S,160°E–150°W. The result shown in this simulation is consist-ent with that in Zhang, Lin, and Zhang (2007) who conductedseveral idealized experiments using three ocean–atmospheregeneral circulation models to investigate the air–sea couplingeffects of the surface winds, the Intertropical ConvergenceZone (ITCZ) and the SECC.
4 Concluding remarks
The general circulation pattern and seasonal variation of theequatorial Pacific Ocean show up quite realistically in theGODAS assimilation model. The circulation pattern duringthe CP-El Niño is in good agreement with previous studiesshowing that both the EUC and SEC weaken, while theNECC becomes stronger. On the other hand, the EP-El Niñoexhibits a different circulation pattern. The NECC strengthensfrom the developing phase until the warm peak, and both theSEC and EUC intensify and counteract each other during themature phase of the EP-El Niño.The shifting of the WSC field associated with the thermo-
cline variability is chiefly responsible for the unique current
performance of the EP-El Niño. During the developingphase, the strong positive WSC in the northwestern PacificOcean induces an elevated thermocline, forming a meridionalsea level gradient, and intensifies the NECC. At the warmpeak of the EP-El Niño, the easterly trade winds intensifyand continue for nearly seven months. The easterly winds,together with the sharp westward pressure gradient force, areresponsible for the strengthening of the surface SEC.Figure 11 is a schematic diagram illustrating the flow patternsbetween the eastward NECC and the westward SECn duringEl Niño evolutional phases. The coloured arrows indicatethe currents, and the red line indicates the thermocline vari-ation. In a normal year, the westward SECn dominates at theequator and raises the thermocline in the eastern PacificOcean. During the CP-El Niño, the SECn weakens whereasthe eastward NECC strengthens slightly. During the develop-ing phase of the EP-El Niño, the NECC intensifies signifi-cantly (especially as it flows towards the eastern Pacific),which is mainly associated with the positive WSC in the north-western Pacific Ocean. The SECn is still weak. At the warmpeak of the EP-El Niño, the SECn strengthens on theequator. One of the most striking features is the eastwardcurrent (from the merging of the NECC with the shoalingEUC) interacting with the westward current (the two branchesof the SEC) to form a unique EP-El Niño circulation pattern.
As it moves into the decaying phase, the large negativeWSC in the southwestern Pacific Ocean raises the thermoclinethrough Ekman pumping, resulting in a meridional sea levelgradient. Hence, the SECC intensifies, inducing an air–seainteraction and may affect the termination of the EP-ElNiño. The present study suggests that the ocean–atmosphereinteraction plays an important role in the strengthening ofthe EP-El Niño, which updates some recent studies showingthat the EP-El Niño is mostly produced by basin-wide thermo-cline variations (e.g., Kao & Yu, 2009; Kug et al., 2009; Yu &Kim, 2010).
Acknowledgements
The authors would like to thank the editor, Dr. Guoqi Han, andthe anonymous reviewers for their careful review of the manu-script and detailed suggestions for its improvement. Theauthors are grateful to Drs Tzu-Ling Chiang, Cheng-TaChen, Lie-Yauw Oey and Chih-Chen Hong for useful com-munications on the topic and to D. J. Shea and colleaguesfrom NCAR for assistance in processing the GODASoutput. This research was supported by the National ScienceCouncil, Taiwan, ROC, under grants NSC 100-2119-M-001-029-MY5 and NSC 101-2917-I-003-002.
ReferencesAshok, K., Behera, S., Rao, A. S., Weng, H., & Yamagata, T. (2007). El NiñoModoki and its teleconnection. Journal of Geophysical Research, 112,C11007. doi:10.1029/2006JC003798
Behringer, D., & Xue, Y. (2004). Evaluation of the global ocean data assim-ilation system at NCEP: The Pacific Ocean. Eighth Symposium onIntegrated Observing and Assimilation Systems for Atmosphere, Oceans,
Equatorial Pacific Currents during Two Types of El Niño / 73
ATMOSPHERE-OCEAN 51 (1) 2013, 60–74 http://dx.doi.org/10.1080/07055900.2012.744294Canadian Meteorological and Oceanographic Society

and Land Surface, AMS 84th Annual Meeting, Washington StateConvention and Trade Center, Seattle, Washington, pp. 11–15.
Bjerknes, J. (1969). Atmospheric teleconnections from the equatorial Pacific.Monthly Weather Review, 97, 163–172.
Cai, W., &Whetton, P. H. (2000). Evidence for time-varying pattern of green-house warming in the Pacific Ocean. Geophysical Research Letters, 27,2577–2580.
Delcroix, T., Eldin, G., Radenac, M. H., Toole, J., & Firing, E. (1992).Variations of the western equatorial Pacific Ocean, 1986–1988. Journalof Geophysical Research, 97, 5423–5445.
Gouriou, Y., & Toole, J. (1993). Mean circulation of the upper layers of thewestern equatorial Pacific Ocean. Journal of Geophysical Research, 98,22495–22520.
Gu, D., & Philander, S. G. H. (1997). Interdecadal climate fluctuations thatdepend on exchanges between the tropics and the extratropics. Science,275, 805–807.
Ji, M., & Leetmaa, A. (1997). Impact of data assimilation on ocean initializa-tion and El Niño prediction. Monthly Weather Review, 125, 742–753.
Jin, F. (1997). An equatorial ocean recharge paradigm for ENSO. Part I:Conceptual model. Journal of Atmospheric Science, 54, 811–829.doi:10.1175/1520–0469054<0811:AEORPF>2.0.CO;2
Johnson, G. C., Mcphaden, M. J., Rowe, G. D., & Mctaggart, K. E. (2000).Upper equatorial Pacific Ocean current and salinity variability during the1996–1998 El Niño–La Niña cycle. Journal of Geophysical Research,105, 1037–1053.
Johnson, G. C., Sloyan, B.M., Kessler,W. S., &Mctaggart, K. E. (2002). Directmeasurements of upper ocean currents and water properties across the tropicalPacific during the 1990s. Progress in Oceanography, 52, 31–61.
Kanamitsu, M., Ebisuzaki, W., Woolen, J., Yang, S. K., Hnilo, J. J., Fiorino,M., & Potter, G. L. (2002). NCEP–DOE AMIP–II reanalysis R–2. Bulletinof the American Meteorological Society, 83, 1631–1643.
Kao, H. Y., & Yu, J. Y. (2009). Contrasting eastern-Pacific and central-Pacifictypes of ENSO. Journal of Climate, 22, 615–632. doi:10.1175/2008JCLI2309.1
Keenlyside, N., & Kleeman, R. (2002). Annual cycle of equatorial zonal cur-rents in the Pacific. Journal of Geophysical Research, 107(C8), 3093.doi:10.1029/2000JC000711
Kessler, W. S. (1990). Observations of long Rossby waves in the northern tro-pical Pacific. Journal of Geophysical Research, 95(C4), 5183–5217.
Kug, J. S., Choi, J., An, S. I., Jin, F., & Wittenberg, A. T. (2010). Warm pooland cold tongue El Niño events as simulated by the GFDL 2.1 coupledGCM. Journal of Climate, 23, 1226–1239.
Kug, J. S., Jin, F., & An, S. I. (2009). Two types of El Niño events: Coldtongue El Niño and warm pool El Niño. Journal of Climate, 22,1499–1515. doi:10.1175/2008JCLI2624.1
Li, T., & Philander, S.G. H. (1996). On the annual cycle of the easternequatorial Pacific. Journal of Climate, 9, 2986–2998.
Lukas, R. (1986). The termination of the equatorial undercurrent in the easternPacific. Progress in Oceanography, 16, 63–90.
Lukas, R. (2001). Pacific equatorial currents. In J. H. Steele, S. A. Thorpe, &K. A. Turekian (Eds.), Encyclopedia of ocean sciences (pp. 2069–2076).London: Academic Press.
Philander, S.G. H. (1990). El Niño, La Niña, and the Southern Oscillation.New York: Academic Press.
Philander, S.G. H., Yamagata, T., & Pacanowski, R. C. (1984). Unstable air–sea interaction in the Tropics. Journal of Atmospheric Science, 41,604–613.
Welch, B. L. (1947). The generalization of “student’s” problem when severaldifferent population variances are involved. Biometrika, 34, 28–35.
Wyrtki, K. (1974). Sea level and the seasonal fluctuations of the equatorialcurrents in the western Pacific Ocean. Journal of PhysicalOceanography, 4, 91–103.
Wyrtki, K. (1985). Water displacements in the Pacific and the genesis of ElNiño cycles. Journal of Geophysical Research, 90, 7129–7132.doi:10.1029/JC090iC04p07129
Yeh, S. W., Kug, J. S., Dewitte, B., Kwon, M. H., Kirtman, B. P., & Jin, F.(2009). El Niño in a changing climate. Nature, 461, 511–514.doi:10.1038/nature08316
Yu, J. Y., & Kim, S. T. (2010). Three evolution patterns of central-Pacific ElNiño. Geophysical Research Letters, 37, L08706. doi:10.1029/2010GL042810
Yu, X., & McPhaden, M. J. (1999). Dynamical analysis of seasonal and inter-annual variability in the equatorial Pacific. Journal of PhysicalOceanography, 29, 2350–2369.
Zhang, X., Lin, W., & Zhang, M. (2007). Toward understanding the doubleIntertropical Convergence Zone pathology in coupled ocean–atmospheregeneral circulation models. Journal of Geophysical Research, 112,D12102. doi:10.1029/2006JD007878
74 / Li-Chiao Wang and Chau-Ron Wu
ATMOSPHERE-OCEAN 51 (1) 2013, 60–74 http://dx.doi.org/10.1080/07055900.2012.744294La Société canadienne de météorologie et d’océanographie