performance and memory evaluation using the tau performance system sameer shende, allen d. malony,...
Post on 22-Dec-2015
228 views
TRANSCRIPT

Performance and Memory Evaluation using the TAU Performance System
Sameer Shende, Allen D. Malony, Alan MorrisUniversity of Oregon
{sameer, malony, amorris}@cs.uoregon.edu Holger Brunst, Wolfgang Nagel
T.U. Dresden{holger.brunst, wolfgang.nagel}@.tu-dresden.de
MS14: Application Performance Analysis and Optimization on BlueGene/LSIAM Parallel Processing Conference Wed. Feb 22, 2006. Franciscan Room 5-5:25pmz

TAU Performance SystemSIAM PP’06 2
Outline of Talk
Overview of TAU Instrumentation Measurement Analysis: ParaProf and Vampir/VNG Future work and concluding remarks

TAU Performance SystemSIAM PP’06 3
TAU Performance System Tuning and Analysis Utilities (13+ year project effort) Open Source Performance system for HPC systems
Integrated, scalable, flexible, and parallel Targets a general complex system computation model
Entities: nodes / contexts / threads Multi-level: system / software / parallelism Measurement and analysis abstraction
Integrated toolkit for performance problem solving Instrumentation, measurement, analysis, and visualization Portable performance profiling and tracing facility Performance data management and data mining
http://www.cs.uoregon.edu/research/tau

TAU Performance SystemSIAM PP’06 4
Definitions – Profiling
Profiling Recording of summary information during execution
inclusive, exclusive time, # calls, hardware statistics, … Reflects performance behavior of program entities
functions, loops, basic blocks user-defined “semantic” entities
Very good for low-cost performance assessment Helps to expose performance bottlenecks and hotspots Implemented through
sampling: periodic OS interrupts or hardware counter traps instrumentation: direct insertion of measurement code

TAU Performance SystemSIAM PP’06 5
Definitions – Tracing
Tracing Recording of information about significant points (events)
during program execution entering/exiting code region (function, loop, block, …) thread/process interactions (e.g., send/receive message)
Save information in event record timestamp CPU identifier, thread identifier Event type and event-specific information
Event trace is a time-sequenced stream of event records Can be used to reconstruct dynamic program behavior Typically requires code instrumentation

TAU Performance SystemSIAM PP’06 6
TAU Parallel Performance System Goals
Multi-level performance instrumentation Multi-language automatic source instrumentation
Flexible and configurable performance measurement Widely-ported parallel performance profiling system
Computer system architectures and operating systems Different programming languages and compilers
Support for multiple parallel programming paradigms Multi-threading, message passing, mixed-mode, hybrid
Support for performance mapping Support for object-oriented and generic programming Integration in complex software, systems, applications

TAU Performance SystemSIAM PP’06 7
TAU Performance System Architecture
eventselection

TAU Performance SystemSIAM PP’06 8
TAU Performance System Architecture

TAU Performance SystemSIAM PP’06 9
Program Database Toolkit (PDT)
Application/ Library
C / C++parser
Fortran parserF77/90/95
C / C++IL analyzer
FortranIL analyzer
ProgramDatabase
Files
IL IL
DUCTAPE
PDBhtml
SILOON
CHASM
TAU_instr
Programdocumentation
Applicationcomponent glue
C++ / F90/95interoperability
Automatic sourceinstrumentation

TAU Performance SystemSIAM PP’06 10
TAU Instrumentation Approach
Support for standard program events Routines Classes and templates Statement-level blocks
Support for user-defined events Begin/End events (“user-defined timers”) Atomic events (e.g., size of memory allocated/freed) Selection of event statistics
Support definition of “semantic” entities for mapping Support for event groups Instrumentation optimization (eliminate instrumentation
in lightweight routines)

TAU Performance SystemSIAM PP’06 11
TAU Instrumentation
Flexible instrumentation mechanisms at multiple levels Source code
manual (TAU API, TAU Component API) automatic
C, C++, F77/90/95 (Program Database Toolkit (PDT))OpenMP (directive rewriting (Opari), POMP spec)
Object code pre-instrumented libraries (e.g., MPI using PMPI) statically-linked and dynamically-linked
Executable code dynamic instrumentation (pre-execution) (DynInstAPI) virtual machine instrumentation (e.g., Java using JVMPI)
Proxy Components

TAU Performance SystemSIAM PP’06 12
Using TAU – A tutorial
Configuration Instrumentation
Manual MPI – Wrapper interposition library PDT- Source rewriting for C,C++, F77/90/95 OpenMP – Directive rewriting Component based instrumentation – Proxy components Binary Instrumentation
DyninstAPI – Runtime Instrumentation/Rewriting binary Java – Runtime instrumentation Python – Runtime instrumentation
Measurement Performance Analysis

TAU Performance SystemSIAM PP’06 13
Building Bridges to Other Tools: TAU

TAU Performance SystemSIAM PP’06 14
TAU Performance System Interfaces PDT [U. Oregon, LANL, FZJ] for instrumentation of C++, C99, F95 source code PAPI [UTK] & PCL[FZJ] for accessing hardware performance counters data DyninstAPI [U. Maryland, U. Wisconsin] for runtime instrumentation KOJAK [FZJ, UTK]
Epilog trace generation library CUBE callgraph visualizer Opari OpenMP directive rewriting tool
Vampir/Intel® Trace Analyzer [Pallas/Intel] VTF3 trace generation library for Vampir [TU Dresden] (available from TAU website) Paraver trace visualizer [CEPBA] Jumpshot-4 trace visualizer [MPICH, ANL] JVMPI from JDK for Java program instrumentation [Sun] Paraprof profile browser/PerfDMF database supports:
TAU format Gprof [GNU] HPM Toolkit [IBM] MpiP [ORNL, LLNL] Dynaprof [UTK] PSRun [NCSA]
PerfDMF database can use Oracle, MySQL or PostgreSQL (IBM DB2 support planned)

TAU Performance SystemSIAM PP’06 15
PAPI [UTK]
Performance Application Programming Interface The purpose of the PAPI project is to design,
standardize and implement a portable and efficient API to access the hardware performance monitor counters found on most modern microprocessors.
Parallel Tools Consortium project University of Tennessee, Knoxville http://icl.cs.utk.edu/papi

TAU Performance SystemSIAM PP’06 16
TAU Measurement System Configuration configure [OPTIONS]
{-c++=<CC>, -cc=<cc>} Specify C++ and C compilers {-pthread, -sproc} Use pthread or SGI sproc threads -openmp Use OpenMP threads -jdk=<dir> Specify Java instrumentation (JDK) -opari=<dir> Specify location of Opari OpenMP tool -papi=<dir> Specify location of PAPI -pdt=<dir> Specify location of PDT -dyninst=<dir> Specify location of DynInst Package -mpi[inc/lib]=<dir> Specify MPI library instrumentation -shmem[inc/lib]=<dir> Specify PSHMEM library
instrumentation -python[inc/lib]=<dir> Specify Python instrumentation -epilog=<dir> Specify location of EPILOG -slog2[=<dir>] Specify location of SLOG2/Jumpshot -otf=<dir> Specify location of Open Trace Format -vtf=<dir> Specify location of VTF3 trace
package -arch=<architecture> Specify architecture explicitly
(bgl,ibm64,ibm64linux…)

TAU Performance SystemSIAM PP’06 17
TAU Measurement System Configuration configure [OPTIONS]
-TRACE Generate binary TAU traces -PROFILE (default) Generate profiles (summary) -PROFILECALLPATH Generate call path profiles -PROFILEPHASE Generate phase based profiles -PROFILEMEMORY Track heap memory for each
routine -PROFILEHEADROOM Track memory headroom to grow -MULTIPLECOUNTERS Use hardware counters + time -COMPENSATE Compensate timer overhead -CPUTIME Use usertime+system time -PAPIWALLCLOCK Use PAPI’s wallclock time -PAPIVIRTUAL Use PAPI’s process virtual time -SGITIMERS Use fast IRIX timers -LINUXTIMERS Use fast x86 Linux timers

TAU Performance SystemSIAM PP’06 18
Using TAU on IBM BG/L
Configure PDT: % configure –XLC –exec-prefix=bgl ; make clean install Use XLC compiler
Configure TAU for front-end: % configure ; make clean install Add <taudir>/ppc64/bin/ to your path
Configure TAU for back-end: % configure -arch=bgl –mpi –pdt=<dir> -pdt_c++=xlC Use IBM’s Blue Gene/L blrts_xlC compilers for building the library and
xlC for building tau_instrumentor [-pdt_c++=xlC]. It executes on the front-end.
Libraries are built in <taudir>/bgl/lib/ directory Each configuration creates a unique <arch>/lib/Makefile.tau-<options>
stub makefile that corresponds to the configuration options specified. e.g., /usr/local/tau/tau-2.15.2/bgl/lib/Makefile.tau-mpi-pdt

TAU Performance SystemSIAM PP’06 19
TAU_SETUP: A GUI for Installing TAU
tau-2.x>./tau_setup

TAU Performance SystemSIAM PP’06 20
Configuration Parameters in Stub Makefiles Each TAU Stub Makefile resides in <tau><arch>/lib directory Variables:
TAU_CXX Specify the C++ compiler used by TAU TAU_CC, TAU_F90 Specify the C, F90 compilers TAU_DEFS Defines used by TAU. Add to CFLAGS TAU_LDFLAGS Linker options. Add to LDFLAGS TAU_INCLUDE Header files include path. Add to CFLAGS TAU_LIBS Statically linked TAU library. Add to LIBS TAU_SHLIBS Dynamically linked TAU library TAU_MPI_LIBS TAU’s MPI wrapper library for C/C++ TAU_MPI_FLIBS TAU’s MPI wrapper library for F90 TAU_FORTRANLIBS Must be linked in with C++ linker for F90 TAU_CXXLIBS Must be linked in with F90 linker TAU_INCLUDE_MEMORY Use TAU’s malloc/free wrapper lib TAU_DISABLE TAU’s dummy F90 stub library TAU_COMPILER Instrument using tau_compiler.sh scriptNote: Not including TAU_DEFS in CFLAGS disables instrumentation in
C/C++ programs (TAU_DISABLE for f90).
TAU Performance SystemSIAM PP’06 21
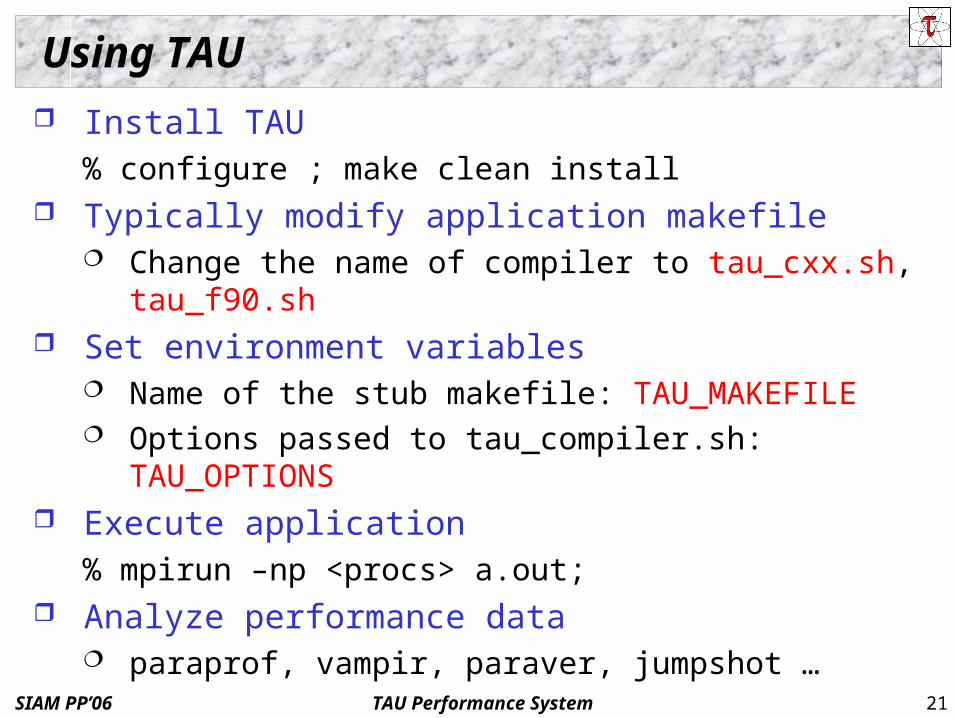
Using TAU
Install TAU% configure ; make clean install
Typically modify application makefile Change the name of compiler to tau_cxx.sh, tau_f90.sh
Set environment variables Name of the stub makefile: TAU_MAKEFILE Options passed to tau_compiler.sh: TAU_OPTIONS
Execute application% mpirun –np <procs> a.out;
Analyze performance data paraprof, vampir, paraver, jumpshot …

TAU Performance SystemSIAM PP’06 22
Manual Instrumentation – C++ Example
#include <TAU.h>
int main(int argc, char **argv)
{
TAU_PROFILE(“int main(int, char **)”, “ ”, TAU_DEFAULT);
TAU_PROFILE_INIT(argc, argv);
TAU_PROFILE_SET_NODE(0); /* for sequential programs */
foo();
return 0;
}
int foo(void)
{
TAU_PROFILE(“int foo(void)”, “ ”, TAU_DEFAULT); // measures entire foo()
TAU_PROFILE_TIMER(t, “foo(): for loop”, “[23:45 file.cpp]”, TAU_USER);
TAU_PROFILE_START(t);
for(int i = 0; i < N ; i++){
work(i);
}
TAU_PROFILE_STOP(t);
// other statements in foo …
}

TAU Performance SystemSIAM PP’06 23
Manual Instrumentation – F90 Examplecc34567 Cubes program – comment line
PROGRAM SUM_OF_CUBES
integer profiler(2)
save profiler
INTEGER :: H, T, U
call TAU_PROFILE_INIT()
call TAU_PROFILE_TIMER(profiler, 'PROGRAM SUM_OF_CUBES')
call TAU_PROFILE_START(profiler)
call TAU_PROFILE_SET_NODE(0)
! This program prints all 3-digit numbers that
! equal the sum of the cubes of their digits.
DO H = 1, 9
DO T = 0, 9
DO U = 0, 9
IF (100*H + 10*T + U == H**3 + T**3 + U**3) THEN
PRINT "(3I1)", H, T, U
ENDIF
END DO
END DO
END DO
call TAU_PROFILE_STOP(profiler)
END PROGRAM SUM_OF_CUBES

TAU Performance SystemSIAM PP’06 24
TAU’s MPI Wrapper Interposition Library Uses standard MPI Profiling Interface
Provides name shifted interface MPI_Send = PMPI_Send Weak bindings
Interpose TAU’s MPI wrapper library between MPI and TAU -lmpi replaced by –lTauMpi –lpmpi –lmpi
No change to the source code! Just re-link the application to generate performance data setenv TAU_MAKEFILE <dir>/<arch>/lib/Makefile.tau-mpi-[options]
Use tau_cxx.sh, tau_f90.sh and tau_cc.sh as compilers

TAU Performance SystemSIAM PP’06 25
Using Program Database Toolkit (PDT)
1. Parse the Program to create foo.pdb:
% cxxparse foo.cpp –I/usr/local/mydir –DMYFLAGS …
or
% cparse foo.c –I/usr/local/mydir –DMYFLAGS …
or
% f95parse foo.f90 –I/usr/local/mydir …
% f95parse *.f –omerged.pdb –I/usr/local/mydir –R free
2. Instrument the program:% tau_instrumentor foo.pdb foo.f90 –o foo.inst.f90
–f select.tau
3. Compile the instrumented program:% ifort foo.inst.f90 –c –I/usr/local/mpi/include –o foo.o

TAU Performance SystemSIAM PP’06 26
Using TAU
Step 1: Configure and install TAU:
% configure -pdt=<dir> -pdt_c++=xlC -arch=bgl –mpi
% make clean; make install
Builds <taudir>/<arch>/lib/Makefile.tau-<options>
% set path=($path <taudir>/ppc64/bin)
Step 2: Choose target stub Makefile
% setenv TAU_MAKEFILE
/usr/local/tau-2.15.2/bgl/lib/Makefile.tau-mpi-pdt
% setenv TAU_OPTIONS ‘-optVerbose -optKeepFiles’
(see tau_compiler.sh for all options)
Step 3: Use tau_f90.sh, tau_cxx.sh and tau_cc.sh as the F90, C++ or C compilers respectively.
% tau_f90.sh -c app.f90
% tau_f90.sh app.o -o app -lm -lblas
Or use these in the application Makefile.

TAU Performance SystemSIAM PP’06 27
Tau_[cxx,cc,f90].sh – Improves Integration in Makefiles
# set TAU_MAKEFILE and TAU_OPTIONS env vars
CXX = tau_cxx.sh
F90 = tau_f90.sh
CFLAGS =
LIBS = -lm
OBJS = f1.o f2.o f3.o … fn.o
app: $(OBJS)
$(CXX) $(LDFLAGS) $(OBJS) -o $@ $(LIBS)
.cpp.o:
$(CC) $(CFLAGS) -c $<

TAU Performance SystemSIAM PP’06 28
Using Stub Makefile and TAU_COMPILER
include /usr/common/acts/TAU/tau-2.15.2/bgl/lib/Makefile.tau-mpi-pdt-trace
MYOPTIONS= -optVerbose –optKeepFiles
F90 = $(TAU_COMPILER) $(MYOPTIONS) mpxlf90
OBJS = f1.o f2.o f3.o …
LIBS = -Lappdir –lapplib1 –lapplib2 …
app: $(OBJS)
$(F90) $(OBJS) –o app $(LIBS)
.f90.o:
$(F90) –c $<

TAU Performance SystemSIAM PP’06 29
TAU_COMPILER Options Optional parameters for $(TAU_COMPILER): [tau_compiler.sh –help]
-optVerbose Turn on verbose debugging messages -optPdtDir="" PDT architecture directory. Typically $(PDTDIR)/$(PDTARCHDIR) -optPdtF95Opts="" Options for Fortran parser in PDT (f95parse) -optPdtCOpts="" Options for C parser in PDT (cparse). Typically
$(TAU_MPI_INCLUDE) $(TAU_INCLUDE) $(TAU_DEFS) -optPdtCxxOpts="" Options for C++ parser in PDT (cxxparse). Typically
$(TAU_MPI_INCLUDE) $(TAU_INCLUDE) $(TAU_DEFS) -optPdtF90Parser="" Specify a different Fortran parser. For e.g., f90parse instead of f95parse -optPdtUser="" Optional arguments for parsing source code -optPDBFile="" Specify [merged] PDB file. Skips parsing phase. -optTauInstr="" Specify location of tau_instrumentor. Typically
$(TAUROOT)/$(CONFIG_ARCH)/bin/tau_instrumentor -optTauSelectFile="" Specify selective instrumentation file for tau_instrumentor -optTau="" Specify options for tau_instrumentor -optCompile="" Options passed to the compiler. Typically
$(TAU_MPI_INCLUDE) $(TAU_INCLUDE) $(TAU_DEFS) -optLinking="" Options passed to the linker. Typically
$(TAU_MPI_FLIBS) $(TAU_LIBS) $(TAU_CXXLIBS) -optNoMpi Removes -l*mpi* libraries during linking (default) -optKeepFiles Does not remove intermediate .pdb and .inst.* files
e.g., % setenv TAU_OPTIONS ‘-optTauSelectFile=select.tau
–optVerbose -optPdtCOpts=“-I/home -DFOO” ’% tau_cxx.sh matrix.cpp -o matrix -lm

TAU Performance SystemSIAM PP’06 30
Optimization of Program Instrumentation
Need to eliminate instrumentation in frequently executing lightweight routines
Throttling of events at runtime:% setenv TAU_THROTTLE 1
Disables instrumentation in routines that execute over 100000 times (TAU_THROTTLE_NUMCALLS) and take less than 10 microseconds of inclusive time per call (TAU_THROTTLE_PERCALL)
Selective instrumentation file to filter events% tau_instrumentor [options] –f <file>
Compensation of local instrumentation overhead % configure -COMPENSATE

TAU Performance SystemSIAM PP’06 31
TAU_REDUCE
Reads profile files and rules Creates selective instrumentation file
Specifies which routines should be excluded from instrumentation
tau_reduce
rules
profile
Selectiveinstrumentation file

TAU Performance SystemSIAM PP’06 32
Memory Profiling in TAU Configuration option –PROFILEMEMORY
Records global heap memory utilization for each function Takes one sample at beginning of each function and associates the sample
with function name Configuration option -PROFILEHEADROOM
Records headroom (amount of free memory to grow) for each function Takes one sample at beginning of each function and associates it with the
callstack [TAU_CALLPATH_DEPTH env variable] Useful for debugging memory usage on IBM BG/L.
Independent of instrumentation/measurement options selected No need to insert macros/calls in the source code User defined atomic events appear in profiles/traces

TAU Performance SystemSIAM PP’06 33
Memory Profiling in TAU
Flash2 code profile (-PROFILEMEMORY) on IBM BlueGene/L [MPI rank 0]

TAU Performance SystemSIAM PP’06 34
Memory Profiling in TAU
Instrumentation based observation of global heap memory (not per function) call TAU_TRACK_MEMORY() call TAU_TRACK_MEMORY_HEADROOM()
Triggers one sample every 10 secs call TAU_TRACK_MEMORY_HERE() call TAU_TRACK_MEMORY_HEADROOM_HERE()
Triggers sample at a specific location in source code call TAU_SET_INTERRUPT_INTERVAL(seconds)
To set inter-interrupt interval for sampling call TAU_DISABLE_TRACKING_MEMORY() call TAU_DISABLE_TRACKING_MEMORY_HEADROOM()
To turn off recording memory utilization call TAU_ENABLE_TRACKING_MEMORY() call TAU_ENABLE_TRACKING_MEMORY_HEADROOM()
To re-enable tracking memory utilization

TAU Performance SystemSIAM PP’06 35
ParaProf – Full Profile (Miranda)
8K processors!

TAU Performance SystemSIAM PP’06 36
ParaProf– Flat Profile (Miranda)

TAU Performance SystemSIAM PP’06 37
ParaProf– Callpath Profile (Flash)

TAU Performance SystemSIAM PP’06 38
Gprof Style Callpath View in Paraprof

TAU Performance SystemSIAM PP’06 39
TAU’s ParaProf Profile Browser: Static Timers

TAU Performance SystemSIAM PP’06 40
ParaProf – 3D Full Profile (Miranda)
16k processors

TAU Performance SystemSIAM PP’06 41
ParaProf Bar Plot (Zoom in/out +/-)

TAU Performance SystemSIAM PP’06 42
ParaProf – 3D Scatterplot (Miranda)
Each pointis a “thread”of execution
A total offour metricsshown inrelation
ParaVis 3Dprofilevisualizationlibrary JOGL

TAU Performance SystemSIAM PP’06 43
Vampir, VNG, and OTF Commercial trace based tools developed at ZiH, T.U. Dresden
Wolfgang Nagel, Holger Brunst and others… Vampir Trace Visualizer (aka Intel ® Trace Analyzer v4.0)
Sequential program Vampir Next Generation (VNG)
Client (vng) runs on a desktop, server (vngd) on a cluster Parallel trace analysis Orders of magnitude bigger traces (more memory) State of the art in parallel trace visualization
Open Trace Format (OTF) Hierarchical trace format, efficient streams based parallel access with VNGD Replacement for proprietary formats such as STF Tracing library available on IBM BG/L platform
Development of OTF supported by LLNL
http://www.vampir-ng.de andhttp://www.paratools.com/otf

TAU Performance SystemSIAM PP’06 44
Vampir Next Generation (VNG) Architecture
MergedTraces
Analysis Server
Classic Analysis:
monolithic
sequential
Worker 1
Worker 2
Worker m
Master
Trace 1Trace 2
Trace 3Trace N
File System
InternetInternet
Parallel Program
Monitor System
Event Streams
Visualization Client
Segment Indicator
768 Processes Thumbnail
Timeline with 16 visible Traces
ProcessParallel
I/OMessage Passing

TAU Performance SystemSIAM PP’06 45
VNG Parallel Analysis Server
Worker 1
Worker 2
Worker m
Master
Worker
Session Thread
Analysis Module
Event Databases
Message Passing
Trace Format Driver
Master
Session Thread
Analysis Merger
Endian Conversion
Message Passing
Socket Communication
VisualizationClient
M Worker
N Session Threads N Session Threads
Traces

TAU Performance SystemSIAM PP’06 46
TAU Tracing Enhancements Configure TAU with -TRACE –vtf=<dir> –otf=<dir> options
% configure –TRACE –vtf=<dir> … % configure –TRACE –otf=<dir> …Generates tau_merge, tau2vtf, tau2otf tools in <tau>/<arch>/bin
directory% tau_f90.sh app.f90 –o app
Instrument and execute application % mpirun -np 4 app
Merge and convert trace files to VTF3/OTF format % tau_treemerge.pl % tau2vtf tau.trc tau.edf app.vpt.gz % vampir foo.vpt.gz
OR % tau2otf tau.trc tau.edf app.otf –n <numstreams> % vampir app.otf
OR use VNG to analyze OTF/VTF trace files

TAU Performance SystemSIAM PP’06 47
Environment Variables
Configure TAU with -TRACE –otf=<dir> option% configure –TRACE –otf=<dir> -arch=bgl-MULTIPLECOUNTERS –papi=<dir> -mpi –pdt=dir –pdt_c++=xlC …
Set environment variables% setenv TRACEDIR /p/gm1/<login>/traces% setenv COUNTER1 GET_TIME_OF_DAY (reqd)% setenv COUNTER2 PAPI_FP_INS% setenv COUNTER3 PAPI_TOT_CYC …
Execute application% srun –N8 –n16 –p pdebug ./a.out [args] tau_treemerge.pl and tau2otf/tau2vtf

TAU Performance SystemSIAM PP’06 48
Using Vampir Next Generation (VNG v1.4)

TAU Performance SystemSIAM PP’06 49
VNG Timeline Display

TAU Performance SystemSIAM PP’06 50
VNG Calltree Display

TAU Performance SystemSIAM PP’06 51
VNG Timeline Zoomed In

TAU Performance SystemSIAM PP’06 52
VNG Grouping of Interprocess Communications

TAU Performance SystemSIAM PP’06 53
VNG Process Timeline with PAPI Counters

TAU Performance SystemSIAM PP’06 54
OTF/VNG Support for Counters

TAU Performance SystemSIAM PP’06 55
VNG Communication Matrix Display

TAU Performance SystemSIAM PP’06 56
VNG Message Profile

TAU Performance SystemSIAM PP’06 57
VNG Process Activity Chart

TAU Performance SystemSIAM PP’06 58
VNG Preferences

TAU Performance SystemSIAM PP’06 59
TAU Performance System Status Computing platforms (selected)
IBM SP/pSeries/BGL, SGI Altix/Origin, Cray T3E/SV-1/X1/XT3, HP (Compaq) SC (Tru64), Sun, Linux clusters (IA-32/64, Alpha, PPC, PA-RISC, Power, Opteron), Apple (G4/5, OS X), Hitachi SR8000, NEC SX-5/6, Windows …
Programming languages C, C++, Fortran 77/90/95, HPF, Java, Python
Thread libraries (selected) pthreads, OpenMP, SGI sproc, Java,Windows, Charm++
Compilers (selected) Intel, PGI, GNU, Fujitsu, Sun, PathScale, SGI, Cray,
IBM, HP, NEC, Absoft, Lahey, Nagware

TAU Performance SystemSIAM PP’06 60
Concluding Discussion Performance tools must be used effectively More intelligent performance systems for productive use
Evolve to application-specific performance technology Deal with scale by “full range” performance exploration Autonomic and integrated tools Knowledge-based and knowledge-driven process
Performance observation methods do not necessarily need to change in a fundamental sense More automatically controlled and efficiently use
Develop next-generation tools and deliver to community Open source with support by ParaTools, Inc. http://www.cs.uoregon.edu/research/tau

TAU Performance SystemSIAM PP’06 61
Support Acknowledgements
Department of Energy (DOE) Office of Science contracts University of Utah ASC Level 1
sub-contract LLNL ASC/NNSA Level 3 contract LLNL ParaTools/GWT contract
Argonne National Laboratory Pete Beckman
T.U. Dresden, GWT Dr. Wolfgang Nagel and Holger Brunst
Research Centre Juelich Dr. Bernd Mohr
Los Alamos National Laboratory contracts