tuning and analysis utilities sameer shende, allen d. malony, robert bell university of oregon
Post on 22-Dec-2015
214 views
TRANSCRIPT
Tuning and Analysis UtilitiesSameer Shende, Allen D. Malony, Robert Bell
University of Oregon
Overview
Introduction Definitions, general problem
Tuning and Analysis Utilities (TAU) Configuration Instrumentation
Various levels of instrumentation Measurement Analysis
Conclusions

Definitions – Profiling
Profiling Recording of summary information during execution
execution time, # calls, hardware statistics, … Reflects performance behavior of program entities
functions, loops, basic blocks user-defined “semantic” entities
Very good for low-cost performance assessment Helps to expose performance bottlenecks and hotspots Implemented through
sampling: periodic OS interrupts or hardware counter traps instrumentation: direct insertion of measurement code

Definitions – Tracing
Tracing Recording of information about significant points (events)
during program execution entering/exiting code region (function, loop, block, …) thread/process interactions (e.g., send/receive message)
Save information in event record timestamp CPU identifier, thread identifier Event type and event-specific information
Event trace is a time-sequenced stream of event records Can be used to reconstruct dynamic program behavior Typically requires code instrumentation

Definitions – Instrumentation
Instrumentation Insertion of extra code (hooks) into program Source instrumentation
Done by compiler, source-to-source translator, or manually
+ portable
+ links back to program code
– re-compile is necessary for (change in) instrumentation
– requires source to be available
– hard to use in standard way for mix-language programs
– source-to-source translators hard to develop for C++, F90 Object code instrumentation
“re-writing” the executable to insert hooks

Definitions – Instrumentation (continued)
Dynamic code instrumentation a debugger-like instrumentation approach executable code instrumentation on running program DynInst [U. Maryland, U. Wisc] and DPCL are examples
+/– switch around compared to source instrumentation Pre-instrumented library
typically used for MPI and PVM program analysis supported by link-time library interposition
+ easy to use since only re-linking is necessary
– can only record information about library entities

Event Tracing: Instrumentation, Monitor, Trace
1 master
2 slave
3 ...
void slave { trace(ENTER, 2); ... recv(A, tag, buf); trace(RECV, A); ... trace(EXIT, 2);}
void master { trace(ENTER, 1); ... trace(SEND, B); send(B, tag, buf); ... trace(EXIT, 1);}
MONITOR 58 A ENTER 1
60 B ENTER 2
62 A SEND B
64 A EXIT 1
68 B RECV A
...
69 B EXIT 2
...
CPU A:
CPU B:
Event definition
timestamp

Event Tracing: “Timeline” Visualization
1 master
2 slave
3 ...
58 A ENTER 1
60 B ENTER 2
62 A SEND B
64 A EXIT 1
68 B RECV A
...
69 B EXIT 2
...
mainmasterslave
58 60 62 64 66 68 70
B
A

TAU Performance System Framework
Tuning and Analysis Utilities Performance system framework for scalable parallel and distributed high-
performance computing Targets a general complex system computation model
nodes / contexts / threads Multi-level: system / software / parallelism Measurement and analysis abstraction
Integrated toolkit for performance instrumentation, measurement, analysis, and visualization Portable, configurable performance profiling/tracing facility Open software approach
University of Oregon, LANL, FZJ Germany http://www.cs.uoregon.edu/research/paracomp/tau
Strategies for Empirical Performance Evaluation
Empirical performance evaluation as a series of performance experiments Experiment trials describing instrumentation and
measurement requirements Where/When/How axes of empirical performance space
where are performance measurements made in program when is performance instrumentation done how are performance measurement/instrumentation chosen
Strategies for achieving flexibility and portability goals Limited performance methods restrict evaluation scope Non-portable methods force use of different techniques Integration and combination of strategies

TAU Performance System Architecture
TAU Instrumentation
Flexible instrumentation mechanisms at multiple levels Source code
manual automatic using Program Database Toolkit (PDT), OPARI
Object code pre-instrumented libraries (e.g., MPI using PMPI) statically linked dynamically linked (e.g., Virtual machine instrumentation) fast breakpoints (compiler generated)
Executable code dynamic instrumentation (pre-execution) using DynInstAPI
TAU Instrumentation (continued)
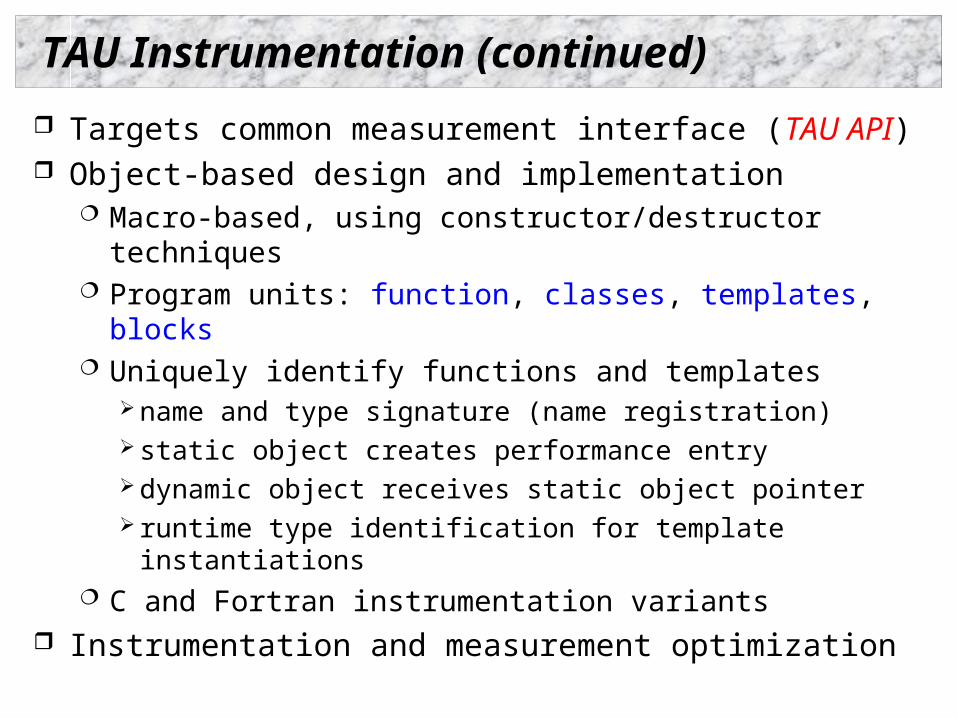
Targets common measurement interface (TAU API) Object-based design and implementation
Macro-based, using constructor/destructor techniques Program units: function, classes, templates, blocks Uniquely identify functions and templates
name and type signature (name registration) static object creates performance entry dynamic object receives static object pointer runtime type identification for template instantiations
C and Fortran instrumentation variants Instrumentation and measurement optimization

Multi-Level Instrumentation
Uses multiple instrumentation interfaces Shares information: cooperation between interfaces Taps information at multiple levels Provides selective instrumentation at each level Targets common measurement interface (TAU API) Targets a common performance model Presents a unified view of execution

TAU Measurement
Performance information High-resolution timer library (real-time / virtual clocks) General software counter library (user-defined events) Hardware performance counters
PAPI (Performance API) (UTK, Ptools Consortium) PCL (Performance Counter Library) (ZAM, Germany) consistent, portable API
Organization Node, context, thread levels Profile groups for collective events (runtime selective) Performance data mapping between software levels

TAU Measurement (continued)
Parallel profiling Function-level, block-level, statement-level Supports user-defined events TAU parallel profile database Call path profiles Hardware counts values (in replace of time)
Tracing All profile-level events Interprocess communication events Timestamp synchronization
User-configurable measurement library (user controlled)

TAU Measurement System Configuration configure [OPTIONS]
{-c++=<CC>, -cc=<cc>} Specify C++ and C compilers {-pthread, -sproc} Use pthread or SGI sproc threads -openmp Use OpenMP threads -jdk=<dir> Specify Java instrumentation (JDK) -opari=<dir> Specify location of Opari OpenMP tool -papi=<dir> Specify location of PAPI -pdt=<dir> Specify location of PDT -dyninst=<dir> Specify location of DynInst Package -mpi[inc/lib]=<dir> Specify MPI library instrumentation -python[inc/lib]=<dir> Specify Python instrumentation -epilog=<dir> Specify location of EPILOG

TAU Measurement System Configuration
configure [OPTIONS] -TRACE Generate binary TAU traces -PROFILE (default) Generate profiles (summary) -PROFILECALLPATH Generate call path profiles -PROFILESTATS Generate std. dev. statistics -MULTIPLECOUNTERS Use hardware counters + time -CPUTIME Use usertime+system time -PAPIWALLCLOCK Use PAPI’s wallclock time -PAPIVIRTUAL Use PAPI’s process virtual
time -SGITIMERS Use fast IRIX timers -LINUXTIMERS Use fast x86 Linux timers

Description of Optional Packages
PAPI – Measures hardware performance data e.g., floating point instructions, L1 data cache misses etc.
PCL – Measures hardware performance data DyninstAPI – Helps instrument an application binary at
runtime or rewrites the binary EPILOG – Trace library. Epilog traces can be analyzed
by EXPERT [FZJ], an automated bottleneck detection tool.
Opari – Tool that instruments OpenMP programs Vampir – Commercial trace visualization tool [Pallas] Paraver – Trace visualization tool [CEPBA]

TAU Measurement Configuration – Examples
./configure -c++=xlC_r –pthread Use TAU with xlC_r and pthread library under AIX Enable TAU profiling (default)
./configure -TRACE –PROFILE Enable both TAU profiling and tracing
./configure -c++=guidec++ -cc=guidec -papi=/usr/local/packages/papi –openmp -mpiinc=/usr/packages/mpich/include -mpilib=/usr/packages/mpich/lib Use OpenMP+MPI using KAI's Guide compiler suite and
use PAPI for accessing hardware performance counters for measurements
Typically configure multiple measurement libraries
Performance Mapping
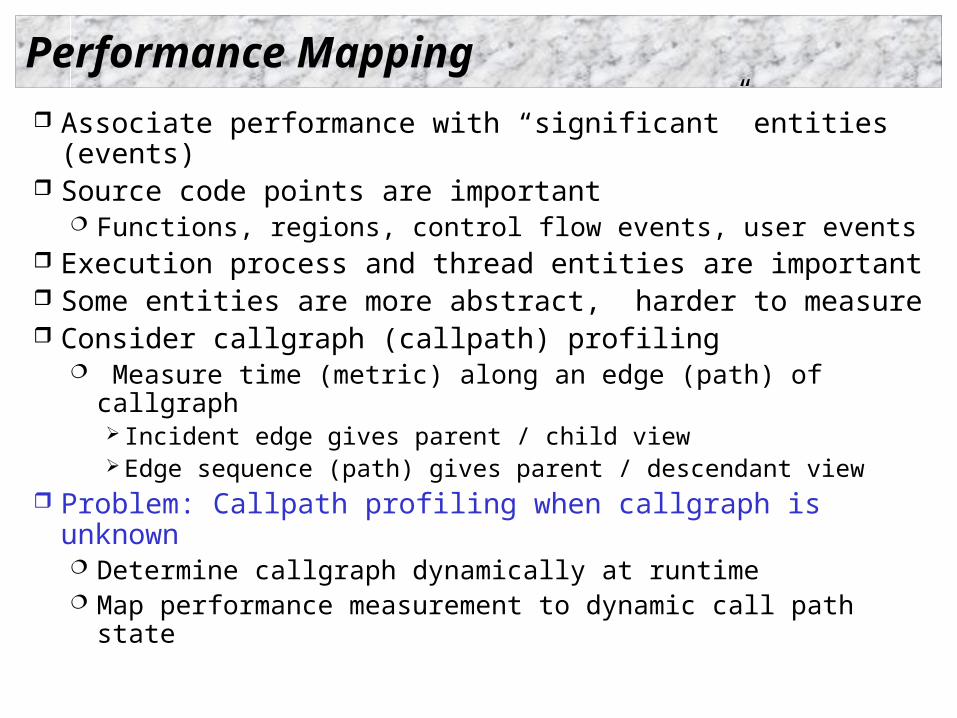
Associate performance with “significant” entities (events)
Source code points are important Functions, regions, control flow events, user events
Execution process and thread entities are important Some entities are more abstract, harder to measure Consider callgraph (callpath) profiling
Measure time (metric) along an edge (path) of callgraph Incident edge gives parent / child view Edge sequence (path) gives parent / descendant view
Problem: Callpath profiling when callgraph is unknown Determine callgraph dynamically at runtime Map performance measurement to dynamic call path state

k-Level Callpath Implementation in TAU
TAU maintains a performance event (routine) callstack Profiled routine (child) looks in callstack for parent
Previous profiled performance event is the parent A callpath profile structure created first time parent calls TAU records parent in a callgraph map for child String representing k-level callpath used as its key
“a( )=>b( )=>c()” : name for time spent in “c” when called by “b” when “b” is called by “a”
Map returns pointer to callpath profile structure k-level callpath is profiled using this profiling data Set environment variable TAU_CALLPATH_DEPTH to depth
Build upon TAU’s performance mapping technology Measurement is independent of instrumentation Use –PROFILECALLPATH to configure TAU

k-Level Callpath Implementation in TAU

TAU Instrumentation Options
Manual instrumentation TAU Profiling API
Automatic instrumentation approaches PDT – Source-to-source translation MPI - Wrapper interposition library Opari – OpenMP directive rewriting DyninstAPI – Runtime instrumentation, rewrite binary
Manual Instrumentation – Using TAU
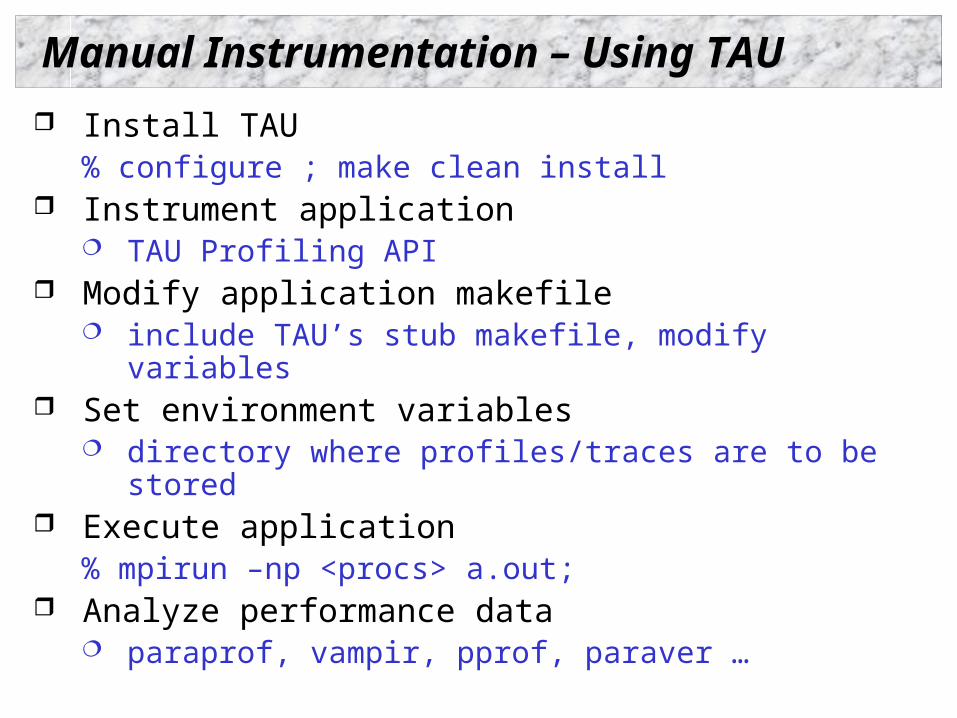
Install TAU% configure ; make clean install
Instrument application TAU Profiling API
Modify application makefile include TAU’s stub makefile, modify variables
Set environment variables directory where profiles/traces are to be stored
Execute application% mpirun –np <procs> a.out;
Analyze performance data paraprof, vampir, pprof, paraver …

Setup: Running Applications
% setenv PROFILEDIR /home/data/experiments/profile/01
% setenv TRACEDIR /home/data/experiments/trace/01(optional)
% set path=($path <taudir>/<arch>/bin)
% setenv LD_LIBRARY_PATH $LD_LIBRARY_PATH\:<taudir>/<arch>/lib
For PAPI (1 counter):
% setenv PAPI_EVENT PAPI_FP_INS
For PAPI (multiplecounters):
% setenv COUNTER1 PAPI_FP_INS (PAPI’s Floating point ins)
% setenv COUNTER2 PAPI_L1_DCM (PAPI’s L1 Data cache misses)
% setenv COUNTER3 P_VIRTUAL_TIME (PAPI’s virtual time)
% setenv COUNTER4 LINUX_TIMERS (Wallclock time)
% mpirun –np <n> <application>
% llsubmit job.sh
For Callpath Profiling:
% setenv TAU_CALLPATH_DEPTH 10

TAU Manual Instrumentation API for C/C++
Initialization and runtime configuration TAU_PROFILE_INIT(argc, argv);
TAU_PROFILE_SET_NODE(myNode);TAU_PROFILE_SET_CONTEXT(myContext);TAU_PROFILE_EXIT(message);TAU_REGISTER_THREAD();
Function and class methods TAU_PROFILE(name, type, group);
Template TAU_TYPE_STRING(variable, type);
TAU_PROFILE(name, type, group);CT(variable);
User-defined timing TAU_PROFILE_TIMER(timer, name, type, group);
TAU_PROFILE_START(timer);TAU_PROFILE_STOP(timer);

TAU Measurement API (continued)
User-defined events TAU_REGISTER_EVENT(variable, event_name);
TAU_EVENT(variable, value);TAU_PROFILE_STMT(statement);
Mapping TAU_MAPPING(statement, key);
TAU_MAPPING_OBJECT(funcIdVar);TAU_MAPPING_LINK(funcIdVar, key);
TAU_MAPPING_PROFILE (funcIdVar);TAU_MAPPING_PROFILE_TIMER(timer, funcIdVar);TAU_MAPPING_PROFILE_START(timer);TAU_MAPPING_PROFILE_STOP(timer);
Reporting TAU_REPORT_STATISTICS();
TAU_REPORT_THREAD_STATISTICS();

Manual Instrumentation – C++ Example
#include <TAU.h>
int main(int argc, char **argv)
{
TAU_PROFILE(“int main(int, char **)”, “ ”, TAU_DEFAULT);
TAU_PROFILE_INIT(argc, argv);
TAU_PROFILE_SET_NODE(0); /* for sequential programs */
foo();
return 0;
}
int foo(void)
{
TAU_PROFILE(“int foo(void)”, “ ”, TAU_DEFAULT); // measures entire foo()
TAU_PROFILE_TIMER(t, “foo(): for loop”, “[23:45 file.cpp]”, TAU_USER);
TAU_PROFILE_START(t);
for(int i = 0; i < N ; i++){
work(i);
}
TAU_PROFILE_STOP(t);
// other statements in foo …
}

Manual Instrumentation – C Example
#include <TAU.h>
int main(int argc, char **argv)
{
TAU_PROFILE_TIMER(tmain, “int main(int, char **)”, “ ”, TAU_DEFAULT);
TAU_PROFILE_INIT(argc, argv);
TAU_PROFILE_SET_NODE(0); /* for sequential programs */
TAU_PROFILE_START(tmain);
foo();
…
TAU_PROFILE_STOP(tmain);
return 0;
}
int foo(void)
{
TAU_PROFILE_TIMER(t, “foo()”, “ ”, TAU_USER);
TAU_PROFILE_START(t);
for(int i = 0; i < N ; i++){
work(i);
}
TAU_PROFILE_STOP(t);
}

Manual Instrumentation – F90 Examplecc34567 Cubes program – comment line
PROGRAM SUM_OF_CUBES
integer profiler(2)
save profiler
INTEGER :: H, T, U
call TAU_PROFILE_INIT()
call TAU_PROFILE_TIMER(profiler, 'PROGRAM SUM_OF_CUBES')
call TAU_PROFILE_START(profiler)
call TAU_PROFILE_SET_NODE(0)
! This program prints all 3-digit numbers that
! equal the sum of the cubes of their digits.
DO H = 1, 9
DO T = 0, 9
DO U = 0, 9
IF (100*H + 10*T + U == H**3 + T**3 + U**3) THEN
PRINT "(3I1)", H, T, U
ENDIF
END DO
END DO
END DO
call TAU_PROFILE_STOP(profiler)
END PROGRAM SUM_OF_CUBES

Instrumenting Multithreaded Applications
#include <TAU.h>
void * threaded_function(void *data)
{
TAU_REGISTER_THREAD(); // Before any other TAU calls
TAU_PROFILE(“void * threaded_function”, “ ”, TAU_DEFAULT);
work();
}
int main(int argc, char **argv)
{
TAU_PROFILE(“int main(int, char **)”, “ ”, TAU_DEFAULT);
TAU_PROFILE_INIT(argc, argv);
TAU_PROFILE_SET_NODE(0); /* for sequential programs */
pthread_attr_t attr;
pthread_t tid;
pthread_attr_init(&attr);
pthread_create(&tid, NULL, threaded_function, NULL);
return 0;
}

Python Manual Instrumentation Example
#!/usr/bin/env/python
import pytau
From time import sleep
x = pytau.profileTimer(``Timer A’’)
pytau.start(x)
print “ Sleeping for 5 seconds ”
sleep(5)
pytau.stop(x)
Running:% setenv PYTHONPATH <tau>/<arch>/lib
% ./application.py

Python Automatic Instrumentation Example
#!/usr/bin/env/python
import tau
from time import sleep
def f2():
print “ In f2: Sleeping for 2 seconds ”
sleep(2)
def f1():
print “ In f1: Sleeping for 3 seconds ”
sleep(3)
def OurMain():
f1()
tau.run(‘OurMain()’)
Running:% setenv PYTHONPATH <tau>/<arch>/lib
% ./auto.py
Instruments OurMain, f1, f2, print, sleep…
CCA Performance Observation Component
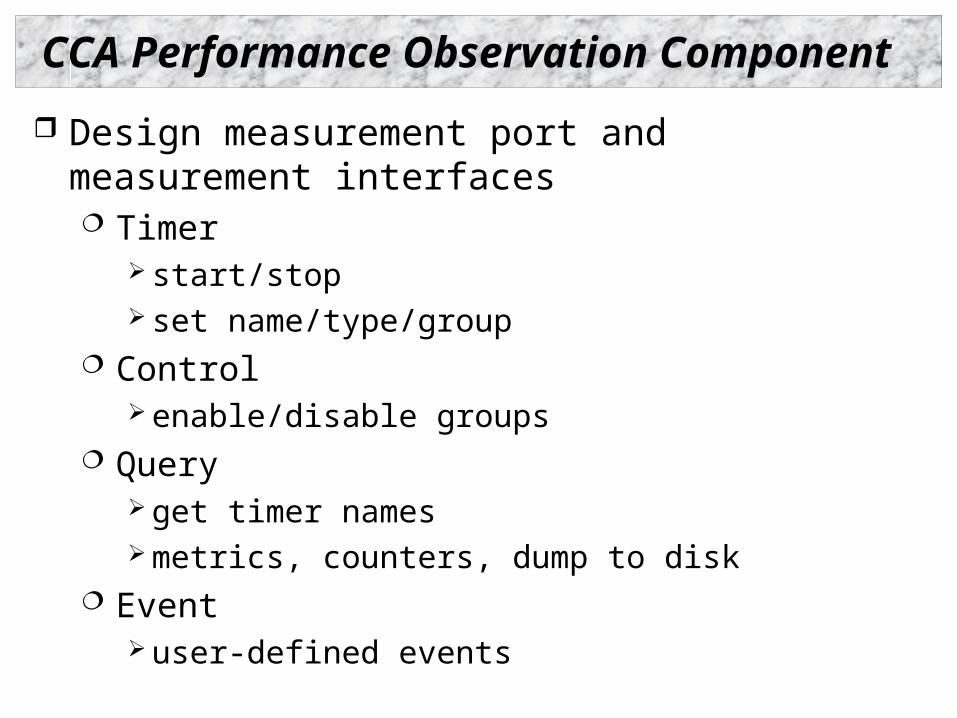
Design measurement port and measurement interfaces Timer
start/stop set name/type/group
Control enable/disable groups
Query get timer names metrics, counters, dump to disk
Event user-defined events

CCA C++ (CCAFFEINE) Performance Interfacenamespace performance { namespace ccaports { class Measurement: public virtual classic::gov::cca::Port { public: virtual ~ Measurement (){}
/* Create a Timer interface */ virtual performance::Timer* createTimer(void) = 0; virtual performance::Timer* createTimer(string name) = 0; virtual performance::Timer* createTimer(string name, string type) = 0;
virtual performance::Timer* createTimer(string name, string type, string group) = 0;
/* Create a Query interface */ virtual performance::Query* createQuery(void) = 0;
/* Create a user-defined Event interface */ virtual performance::Event* createEvent(void) = 0; virtual performance::Event* createEvent(string name) = 0;
/* Create a Control interface for selectively enabling and disabling * the instrumentation based on groups */ virtual performance::Control* createControl(void) = 0; }; }}
Measurement port
Measurement interfaces

CCA Timer Interface Declaration
namespace performance { class Timer { public: virtual ~Timer() {}
/* Implement methods in a derived class to provide functionality */
/* Start and stop the Timer */ virtual void start(void) = 0; virtual void stop(void) = 0;
/* Set name and type for Timer */ virtual void setName(string name) = 0; virtual string getName(void) = 0; virtual void setType(string name) = 0; virtual string getType(void) = 0;
/* Set the group name and group type associated with the Timer */ virtual void setGroupName(string name) = 0; virtual string getGroupName(void) = 0;
virtual void setGroupId(unsigned long group ) = 0; virtual unsigned long getGroupId(void) = 0; };}
Timer interface methods

Use of Observation Component in CCA Example
#include "ports/Measurement_CCA.h"...double MonteCarloIntegrator::integrate(double lowBound, double upBound, int count) { classic::gov::cca::Port * port; double sum = 0.0; // Get Measurement port port = frameworkServices->getPort ("MeasurementPort"); if (port) measurement_m = dynamic_cast < performance::ccaports::Measurement * >(port); if (measurement_m == 0){ cerr << "Connected to something other than a Measurement port"; return -1; } static performance::Timer* t = measurement_m->createTimer( string("IntegrateTimer")); t->start(); for (int i = 0; i < count; i++) { double x = random_m->getRandomNumber (); sum = sum + function_m->evaluate (x); } t->stop();}

Compiling: TAU Makefiles
Include TAU Stub Makefile (<arch>/lib) in the user’s Makefile. Variables:
TAU_CXX Specify the C++ compiler used by TAU TAU_CC, TAU_F90 Specify the C, F90 compilers TAU_DEFS Defines used by TAU. Add to CFLAGS TAU_LDFLAGS Linker options. Add to LDFLAGS TAU_INCLUDE Header files include path. Add to CFLAGS TAU_LIBS Statically linked TAU library. Add to LIBS TAU_SHLIBS Dynamically linked TAU library TAU_MPI_LIBS TAU’s MPI wrapper library for C/C++ TAU_MPI_FLIBS TAU’s MPI wrapper library for F90 TAU_FORTRANLIBS Must be linked in with C++ linker for F90. TAU_DISABLE TAU’s dummy F90 stub library
Note: Not including TAU_DEFS in CFLAGS disables instrumentation in C/C++ programs (TAU_DISABLE for f90).

Including TAU Makefile - Example
include /usr/tau/sgi64/lib/Makefile.tau-pthread-kcc
CXX = $(TAU_CXX)
CC = $(TAU_CC)
CFLAGS = $(TAU_DEFS)
LIBS = $(TAU_LIBS)
OBJS = ...
TARGET= a.out
TARGET: $(OBJS)
$(CXX) $(LDFLAGS) $(OBJS) -o $@ $(LIBS)
.cpp.o:
$(CC) $(CFLAGS) -c $< -o $@
TAU Instrumentation Options
Manual instrumentation TAU Profiling API
Automatic instrumentation approaches PDT – Source-to-source translation MPI - Wrapper interposition library Opari – OpenMP directive rewriting DyninstAPI – Runtime instrumentation, rewrite binary
Program Database Toolkit (PDT)
Program code analysis framework for developing source-based tools
High-level interface to source code information Integrated toolkit for source code parsing, database
creation, and database query commercial grade front end parsers portable IL analyzer, database format, and access API open software approach for tool development
Target and integrate multiple source languages Use in TAU to build automated performance
instrumentation tools

PDT Architecture and Tools
C/C++ Fortran
77/90

PDT Components Language front end
Edison Design Group (EDG): C, C++, Java Mutek Solutions Ltd.: F77, F90 Cleanscape FortranLint F95 parser/analyzer (in progress) creates an intermediate-language (IL) tree
IL Analyzer processes the intermediate language (IL) tree creates “program database” (PDB) formatted file
DUCTAPE (Bernd Mohr, ZAM, Germany) C++ program Database Utilities and Conversion Tools
APplication Environment processes and merges PDB files C++ library to access the PDB for PDT applications

TAU Makefile for PDT
include /usr/tau/include/Makefile
CXX = $(TAU_CXX)
CC = $(TAU_CC)
PDTPARSE = $(PDTDIR)/$(CONFIG_ARCH)/bin/cxxparse
TAUINSTR = $(TAUROOT)/$(CONFIG_ARCH)/bin/tau_instrumentor
CFLAGS = $(TAU_DEFS)
LIBS = $(TAU_LIBS)
OBJS = ...
TARGET= a.out
TARGET: $(OBJS)
$(CXX) $(LDFLAGS) $(OBJS) -o $@ $(LIBS)
.cpp.o:
$(PDTPARSE) $<
$(TAUINSTR) $*.pdb $< -o $*.inst.cpp –f select.dat
$(CC) $(CFLAGS) -c $*.inst.cpp -o $@

Instrumentation Control
Selection of which performance events to observe Could depend on scope, type, level of interest Could depend on instrumentation overhead
How is selection supported in instrumentation system? No choice Include / exclude routine and file lists (TAU) Environment variables Static vs. dynamic
Problem: Controlling instrumentation of small routines High relative measurement overhead Significant intrusion and possible perturbation

Using PDT: tau_instrumentor% tau_instrumentor
Usage : tau_instrumentor <pdbfile> <sourcefile> [-o <outputfile>] [-noinline] [-g groupname] [-i headerfile] [-c|-c++|-fortran] [-f <instr_req_file> ]
For selective instrumentation, use –f option
% cat selective.dat
# Selective instrumentation: Specify an exclude/include list.
BEGIN_EXCLUDE_LIST
void quicksort(int *, int, int)
void sort_5elements(int *)
void interchange(int *, int *)
END_EXCLUDE_LIST
# If an include list is specified, the routines in the list will be the only
# routines that are instrumented.
# To specify an include list (a list of routines that will be instrumented)
# remove the leading # to uncomment the following lines
#BEGIN_INCLUDE_LIST
#int main(int, char **)
#int select_
#END_INCLUDE_LIST

Rule-Based Overhead Analysis
Analyze the performance data to determine events with high (relative) overhead performance measurements
Create a select list for excluding those events Rule grammar (used in tau_reduce tool)
[GroupName:] Field Operator Number GroupName indicates rule applies to events in group Field is a event metric attribute (from profile statistics)
numcalls, numsubs, percent, usec, cumusec, count [PAPI], totalcount, stdev, usecs/call, counts/call
Operator is one of >, <, or = Number is any number Compound rules possible using & between simple rules

Example Rules
#Exclude all events that are members of TAU_USER #and use less than 1000 microsecondsTAU_USER:usec < 1000
#Exclude all events that have less than 100 #microseconds and are called only onceusec < 1000 & numcalls = 1
#Exclude all events that have less than 1000 usecs per #call OR have a (total inclusive) percent less than 5usecs/call < 1000percent < 5
Scientific notation can be used usec>1000 & numcalls>400000 & usecs/call<30 & percent>25

TAU_REDUCE
Reads profile files and rules Creates selective instrumentation file
Specifies which routines should be excluded from instrumentation
tau_reduce
rules
profile
Selectiveinstrumentation file

TAU Instrumentation Options
Manual instrumentation TAU Profiling API
Automatic instrumentation approaches PDT – Source-to-source translation MPI - Wrapper interposition library Opari – OpenMP directive rewriting DyninstAPI – Runtime instrumentation, rewrite binary
TAU’s MPI Wrapper Interposition Library
Uses standard MPI Profiling Interface Provides name shifted interface
MPI_Send = PMPI_Send Weak bindings
Interpose TAU’s MPI wrapper library between MPI and TAU -lmpi replaced by –lTauMpi –lpmpi –lmpi

MPI Library Instrumentation (MPI_Send)
int MPI_Send(…) /* TAU redefines MPI_Send */...{
int returnVal, typesize;TAU_PROFILE_TIMER(tautimer, "MPI_Send()", " ", TAU_MESSAGE);TAU_PROFILE_START(tautimer);if (dest != MPI_PROC_NULL) {
PMPI_Type_size(datatype, &typesize);TAU_TRACE_SENDMSG(tag, dest, typesize*count);
} /* Wrapper calls PMPI_Send */ returnVal = PMPI_Send(buf, count, datatype, dest, tag, comm);
TAU_PROFILE_STOP(tautimer); return returnVal;
}

Including TAU’s stub Makefile
include /usr/tau/sgi64/lib/Makefile.tau-mpi
CXX = $(TAU_CXX)
CC = $(TAU_CC)
CFLAGS = $(TAU_DEFS)
LIBS = $(TAU_MPI_LIBS) $(TAU_LIBS)
LD_FLAGS = $(USER_OPT) $(TAU_LDFLAGS)
OBJS = ...
TARGET= a.out
TARGET: $(OBJS)
$(CXX) $(LDFLAGS) $(OBJS) -o $@ $(LIBS)
.cpp.o:
$(CC) $(CFLAGS) -c $< -o $@

TAU Instrumentation Options
Manual instrumentation TAU Profiling API
Automatic instrumentation approaches PDT – Source-to-source translation MPI - Wrapper interposition library Opari – OpenMP directive rewriting DyninstAPI – Runtime instrumentation, rewrite binary

Instrumentation of OpenMP Constructs
OOpenMP PPragma AAnd RRegion IInstrumentor Source-to-Source translator to insert POMP calls
around OpenMP constructs and API functions Done: Supports
Fortran77 and Fortran90, OpenMP 2.0 C and C++, OpenMP 1.0 POMP Extensions EPILOG and TAU POMP implementations Preserves source code information (#line line file)
Work in Progress:Investigating standardization through OpenMP Forum
OpenMP API Instrumentation
Transform omp_#_lock() pomp_#_lock() omp_#_nest_lock() pomp_#_nest_lock()
[ # = init | destroy | set | unset | test ]
POMP version Calls omp version internally Can do extra stuff before and after call
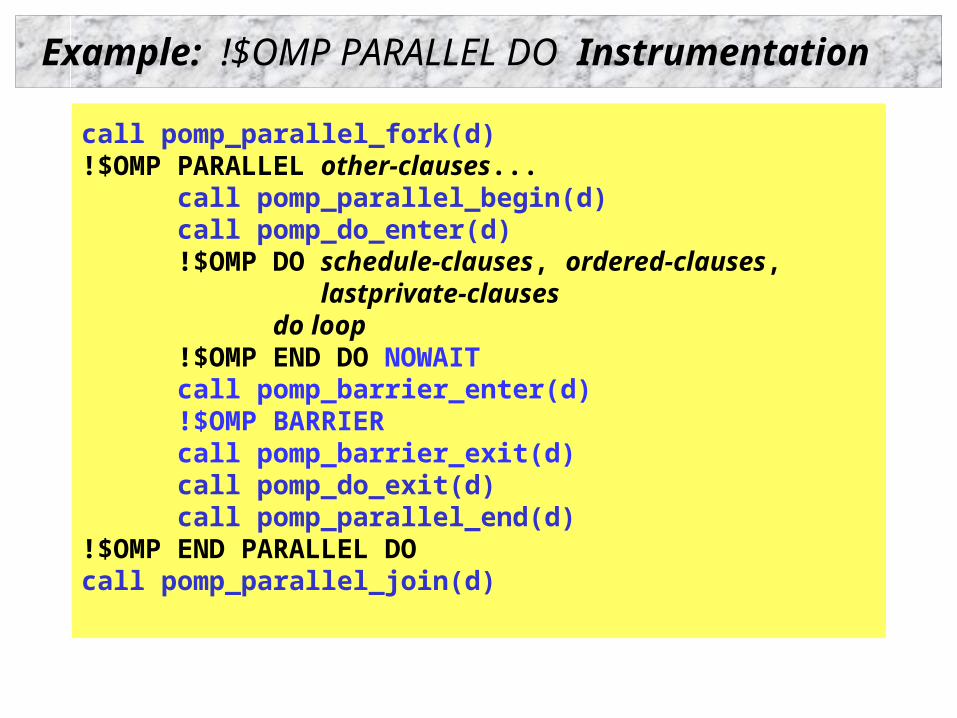
Example: !$OMP PARALLEL DO Instrumentation
!$OMP PARALLEL DO clauses...
do loop
!$OMP END PARALLEL DO
!$OMP PARALLEL other-clauses...
!$OMP DO schedule-clauses, ordered-clauses, lastprivate-clausesdo loop
!$OMP END DO
!$OMP END PARALLEL DO
NOWAIT
!$OMP BARRIER
call pomp_parallel_fork(d)
call pomp_parallel_begin(d)
call pomp_parallel_end(d)
call pomp_parallel_join(d)
call pomp_do_enter(d)
call pomp_do_exit(d)
call pomp_barrier_enter(d)
call pomp_barrier_exit(d)

Opari Instrumentation: Example
OpenMP directive instrumentationpomp_for_enter(&omp_rd_2);
#line 252 "stommel.c"
#pragma omp for schedule(static) reduction(+: diff) private(j) firstprivate (a1,a2,a3,a4,a5) nowait
for( i=i1;i<=i2;i++) {
for(j=j1;j<=j2;j++){
new_psi[i][j]=a1*psi[i+1][j] + a2*psi[i-1][j] + a3*psi[i][j+1]
+ a4*psi[i][j-1] - a5*the_for[i][j];
diff=diff+fabs(new_psi[i][j]-psi[i][j]);
}
}
pomp_barrier_enter(&omp_rd_2);
#pragma omp barrier
pomp_barrier_exit(&omp_rd_2);
pomp_for_exit(&omp_rd_2);
#line 261 "stommel.c"
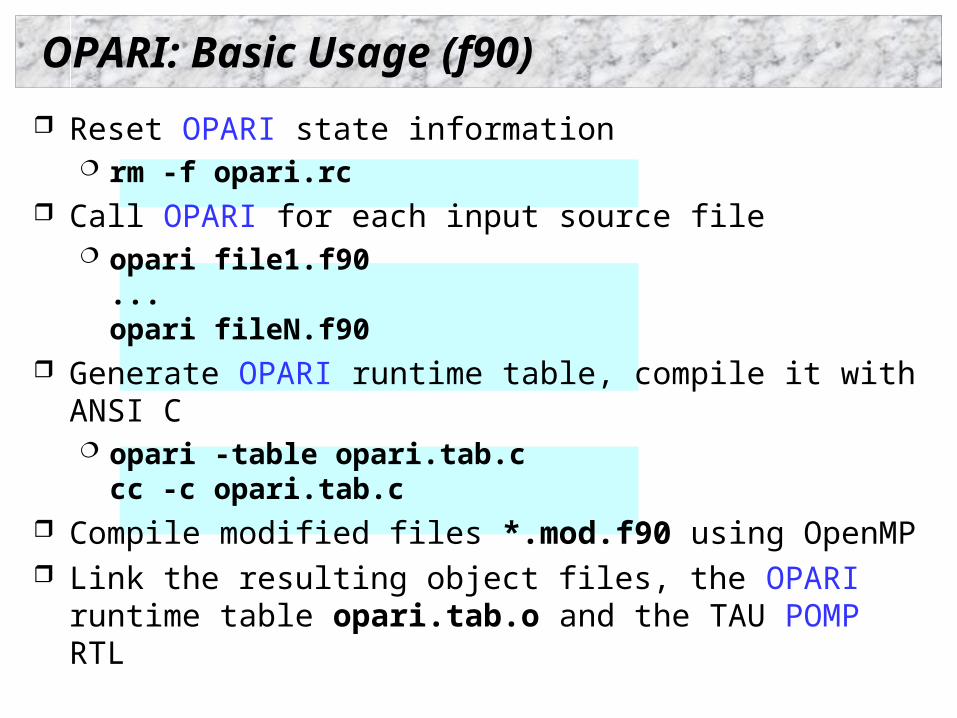
OPARI: Basic Usage (f90)
Reset OPARI state information rm -f opari.rc
Call OPARI for each input source file opari file1.f90...opari fileN.f90
Generate OPARI runtime table, compile it with ANSI C opari -table opari.tab.ccc -c opari.tab.c
Compile modified files *.mod.f90 using OpenMP Link the resulting object files, the OPARI runtime table opari.tab.o and the TAU POMP RTL

TAU Instrumentation Options
Manual instrumentation TAU Profiling API
Automatic instrumentation approaches PDT – Source-to-source translation MPI - Wrapper interposition library Opari – OpenMP directive rewriting DyninstAPI – Runtime instrumentation, rewrite binary
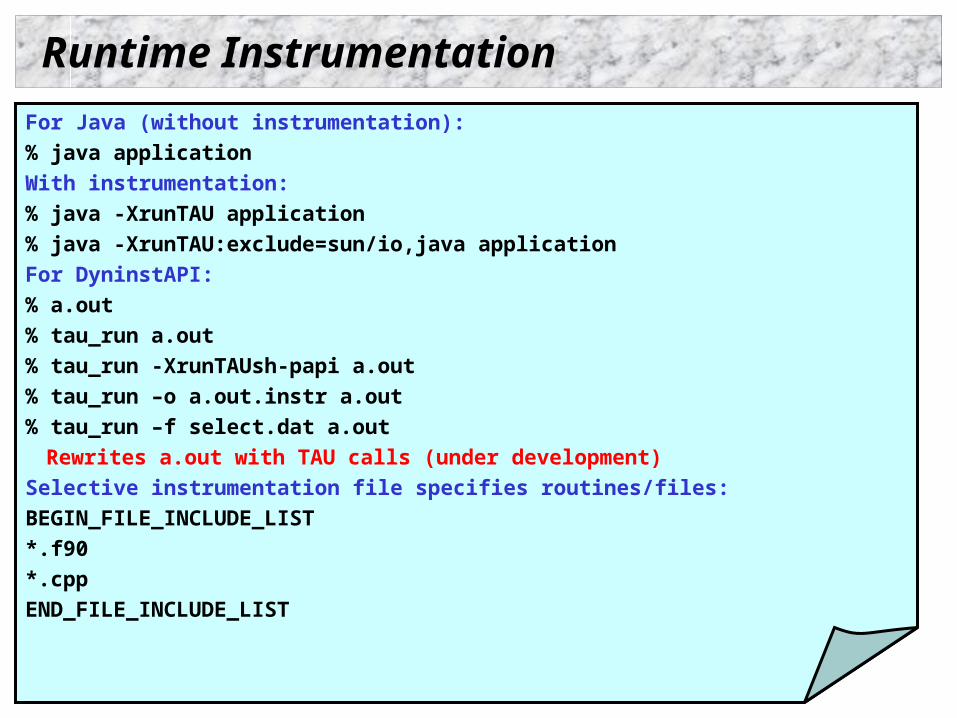
Runtime Instrumentation
For Java (without instrumentation):
% java application
With instrumentation:
% java -XrunTAU application
% java -XrunTAU:exclude=sun/io,java application
For DyninstAPI:
% a.out
% tau_run a.out
% tau_run -XrunTAUsh-papi a.out
% tau_run –o a.out.instr a.out
% tau_run –f select.dat a.out
Rewrites a.out with TAU calls (under development)
Selective instrumentation file specifies routines/files:
BEGIN_FILE_INCLUDE_LIST
*.f90
*.cpp
END_FILE_INCLUDE_LIST

TAU Analysis
Profile analysis Pprof
parallel profiler with text-based display Paraprof
Redesigned version of jracy/racy (tcl/tk) browsers Access to multiple experiments, derived metrics
Trace analysis and visualization Trace merging (tau_merge) Trace format conversion (tau_convert)
Vampir, Paraver, text, ALOG, SDDF, Vampir (Pallas) trace visualization

Pprof Command pprof [-c|-b|-m|-t|-e|-i] [-r] [-s] [-n num] [-f file] [-l] [nodes]
-c Sort according to number of calls -b Sort according to number of subroutines called -m Sort according to msecs (exclusive time total) -t Sort according to total msecs (inclusive time
total) -e Sort according to exclusive time per call -i Sort according to inclusive time per call -v Sort according to standard deviation (exclusive
usec) -r Reverse sorting order -s Print only summary profile information -n num Print only first number of functions -f file Specify full path and filename without node ids -l List all functions and exit
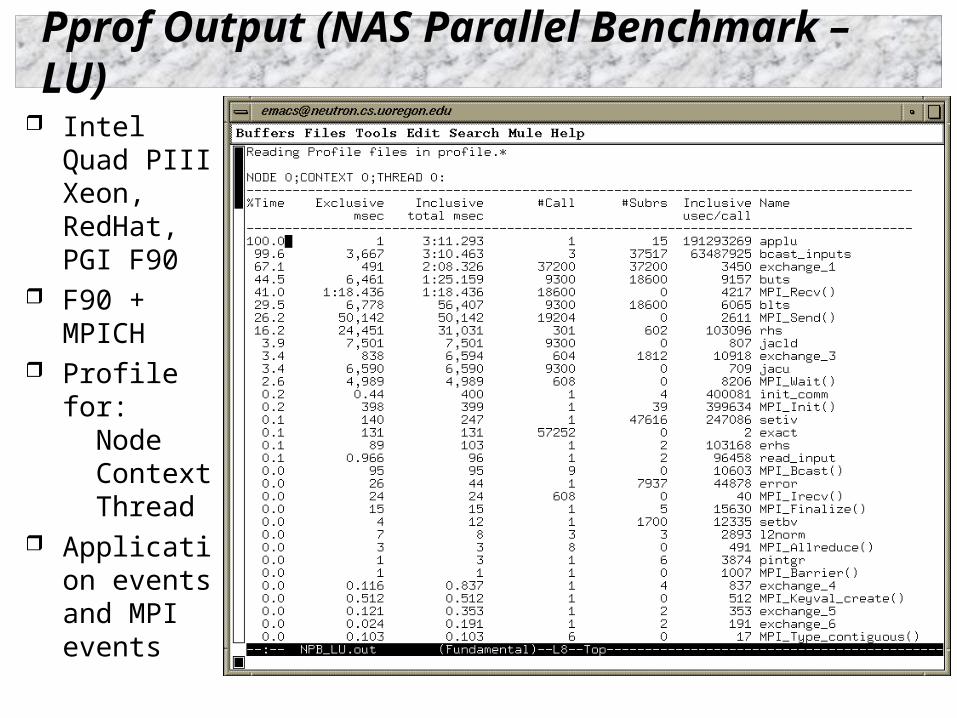
Pprof Output (NAS Parallel Benchmark – LU)
Intel Quad PIII Xeon, RedHat, PGI F90
F90 + MPICH
Profile for: Node Context Thread
Application events and MPI events

Terminology – Example
For routine “int main( )”: Exclusive time
100-20-50-20=10 secs Inclusive time
100 secs Calls
1 call Subrs (no. of child
routines called) 3
Inclusive time/call 100secs
int main( )
{ /* takes 100 secs */
f1(); /* takes 20 secs */
f2(); /* takes 50 secs */
f1(); /* takes 20 secs */
/* other work */
}
/*
Time can be replaced by counts */

Paraprof Profile Browser

Paraprof Profile Browser Main Window

Paraprof Profile Browser Node Window

Paraprof Profile Browser (Derived Metrics)

Paraprof Profile Browser Routine Window

Vampir Trace Visualization Tool
Visualization and Analysis of MPI Programs
Originally developed by Forschungszentrum Jülich
Current development by Technical University Dresden
Distributed by PALLAS, Germany
http://www.pallas.de/pages/vampir.htm
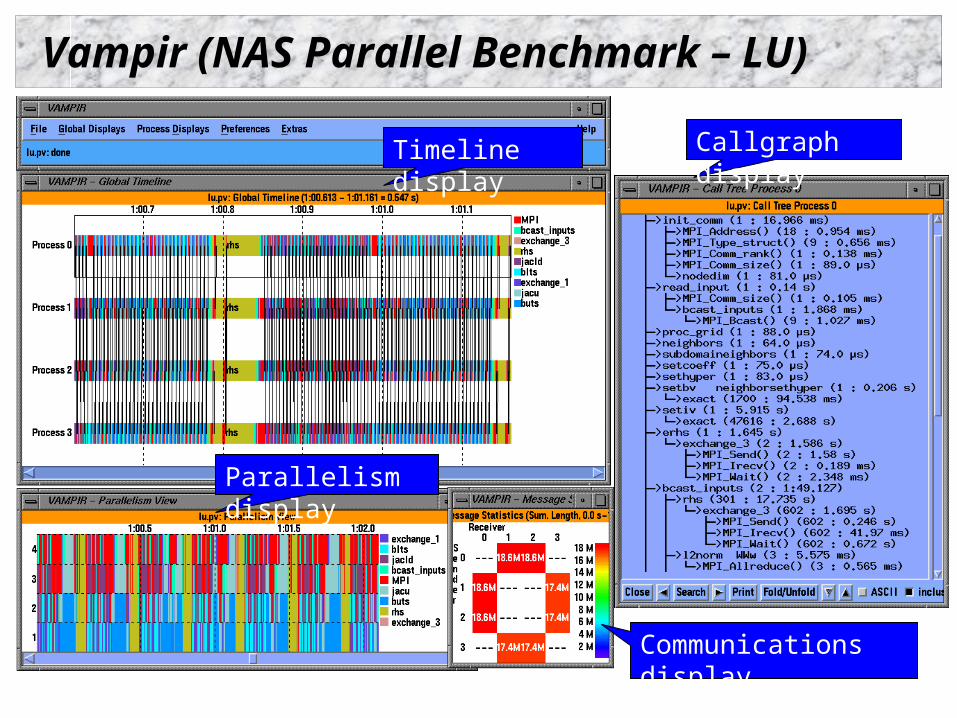
Vampir (NAS Parallel Benchmark – LU)
Timeline display Callgraph display
Communications display
Parallelism display

TAU Performance System Status Computing platforms
IBM SP, SGI Origin 2K/3K, ASCI Red, Apple, Cray T3E, HP/Compaq SC, HP Superdome, Sun, Windows, Linux (IA-32, IA-64, Alpha…), NEC, Hitachi, …
Programming languages C, C++, Fortran 77/90, HPF, Java, Python
Communication libraries MPI, PVM, Nexus, Tulip, ACLMPL, MPIJava
Thread libraries pthreads, Java,Windows, Tulip, SMARTS, OpenMP
Compilers KAI, PGI, GNU, Fujitsu, Sun, Microsoft, SGI, Cray,
IBM, Compaq, NEC, Hitachi

TAU Performance System Status (continued)
TAU full distribution (Version 2.12, web download) Measurement library and profile analysis tools Automatic software installation Performance analysis examples Extensive TAU User’s Guide

PDT Status
Program Database Toolkit (Version 2.2.2, web download) EDG C++ front end (Version 2.45.2) Mutek Fortran 90 front end (Version 2.4.1) C++ and Fortran 90 IL Analyzer DUCTAPE library Standard C++ system header files (KCC Version 4.0f)
PDT-constructed tools Automatic TAU performance instrumentation
C, C++, Fortran 77, and Fortran 90 XMLGEN – PDB to XML translation tool Program analysis support for SILOON and CHASM

Information
TAU (http://www.cs.uoregon.edu/research/paracomp/tau) PDT
(http://www.cs.uoregon.edu/research/paracomp/pdtoolkit) PAPI (http://icl.cs.utk.edu/projects/papi/) OPARI (http://www.fz-juelich.de/zam/kojak/) Vampir (http://www.pallas.de)

Concluding Remarks
Complex software and parallel computing systems pose challenging performance analysis problems that require robust methodologies and tools
To build more sophisticated performance tools, existing proven performance technology must be utilized
Performance tools must be integrated with software and systems models and technology Performance engineered software Function consistently and coherently in software and
system environments

Support Acknowledgement
TAU and PDT support: Department of Engergy (DOE)
DOE 2000 ACTS contract DOE MICS contract DOE ASCI Level 3 (LANL, LLNL)
DARPA NSF National Young Investigator (NYI) award
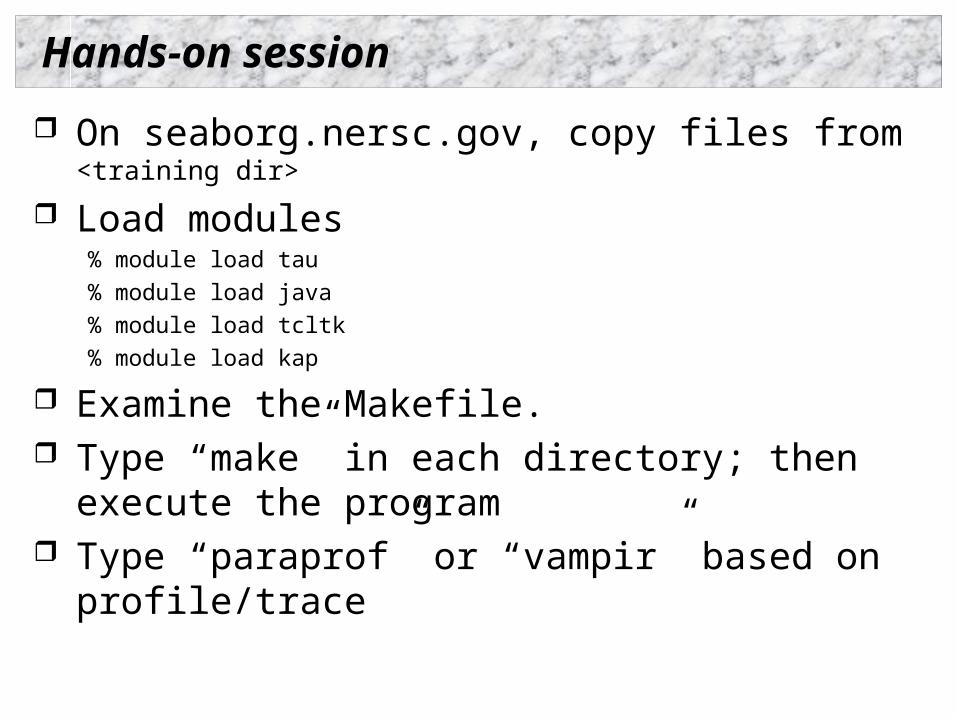
Hands-on session
On seaborg.nersc.gov, copy files from <training dir>
Load modules% module load tau
% module load java
% module load tcltk
% module load kap
Examine the Makefile. Type “make” in each directory; then execute the program Type “paraprof” or “vampir” based on profile/trace

Examples
The training directory contains example programs that illustrate the use of TAU instrumentation and measurement options.
instrument - This contains a simple C++ example that shows how TAU's API can be used for manually instrumenting a C++ program. It highlights instrumentation for templates and user defined events.
threads - A simple multi-threaded program that shows how the main function of a thread is instrumented. Performance data is generated for each thread of execution. Configure with -pthread.
cthreads - Same as threads above, but for a C program. An instrumented C program may be compiled with a C compiler, but needs to be linked with a C++ linker. Configure with -pthread.
pi - An MPI program that calculates the value of pi and e. It highlights the use of TAU's MPI wrapper library. TAU needs to be configured with -mpiinc=<dir> and -mpilib=<dir>.
Run using mpirun -np <procs> cpi <iterations>.
papi - A matrix multiply example that shows how to use TAU statement level timers for comparing the performance of two algorithms for matrix multiplication. When used with PAPI or PCL, this
can highlight the cache behaviors of these algorithms. TAU should be configured with-papi=<dir> or -pcl=<dir> and the user should set PAPI_EVENT or PCL_EVENT
respective environment variables, to use this.
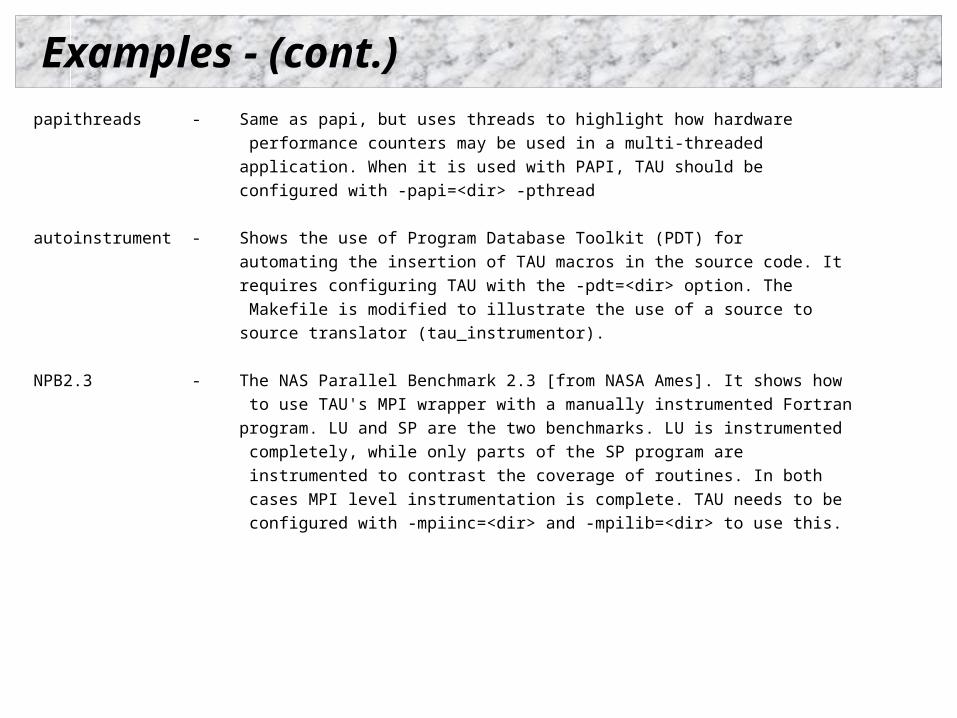
Examples - (cont.)
papithreads - Same as papi, but uses threads to highlight how hardware
performance counters may be used in a multi-threaded
application. When it is used with PAPI, TAU should be
configured with -papi=<dir> -pthread
autoinstrument - Shows the use of Program Database Toolkit (PDT) for
automating the insertion of TAU macros in the source code. It
requires configuring TAU with the -pdt=<dir> option. The
Makefile is modified to illustrate the use of a source to
source translator (tau_instrumentor).
NPB2.3 - The NAS Parallel Benchmark 2.3 [from NASA Ames]. It shows how
to use TAU's MPI wrapper with a manually instrumented Fortran
program. LU and SP are the two benchmarks. LU is instrumented
completely, while only parts of the SP program are
instrumented to contrast the coverage of routines. In both
cases MPI level instrumentation is complete. TAU needs to be
configured with -mpiinc=<dir> and -mpilib=<dir> to use this.