allen d. malony, sameer shende, robert bell [email protected] department of computer and...
Post on 22-Dec-2015
221 views
TRANSCRIPT

Allen D. Malony, Sameer Shende, Robert Bell [email protected]
Department of Computer and Information Science
Computational Science Institute, NeuroInformatics Center
University of Oregon
Online Performance Monitoring, Analysis, and Visualization of
Large-Scale Parallel Applications

ParCo 2003 2Online Performance Monitoring, Analysis, and Visualization
Outline
Problem description Scaling and performance observation Concern for measurement intrusion Interest in online performance analysis General online performance system architecture
Access models Profiling and tracing issues
Experiments with the TAU performance system Online profiling Online tracing
Conclusions and future work

ParCo 2003 3Online Performance Monitoring, Analysis, and Visualization
Problem Description
Need for parallel performance observation Instrumentation, measurement, analysis, visualization
In general, there is the concern for intrusion Seen as a tradeoff with accuracy of performance diagnosis
Scaling complicates observation and analysis Issues of data size, processing time, and presentation
Online approaches add capabilities as well as problems Performance interaction, but at what cost?
Tools for large-scale performance observation online Supporting performance system architecture Tool integration, effective usage, and portability

ParCo 2003 4Online Performance Monitoring, Analysis, and Visualization
Scaling and Performance Observation
Consider “traditional” measurement methods Profiling: summary statistics calculated during execution Tracing: time-stamped sequence of execution events
More parallelism more performance data overall Performance specific to each thread of execution Possible increase in number interactions between threads
Harder to manage the data (memory, transfer, storage, …) Instrumentation more difficult with greater parallelism? More parallelism / performance data harder analysis
More time consuming to analyze More difficult to visualize (meaningful displays)

ParCo 2003 5Online Performance Monitoring, Analysis, and Visualization
Concern for Measurement Intrusion
Performance measurement can affect the execution Perturbation of “actual” performance behavior Minor intrusion can lead to major execution effects
Problems exist even with small degree of parallelism Intrusion is accepted consequence of standard practice Consider intrusion (perturbation) of trace buffer overflow
Scale exacerbates the problem … or does it? Traditional measurement techniques tend to be localized Suggests scale may not compound local intrusion globally Measuring parallel interactions likely will be affected
Use accepted measurement techniques intelligently

ParCo 2003 6Online Performance Monitoring, Analysis, and Visualization
Why Complicate Matters with Online Methods?
Adds interactivity to performance analysis process Opportunity for dynamic performance observation
Instrumentation change Measurement change
Allows for control of performance data volume Post-mortem analysis may be “too late”
View on status of long running jobs Allow for early termination Computation steering to achieve “better” results Performance steering to achieve “better” performance
Hmm, isn’t online performance observation intrusive?

ParCo 2003 7Online Performance Monitoring, Analysis, and Visualization
Related Ideas
Computational steering Falcon (Schwan, Vetter): computational steering
Dynamic instrumentation and performance search Paradyn (Miller): online performance bottleneck analysis
Adaptive control and performance steering Autopilot (Reed): performance steering
Peridot (Gerndt): automatic online performance analysis OMIS/OCM (Ludwig): monitoring system infrastructure Cedar (Malony): system/hardware monitoring Virtue (Reed): immersive performance visualization …

ParCo 2003 8Online Performance Monitoring, Analysis, and Visualization
General Online Performance Observation System
Instrumentation and measurement components Analysis and visualization components
Performance controland access
Monitoring = measurement + access
PerformanceData
Perf
orm
ance
Mea
sure
men
t
PerformanceControl Performance
Analysis
PerformanceVisualization
Perf
orm
ance
Inst
rum
ent

ParCo 2003 9Online Performance Monitoring, Analysis, and Visualization
Models of Performance Data Access (Monitoring)
Push Model Producer/consumer style of access and transfer Application decides when/what/how much data to send External analysis tools only consume performance data Availability of new data is signaled passively or actively
Pull Model Client/server style of performance data access and transfer Application is a performance data server Access decisions are made externally by analysis tools Two-way communication is required
Push/Pull Models

ParCo 2003 10Online Performance Monitoring, Analysis, and Visualization
Online Profiling Issues
Profiles are summary statistics of performance Kept with respect to some unit of parallel execution
Profiles are distributed across the machine (in memory) Must be gathered and delivered to profile analysis tool Profile merging must take place (possibly in parallel)
Consistency checking of profile data Callstack must be updated to generate correct profile data Correct communication statistics may require completion Event identification (not necessary is save event names)
Sequence of profile samples allow interval analysis Interval frequency depends on profile collection delay

ParCo 2003 11Online Performance Monitoring, Analysis, and Visualization
Online Tracing Issues
Tracing gathers time sequence of events Possibly includes performance data in event record
Trace buffers distributed across the machine Must be gathered and delivered to trace analysis tool Trace merging is necessary (possibly in parallel) Trace buffers overflow to files (happens even offline)
Consistency checking of trace data May need to generate “ghost events” before and after What portion of trace access (since last access)
Trace analysis may be in parallel Trace buffer storage volume can be controlled

ParCo 2003 12Online Performance Monitoring, Analysis, and Visualization
Performance Control
Instrumentation control Dynamic instrumentation Inserts / removes instrumentation at runtime
Measurement control Dynamic measurement Enabling / disabling / changing of measurement code Dynamic instrumentation or measurement variables
Data access control Selection of what performance data to access Control of frequency of access

ParCo 2003 13Online Performance Monitoring, Analysis, and Visualization
TAU Performance System Framework
Tuning and Analysis Utilities (aka Tools Are Us) Performance system framework for scalable parallel and
distributed high-performance computing Targets a general complex system computation model
nodes / contexts / threads Multi-level: system / software / parallelism Measurement and analysis abstraction
Integrated toolkit for performance instrumentation, measurement, analysis, and visualization Portable performance profiling/tracing facility Open software approach

ParCo 2003 14Online Performance Monitoring, Analysis, and Visualization
TAU Performance System Architecture
EPILOG
Paraver
ParaProf

ParCo 2003 15Online Performance Monitoring, Analysis, and Visualization
Online Profile Measurement and Analysis in TAU Standard TAU profiling
Per node/context/thread Profile “dump” routine
Context-level Profile file per each
thread in context Appends to profile file Selective event dumping
Analysis tools access filesthrough shared file system
Application-level profile“access” routine

ParCo 2003 16Online Performance Monitoring, Analysis, and Visualization
ParaProf Framework Architecture
Portable, extensible, and scalable tool for profile analysis Offer “best of breed” capabilities to performance analysts Build as profile analysis framework for extensibility
ParCo 2003 17Online Performance Monitoring, Analysis, and Visualization
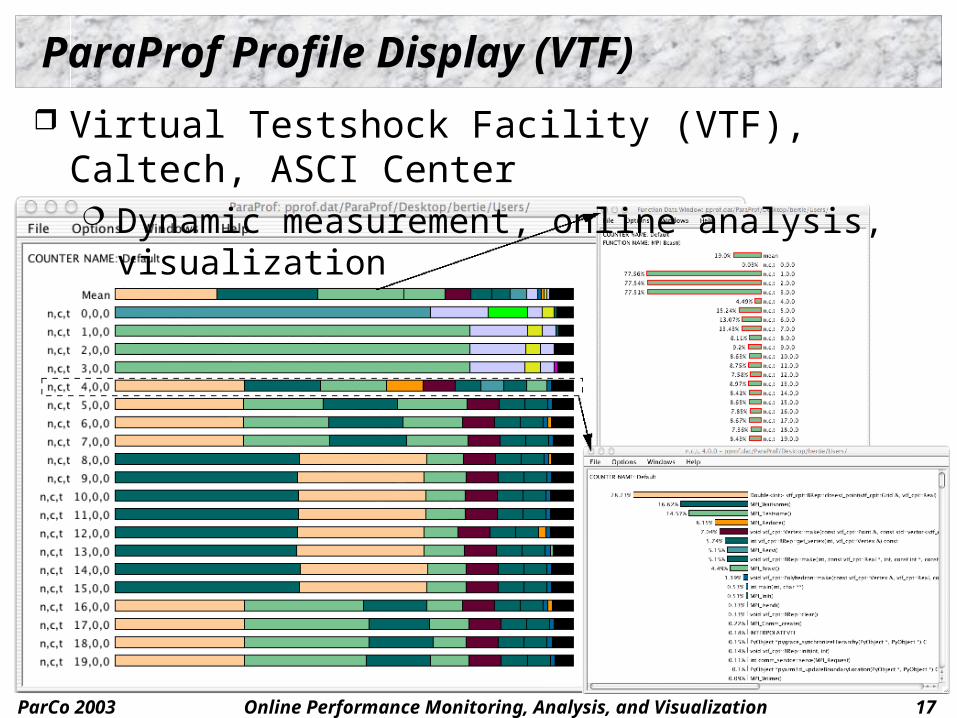
ParaProf Profile Display (VTF)
Virtual Testshock Facility (VTF), Caltech, ASCI Center Dynamic measurement, online analysis, visualization

ParCo 2003 18Online Performance Monitoring, Analysis, and Visualization
Full Profile Display (SAMRAI++)
512
proc
esse
s
Structured AMR toolkit (SAMRAI++), LLNL

ParCo 2003 19Online Performance Monitoring, Analysis, and Visualization
Online Performance Profile Analysis (K. Li, UO)
ApplicationPerformance
Steering PerformanceVisualizer
PerformanceAnalyzer
PerformanceData Reader
TAUPerformance
System
PerformanceData Integrator
SCIRun (Univ. of Utah)
// performancedata streams
// performancedata output
file system
• sample sequencing• reader synchronization
accumulatedsamples

ParCo 2003 20Online Performance Monitoring, Analysis, and Visualization
Performance Visualization in SCIRun
SCIRun program

ParCo 2003 Mini-Symposium 21Online Performance Monitoring, Analysis, and Visualization
Uintah Computational Framework (UCF)
Universityof Utah
UCF analysis Scheduling MPI library Components
500 processes Use for online
and offlinevisualization
Apply SCIRunsteering
ParCo 2003 Mini-Symposium 22Online Performance Monitoring, Analysis, and Visualization
Online Unitah Performance Profiling
Demonstration of online profiling capability Colliding elastic disks
Test material point method (MPM) code Executed on 512 processors ASCI Blue Pacific at LLNL
Example 1 (Terrain visualization) Exclusive execution time across event groups Multiple time steps
Example 2 (Bargraph visualization) MPI execution time and performance mapping
Example 3 (Domain visualization) Task time allocation to “patches”
ParCo 2003 Mini-Symposium 23Online Performance Monitoring, Analysis, and Visualization
Example 1
QuickTime™ and aGIF decompressorare needed to see this picture.

ParCo 2003 Mini-Symposium 24Online Performance Monitoring, Analysis, and Visualization
Example 2
QuickTime™ and aGIF decompressorare needed to see this picture.

ParCo 2003 Mini-Symposium 25Online Performance Monitoring, Analysis, and Visualization
Example 2 (continued)
QuickTime™ and aGIF decompressorare needed to see this picture.

ParCo 2003 Mini-Symposium 26Online Performance Monitoring, Analysis, and Visualization
Example 3
QuickTime™ and aGIF decompressorare needed to see this picture.

ParCo 2003 Mini-Symposium 27Online Performance Monitoring, Analysis, and Visualization
Online Trace Analysis and Visualization
Tracing is more challenging to do online Trace buffer overflow can already be viewed as “online”
Write to file system (local/remote) on overflow Causes large intrusion of execution (not synchronized)
There is potentially a lot more data to move around TAU does dynamic event registration
Requires trace merging to make event ids consistent Track events that actually occur Static schemes must predefine all possible events
Decision on whether to keep trace data Traces can be analyzed to produce statistics

ParCo 2003 Mini-Symposium 28Online Performance Monitoring, Analysis, and Visualization
VNG Parallel Distributed Trace Analysis
Holger Brunst, Technical University Dresden In association with Wolfgang Nagel (ASCI PathForward) Brunst currently visiting University of Oregon
Based on experience in development and use of Vampir Client - server model with parallel analysis servers Allow parallel analysis servers and remote visualization
Keep trace data close to where it was produced Utilize parallel computing and storage resources Hope to gain speedup efficiencies Split analysis and visualization functionality
Accepts VTF, STF, and TAU trace formats

ParCo 2003 29Online Performance Monitoring, Analysis, and Visualization
VNG System Architecture
Client - server model with parallel analysis servers Allow parallel analysis servers and remote analysis
vgnd vgn
pthreads
MPI sockets

ParCo 2003 30Online Performance Monitoring, Analysis, and Visualization
Online Trace Analysis with TAU and VNG
TAUmeasurementsystem
vgnd
vgn
TAU measurement of application to generate traces Write traces (currently) to NFS files and unify
Trace accesscontrol (not yet)
Neededfor eventconsistency
taumerge

ParCo 2003 31Online Performance Monitoring, Analysis, and Visualization
Experimental Online Tracing Setup
32-processor Linux cluster

ParCo 2003 32Online Performance Monitoring, Analysis, and Visualization
Online Trace Analysis of PERC EVH1 Code
Enhanced Virginia Hydrodynamics #1 (EVH1)
Strange behaviorseen on Linuxplatforms

ParCo 2003 33Online Performance Monitoring, Analysis, and Visualization
Evaluation of Experimental Approaches
Currently only supporting push model File system solution for moving performance data
Is this a scalable solution? Robust solution that can leverage high-performance I/O May result in high intrusion However, does not require IPC
Resolving identifiers in trace events is a real problem Should be relatively portable

ParCo 2003 34Online Performance Monitoring, Analysis, and Visualization
Possible Improvements
Profile merging at context level to reduce number of files Merging at node level may require explicit processing
Concurrent trace merging could also reduce files Hierarchical merge tree Will require explicit processing
Could consider IPC transfer MPI (e.g., used in mpiP for profile merging)
Create own communicators Sockets PACX between computer server and performance
analyzer …
ParCo 2003 35Online Performance Monitoring, Analysis, and Visualization
Large-Scale System Support
Larger parallel systems will have better infrastructure Higher performance I/O system and multiple I/O ndoes Faster, higher bandwith networks (possible several) Processors devoted to system operations
Hitachi SR8000 System processor per node (8 computational processors) Remote DMA (RDMA) RDMA may becoming available on Infiniband
Blue Gene/L 1024 I/O nodes (one per 64 processor) with large memory Tree network for I/O operations and GigE as well

ParCo 2003 36Online Performance Monitoring, Analysis, and Visualization
Concluding Remarks
Interest in online performance monitoring, analysis, and visualization for large-scale parallel systems
Need to intelligently use Benefit from other scalability considerations of the
system software and system architecture See as an extension to the parallel system architecture Avoid solutions that have portability difficulties In part, this is an engineering problem
Need to work with the system configuration you have Need to understand if approach is applicable to problem
Not clear if there is a single solution

ParCo 2003 37Online Performance Monitoring, Analysis, and Visualization
Future Work
Build online support in TAU performance system Extend to support PULL model capabilities
Hierarchical data access solutions Performance studies Integrate with SuperMon (Matt Sottile, LANL)
Scalable system performance monitor Integration with other performance tools …

ParCo 2003 38Online Performance Monitoring, Analysis, and Visualization