sameer shende and alan morris {sameer, amorris}@cs.uoregon.edu department of computer and...
Post on 19-Dec-2015
222 views
TRANSCRIPT
Sameer Shende and Alan Morris{sameer, amorris}@cs.uoregon.edu
Department of Computer and Information Science
NeuroInformatics Center
University of Oregon
Advances in the TAU Performance System
2
Acknowledgement
Jaideep Ray, SNL Nick Trebon, U. Oregon Allen D. Malony, U. Oregon Manish Parashar, Rutgers Maria Liu, Rutgers
3
Outline
Overview of new features Instrumentation Measurement Analysis tools CCA proxy generators
4
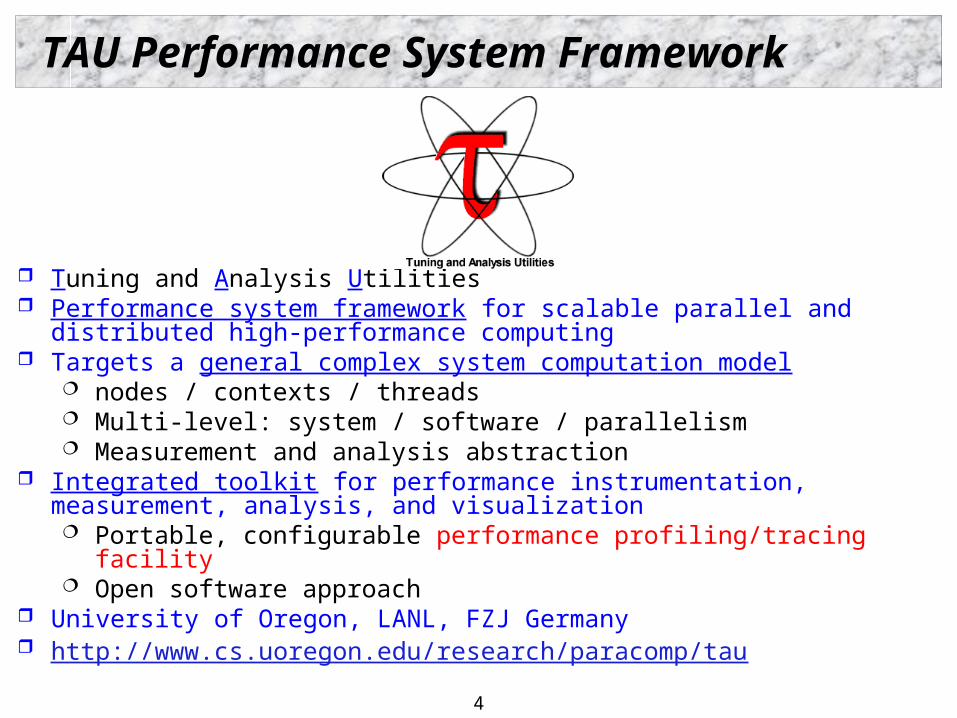
TAU Performance System Framework
Tuning and Analysis Utilities Performance system framework for scalable parallel and distributed high-
performance computing Targets a general complex system computation model
nodes / contexts / threads Multi-level: system / software / parallelism Measurement and analysis abstraction
Integrated toolkit for performance instrumentation, measurement, analysis, and visualization Portable, configurable performance profiling/tracing facility Open software approach
University of Oregon, LANL, FZJ Germany http://www.cs.uoregon.edu/research/paracomp/tau
5
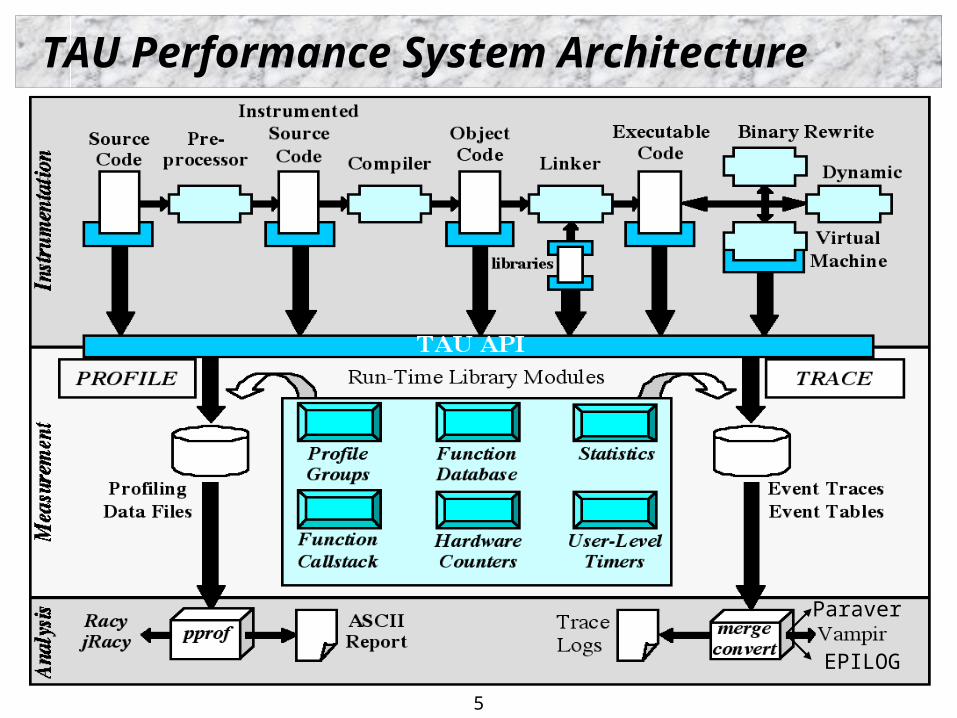
TAU Performance System Architecture
EPILOG
Paraver
6
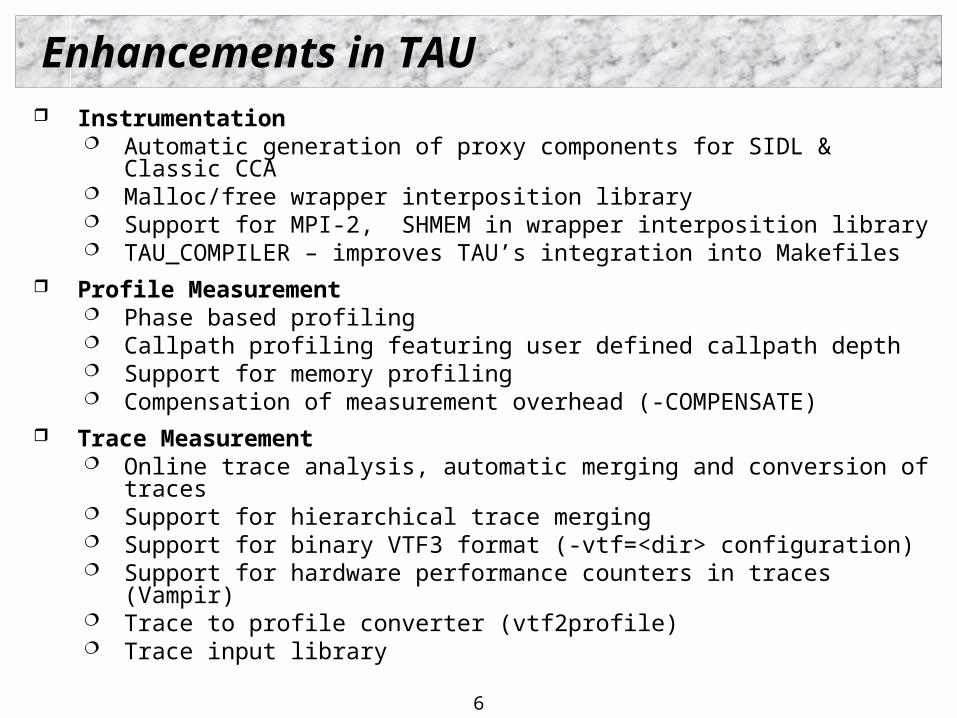
Enhancements in TAU Instrumentation
Automatic generation of proxy components for SIDL & Classic CCA Malloc/free wrapper interposition library Support for MPI-2, SHMEM in wrapper interposition library TAU_COMPILER – improves TAU’s integration into Makefiles
Profile Measurement Phase based profiling Callpath profiling featuring user defined callpath depth Support for memory profiling Compensation of measurement overhead (-COMPENSATE)
Trace Measurement Online trace analysis, automatic merging and conversion of traces Support for hierarchical trace merging Support for binary VTF3 format (-vtf=<dir> configuration) Support for hardware performance counters in traces (Vampir) Trace to profile converter (vtf2profile) Trace input library
7
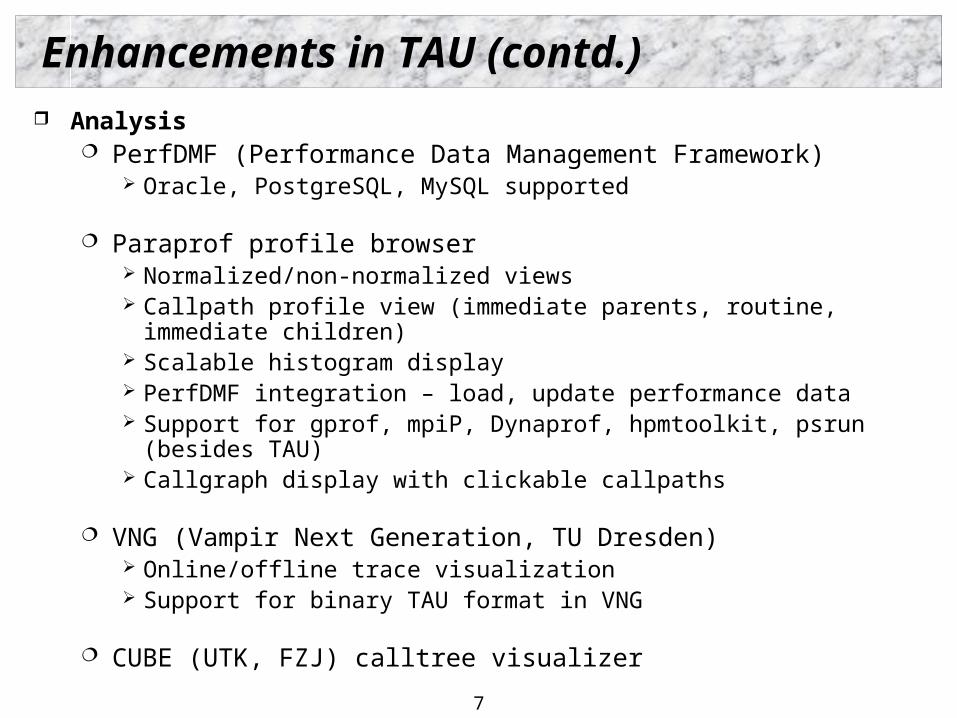
Enhancements in TAU (contd.)
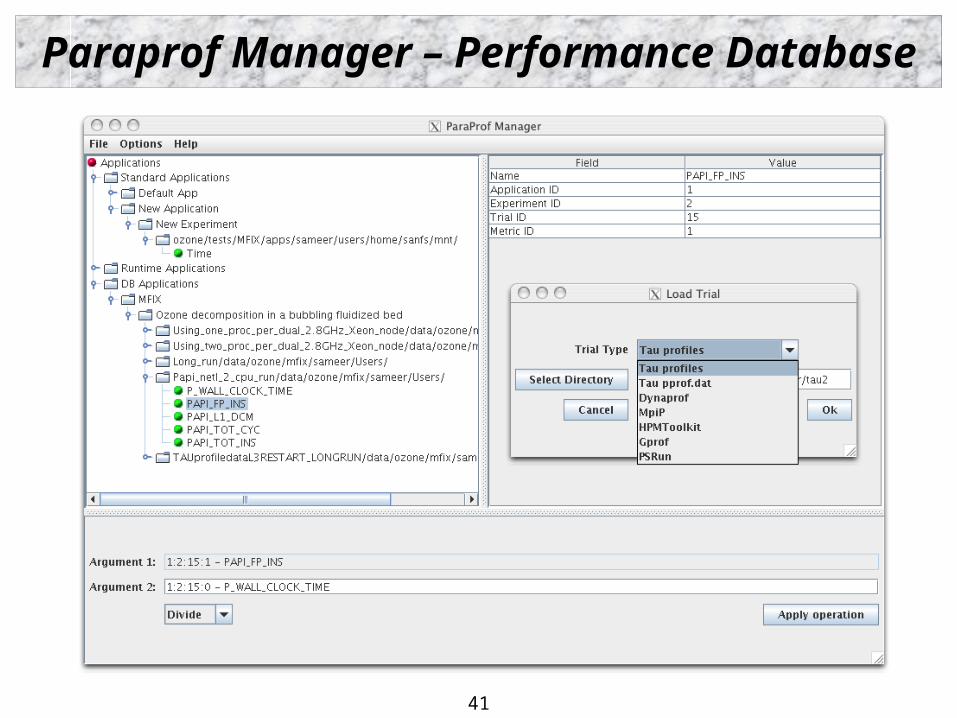
Analysis PerfDMF (Performance Data Management Framework)
Oracle, PostgreSQL, MySQL supported
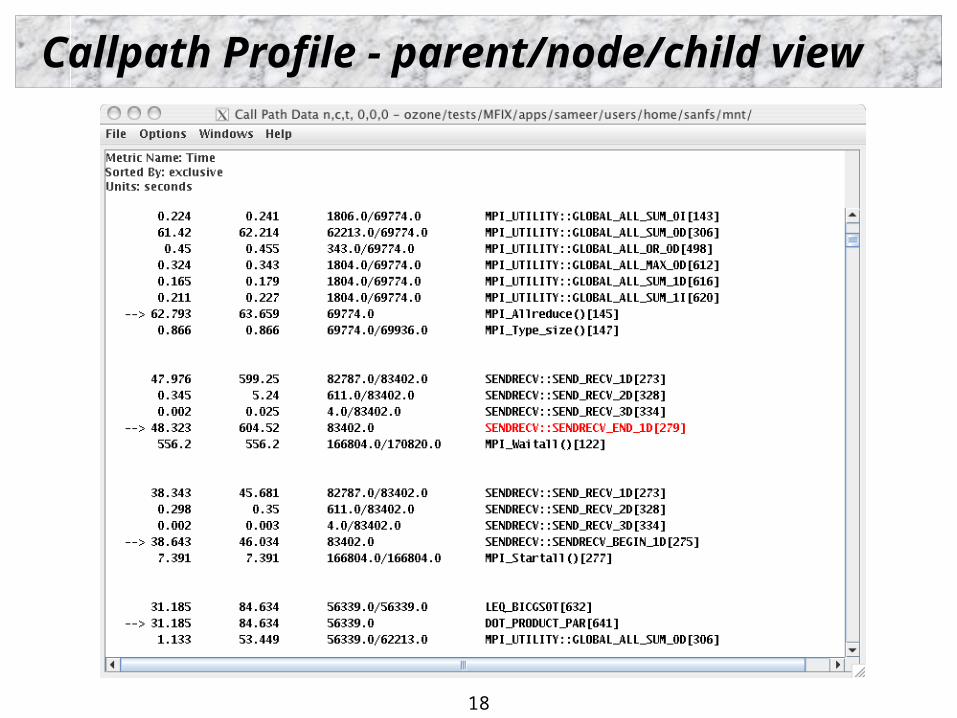
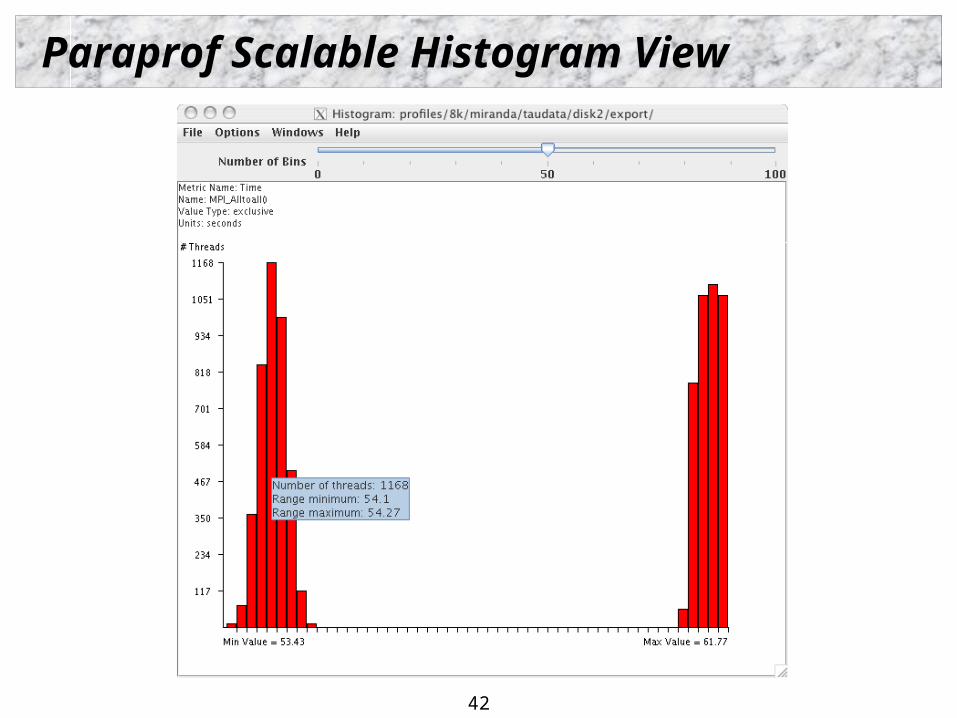
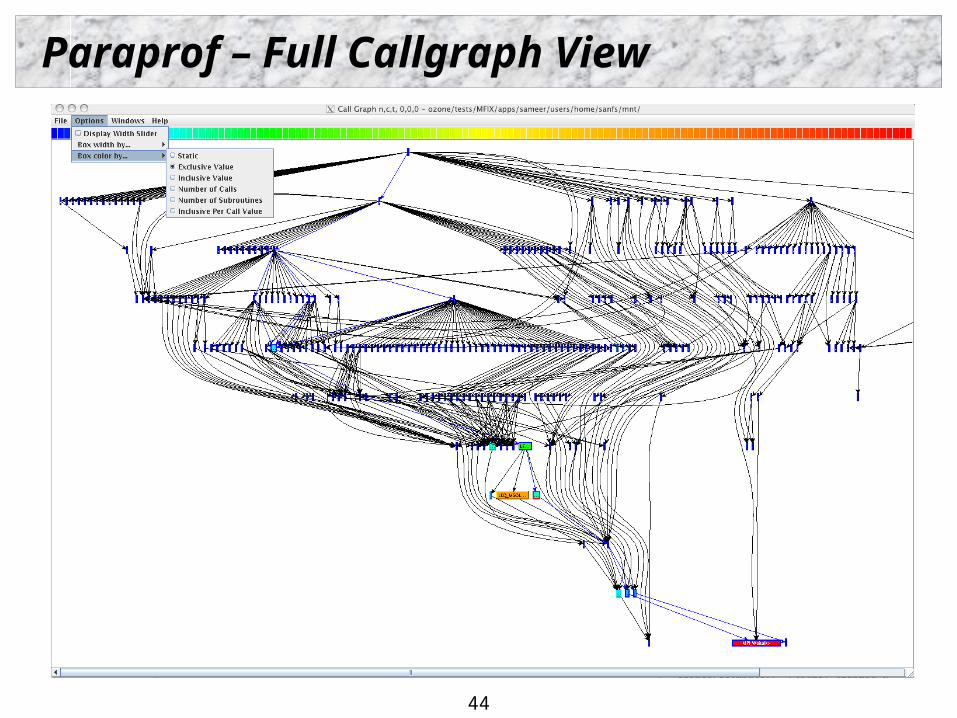
Paraprof profile browser Normalized/non-normalized views Callpath profile view (immediate parents, routine, immediate children) Scalable histogram display PerfDMF integration – load, update performance data Support for gprof, mpiP, Dynaprof, hpmtoolkit, psrun (besides TAU) Callgraph display with clickable callpaths
VNG (Vampir Next Generation, TU Dresden) Online/offline trace visualization Support for binary TAU format in VNG
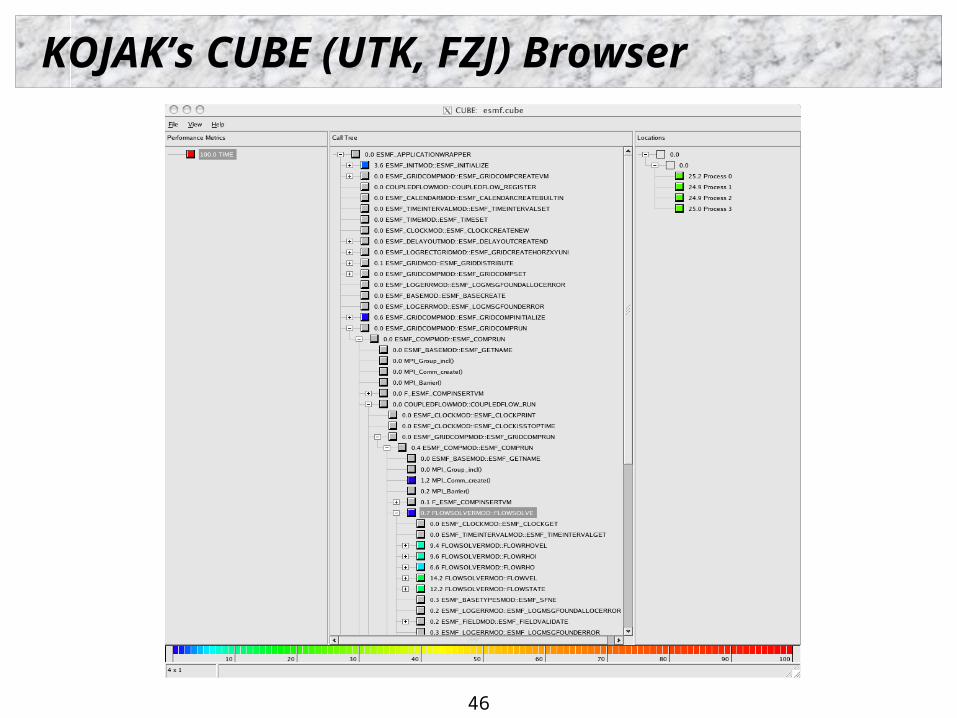
CUBE (UTK, FZJ) calltree visualizer
8
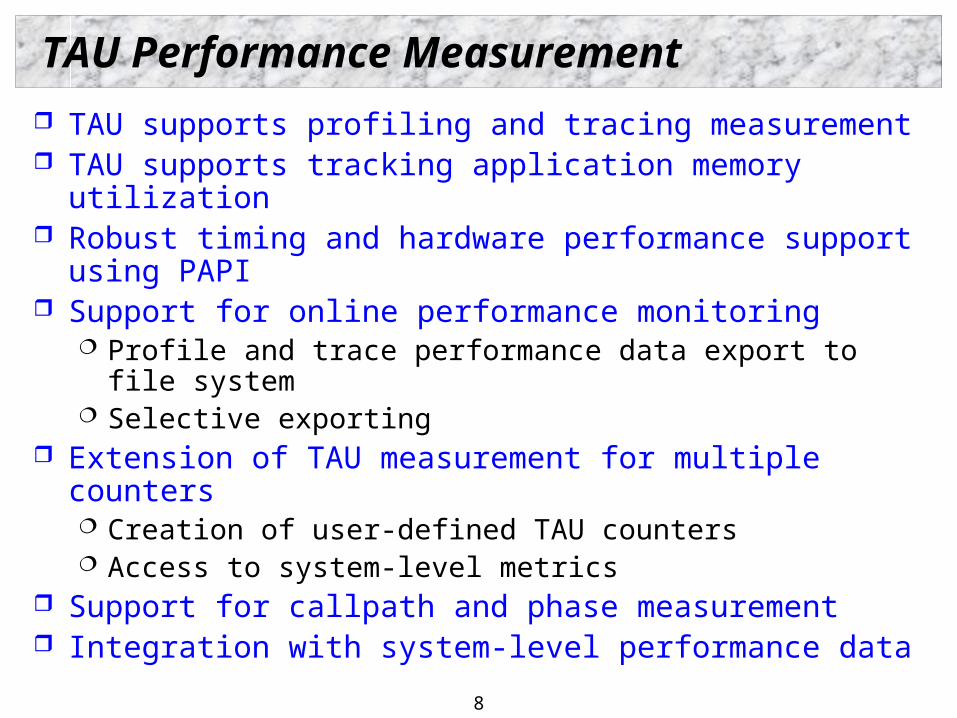
TAU Performance Measurement
TAU supports profiling and tracing measurement TAU supports tracking application memory utilization Robust timing and hardware performance support using
PAPI Support for online performance monitoring
Profile and trace performance data export to file system Selective exporting
Extension of TAU measurement for multiple counters Creation of user-defined TAU counters Access to system-level metrics
Support for callpath and phase measurement Integration with system-level performance data
9
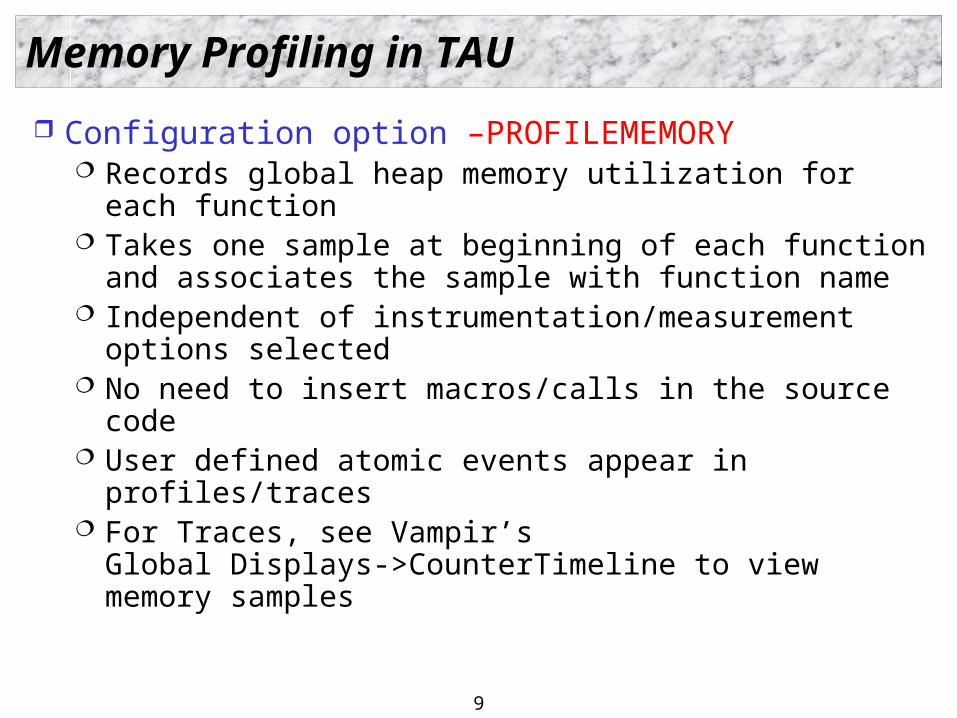
Memory Profiling in TAU
Configuration option –PROFILEMEMORY Records global heap memory utilization for each function Takes one sample at beginning of each function and
associates the sample with function name Independent of instrumentation/measurement options
selected No need to insert macros/calls in the source code User defined atomic events appear in profiles/traces For Traces, see Vampir’s
Global Displays->CounterTimeline to view memory samples
10
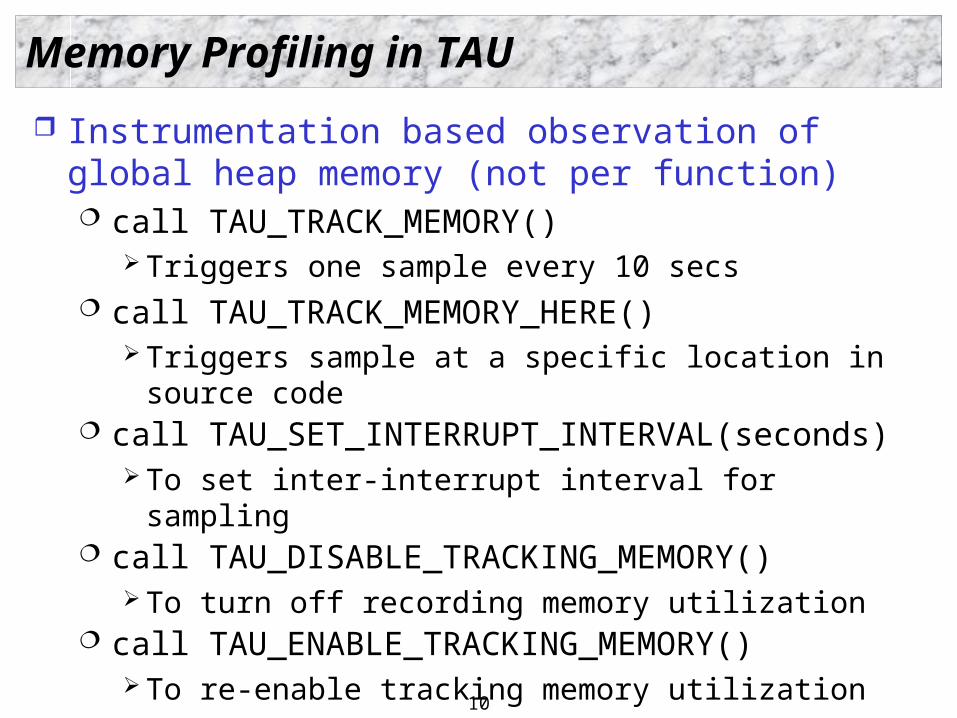
Memory Profiling in TAU
Instrumentation based observation of global heap memory (not per function) call TAU_TRACK_MEMORY()
Triggers one sample every 10 secs call TAU_TRACK_MEMORY_HERE()
Triggers sample at a specific location in source code call TAU_SET_INTERRUPT_INTERVAL(seconds)
To set inter-interrupt interval for sampling call TAU_DISABLE_TRACKING_MEMORY()
To turn off recording memory utilization call TAU_ENABLE_TRACKING_MEMORY()
To re-enable tracking memory utilization
11
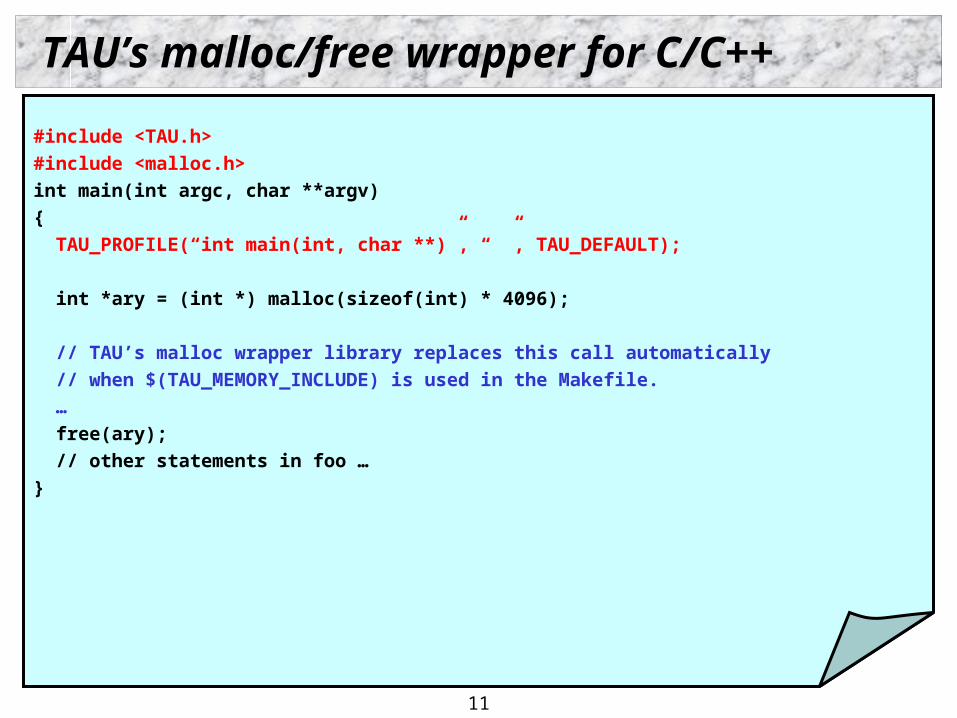
TAU’s malloc/free wrapper for C/C++
#include <TAU.h>
#include <malloc.h>
int main(int argc, char **argv)
{
TAU_PROFILE(“int main(int, char **)”, “ ”, TAU_DEFAULT);
int *ary = (int *) malloc(sizeof(int) * 4096);
// TAU’s malloc wrapper library replaces this call automatically
// when $(TAU_MEMORY_INCLUDE) is used in the Makefile.
…
free(ary);
// other statements in foo …
}
12
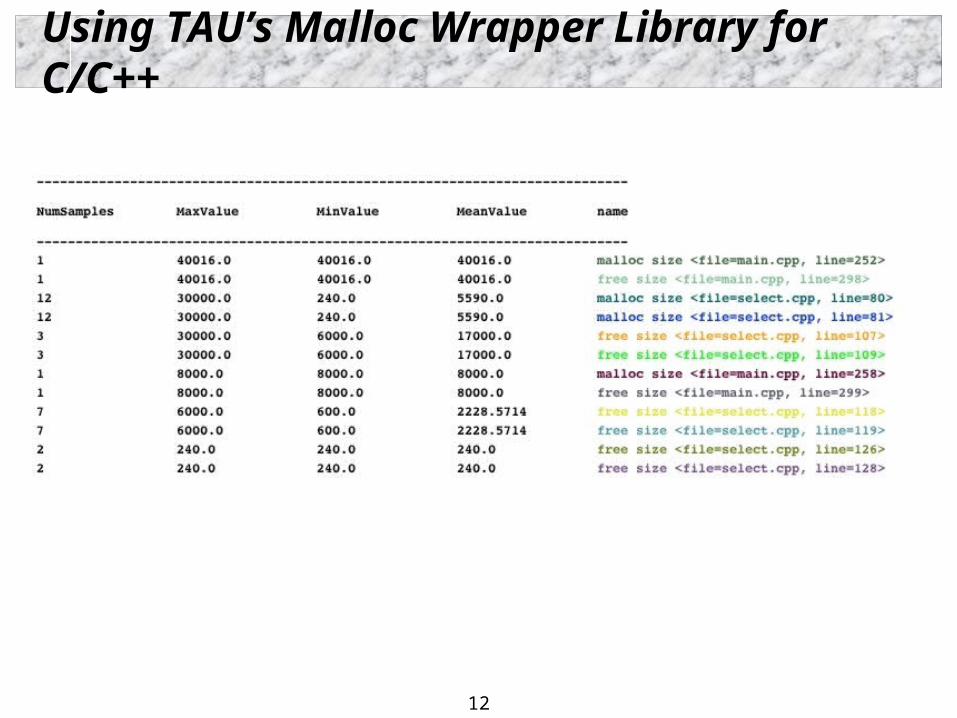
Using TAU’s Malloc Wrapper Library for C/C++
13
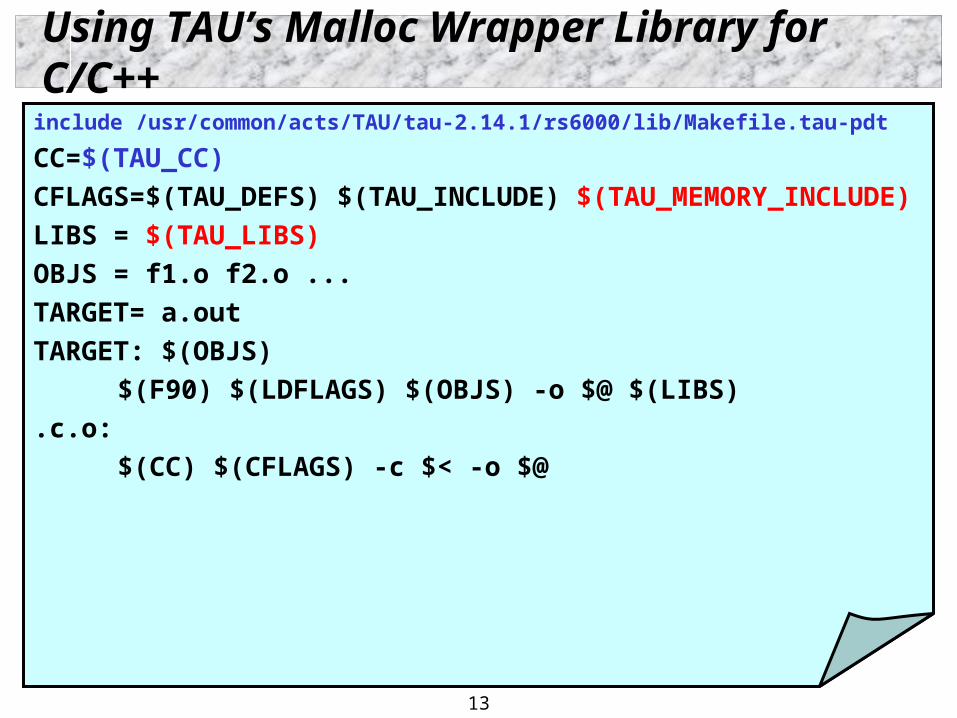
Using TAU’s Malloc Wrapper Library for C/C++
include /usr/common/acts/TAU/tau-2.14.1/rs6000/lib/Makefile.tau-pdt
CC=$(TAU_CC)
CFLAGS=$(TAU_DEFS) $(TAU_INCLUDE) $(TAU_MEMORY_INCLUDE)
LIBS = $(TAU_LIBS)
OBJS = f1.o f2.o ...
TARGET= a.out
TARGET: $(OBJS)
$(F90) $(LDFLAGS) $(OBJS) -o $@ $(LIBS)
.c.o:
$(CC) $(CFLAGS) -c $< -o $@
14
Profile Measurement – Three Flavors
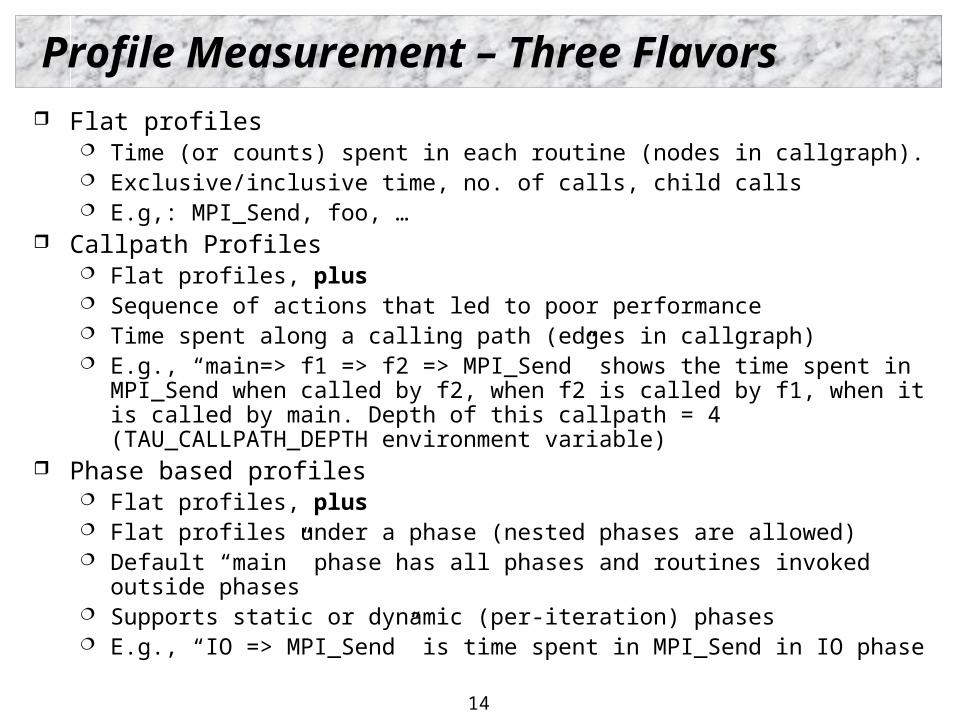
Flat profiles Time (or counts) spent in each routine (nodes in callgraph). Exclusive/inclusive time, no. of calls, child calls E.g,: MPI_Send, foo, …
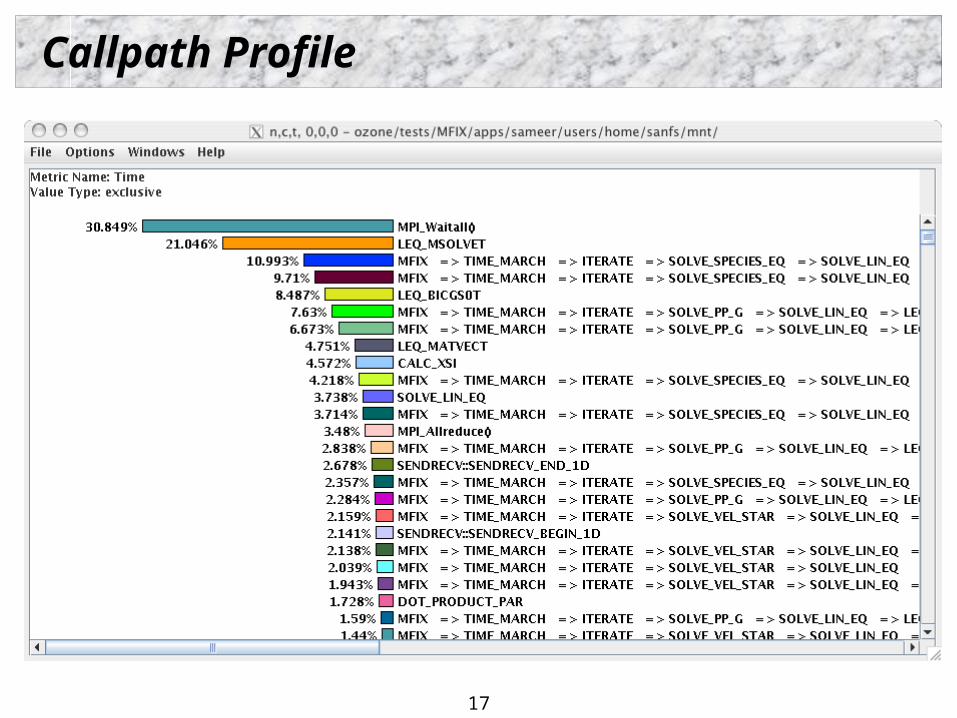
Callpath Profiles Flat profiles, plus Sequence of actions that led to poor performance Time spent along a calling path (edges in callgraph) E.g., “main=> f1 => f2 => MPI_Send” shows the time spent in MPI_Send
when called by f2, when f2 is called by f1, when it is called by main. Depth of this callpath = 4 (TAU_CALLPATH_DEPTH environment variable)
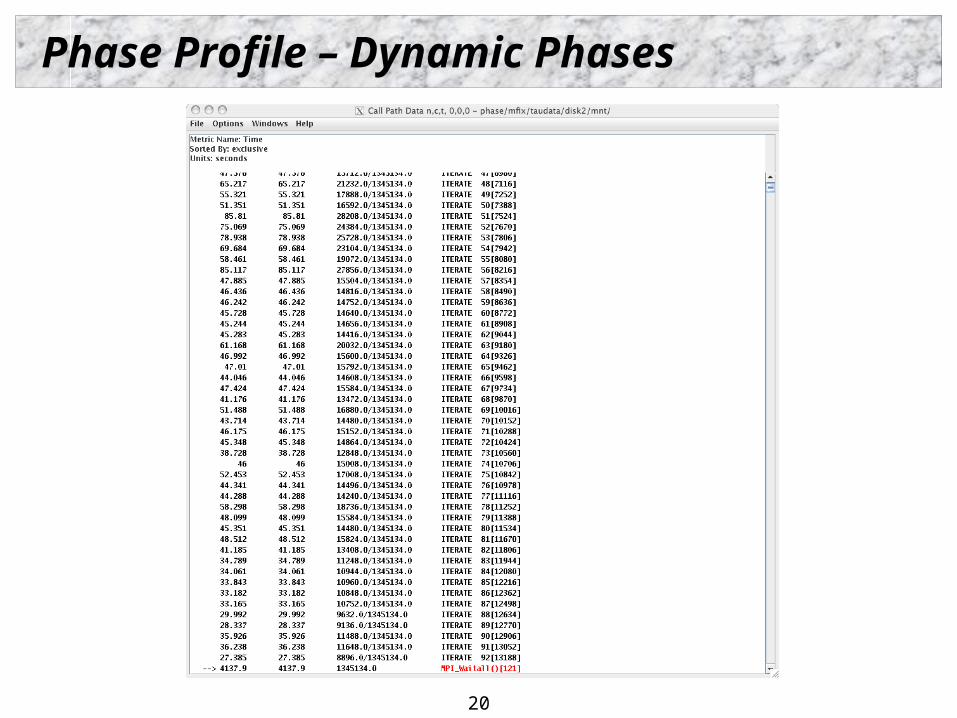
Phase based profiles Flat profiles, plus Flat profiles under a phase (nested phases are allowed) Default “main” phase has all phases and routines invoked outside phases Supports static or dynamic (per-iteration) phases E.g., “IO => MPI_Send” is time spent in MPI_Send in IO phase
15
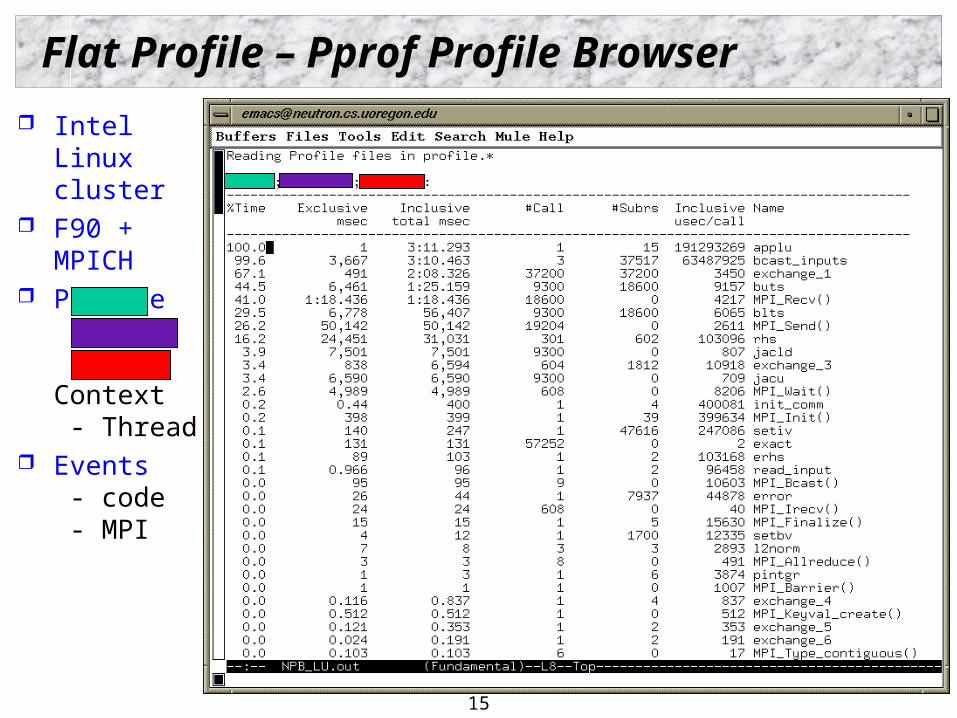
Flat Profile – Pprof Profile Browser
Intel Linux cluster
F90 + MPICH
Profile - Node - Context - Thread
Events - code - MPI
16
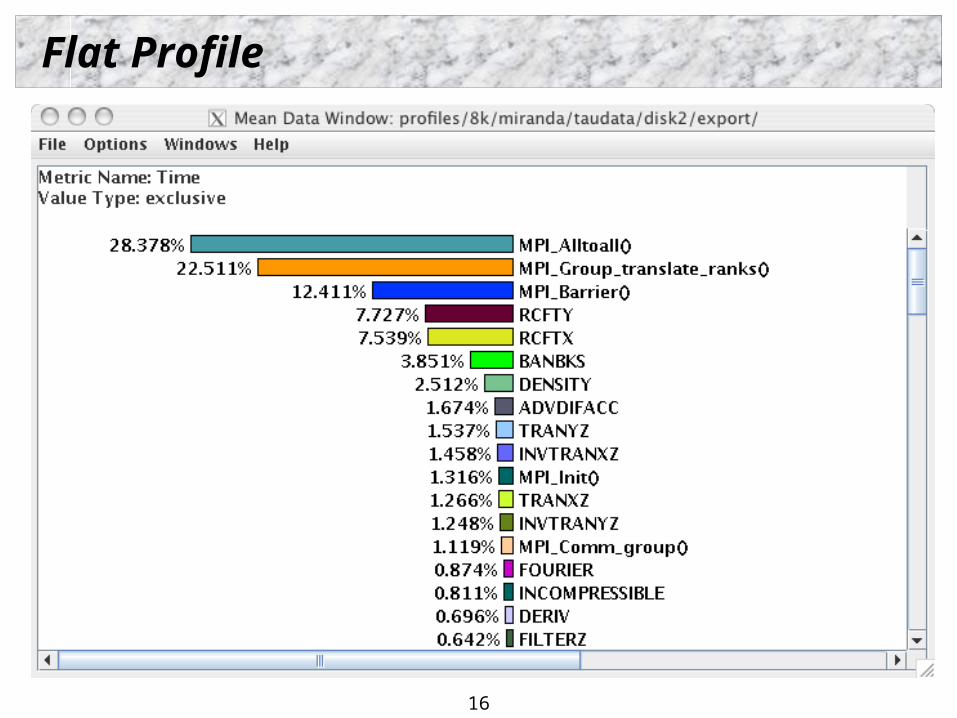
Flat Profile
17
Callpath Profile
18
Callpath Profile - parent/node/child view
19
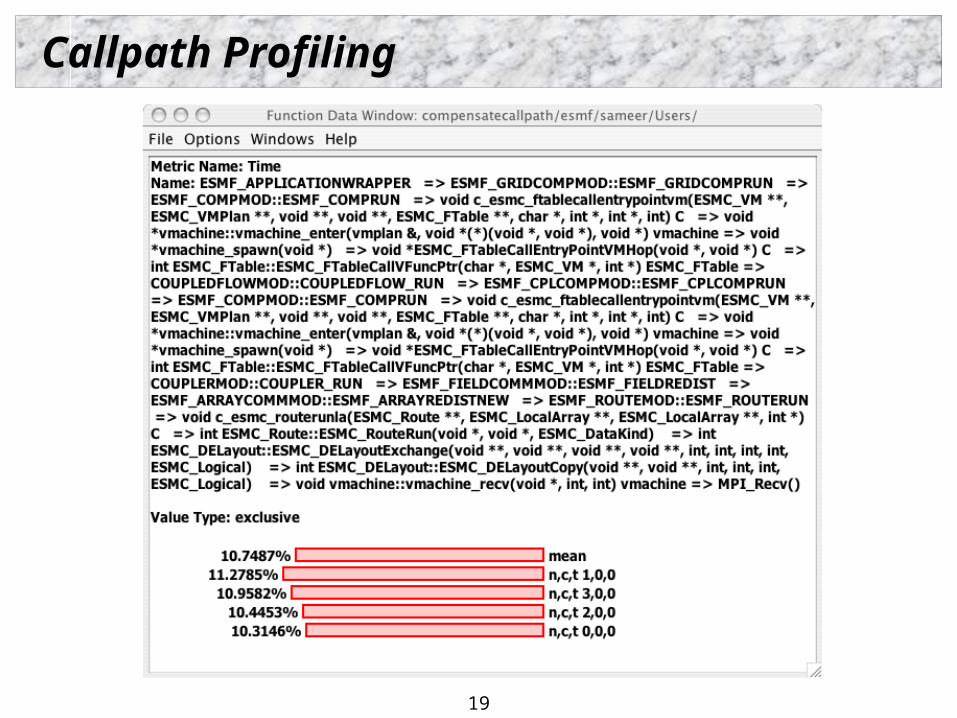
Callpath Profiling
20
Phase Profile – Dynamic Phases
21
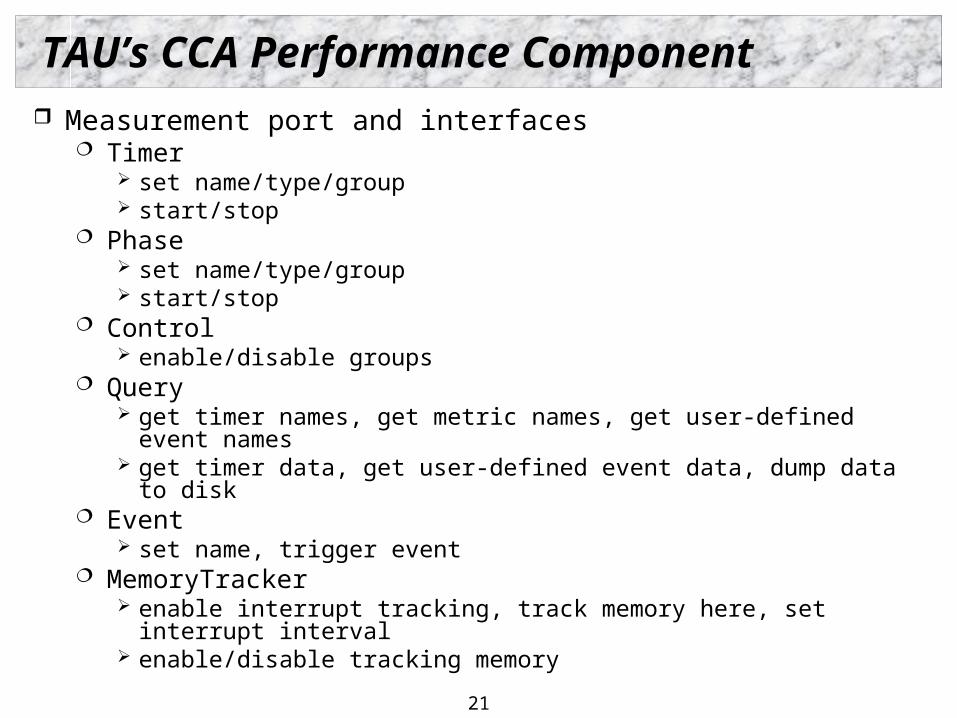
TAU’s CCA Performance Component Measurement port and interfaces
Timer set name/type/group start/stop
Phase set name/type/group start/stop
Control enable/disable groups
Query get timer names, get metric names, get user-defined event names get timer data, get user-defined event data, dump data to disk
Event set name, trigger event
MemoryTracker enable interrupt tracking, track memory here, set interrupt interval enable/disable tracking memory
22
Performance evaluation using Performance component Uses underlying TAU library for measurement Timer, Phase, Event, Control, Query, MemoryTracker
interfaces Lightweight instrumentation option
Performance modeling using Mastermind component Tracks per-invocation performance data Associates performance data with application data Method arguments logged with performance data Callpath information Helps us build performance models [IPDPS’04]
TAU’s CCA Interfaces
23
Phase Interface
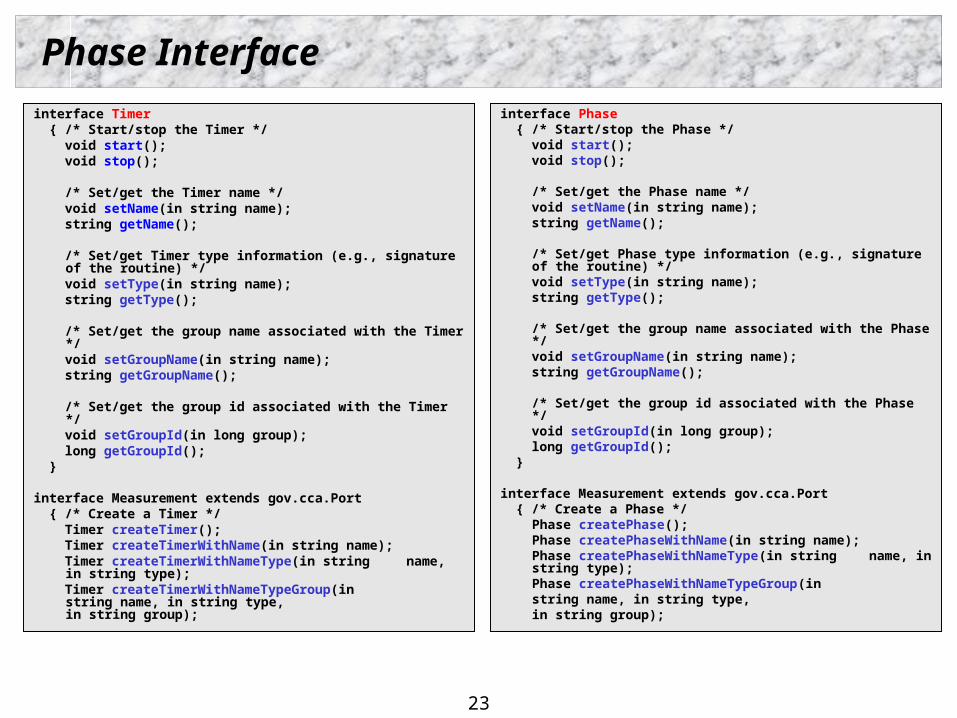
interface Timer { /* Start/stop the Timer */ void start(); void stop();
/* Set/get the Timer name */ void setName(in string name); string getName();
/* Set/get Timer type information (e.g., signature of the routine) */
void setType(in string name); string getType();
/* Set/get the group name associated with the Timer */
void setGroupName(in string name); string getGroupName();
/* Set/get the group id associated with the Timer */
void setGroupId(in long group); long getGroupId(); }
interface Measurement extends gov.cca.Port { /* Create a Timer */ Timer createTimer(); Timer createTimerWithName(in string name); Timer createTimerWithNameType(in string name,
in string type); Timer createTimerWithNameTypeGroup(in
string name, in string type, in string group);
interface Phase { /* Start/stop the Phase */ void start(); void stop();
/* Set/get the Phase name */ void setName(in string name); string getName();
/* Set/get Phase type information (e.g., signature of the routine) */
void setType(in string name); string getType();
/* Set/get the group name associated with the Phase */
void setGroupName(in string name); string getGroupName();
/* Set/get the group id associated with the Phase */
void setGroupId(in long group); long getGroupId(); }
interface Measurement extends gov.cca.Port { /* Create a Phase */
Phase createPhase(); Phase createPhaseWithName(in string name); Phase createPhaseWithNameType(in string name,
in string type); Phase createPhaseWithNameTypeGroup(in
string name, in string type, in string group);
24
Measurement Proxy Component
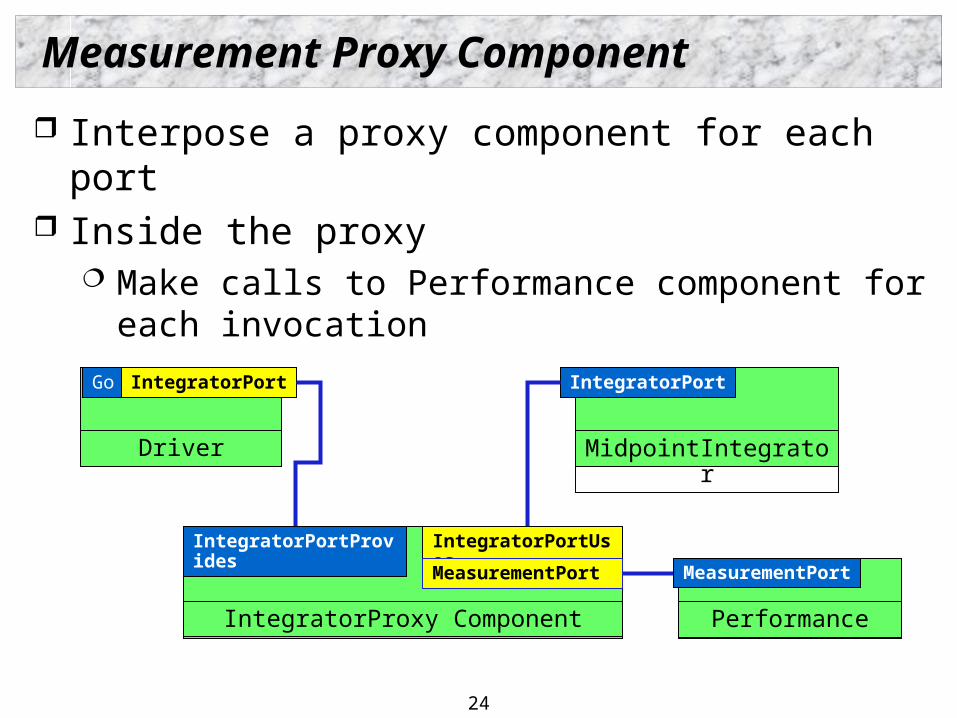
Interpose a proxy component for each port Inside the proxy
Make calls to Performance component for each invocation
MidpointIntegrator
IntegratorPortGo
Driver
IntegratorPort
IntegratorProxy Component
IntegratorPortUsesIntegratorPortProvides
MeasurementPort
Performance
MeasurementPort
25
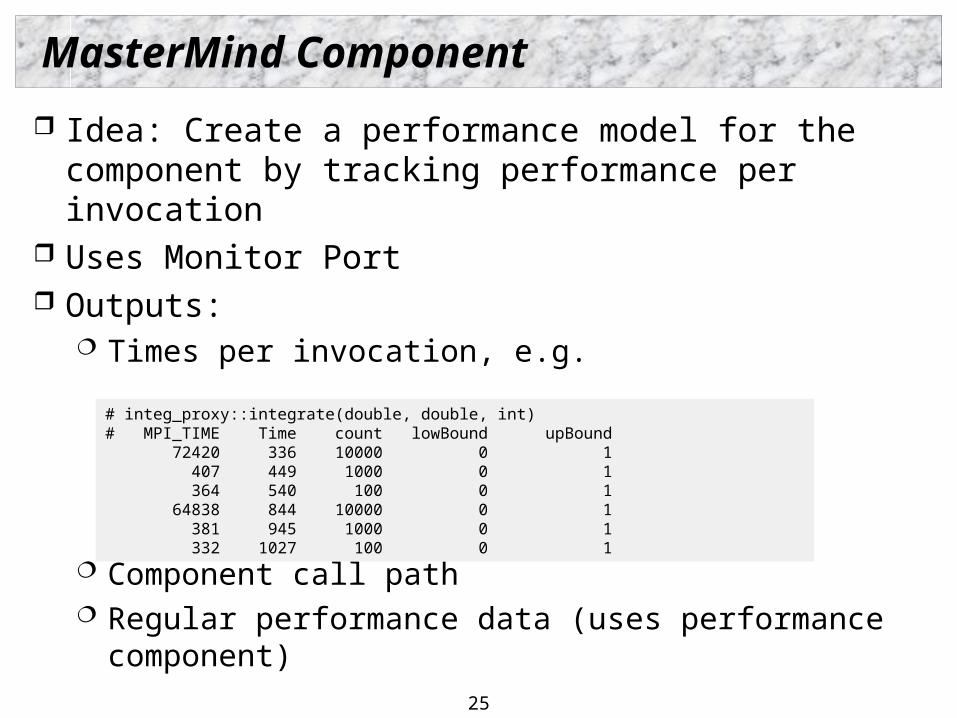
MasterMind Component
Idea: Create a performance model for the component by tracking performance per invocation
Uses Monitor Port Outputs:
Times per invocation, e.g.
Component call path Regular performance data (uses performance component)
# integ_proxy::integrate(double, double, int)# MPI_TIME Time count lowBound upBound 72420 336 10000 0 1 407 449 1000 0 1 364 540 100 0 1 64838 844 10000 0 1 381 945 1000 0 1 332 1027 100 0 1
26
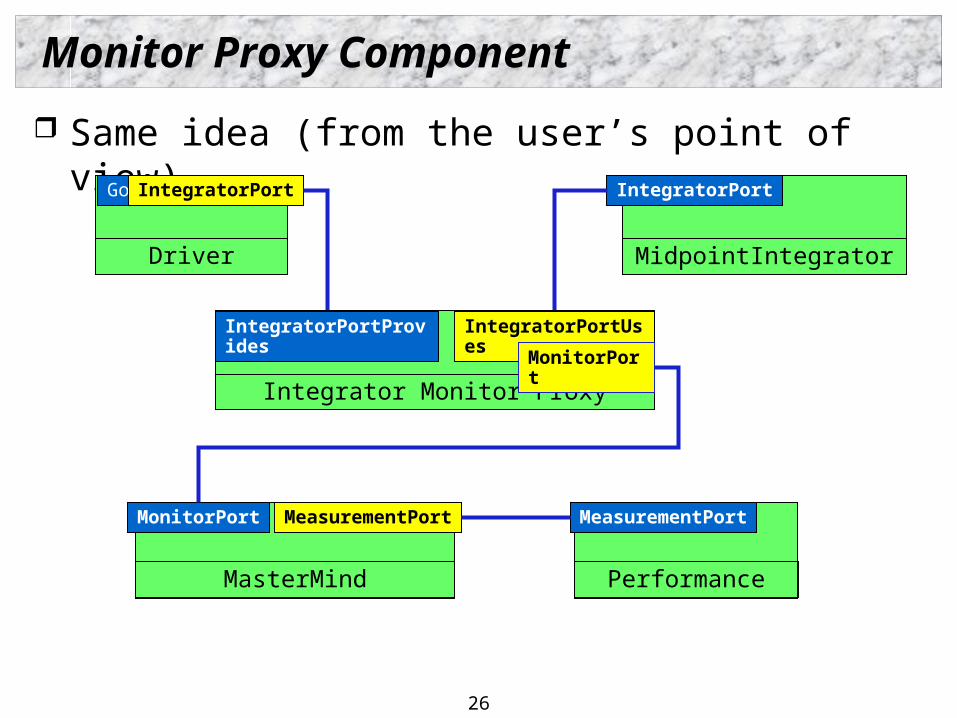
Monitor Proxy Component
Same idea (from the user’s point of view)
MidpointIntegrator
IntegratorPortGo
Driver
IntegratorPort
Integrator Monitor Proxy
IntegratorPortUsesIntegratorPortProvides
MonitorPort
MonitorPort
MasterMind
MeasurementPort MeasurementPort
Performance
27
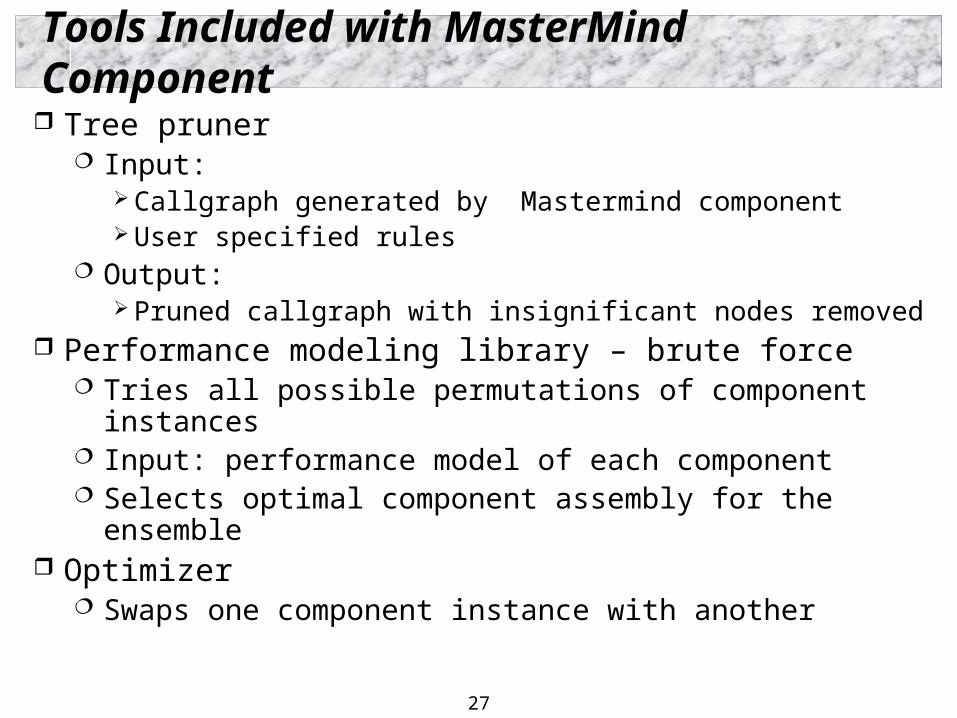
Tree pruner Input:
Callgraph generated by Mastermind component User specified rules
Output: Pruned callgraph with insignificant nodes removed
Performance modeling library – brute force Tries all possible permutations of component instances Input: performance model of each component Selects optimal component assembly for the ensemble
Optimizer Swaps one component instance with another
Tools Included with MasterMind Component
28
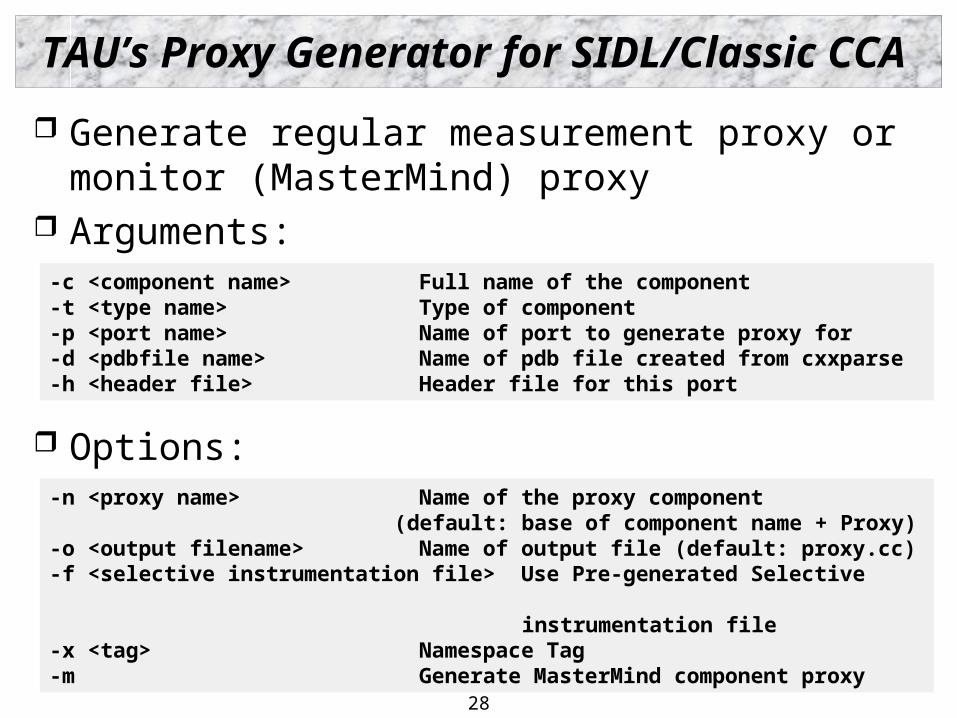
Generate regular measurement proxy or monitor (MasterMind) proxy
Arguments:
Options:
TAU’s Proxy Generator for SIDL/Classic CCA
-c <component name> Full name of the component-t <type name> Type of component-p <port name> Name of port to generate proxy for-d <pdbfile name> Name of pdb file created from cxxparse-h <header file> Header file for this port
-n <proxy name> Name of the proxy component (default: base of component name + Proxy)-o <output filename> Name of output file (default: proxy.cc)-f <selective instrumentation file> Use Pre-generated Selective instrumentation file-x <tag> Namespace Tag-m Generate MasterMind component proxy
29
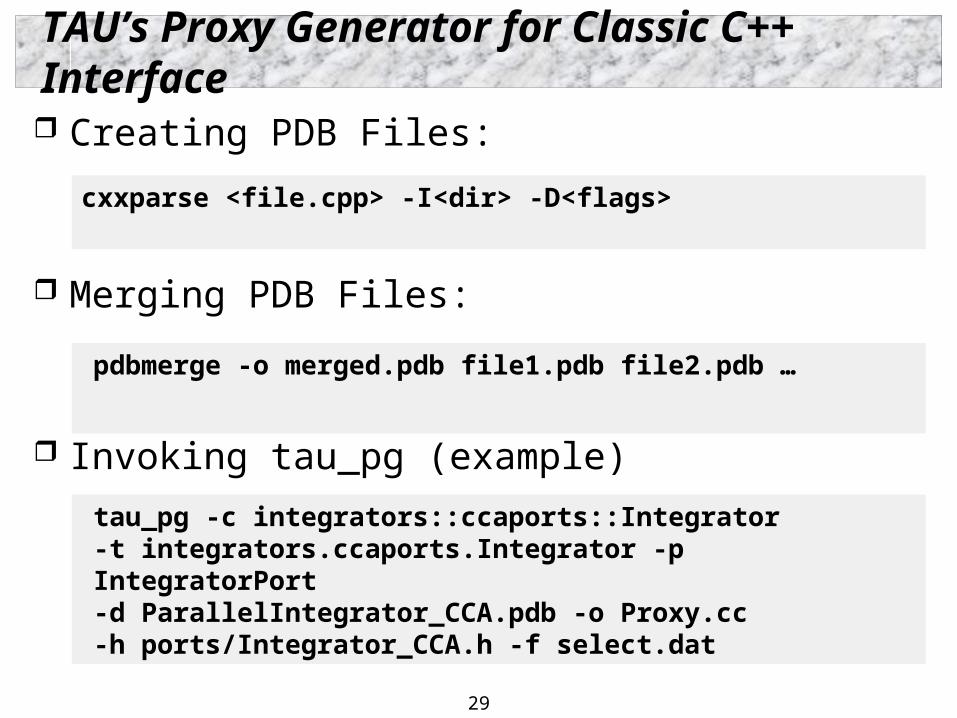
TAU’s Proxy Generator for Classic C++ Interface
Creating PDB Files:
Merging PDB Files:
Invoking tau_pg (example)
pdbmerge -o merged.pdb file1.pdb file2.pdb …
cxxparse <file.cpp> -I<dir> -D<flags>
tau_pg -c integrators::ccaports::Integrator -t integrators.ccaports.Integrator -p IntegratorPort -d ParallelIntegrator_CCA.pdb -o Proxy.cc -h ports/Integrator_CCA.h -f select.dat
30
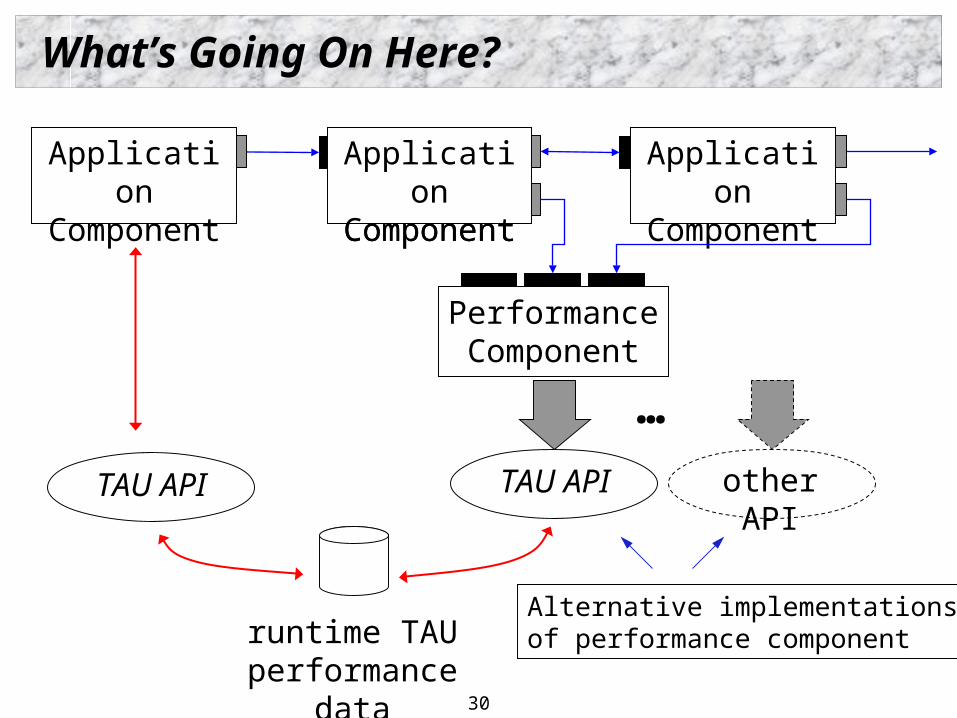
What’s Going On Here?
Alternative implementationsof performance componentruntime TAU
performance data
TAU API other API
…
ApplicationComponent
ApplicationComponent
PerformanceComponent
TAU API
ApplicationComponent
ApplicationComponent
31
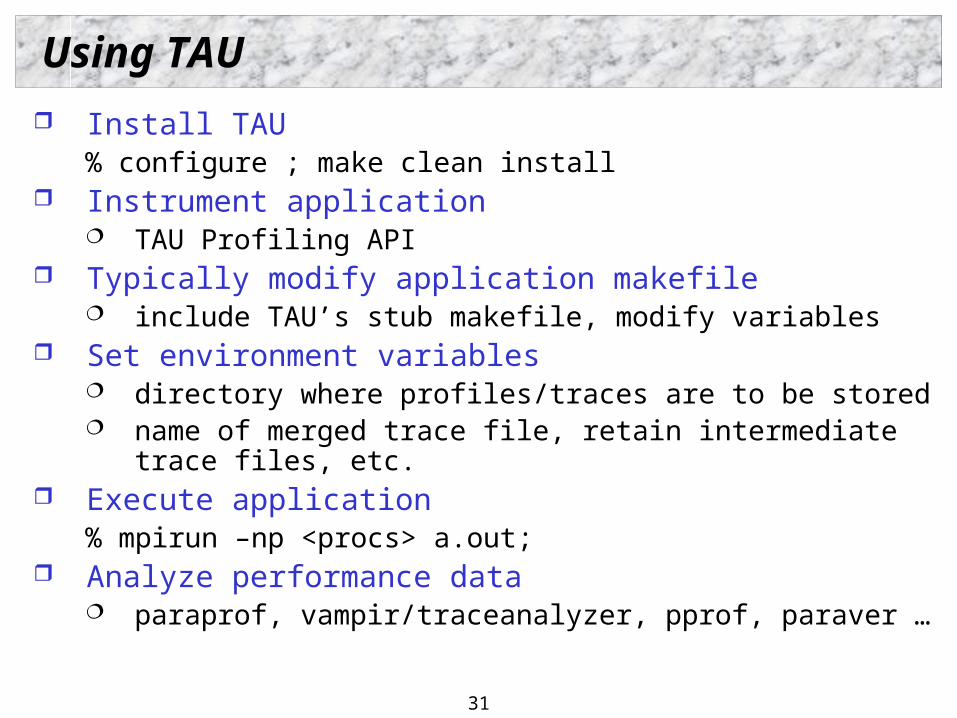
Using TAU
Install TAU% configure ; make clean install
Instrument application TAU Profiling API
Typically modify application makefile include TAU’s stub makefile, modify variables
Set environment variables directory where profiles/traces are to be stored name of merged trace file, retain intermediate trace files, etc.
Execute application% mpirun –np <procs> a.out;
Analyze performance data paraprof, vampir/traceanalyzer, pprof, paraver …
32
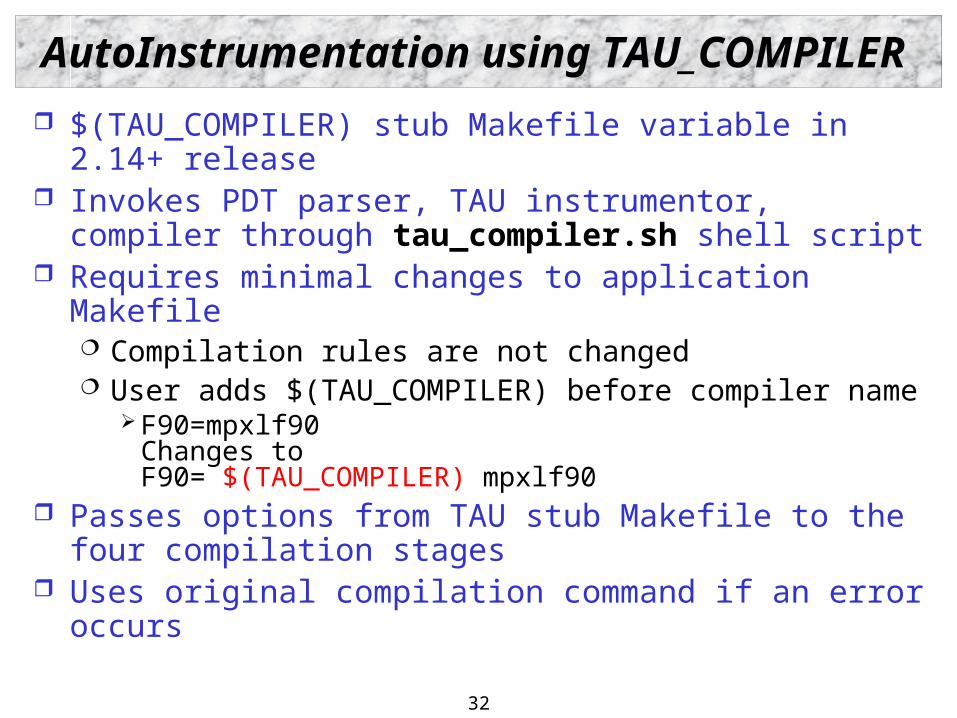
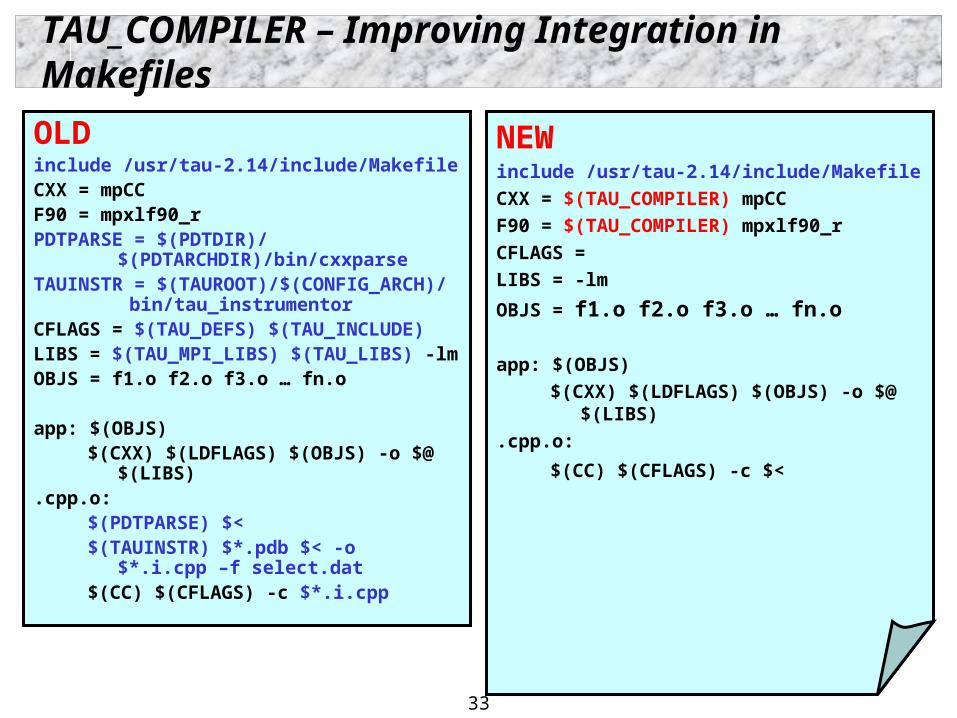
AutoInstrumentation using TAU_COMPILER
$(TAU_COMPILER) stub Makefile variable in 2.14+ release
Invokes PDT parser, TAU instrumentor, compiler through tau_compiler.sh shell script
Requires minimal changes to application Makefile Compilation rules are not changed User adds $(TAU_COMPILER) before compiler name
F90=mpxlf90Changes toF90= $(TAU_COMPILER) mpxlf90
Passes options from TAU stub Makefile to the four compilation stages
Uses original compilation command if an error occurs
33
TAU_COMPILER – Improving Integration in Makefiles
OLDinclude /usr/tau-2.14/include/MakefileCXX = mpCCF90 = mpxlf90_rPDTPARSE = $(PDTDIR)/
$(PDTARCHDIR)/bin/cxxparseTAUINSTR = $(TAUROOT)/$(CONFIG_ARCH)/
bin/tau_instrumentorCFLAGS = $(TAU_DEFS) $(TAU_INCLUDE)LIBS = $(TAU_MPI_LIBS) $(TAU_LIBS) -lmOBJS = f1.o f2.o f3.o … fn.o
app: $(OBJS)$(CXX) $(LDFLAGS) $(OBJS) -o $@
$(LIBS).cpp.o:
$(PDTPARSE) $<$(TAUINSTR) $*.pdb $< -o
$*.i.cpp –f select.dat$(CC) $(CFLAGS) -c $*.i.cpp
NEWinclude /usr/tau-2.14/include/Makefile
CXX = $(TAU_COMPILER) mpCC
F90 = $(TAU_COMPILER) mpxlf90_r
CFLAGS =
LIBS = -lm
OBJS = f1.o f2.o f3.o … fn.o
app: $(OBJS)
$(CXX) $(LDFLAGS) $(OBJS) -o $@ $(LIBS)
.cpp.o:
$(CC) $(CFLAGS) -c $<
34
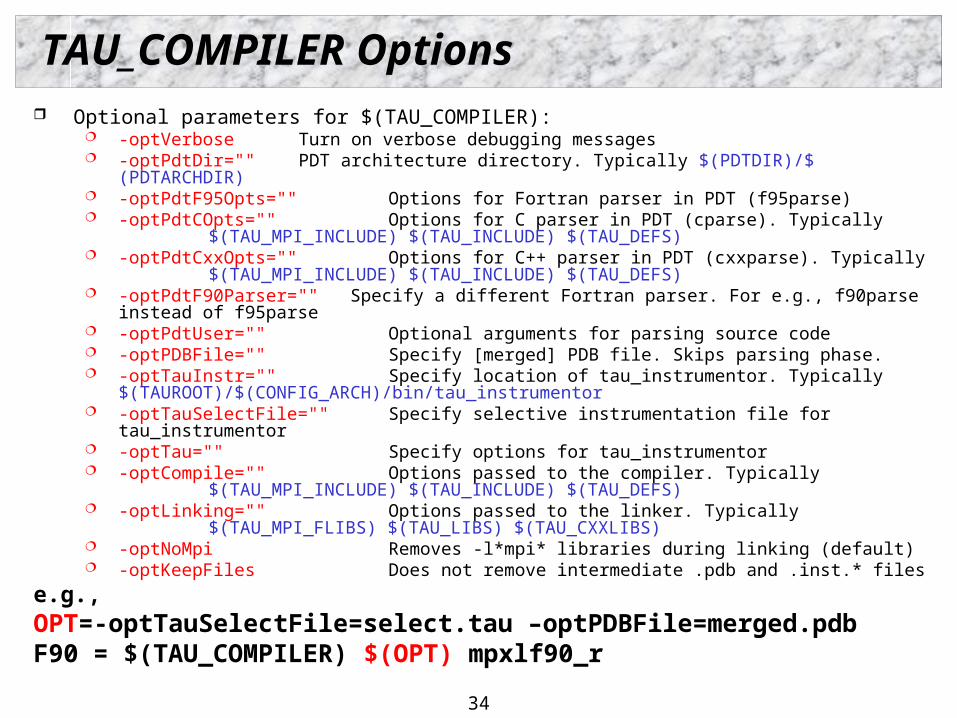
TAU_COMPILER Options Optional parameters for $(TAU_COMPILER):
-optVerbose Turn on verbose debugging messages -optPdtDir="" PDT architecture directory. Typically $(PDTDIR)/$(PDTARCHDIR) -optPdtF95Opts="" Options for Fortran parser in PDT (f95parse) -optPdtCOpts="" Options for C parser in PDT (cparse). Typically
$(TAU_MPI_INCLUDE) $(TAU_INCLUDE) $(TAU_DEFS) -optPdtCxxOpts="" Options for C++ parser in PDT (cxxparse). Typically
$(TAU_MPI_INCLUDE) $(TAU_INCLUDE) $(TAU_DEFS) -optPdtF90Parser="" Specify a different Fortran parser. For e.g., f90parse instead of f95parse -optPdtUser="" Optional arguments for parsing source code -optPDBFile="" Specify [merged] PDB file. Skips parsing phase. -optTauInstr="" Specify location of tau_instrumentor. Typically
$(TAUROOT)/$(CONFIG_ARCH)/bin/tau_instrumentor -optTauSelectFile="" Specify selective instrumentation file for tau_instrumentor -optTau="" Specify options for tau_instrumentor -optCompile="" Options passed to the compiler. Typically
$(TAU_MPI_INCLUDE) $(TAU_INCLUDE) $(TAU_DEFS) -optLinking="" Options passed to the linker. Typically
$(TAU_MPI_FLIBS) $(TAU_LIBS) $(TAU_CXXLIBS) -optNoMpi Removes -l*mpi* libraries during linking (default) -optKeepFiles Does not remove intermediate .pdb and .inst.* files
e.g., OPT=-optTauSelectFile=select.tau –optPDBFile=merged.pdbF90 = $(TAU_COMPILER) $(OPT) mpxlf90_r
35
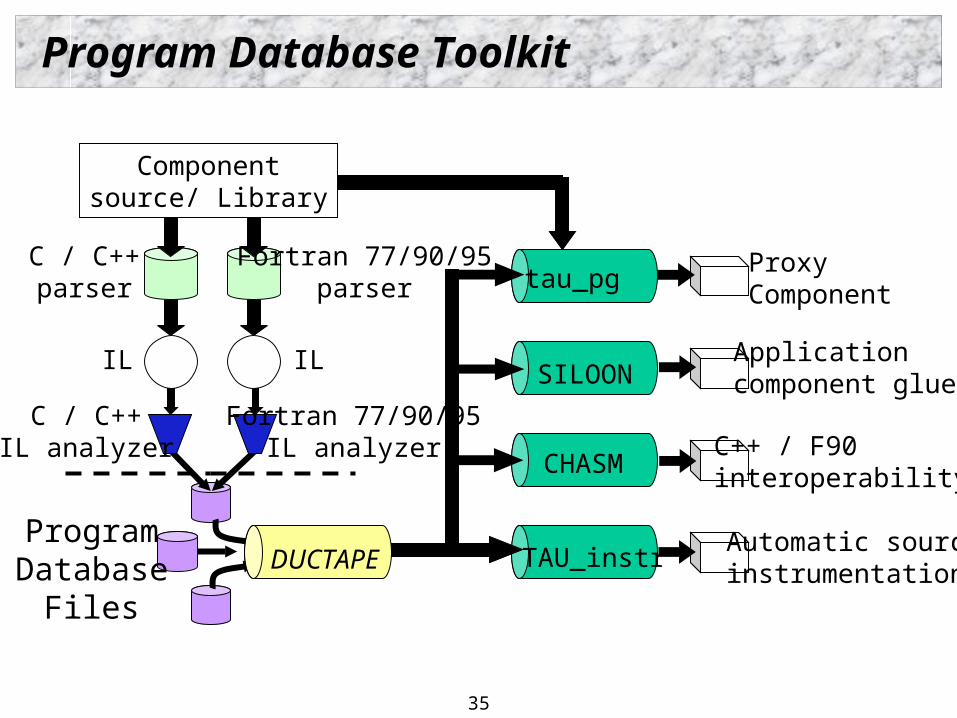
Program Database Toolkit
Componentsource/ Library
C / C++parser
Fortran 77/90/95parser
C / C++IL analyzer
Fortran 77/90/95IL analyzer
ProgramDatabase
Files
IL IL
DUCTAPE
tau_pg
SILOON
CHASM
TAU_instr
Proxy Component
Applicationcomponent glue
C++ / F90interoperability
Automatic sourceinstrumentation
36
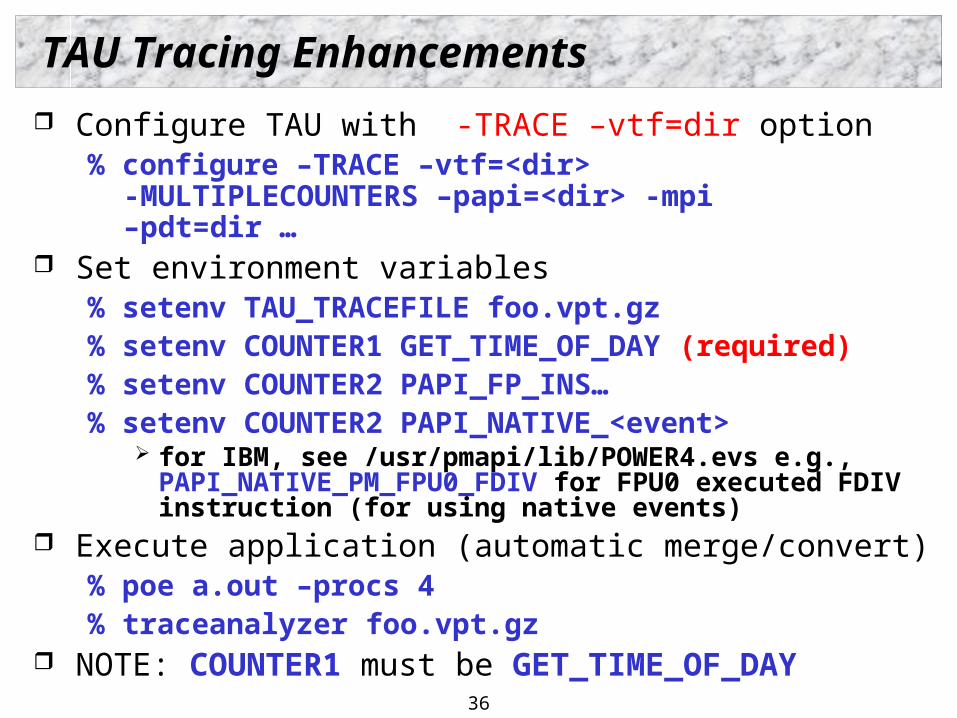
TAU Tracing Enhancements
Configure TAU with -TRACE –vtf=dir option% configure –TRACE –vtf=<dir>
-MULTIPLECOUNTERS –papi=<dir> -mpi –pdt=dir …
Set environment variables% setenv TAU_TRACEFILE foo.vpt.gz% setenv COUNTER1 GET_TIME_OF_DAY (required)% setenv COUNTER2 PAPI_FP_INS…% setenv COUNTER2 PAPI_NATIVE_<event>
for IBM, see /usr/pmapi/lib/POWER4.evs e.g., PAPI_NATIVE_PM_FPU0_FDIV for FPU0 executed FDIV instruction (for using native events)
Execute application (automatic merge/convert)% poe a.out –procs 4 % traceanalyzer foo.vpt.gz
NOTE: COUNTER1 must be GET_TIME_OF_DAY
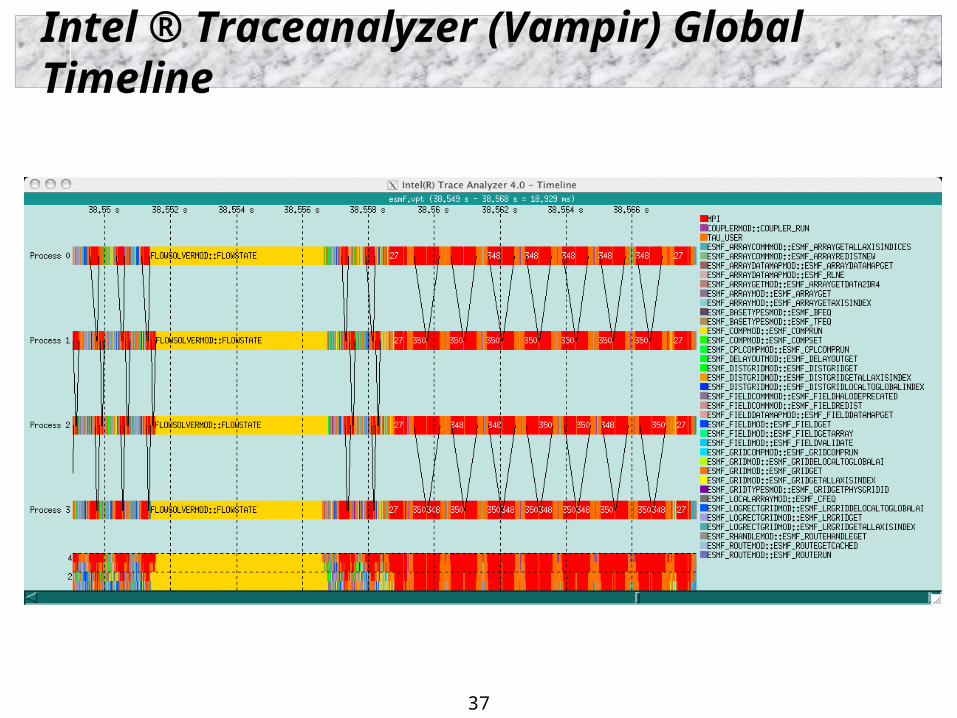
37
Intel ® Traceanalyzer (Vampir) Global Timeline
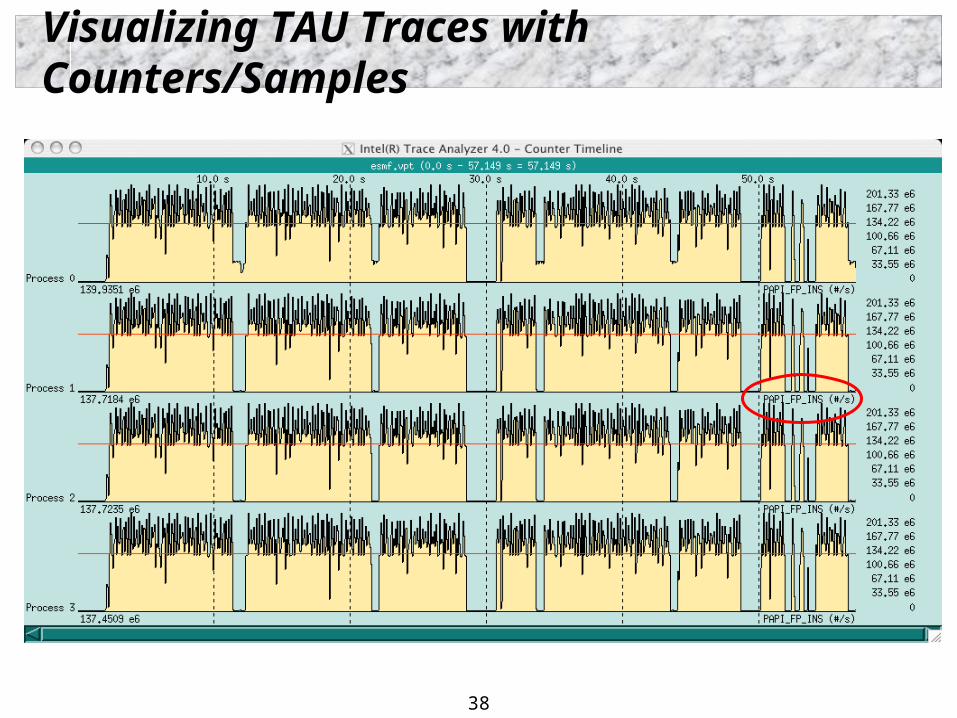
38
Visualizing TAU Traces with Counters/Samples
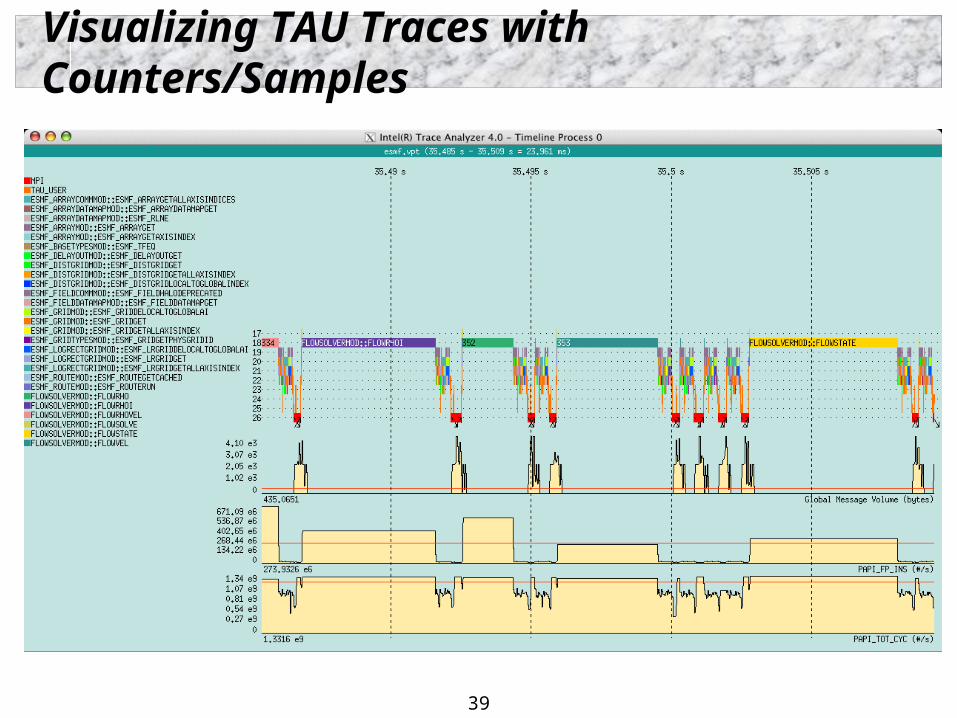
39
Visualizing TAU Traces with Counters/Samples
40
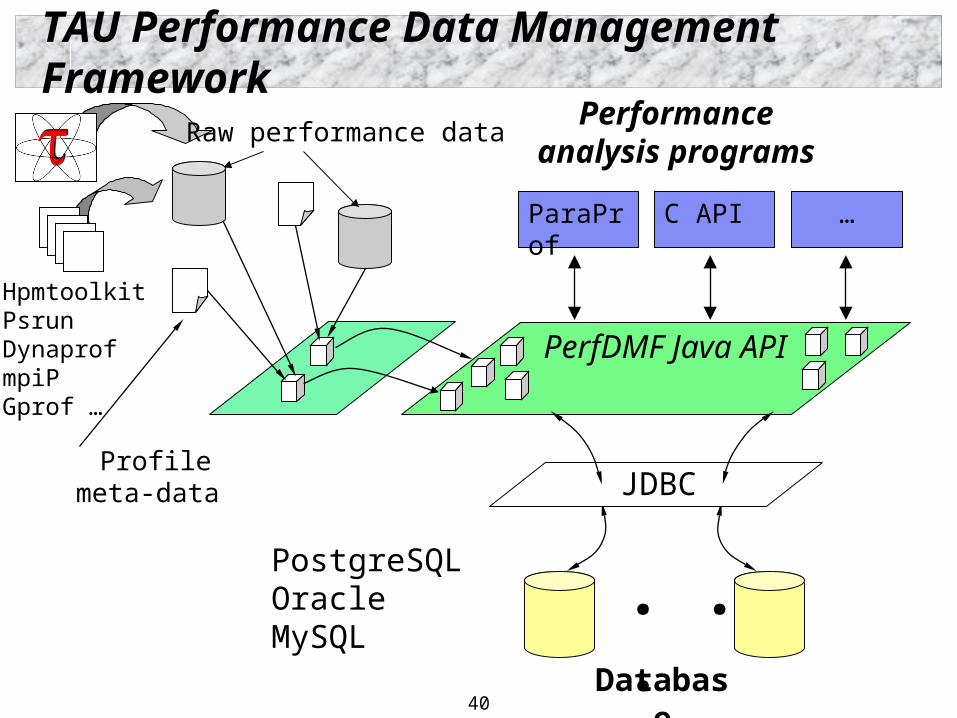
ParaProf
TAU Performance Data Management FrameworkPerformance
analysis programs
PerfDMF Java API
. . .
JDBC
PostgreSQLOracleMySQL
Database
Profile meta-data
Raw performance data
HpmtoolkitPsrunDynaprofmpiPGprof …
…C API …
41
Paraprof Manager – Performance Database
42
Paraprof Scalable Histogram View
43
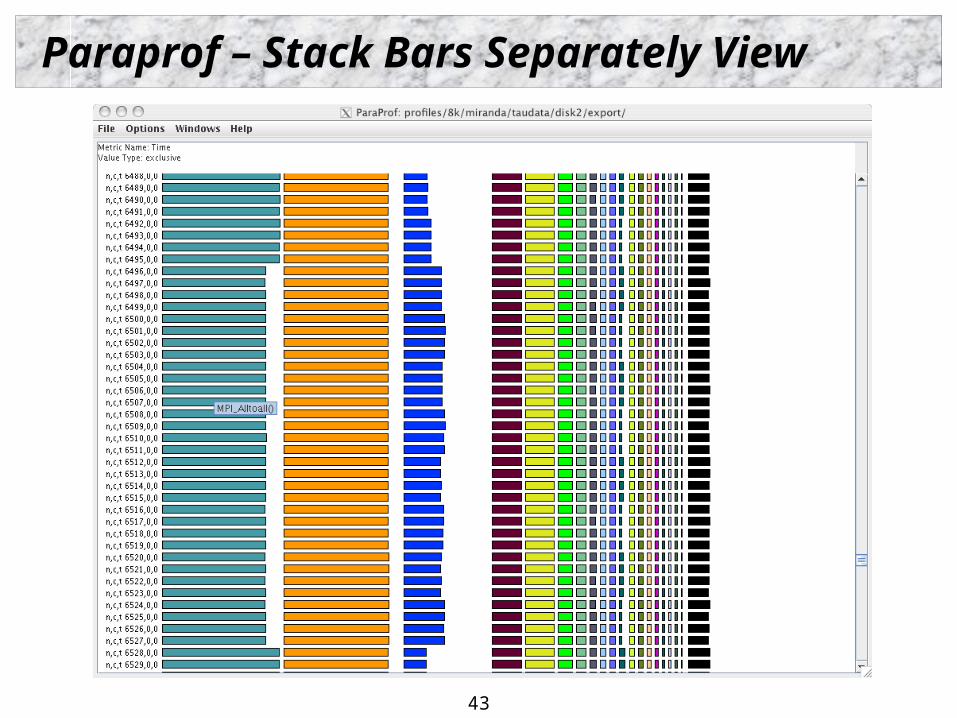
Paraprof – Stack Bars Separately View
44
Paraprof – Full Callgraph View
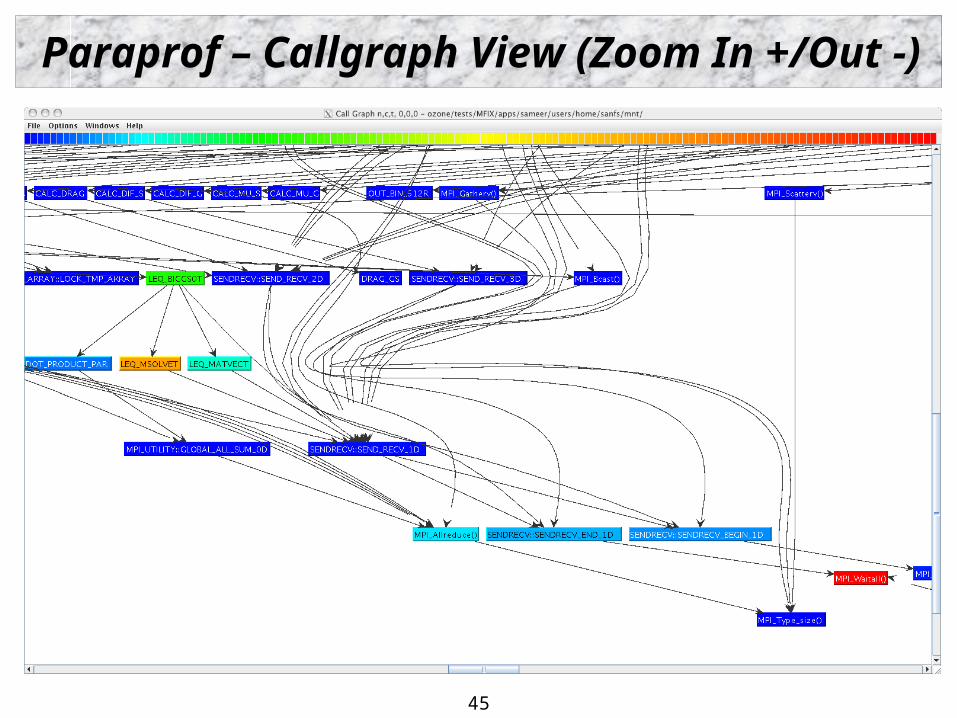
45
Paraprof – Callgraph View (Zoom In +/Out -)
46
KOJAK’s CUBE (UTK, FZJ) Browser
47
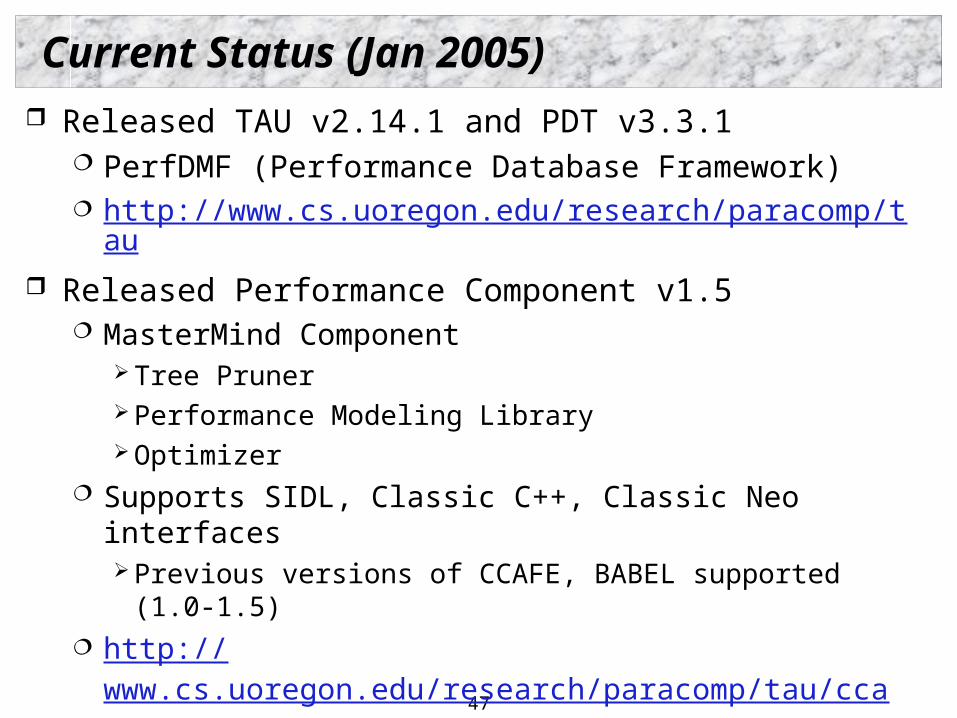
Current Status (Jan 2005)
Released TAU v2.14.1 and PDT v3.3.1 PerfDMF (Performance Database Framework) http://www.cs.uoregon.edu/research/paracomp/tau
Released Performance Component v1.5 MasterMind Component
Tree Pruner Performance Modeling Library Optimizer
Supports SIDL, Classic C++, Classic Neo interfaces Previous versions of CCAFE, BABEL supported (1.0-1.5)
http://www.cs.uoregon.edu/research/paracomp/tau/cca
48
Support Acknowledgements
Department of Energy (DOE) Office of Science contracts University of Utah DOE ASCI Level 1
sub-contract DOE ASC/NNSA Level 3 contract
NSF Software and Tools for High-EndComputing Grant
Research Centre Juelich John von Neumann Institute for
Computing Dr. Bernd Mohr
Los Alamos National Laboratory
49
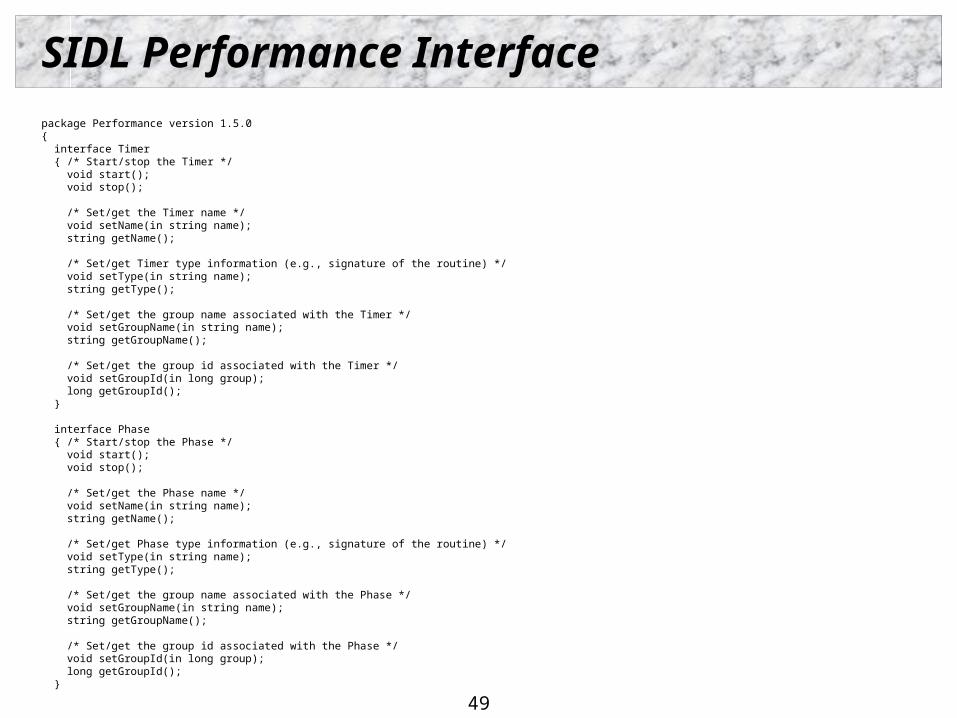
SIDL Performance Interface
package Performance version 1.5.0{ interface Timer { /* Start/stop the Timer */ void start(); void stop();
/* Set/get the Timer name */ void setName(in string name); string getName();
/* Set/get Timer type information (e.g., signature of the routine) */ void setType(in string name); string getType();
/* Set/get the group name associated with the Timer */ void setGroupName(in string name); string getGroupName();
/* Set/get the group id associated with the Timer */ void setGroupId(in long group); long getGroupId(); }
interface Phase { /* Start/stop the Phase */ void start(); void stop();
/* Set/get the Phase name */ void setName(in string name); string getName();
/* Set/get Phase type information (e.g., signature of the routine) */ void setType(in string name); string getType();
/* Set/get the group name associated with the Phase */ void setGroupName(in string name); string getGroupName();
/* Set/get the group id associated with the Phase */ void setGroupId(in long group); long getGroupId(); }
50
SIDL Performance Interface
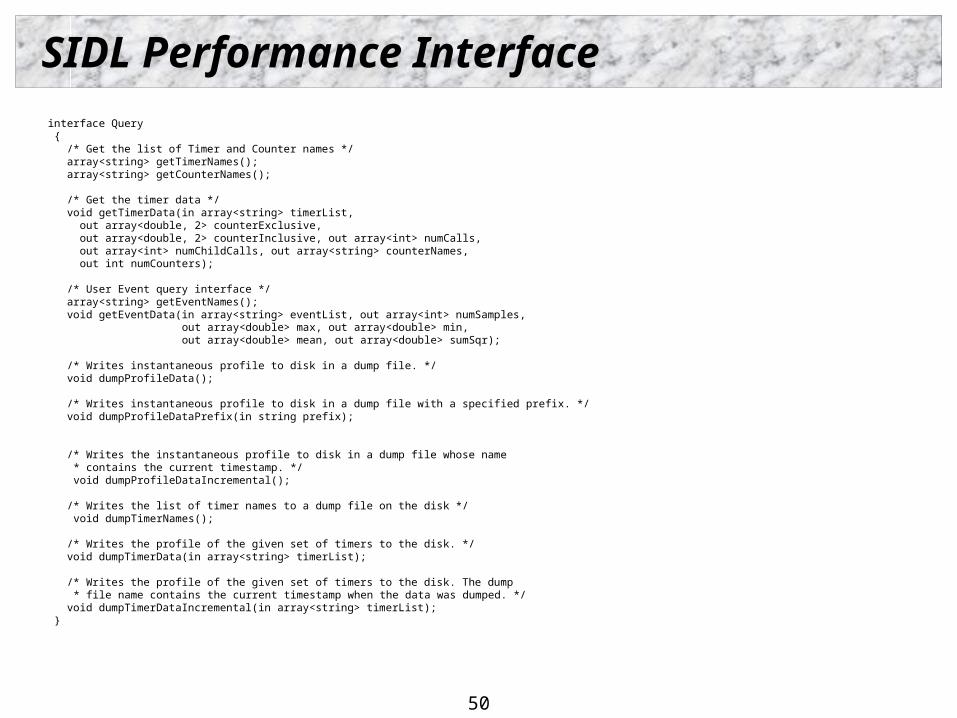
interface Query { /* Get the list of Timer and Counter names */ array<string> getTimerNames(); array<string> getCounterNames();
/* Get the timer data */ void getTimerData(in array<string> timerList, out array<double, 2> counterExclusive, out array<double, 2> counterInclusive, out array<int> numCalls, out array<int> numChildCalls, out array<string> counterNames, out int numCounters);
/* User Event query interface */ array<string> getEventNames(); void getEventData(in array<string> eventList, out array<int> numSamples, out array<double> max, out array<double> min, out array<double> mean, out array<double> sumSqr);
/* Writes instantaneous profile to disk in a dump file. */ void dumpProfileData();
/* Writes instantaneous profile to disk in a dump file with a specified prefix. */ void dumpProfileDataPrefix(in string prefix);
/* Writes the instantaneous profile to disk in a dump file whose name * contains the current timestamp. */ void dumpProfileDataIncremental();
/* Writes the list of timer names to a dump file on the disk */ void dumpTimerNames();
/* Writes the profile of the given set of timers to the disk. */ void dumpTimerData(in array<string> timerList);
/* Writes the profile of the given set of timers to the disk. The dump * file name contains the current timestamp when the data was dumped. */ void dumpTimerDataIncremental(in array<string> timerList); }
51
SIDL Performance Interface
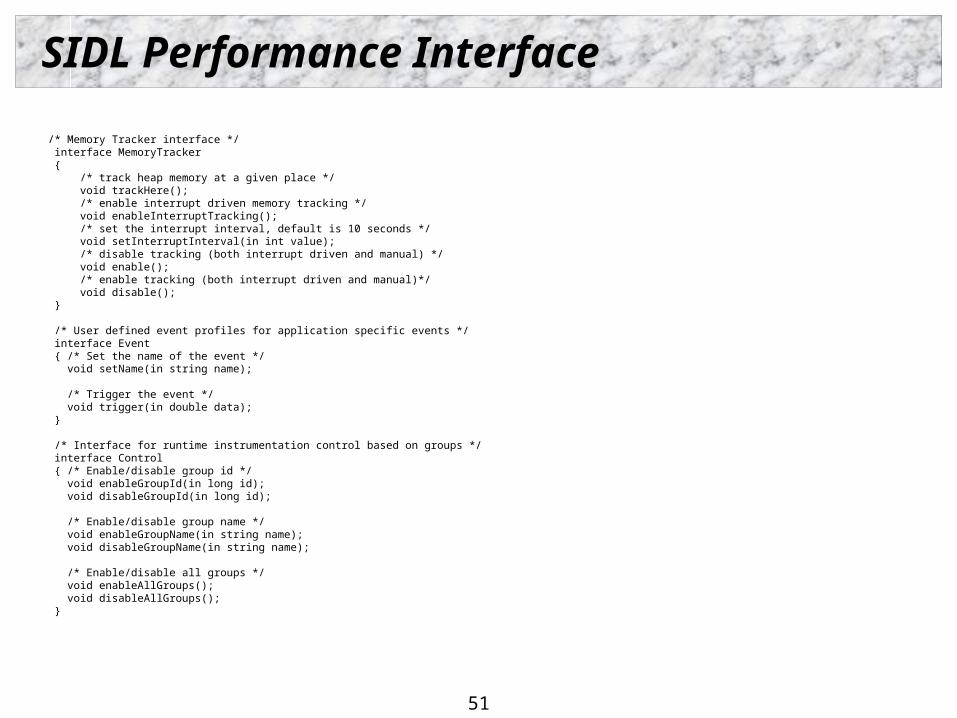
/* Memory Tracker interface */ interface MemoryTracker { /* track heap memory at a given place */ void trackHere(); /* enable interrupt driven memory tracking */ void enableInterruptTracking(); /* set the interrupt interval, default is 10 seconds */ void setInterruptInterval(in int value); /* disable tracking (both interrupt driven and manual) */ void enable(); /* enable tracking (both interrupt driven and manual)*/ void disable(); } /* User defined event profiles for application specific events */ interface Event { /* Set the name of the event */ void setName(in string name);
/* Trigger the event */ void trigger(in double data); } /* Interface for runtime instrumentation control based on groups */ interface Control { /* Enable/disable group id */ void enableGroupId(in long id); void disableGroupId(in long id);
/* Enable/disable group name */ void enableGroupName(in string name); void disableGroupName(in string name);
/* Enable/disable all groups */ void enableAllGroups(); void disableAllGroups(); }
52
SIDL Performance Interface
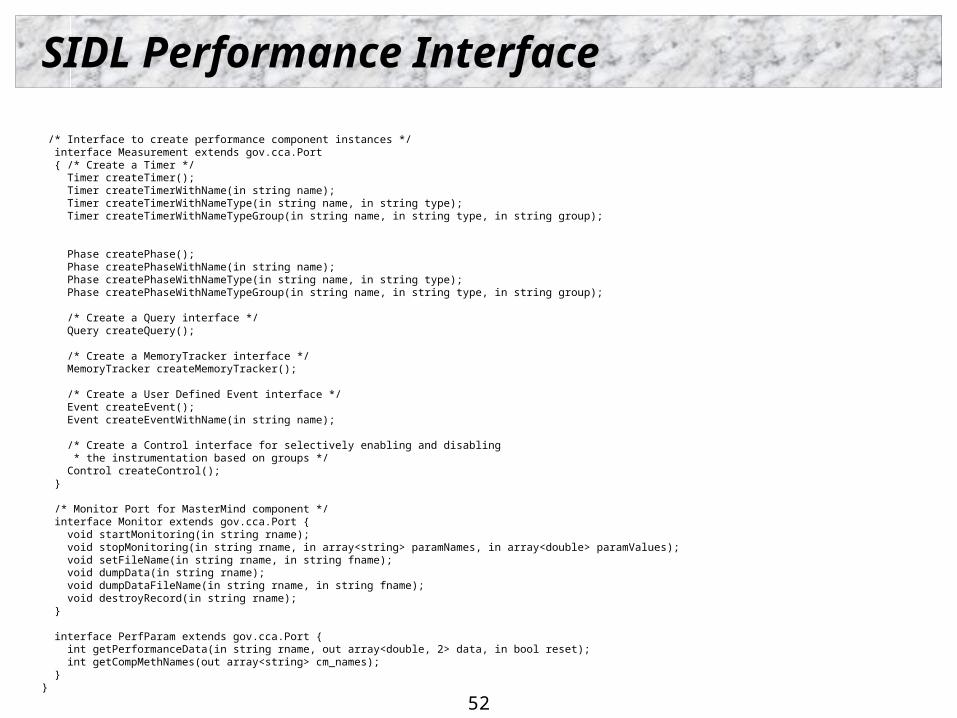
/* Interface to create performance component instances */ interface Measurement extends gov.cca.Port { /* Create a Timer */ Timer createTimer(); Timer createTimerWithName(in string name); Timer createTimerWithNameType(in string name, in string type); Timer createTimerWithNameTypeGroup(in string name, in string type, in string group);
Phase createPhase(); Phase createPhaseWithName(in string name); Phase createPhaseWithNameType(in string name, in string type); Phase createPhaseWithNameTypeGroup(in string name, in string type, in string group); /* Create a Query interface */ Query createQuery();
/* Create a MemoryTracker interface */ MemoryTracker createMemoryTracker();
/* Create a User Defined Event interface */ Event createEvent(); Event createEventWithName(in string name);
/* Create a Control interface for selectively enabling and disabling * the instrumentation based on groups */ Control createControl(); } /* Monitor Port for MasterMind component */ interface Monitor extends gov.cca.Port { void startMonitoring(in string rname); void stopMonitoring(in string rname, in array<string> paramNames, in array<double> paramValues); void setFileName(in string rname, in string fname); void dumpData(in string rname); void dumpDataFileName(in string rname, in string fname); void destroyRecord(in string rname); } interface PerfParam extends gov.cca.Port { int getPerformanceData(in string rname, out array<double, 2> data, in bool reset); int getCompMethNames(out array<string> cm_names); }}

53
SIDL Performance Interface
/* Interface to create performance component instances */ interface Measurement extends gov.cca.Port { /* Create a Timer */ Timer createTimer(); Timer createTimerWithName(in string name); Timer createTimerWithNameType(in string name, in string type); Timer createTimerWithNameTypeGroup(in string name, in string type, in string group);
Phase createPhase(); Phase createPhaseWithName(in string name); Phase createPhaseWithNameType(in string name, in string type); Phase createPhaseWithNameTypeGroup(in string name, in string type, in string group); /* Create a Query interface */ Query createQuery();
/* Create a MemoryTracker interface */ MemoryTracker createMemoryTracker();
/* Create a User Defined Event interface */ Event createEvent(); Event createEventWithName(in string name);
/* Create a Control interface for selectively enabling and disabling * the instrumentation based on groups */ Control createControl(); } /* Monitor Port for MasterMind component */ interface Monitor extends gov.cca.Port { void startMonitoring(in string rname); void stopMonitoring(in string rname, in array<string> paramNames, in array<double> paramValues); void setFileName(in string rname, in string fname); void dumpData(in string rname); void dumpDataFileName(in string rname, in string fname); void destroyRecord(in string rname); } interface PerfParam extends gov.cca.Port { int getPerformanceData(in string rname, out array<double, 2> data, in bool reset); int getCompMethNames(out array<string> cm_names); }}

54
Sample Driver
voidsample::Driver_impl::setServices ( /*in*/ ::gov::cca::Services services )throw ( ::gov::cca::CCAException){ // DO-NOT-DELETE splicer.begin(sample.Driver.setServices)
frameworkServices = services;
gov::cca::TypeMap tm = frameworkServices.createTypeMap(); gov::cca::Port p = self;
frameworkServices.addProvidesPort (p, "Go", "gov.cca.ports.GoPort", tm);
frameworkServices.registerUsesPort ("MeasurementPort", "Performance.Measurement", tm);
// DO-NOT-DELETE splicer.end(sample.Driver.setServices)}
55
Sample Driver
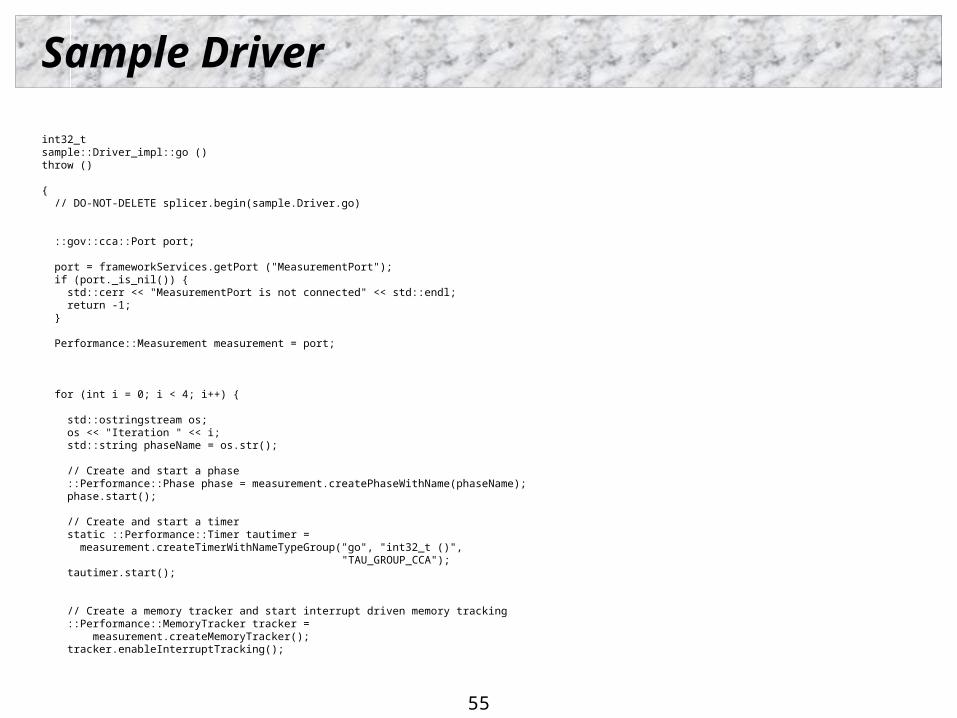
int32_tsample::Driver_impl::go ()throw ()
{ // DO-NOT-DELETE splicer.begin(sample.Driver.go)
::gov::cca::Port port;
port = frameworkServices.getPort ("MeasurementPort"); if (port._is_nil()) { std::cerr << "MeasurementPort is not connected" << std::endl; return -1; }
Performance::Measurement measurement = port;
for (int i = 0; i < 4; i++) {
std::ostringstream os; os << "Iteration " << i; std::string phaseName = os.str();
// Create and start a phase ::Performance::Phase phase = measurement.createPhaseWithName(phaseName); phase.start();
// Create and start a timer static ::Performance::Timer tautimer = measurement.createTimerWithNameTypeGroup("go", "int32_t ()", "TAU_GROUP_CCA"); tautimer.start();
// Create a memory tracker and start interrupt driven memory tracking ::Performance::MemoryTracker tracker = measurement.createMemoryTracker(); tracker.enableInterruptTracking();
56
Sample Driver
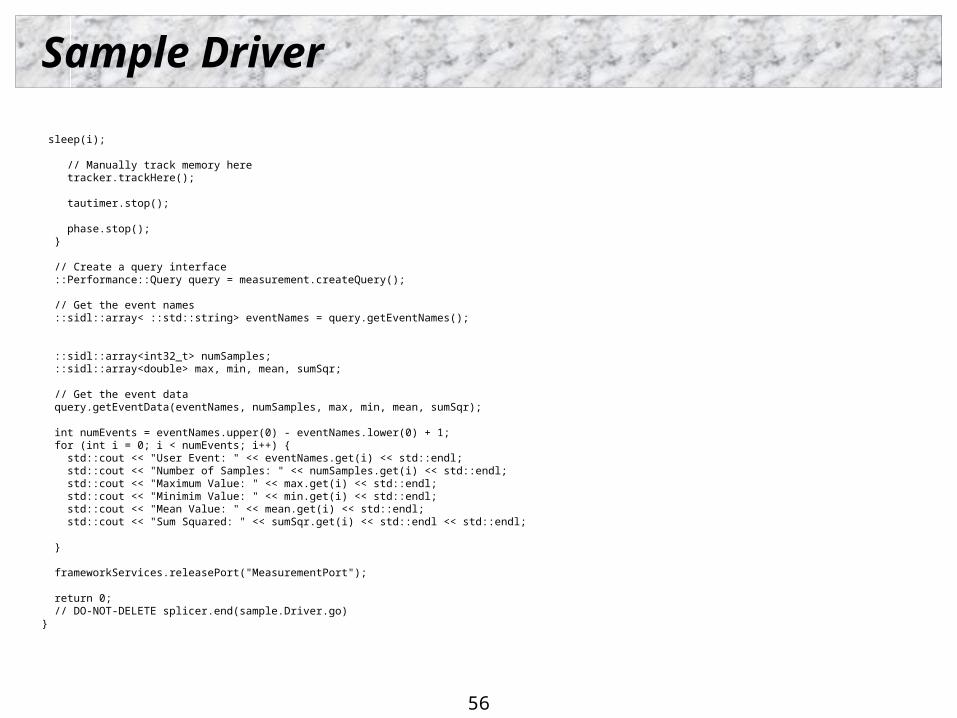
sleep(i);
// Manually track memory here tracker.trackHere();
tautimer.stop();
phase.stop(); } // Create a query interface ::Performance::Query query = measurement.createQuery(); // Get the event names ::sidl::array< ::std::string> eventNames = query.getEventNames();
::sidl::array<int32_t> numSamples; ::sidl::array<double> max, min, mean, sumSqr; // Get the event data query.getEventData(eventNames, numSamples, max, min, mean, sumSqr); int numEvents = eventNames.upper(0) - eventNames.lower(0) + 1; for (int i = 0; i < numEvents; i++) { std::cout << "User Event: " << eventNames.get(i) << std::endl; std::cout << "Number of Samples: " << numSamples.get(i) << std::endl; std::cout << "Maximum Value: " << max.get(i) << std::endl; std::cout << "Minimim Value: " << min.get(i) << std::endl; std::cout << "Mean Value: " << mean.get(i) << std::endl; std::cout << "Sum Squared: " << sumSqr.get(i) << std::endl << std::endl; } frameworkServices.releasePort("MeasurementPort"); return 0; // DO-NOT-DELETE splicer.end(sample.Driver.go)}
57
CCA Classic C++ Performance interface
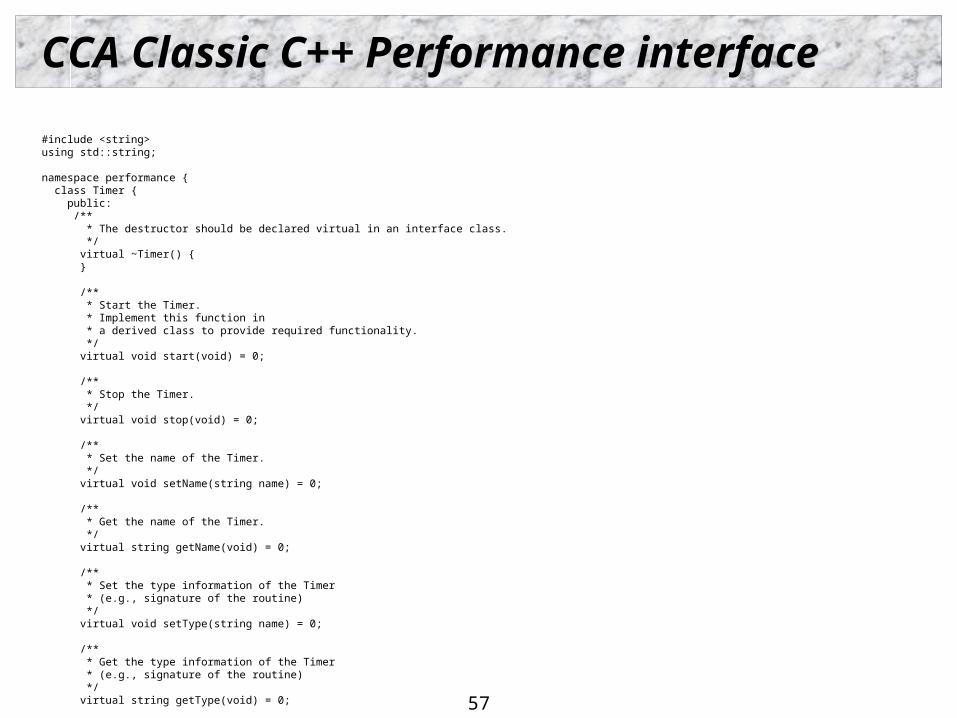
#include <string>using std::string;
namespace performance { class Timer { public: /** * The destructor should be declared virtual in an interface class. */ virtual ~Timer() { }
/** * Start the Timer. * Implement this function in * a derived class to provide required functionality. */ virtual void start(void) = 0;
/** * Stop the Timer. */ virtual void stop(void) = 0;
/** * Set the name of the Timer. */ virtual void setName(string name) = 0;
/** * Get the name of the Timer. */ virtual string getName(void) = 0;
/** * Set the type information of the Timer * (e.g., signature of the routine) */ virtual void setType(string name) = 0;
/** * Get the type information of the Timer * (e.g., signature of the routine) */ virtual string getType(void) = 0;
58
CCA Classic C++ Performance interface
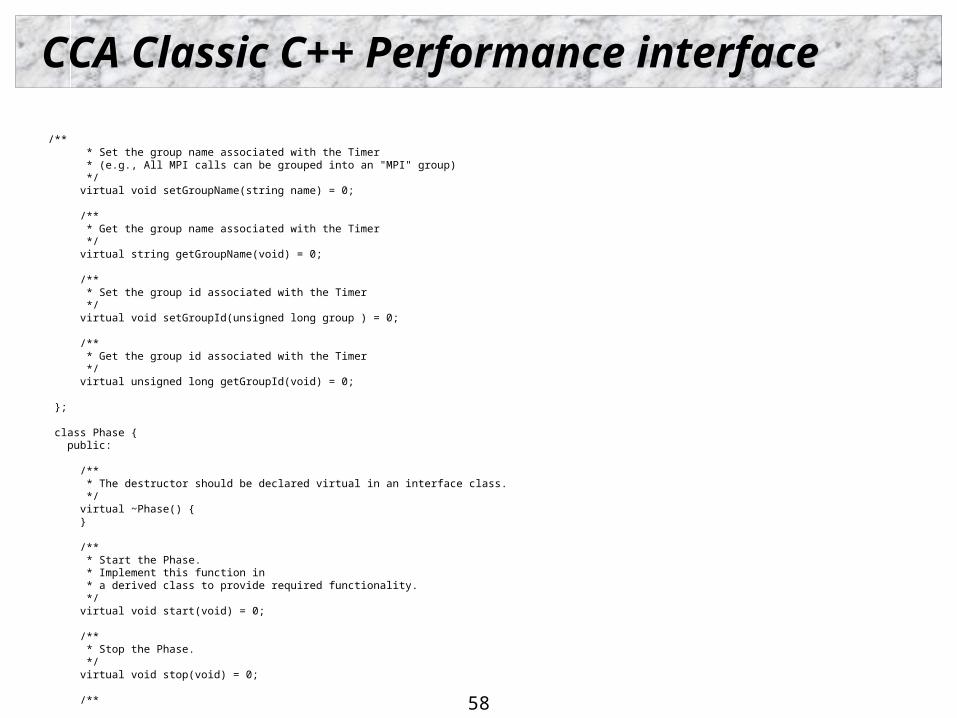
/** * Set the group name associated with the Timer * (e.g., All MPI calls can be grouped into an "MPI" group) */ virtual void setGroupName(string name) = 0;
/** * Get the group name associated with the Timer */ virtual string getGroupName(void) = 0;
/** * Set the group id associated with the Timer */ virtual void setGroupId(unsigned long group ) = 0;
/** * Get the group id associated with the Timer */ virtual unsigned long getGroupId(void) = 0;
};
class Phase { public:
/** * The destructor should be declared virtual in an interface class. */ virtual ~Phase() { }
/** * Start the Phase. * Implement this function in * a derived class to provide required functionality. */ virtual void start(void) = 0;
/** * Stop the Phase. */ virtual void stop(void) = 0;
/**
* Set the name of the Phase.
59
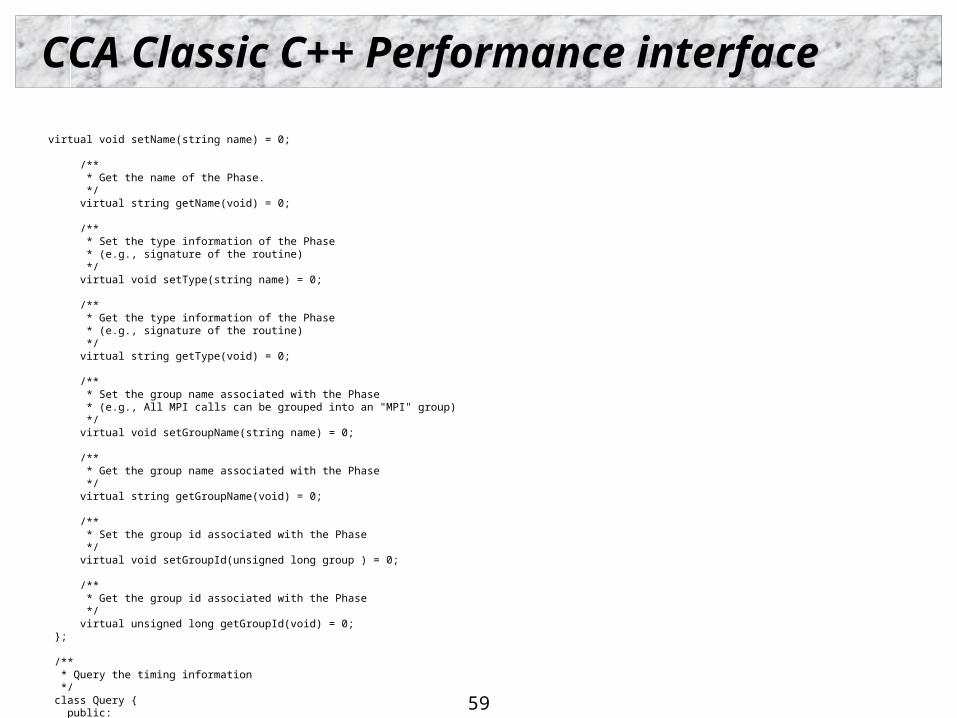
CCA Classic C++ Performance interface
virtual void setName(string name) = 0;
/** * Get the name of the Phase. */ virtual string getName(void) = 0;
/** * Set the type information of the Phase * (e.g., signature of the routine) */ virtual void setType(string name) = 0;
/** * Get the type information of the Phase * (e.g., signature of the routine) */ virtual string getType(void) = 0;
/** * Set the group name associated with the Phase * (e.g., All MPI calls can be grouped into an "MPI" group) */ virtual void setGroupName(string name) = 0; /** * Get the group name associated with the Phase */ virtual string getGroupName(void) = 0;
/** * Set the group id associated with the Phase */ virtual void setGroupId(unsigned long group ) = 0;
/** * Get the group id associated with the Phase */ virtual unsigned long getGroupId(void) = 0; };
/** * Query the timing information */ class Query { public:
60
CCA Classic C++ Performance interface
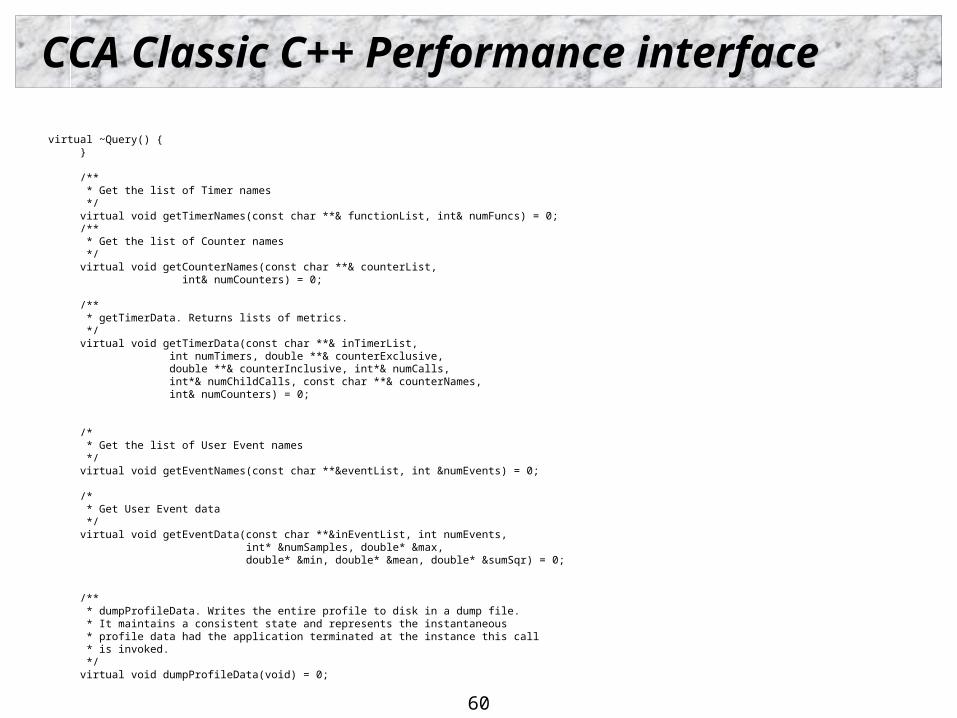
virtual ~Query() { }
/** * Get the list of Timer names */ virtual void getTimerNames(const char **& functionList, int& numFuncs) = 0; /** * Get the list of Counter names */ virtual void getCounterNames(const char **& counterList, int& numCounters) = 0;
/** * getTimerData. Returns lists of metrics. */ virtual void getTimerData(const char **& inTimerList, int numTimers, double **& counterExclusive, double **& counterInclusive, int*& numCalls, int*& numChildCalls, const char **& counterNames, int& numCounters) = 0;
/* * Get the list of User Event names */ virtual void getEventNames(const char **&eventList, int &numEvents) = 0;
/* * Get User Event data */ virtual void getEventData(const char **&inEventList, int numEvents, int* &numSamples, double* &max, double* &min, double* &mean, double* &sumSqr) = 0;
/** * dumpProfileData. Writes the entire profile to disk in a dump file. * It maintains a consistent state and represents the instantaneous * profile data had the application terminated at the instance this call * is invoked. */ virtual void dumpProfileData(void) = 0;
61
CCA Classic C++ Performance interface
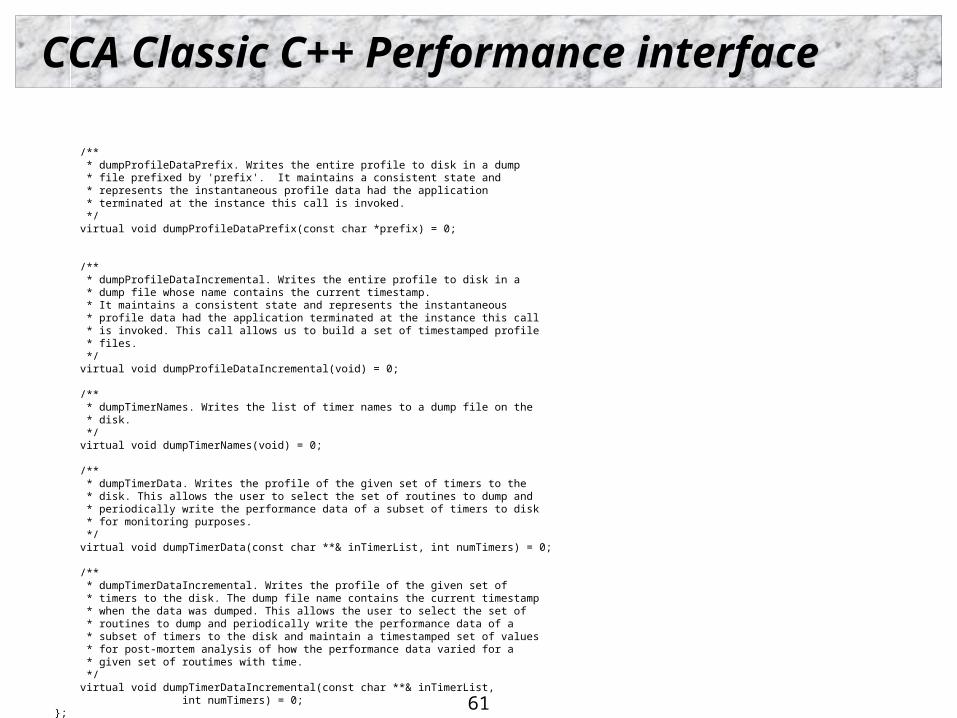
/** * dumpProfileDataPrefix. Writes the entire profile to disk in a dump * file prefixed by 'prefix'. It maintains a consistent state and * represents the instantaneous profile data had the application * terminated at the instance this call is invoked. */ virtual void dumpProfileDataPrefix(const char *prefix) = 0;
/** * dumpProfileDataIncremental. Writes the entire profile to disk in a * dump file whose name contains the current timestamp. * It maintains a consistent state and represents the instantaneous * profile data had the application terminated at the instance this call * is invoked. This call allows us to build a set of timestamped profile * files. */ virtual void dumpProfileDataIncremental(void) = 0;
/** * dumpTimerNames. Writes the list of timer names to a dump file on the * disk. */ virtual void dumpTimerNames(void) = 0;
/** * dumpTimerData. Writes the profile of the given set of timers to the * disk. This allows the user to select the set of routines to dump and * periodically write the performance data of a subset of timers to disk * for monitoring purposes. */ virtual void dumpTimerData(const char **& inTimerList, int numTimers) = 0;
/** * dumpTimerDataIncremental. Writes the profile of the given set of * timers to the disk. The dump file name contains the current timestamp * when the data was dumped. This allows the user to select the set of * routines to dump and periodically write the performance data of a * subset of timers to the disk and maintain a timestamped set of values * for post-mortem analysis of how the performance data varied for a * given set of routimes with time. */ virtual void dumpTimerDataIncremental(const char **& inTimerList, int numTimers) = 0; }; /** * dumpProfileDataPrefix. Writes the entire profile to disk in a dump * file prefixed by 'prefix'. It maintains a consistent state and * represents the instantaneous profile data had the application * terminated at the instance this call is invoked. */ virtual void dumpProfileDataPrefix(const char *prefix) = 0;
/** * dumpProfileDataIncremental. Writes the entire profile to disk in a * dump file whose name contains the current timestamp. * It maintains a consistent state and represents the instantaneous * profile data had the application terminated at the instance this call * is invoked. This call allows us to build a set of timestamped profile * files. */ virtual void dumpProfileDataIncremental(void) = 0;
/** * dumpTimerNames. Writes the list of timer names to a dump file on the * disk. */ virtual void dumpTimerNames(void) = 0;
/** * dumpTimerData. Writes the profile of the given set of timers to the * disk. This allows the user to select the set of routines to dump and * periodically write the performance data of a subset of timers to disk * for monitoring purposes. */ virtual void dumpTimerData(const char **& inTimerList, int numTimers) = 0;
/** * dumpTimerDataIncremental. Writes the profile of the given set of * timers to the disk. The dump file name contains the current timestamp * when the data was dumped. This allows the user to select the set of * routines to dump and periodically write the performance data of a * subset of timers to the disk and maintain a timestamped set of values * for post-mortem analysis of how the performance data varied for a * given set of routimes with time. */ virtual void dumpTimerDataIncremental(const char **& inTimerList, int numTimers) = 0; }; /** * disable tracking (both interrupt driven and manual) */ virtual void disable() = 0; };
/** * This class implements the runtime instrumentation control based on groups */ class Control { public: /** * Destructor */ ~Control () { } /** * Control instrumentation. Enable group Id. */ virtual void enableGroupId(unsigned long id) = 0;
/** * Control instrumentation. Disable group Id. */ virtual void disableGroupId(unsigned long id) = 0;
/** * Control instrumentation. Enable group name. */ virtual void enableGroupName(string name) = 0;
/** * Control instrumentation. Disable group name. */ virtual void disableGroupName(string name) = 0;
/** * Control instrumentation. Enable all groups. */ virtual void enableAllGroups(void) = 0;
/** * Control instrumentation. Disable all groups. */ virtual void disableAllGroups(void) = 0; };
namespace ccaports { /** * This abstract class declares the Measurement interface. * Inherit from this class to provide functionality. */ class Measurement: public virtual classic::gov::cca::Port { public:
/** * The destructor should be declared virtual in an interface class. */ virtual ~Measurement() { }
/** * Create a Timer */ virtual performance::Timer* createTimer(void) = 0; virtual performance::Timer* createTimer(string name) = 0; virtual performance::Timer* createTimer(string name, string type) = 0; virtual performance::Timer* createTimer(string name, string type, string group) = 0;
/** * Create a Phase */ virtual performance::Phase* createPhase(void) = 0; virtual performance::Phase* createPhase(string name) = 0; virtual performance::Phase* createPhase(string name, string type) = 0; virtual performance::Phase* createPhase(string name, string type, string group) = 0;
/** * Create a MemoryTracker interface */ virtual performance::MemoryTracker* createMemoryTracker(void) = 0;
/** * Create a Query interface */ virtual performance::Query* createQuery(void) = 0;
/** * Create a User Defined Event interface */ virtual performance::Event* createEvent(void) = 0; virtual performance::Event* createEvent(string name) = 0; /** * Create a Control interface for selectively enabling and disabling * the instrumentation based on groups */ virtual performance::Control* createControl(void) = 0; }; }}