performance tools bof, sc’07 5:30pm – 7pm, tuesday, a9 sameer s. shende [email protected] ...
Post on 21-Dec-2015
214 views
TRANSCRIPT

Performance Tools BOF, SC’075:30pm – 7pm, Tuesday, A9
Sameer S. Shende [email protected]
http://tau.uoregon.edu
Performance Research Laboratory
University of Oregon
TAU Performance System

SC’07: Performance Tools BOF 2TAU Performance System
Acknowledgements
Dr. Allen D. Malony, Professor Alan Morris, Senior software engineer Wyatt Spear, Software engineer Scott Biersdorff, Software engineer Matt Sottile, Research faculty Rob Yelle, Research faculty Kevin Huck, Ph.D. student Aroon Nataraj, Ph.D. student Shangkar Myangalam, Ph.D. student Brad Davidson, Systems administrator

SC’07: Performance Tools BOF 3TAU Performance System
TAU Parallel Performance System
http://tau.uoregon.edu/ Multi-level performance instrumentation
Multi-language automatic source instrumentation Flexible and configurable performance measurement Widely-ported parallel performance profiling system
Computer system architectures and operating systems Different programming languages and compilers
Support for multiple parallel programming paradigms Multi-threading, message passing, mixed-mode, hybrid
SC’07: Performance Tools BOF 4TAU Performance System
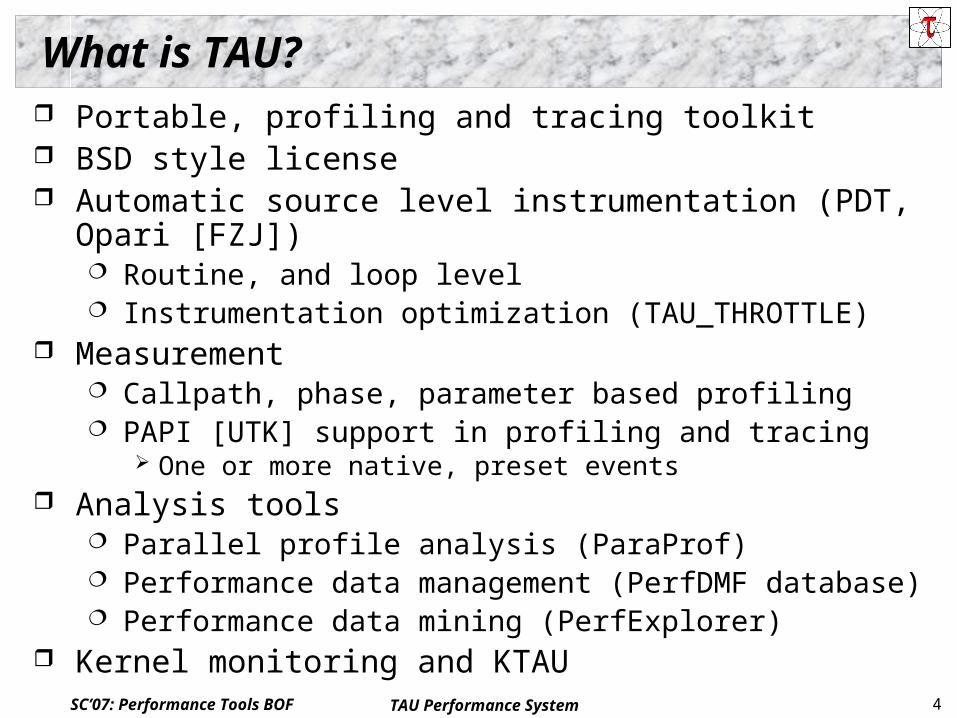
What is TAU? Portable, profiling and tracing toolkit BSD style license Automatic source level instrumentation (PDT, Opari [FZJ])
Routine, and loop level Instrumentation optimization (TAU_THROTTLE)
Measurement Callpath, phase, parameter based profiling PAPI [UTK] support in profiling and tracing
One or more native, preset events Analysis tools
Parallel profile analysis (ParaProf) Performance data management (PerfDMF database) Performance data mining (PerfExplorer)
Kernel monitoring and KTAU

SC’07: Performance Tools BOF 5TAU Performance System
What is new in TAU and PDT? TAU v 2.17 and PDT v 3.12 released at SC’07 [tau.uoregon.edu] Support for new platforms
IBM BG/P (Linux) SiCortex Cray XT (Compute Node Linux) Windows Cluster 2003
Improved support for VampirTrace [TU Dresden] for atomic events, native OTF generation
Automatic wrapper library generation (tau_wrap) for HDF5, I/O… Enhanced Eclipse/PTP plugin for tool interoperability PerfExplorer: Custom charts, multiple database support ParaProf supports multiple profile formats, databases
PERIXML, TAU, perfsuite, cube 2 & 3, mpiP, HPMtoolkit, gprof… Support for storing metadata in profiles, TAU portal, PerfDMF
PDT now supports type information in PDB files GFortran parser
SC’07: Performance Tools BOF 6TAU Performance System
TAU Demos at SC’07
ASC/NNSA Booth #1617, demo station #2 Wednesday (11/14):12-1pm, 3-5pm Thursday (11/15):10-11am Schedule available at tau.uoregon.edu
SiCortex Booth ANL Booth (KTAU presentation)
Thu. 12-1pm Paper:
“Ghost in the machine: Observing the Effects of Kernel Operation in Parallel Application Performance” A. Nataraj, A. Morris, A. Malony, M. Sottile, P. Beckman, SC’07 A2/A5 Wed. 10:30am

SC’07: Performance Tools BOF 7TAU Performance System
Future Research Directions Improving tool interoperability
OTF [TU Dresden] TotalView [Totalview Tech] Scalasca/KOJAK instrumentation [FZJ]
Hybrid sampling, instrumentation based measurements PerfSuite [NCSA]
Kernel measurements for tracking I/O using KTAU and ZeptoOS [ANL]
Binary rewriter integration using DyninstAPI [U. Maryland, U. Wisconsin]
Improvements in SiCortex integrated tool environment TAU Portal, regression testing
SC’07: Performance Tools BOF 8TAU Performance System
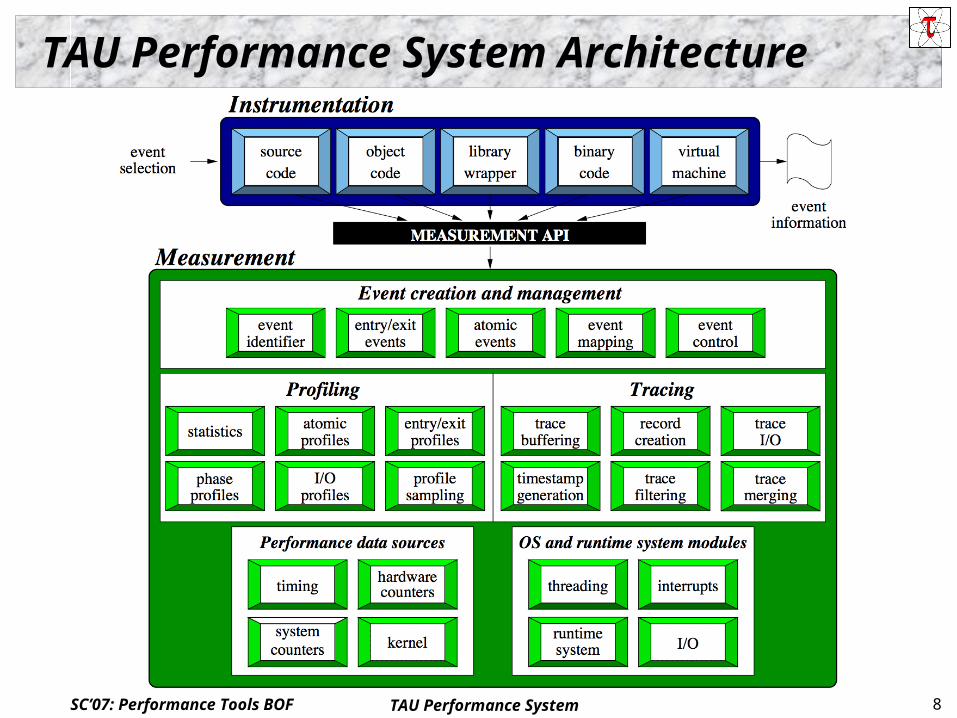
TAU Performance System Architecture

SC’07: Performance Tools BOF 9TAU Performance System
TAU Performance System Architecture
SC’07: Performance Tools BOF 10TAU Performance System
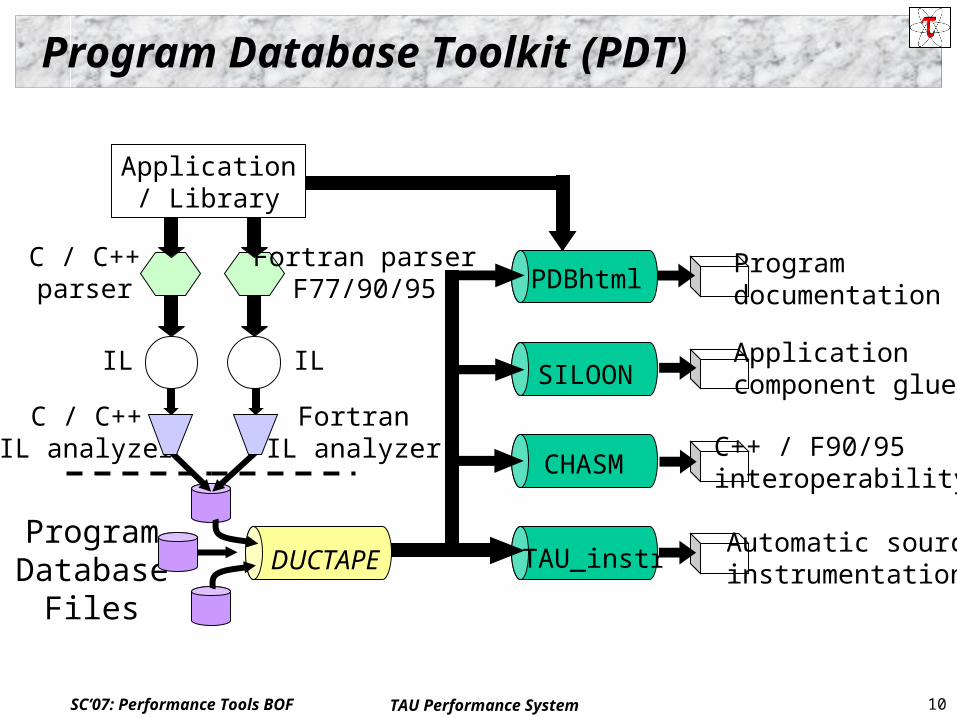
Program Database Toolkit (PDT)
Application/ Library
C / C++parser
Fortran parserF77/90/95
C / C++IL analyzer
FortranIL analyzer
ProgramDatabase
Files
IL IL
DUCTAPE
PDBhtml
SILOON
CHASM
TAU_instr
Programdocumentation
Applicationcomponent glue
C++ / F90/95interoperability
Automatic sourceinstrumentation
SC’07: Performance Tools BOF 11TAU Performance System
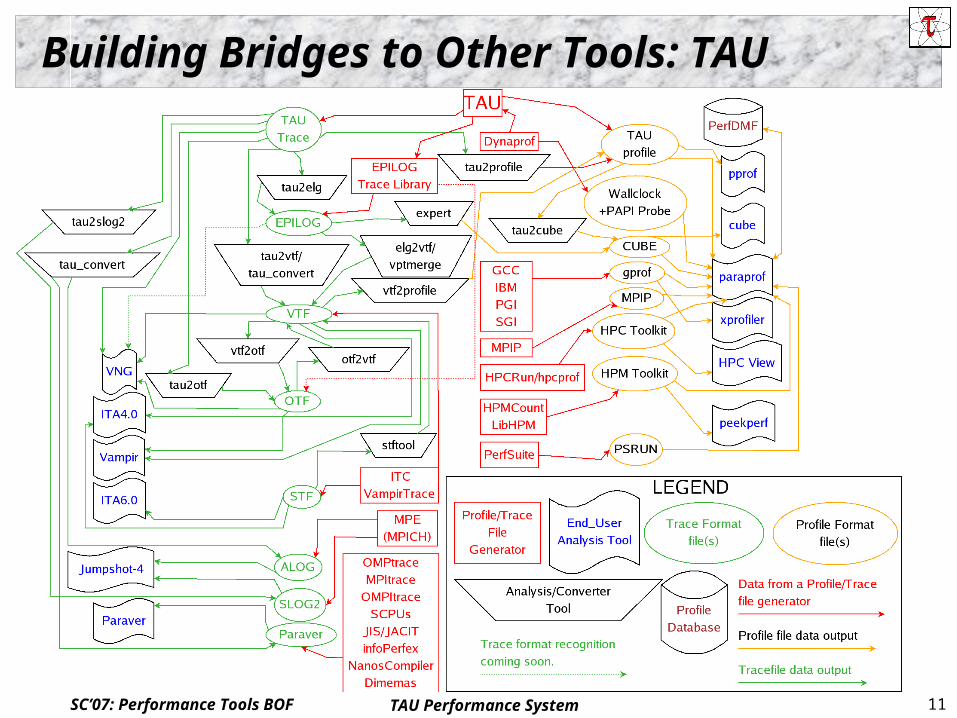
Building Bridges to Other Tools: TAU

SC’07: Performance Tools BOF 12TAU Performance System
Using TAU: A brief Introduction To instrument source code using PDT
Choose an appropriate TAU stub makefile in <arch>/lib:% setenv TAU_MAKEFILE
/usr/tau-2.17/x86_64/lib/Makefile.tau-mpi-pdt-pgi% setenv TAU_OPTIONS ‘-optVerbose …’ (see tau_compiler.sh)And use tau_f90.sh, tau_cxx.sh or tau_cc.sh as Fortran, C++ or C
compilers:% mpif90 foo.f90 changes to % tau_f90.sh foo.f90
Execute application and analyze performance data:% pprof (for text based profile display)% paraprof (for GUI)

SC’07: Performance Tools BOF 13TAU Performance System
TAU’s ParaProf Profile Browser: Manager
Multiple PerfDMF databasesApplication Metadata

SC’07: Performance Tools BOF 14TAU Performance System
TAU’s ParaProf Scalable Profile BrowserS3D: 6400 cores on XT3+XT4 System (Jaguar)
Gap represents XT3 nodes

SC’07: Performance Tools BOF 15TAU Performance System
6400 cores
S3D Scatter Plot: Visualizing Hybrid XT3+XT4
Red nodes are XT4, blue are XT3
SC’07: Performance Tools BOF 16TAU Performance System
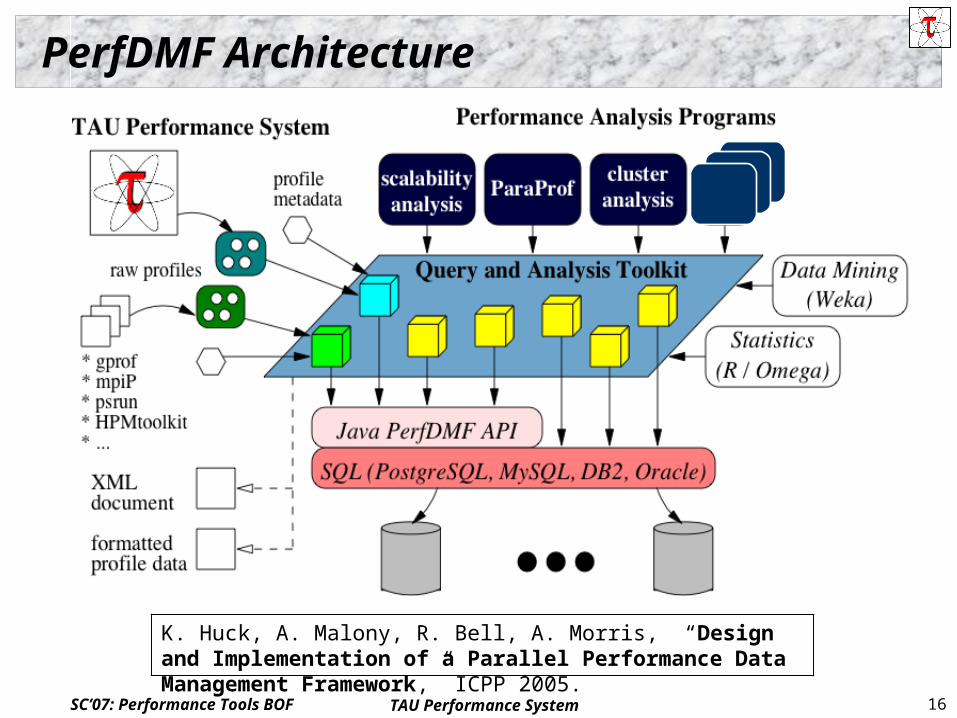
PerfDMF Architecture
K. Huck, A. Malony, R. Bell, A. Morris, “Design and Implementation of a Parallel Performance Data Management Framework,” ICPP 2005.

SC’07: Performance Tools BOF 17TAU Performance System
TAU Portal: Launch ParaProf/PerfExplorer

SC’07: Performance Tools BOF 18TAU Performance System
PerfExplorer: Regression Testing

SC’07: Performance Tools BOF 19TAU Performance System
PerfExplorer: S3D Total Runtime Breakdown
MPI_Wait
WRITE_SAVEFILE
12,000 cores!

SC’07: Performance Tools BOF 20TAU Performance System
TAU in Eclipse/PTP Environment

SC’07: Performance Tools BOF 21TAU Performance System
Support Acknowledgements US Department of Energy (DOE)
Office of Science MICS, Argonne National Lab
ASC/NNSA University of Utah ASC/NNSA Level 1 ASC/NNSA, Lawrence Livermore National Lab
US Department of Defense (DoD) NSF HEC-RTF and SDCI Research Centre Juelich TU Dresden Los Alamos National Laboratory ParaTools, Inc. PSC, NCSA, and U. Oregon