roles of agriculture case study chile alberto valdés and william foster 20 october 2003
TRANSCRIPT

Roles of AgricultureCase study Chile
Alberto Valdés and William Foster
20 October 2003

Why Chile?• Middle income country – open economy
• Importer and exporter of food and ag. products.
• Food imports: basic commodities
• Exports: fresh fruits and vegetables, seeds, processed products, others
• Agriculture shown clear economic success
• Dynamic sectors and traditional sectors
• Range of temperate agricultural zones
• Range of sector’s effects on rural communities
• Good data – household surveys since 1987

Strongest result of case study
• Agriculture contributes to poverty reduction,
• more so than other sectors.
• Output mix – greater export orientation –particularly important effect– increasing employment and household income,– lowering rural-urban migration– reducing the intensity of agro-chemical use.

Roles mediated by policy
• Overall policy strategy pushed export-oriented sector growth
• modernization of import-competing sectors.• But positive externalities linked to export
sector rather than to agriculture as a whole.• Change in output mix toward exports
largely induced by the economic policy reforms since the mid-1970s
• trade liberalization, deregulation and privatization
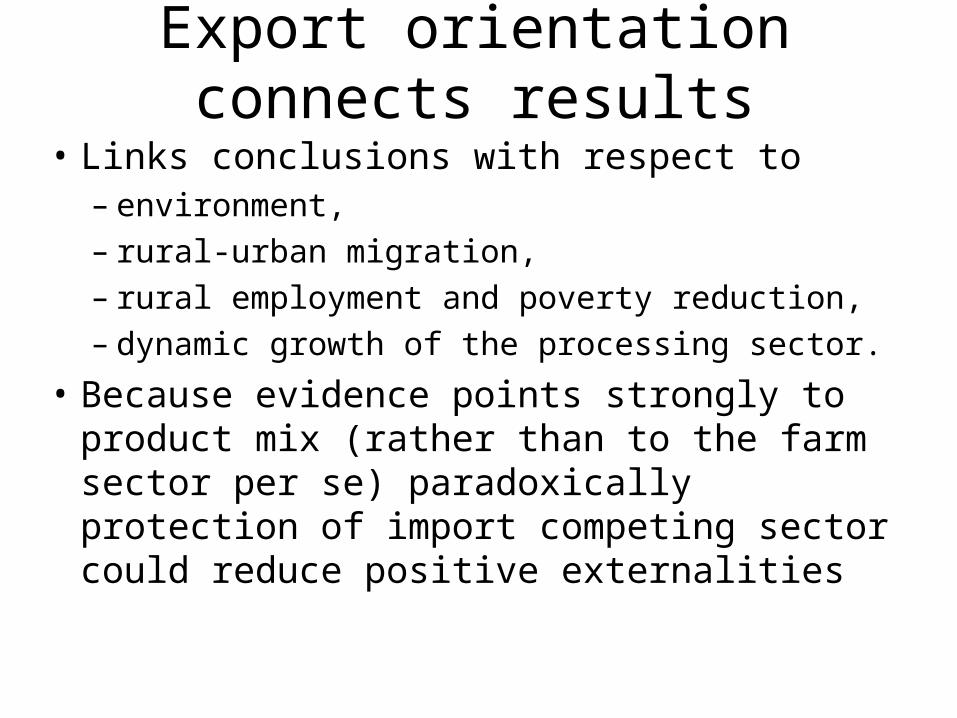
Export orientation connects results
• Links conclusions with respect to – environment, – rural-urban migration, – rural employment and poverty reduction, – dynamic growth of the processing sector.
• Because evidence points strongly to product mix (rather than to the farm sector per se) paradoxically protection of import competing sector could reduce positive externalities

Caveat to this output-mix message
• Certain sub-sectors have had difficulties in adapting to the open-market policy regime.
• Threat to the loss of culture and community memory related to production in certain activities,
• especially associated with small-scale farming

From a broader perspective:
Moral of the story• Our subjective view: Chile should examine urban bias
– in policies and institutions, – in infrastructure – availability of social services.
• Bias would reduce attractiveness of working and living in rural areas, and the development of modern agriculture,
• which in turn reduces the sector’s contribution to national development.
• We would bet: as Chile more urbanized, people place greater value on natural-resource based amenities and related attributes that contribute to regional, non-urban quality of life.
• Challenge for future research: contingent valuation.

Poverty alleviation – quantitative assessment
• Three ways agricultural growth affects poverty:– Labor income of unskilled workers (ag uses
more)– Poor farmers’ income, – Real food prices (mainly non-tradable).
• Econometric estimates
• Simulated impacts of changes in these three factors on the extent and depth of poverty

Table 3. Evolution of GDP and Poverty in Chile, 1987 to 2000 87/90 90/92 92/94 94/96 96/98 98/2000
Per Capita GDP Growth 5.4 8.3 4.6 7.4 4.2 0.8
Agricultural Per Capita GDP Growth
7.3 4.5 2.7 1.7 -0.1 0.7
Agriculture + Food Processing Per Capita GDP Growth
5.7 6.8 3.3 3.2 -0.4 N/A
1987 1990 1992 1994 1996 1998 2000
National poverty, head count – FGT(0) 46.08 38.46 32.43 27.4 23.13 21.62 20.58
Rural poverty, head count – FGT(0) 53.47 39.37 33.37 30.8 30.57 27.57 23.82
% of rural population below poverty line 19.47 18.55 18.04 16.54 16.12 14.57 14.14

Table 5. Consolidated effects of agricultural growth on poverty headcount declines
Effect of 4.5% increase in agricultural GDP,
Consolidated wage,
employment and price effects
Upper Bound
Lower Bound
elasticity of poverty
reduction w.r.t. ag. growth*
holding non-agricultural GDP constant -9.4% -11% -7.8% 1.8 to 2.4 holding national GDP constant thus changing composition of output
-8.8% -9.9% -6.7% 1.5 to 2.2
*Elasticities normally found for aggregate growth in Chile are in the order of 0.8 to 1.2.
Agricultural growth has more impact on poverty alleviation through its greater emphasis on the employment of unskilled labor.
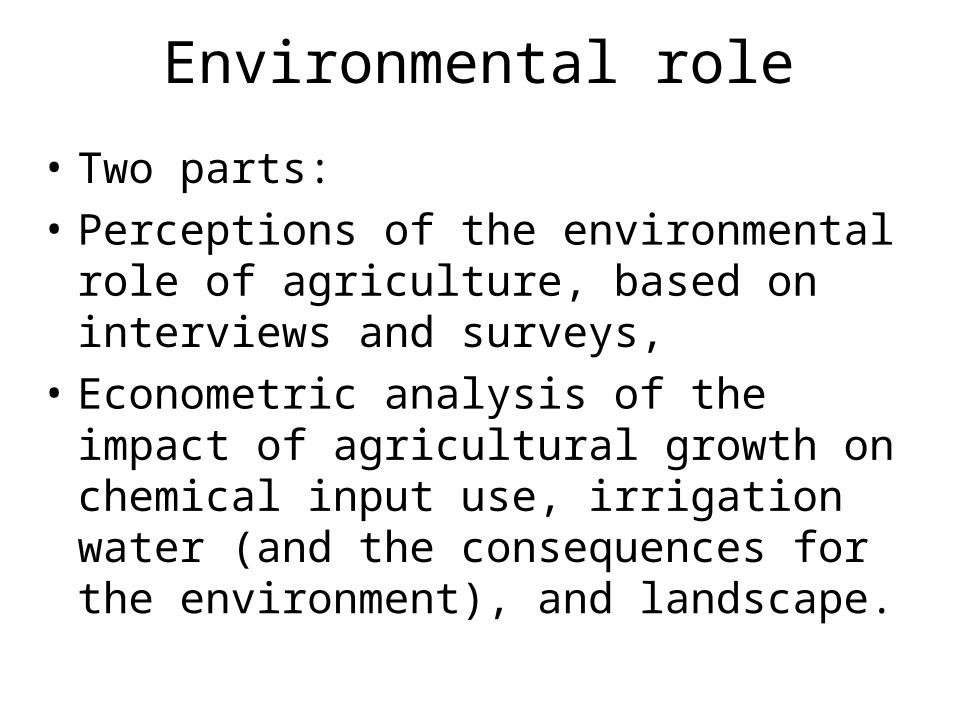
Environmental role
• Two parts:
• Perceptions of the environmental role of agriculture, based on interviews and surveys,
• Econometric analysis of the impact of agricultural growth on chemical input use, irrigation water (and the consequences for the environment), and landscape.

Environment: quantitative analysis
• Increasing demand for chemical inputs by sector
• Pesticide fastest growing (100% over the 1990-2000)
• Demand for imported and domestic fertilizers increased 50% over the same period.
• Ag output increased by about 50%.

Consumption of Agrochemicals
95
115
135
155
175
195
215
235
1990 1992 1994 1996 1998 2000
Year
Imported Fertilizers
Biocides
Domestic Nitrates
Chemical Intensity per Unit of Agricultural GDP

Methodology
• Econometric analysis of input demands response given structural changes in output mix and scale.
• Controls for factor-price induced changes in chemical use,
• Question: Is agricultural growth inherently chemical intensive,
• or is fast growth of chemical use in the 1990s largely explained by input price changes?

Important conclusion
• Increase principally due to price effects rather than output expansion effects.
• Changes in output scale explain less than a quarter of the total increase of pesticides and nitrates.
• Output mix changes, from import competing to exports, has lessened negative environmental externalities of the sector.
• While chemical use and intensity per unit of ag GDP has increased, increases are less than they would have been in the case of a similar expansion led by import-competing (traditional) crops.

Example: pesticides
• Nominal pesticide prices (1990-2000) increased by 70%, nominal wages by 300% , fertilizer prices by 130%.
• Given the estimated high price elasticity of pesticide demand, relative price changes explain almost 70% of the increase in pesticide use.
• By contrast, the role of increased agricultural output on pesticide demand is more modest, although pesticide demand appears highly responsive to increases in traditional agricultural output.

Table 6. Elasticities of agricultural chemical input demands with respect to exportable and non-exportable agricultural output and own prices Exportable
Output Non-Exportable
Output Own-price
Domestic Fertilizers 0.160 0.455 -0.636 Pesticides 0.247 1.007 -0.955 Imported Fertilizers 0.992 0.654 -0.080
Simulations

Change in output mix towards more exports reduces chemical use.
• Import-competing agriculture more dependent on the use of pesticide than export-oriented agriculture.
• Neutral expansion of agriculture of 4% likely to increase pesticide use by about 2.8%
• Change in output composition towards exportables would reduce pesticides.
• Between 1990 and 2000 exportables expanded twice as fast as traditional. Had both sectors expanded at the same rate (keeping the total rate constant), pesticide use would have risen by 130% instead of by an observed 100%.
• 60% of this actual increase can be attributable to export crops, because the export sector grew twice as fast.

Inter-Sectoral Linkages
and the Buffer Role of Agriculture • General equilibrium approach based on the ECOGEM-
Chile model (O’Ryan, Miller, de Miguel)
• Sectoral linkages measured by domestic ag’s contribution to the value added of other sectors.
• Important result: the sector plays buffer role when negative external shocks affect the economy,
• by absorbing part of wage loss labor displaced from other sectors.
• In elasticity terms ag absorbs 4 times the labor absorbed by commerce and services, twice that of industry.
• Simulated subsidy to ag sector generates greater increases poorer households’ incomes than richest. (again labor employment effects).

Income Deciles (real income)
Agriculture Agro-Industry Industry
1 (poorest) 4,3% 3,1% 2,0% 2 4,3% 3,0% 2,0% 3 4,2% 2,9% 2,1% 4 4,1% 2,9% 2,1% 5 3,9% 2,8% 2,1% 6 3,6% 2,7% 2,0% 7 3,5% 2,6% 2,1% 8 3,2% 2,5% 2,1% 9 2,7% 2,3% 2,1%
10 (richest) 2,2% 2,3% 2,0% REAL GDP 0,6% 0,3% 0,4%
Table 7: Impact on Real Income of subsidizing each sector, CGE simulations

Growth of Agriculture and the Rest of the Econom y
-0.2
-0.15
-0.1
-0.05
0
0.05
0.1
0.15
0.2
0.25
0.3
Year
Agriculture Rest of the Economy
Counter-cyclical growthCrisis, ag declines less than other sectors

Agriculture as Share of GDP
0.00
0.02
0.04
0.06
0.08
0.10
0.12
Year
Agro-Livestock Agro-Industry Total Agriculture
Sources: Calculated using information from Banco Central de Chile, INE, INFOR, 1986 base.

Highlights of linkages
• Agro-livestock sector, accounting for linkages, covers around one tenth of national output.
• The backward linkages are not very important.• The agro-industries are the main forward linkages
of the agro-livestock sector.• Agro-industries have grown at same rate as
Chilean economy, represent increasing share of industrial output.
• The primary agro-livestock sector grew slower than the economy over the 1990’s. (Faster now.)
• Agriculture appears to be a stabilizing sector in the economy, consistent with the CGE results.

Social viability of agriculture role has several dimensions
• Agriculture as a profitable activity in a rural setting (linkages) and its effects on migration. Most important. People vote with their feet.
• Agricultural as safety net activity for rural population.• Agriculture as a buffer (remittances and employment)
during crisis.• Agriculture as limiting “excessively” rapid migration.
Important concern of policy makers in Latin America.• Impact of policies and institutions.• Spatial distribution of the population. Sometimes a
strategic objective.

Migration determinants
• Assumes symmetry: the conditions that discourage out-migration are the same as those that promote in-migration.
• Main determinants are:– Community characteristics:
• Economic (income opportunities, unemployment)
• Community amenities (proxied by size of population and other infrastructure indicators).
– Population characteristics: • education, age, gender

Conclusions regarding migration• Controlling for income levels, primary and secondary
employment contribute to reduced out migration.• More agriculture employment reduces future out
migration, but more secondary sector employment reduces it even more.
• Part of the secondary is agro-processing, which is usually dependent on agricultural production (but not for pork and poultry, heavily dependent on imported grains).
• Expansion of export agriculture (fruit production) is better correlated with lower migration.
• Some of the migration-influencing factors picked up by the secondary employment variable.
• Possible location effect explanation: relatively higher processing employment in 1992 is located in comunas which had the potential for expansion of export crops.

Culture• Two questions: • What are the perceptions of rural and urban people today
regarding what the value of agriculture for the country generally?
• What is the prospect for making the best use of the productive culture – the know-how and human capital – still embedded in the small-scale farming sector during the ongoing process of structural transformation?
• Presumption: Centuries old know-how and productive knowledge of small producers is something that society should value as elements key in providing diversity in employment, income, and traditions, and in maintaining territorial occupation low population densities in vast areas.

Focus group views, within the sector:• “Those of us that are involved in agriculture have a certain
bias regarding our own importance. But if one asks anyone on the Santiago streets, what does agriculture mean to them?, the answer will, most probably be, nothing! That’s a fact of life we must learn to live with. For the people of Santiago the agricultural sector doesn’t mean anything!”
• “During recent years agriculture has only been valued for its economic contribution. When one takes such a perspective, the capacity to value different agrarian systems is lost … One feels that we are loosing the various cultures which exist across the country, even though one recognizes that it is precisely that wherein lies the richness of the country and characterizes the nation.”
• Do people react to the activity, or to the existences of small farmers? Is it a landscape effect?

• Human capital is being lost? (It is also being created.)• Analysis suggests that, particularly among small scale
producers, there is a perception of crisis, an inability to sustain themselves in an environment of an open economy with relatively low levels of subsidies.
• Agrarian leaders perceive that agriculture still plays today a key and almost unique role in maintaining a national identity.
• Agriculture supports a dispersed population of small producers, rural workers and entrepreneurs who act as the country’s “territorial guardians.” The physical occupation by humans of wide geographic areas is made possible by agricultural activities.

Some conclusions, recommendations and a few
opinions
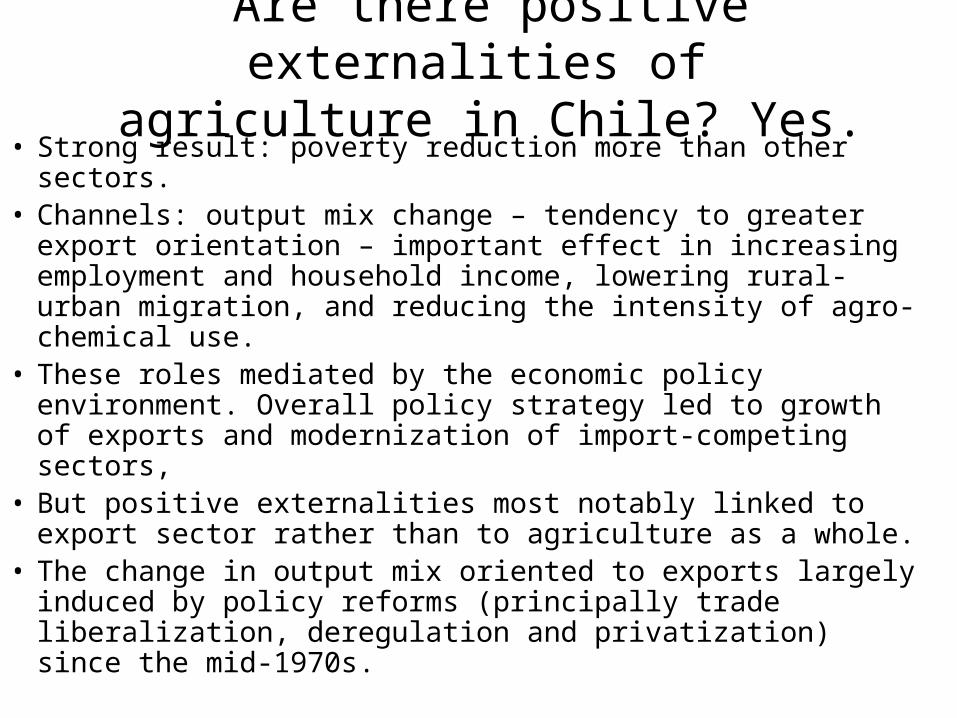
Are there positive externalities of agriculture in Chile? Yes.
• Strong result: poverty reduction more than other sectors. • Channels: output mix change – tendency to greater export
orientation – important effect in increasing employment and household income, lowering rural-urban migration, and reducing the intensity of agro-chemical use.
• These roles mediated by the economic policy environment. Overall policy strategy led to growth of exports and modernization of import-competing sectors,
• But positive externalities most notably linked to export sector rather than to agriculture as a whole.
• The change in output mix oriented to exports largely induced by policy reforms (principally trade liberalization, deregulation and privatization) since the mid-1970s.

Should there be more protection to agriculture? No.
• Most of the current protection of agriculture in Chile is the result of border, trade-related measures.
• Such protection can only benefit the import-competing sector.
• Represents an implicit tax on the production of exportables, which appears to be the sector generating most of the positive externalities.
• Should there be less protection? There is not much now beyond sugar.

Findings point to broader concern in Chile, beyond study of individual modules.
• Is there a significant urban bias in policies and institutional framework? In our view, probably yes.
• Urban bias, (investments in infrastructure, education, health public expenditure), reduces attractiveness of living and working in rural areas,
• Inhibits development of modern agriculture. • In turn reduces sector’s contribution to the national
economy through the positive externalities.• Benefits of agglomeration, but we believe that rural areas
are probably underdeveloped relative to their potential contributions in Chile. Poverty, landscape, local vitality.
• Urban bias needs more study.

As Chile becomes more urban….
• Amenities and resources become more valuable– open space,
– natural amenities,
– small town values
• Increasingly, in our view, Chileans are placing greater value on natural-resource based amenities and related attributes that contribute to regional, non-urban quality of life.
• Part (not all) of these benefits, are associated with agriculture, together with tourism, forestry and fishing, which provide an economic base for a more decentralized spatial distribution of persons and activities.

Taking better advantage of such externalities
• involves design of institutional arrangements – more rather than less decentralization
• For greater equality of opportunities between urban and rural sectors.
• Reduction in the imbalance between large cities in terms of quality of life – income potential, amenities, and infrastructure – would induce greater activity in agriculture.
• The emphasis on export-oriented agriculture would have a greater impact on employment.

This is not to argue for an even distribution of infrastructure in all geographic areas.
• A rural renaissance would necessarily be geographically uneven.
• Given budget constraints, differing regional conditions and the diminishing returns to investments, one cannot insist on good infrastructure everywhere.
• Some regions are remote, with low population density, and with little likelihood of achieving sufficiently high and sustainable productivity of resource extraction or use.
• For these areas, policies ought to been aimed at improving labor mobility (implying attention to the education of the young) and providing safety nets for those who are relatively immobile and unlikely to migrate.

Annex

Policies Poverty alleviation
Environ-mental
amenities
Rural sustainability
Agriculture as a buffer
Culture
General reforms began mid 1970s
++ – + 0 0?
General market access policies
++ – + 0 0?
Removal of state trading
+ 0 0 0 0
Export promotion 0 0 0 0 0Infrastructure ++ + ++ + +Sanitary and
phyto+ 0? 0 0 0
Technical and training assistance
+? 0 + 0 +
Assistance for Adjustment
+ 0 + 0 0?
Effect Strongly + Mildly + Neutral Mildly - Strongly -
Code ++ + 0 – – –

• Mostly neutral effects across the modules, except poverty alleviation and rural sustainability.
• These are indirect effects of a general market-oriented policies.
• The general policy framework had growth in mind.• With growth came a change in the mix of products and the
rise of agro-processing in some regions.• Some regions gained but others lost in terms of rural
employment.• Poverty and rural economic activity were the result of – but
not the direct intention of – such policies.• But we want growth so as to raise incomes and thus reduce
poverty.• Altered mix of products effected environmental impacts.

The most influential: general trade and economic policies
• Affected general and sectoral growth.• Produced changes in the output mix, from traditional
crops to export-oriented crops.• Altered regional production patterns.• Made agriculture more labor intensive via exports.• Increased labor demand of agro-industry, thus affecting
rural economy.• Lopez: increased the use of inputs generally and agro-
chemicals specifically, but the output mix was important for slowing down use relative to neutral growth (exports vs. import-competing).

0.90
1.00
1.10
1.20
1.30
1.40
1.50
1.60
1.70
1.80
1960 1965 1970 1975 1980 1985 1990 1995 2000
Irrigation Index Labor Index Tractors Index Livestock Index
Agricultural factor use through time

CHILE
1.00
2.00
3.00
4.00
5.00
6.00
7.00
8.00
9.00
10.00
11.00
1960 1965 1970 1975 1980 1985 1990 1995 2000
Fertilizer Index
Fertilizer use through time

CHILE: Labor Productivity, Value Added per Worker
2000
2500
3000
3500
4000
4500
5000
1960 1965 1970 1975 1980 1985 1990 1995 2000

Environment: Survey of perceptions
• Two regions: IV and VII
• Agriculture and agro-industry relatively labor intensive (compared to regions producing traditional crops)
• Important in regional employment.
• Delphi method – feedback as survey proceeds

Perceptions of ag. economy
• Main factors linked to improved expectations for ag. sector found in opening Chilean economy:
• Respondents stressed more competitive environment in markets, technical change, and in particular the spread of sophisticated irrigation.

Regional differences in perceptionsof ag. economy
• Open economy more important in VII
• Greater emphasis on irrigation in IV
• Notable low weight given to ag-specific policies in both regions

Perceptions of environment
• Perceived importance of soil quality, agro- and eco-tourism on the positive side, and biodiversity, odors and workers’ exposure to chemicals, on the negative side.
• Region IV: 13 positive externalities perceived by majority to have increased. only 10 negative ones.
• Region VII: only 11 positive externalities perceived to have increased, 27 of the 30 negative externalities were considered present.
• Notable: in arid Region IV, ag. intensification has neither affected the quality nor supply of irrigation water
• Region VII, less dependent on irrigation, perception is adverse effects of intensification on water supply.

• Results support notion that land use intensity is related to the environmental implications of agricultural growth.
• VII Region: water pollution has increased and biodiversity declined.
• Landscapes are perceived to have improved in both regions,
• but there appears greater consensus for Region IV.• Consensus of future of agriculture and the environment:
main positive externalities are likely to be in the areas of healthier processes and tourism.
• Trade agreements: greater incentives to invest in a more environmentally friendly agriculture.

Agro-Livestock Value of Value of 1986 Value Added Forward Links Backward Links Total
Million Ch$ 227,298 67,329 21,452 316,079 Share of GDP 0.0749 0.0222 0.0071 0.1042
1996 Million Ch$ 1,086,920 611,113 160,575 1,858,608 Share of GDP 0.0372 0.0209 0.0055 0.0635

Tij
Tiji
X
X
T Nij ij
T Tij iji
X X
X X
Agro-
Industry
Sector
Ag.-Liv. Inputs/Total
Inputs
Nat. Ag.-Liv. Inputs/Total
Inputs 1 Slaughtering, preparing and preserving meat 0.7357 0.7357 2 Sugar factories and refineries 0.7211 0.7106 1 Canning and preserving of fruits and vegetables 0.4563 0.4395 1 Manufacture of dairy products 0.4360 0.4349 2 Grain mill products 0.7366 0.4150 1 Distilling, rectifying and blending spirits 0.3591 0.3589 1 Wine industries 0.2786 0.2784 1 Manufacture of prepared animal feeds 0.3436 0.1762 1 Tobacco manufactures 0.1599 0.1599
Restaurants 0.1299 0.1171 2 Malt liquors and malt 0.1414 0.0632
Hotels 0.0617 0.0608 Public Schools 0.0621 0.0574
2 Manufacture of vegetable and animal oils and fats 0.0548 0.0548
Main Forward Linkages 1996
Columns show shares of total input costs. A 1 indicates industries that can be safely added to broadly defined agro-livestock sector GDP because they use mainly agricultural inputs and those inputs are mainly national. A 2 indicates hesitation.

Agriculture includes all crops, livestock and forestry, base year 1986.
Share relatively stable
Share declining
Counter cyclical, discussed in Buffer
New I-O matrix. Figures based on 1986 matrix.

Énfasis en migración a nivel de comuna
• Se estimaron tasas de migración implícitas al nivel del municipio:– Migración medida como cambios en población
observados ajustados por– tasas de nacimiento y mortalidad de los anuarios
demográficos.– Fuente: censo población 1992 y 2002
0
11
1t
0
10
P
PP̂m
P̂g1P
P̂DBP
Población sin migración.
Tasa de migración estimada.

Net Emmigration Rates (1992 - 2002)
V
Quilicura
Puente Alto
VII XIXVIIIVIIV
Los SaucesSan RosendoContulmo
El Quisco
Andacollo Recoleta
Calera de TangoLa Estrella
Maipú
RM
-2
-1.5
-1
-0.5
0
0.5
N S
Widespread urbanization projects have promoted residential mobility. Raises the question of where one works and where one lives.
An initial look at the data for the IV to X Regions. Some interesting outliers.
Algarrobo
Curico
Pucón/Villarica Chiloé
Greater Santiago
La Serena/Coquimbo

Conclusions regarding migration
• Evidence of residential mobility around largest cities. Not immigration for occupation.
• Rural municipalities have higher net outflow of population than non-rural.
• Robust result: in base year, higher proportion of women is related to a reduction of outflow. Likely related to age distribution (older women and mothers stay); a reduced pool of potential migrants in base year.