snow water equivalent snow cover runoff modeling lecture 6 by ahmet emre tekeli february 19, 2009
TRANSCRIPT
Snow Water EquivalentSnow Cover
Runoff Modeling
Lecture 6
By Ahmet Emre TEKELI
February 19, 2009

Snow Cover, SWE and Runoff Modeling
• Introduction
• Snow Water Equivalent (SWE)
• Remote Sensing in Hydrological modeling (snow dominated)
• Components of Snowmelt modeling
• Snowmelt Runoff Model (SRM)
Introduction
• Microwave radiation emitted from ground, scattered in many directions by the snow grains within the snowpack.
• Mw emission @ snowpack surface < ground.
• Factors; snowpack depth & water equivalent, liquid water content, density, grain size and shape, temperature, stratification, snow state, land cover.

Introduction
snow extent, snow depth
snow water equivalentsnow state (wet/dry)
Mw sensitive to snow layer
Can be derived
Introduction
Snow Water Equivalent (SWE)
• A common snowpack measurement instead of depth.
• Indicates the amount of water contained within the snowpack.
• Thought as the depth of water that would theoretically result if the entire snowpack melted instantaneously.
• SWE= Snow Depth (SD) x Snow Density

Snow Water Equivalent (SWE)
• Same depth yields different SWE due to density.• SD= 120” density 10%• SWE=120 * 0.1= 12’’• SD= 120” density 40%• SWE=120 * 0.4= 48’’• The density of new snow ranges from about 5% @ Tair
14° F, to about 20% @ Tair 32° F.• After the snow falls its density increases due to
gravitational settling, wind packing, melting and recrystallization.
• Typical values of snow density are 10-20% in the winter and 20-40% in the spring.
Snow Water Equivalent (SWE)
• Same depth yields different SWE due to density.
Snow Water Equivalent (SWE)
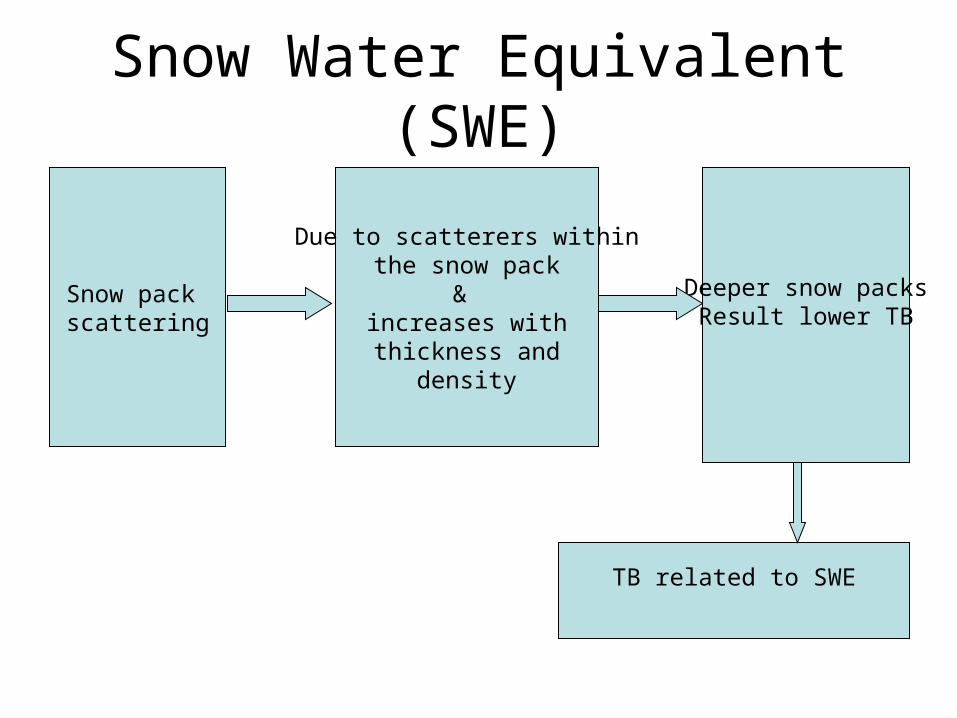
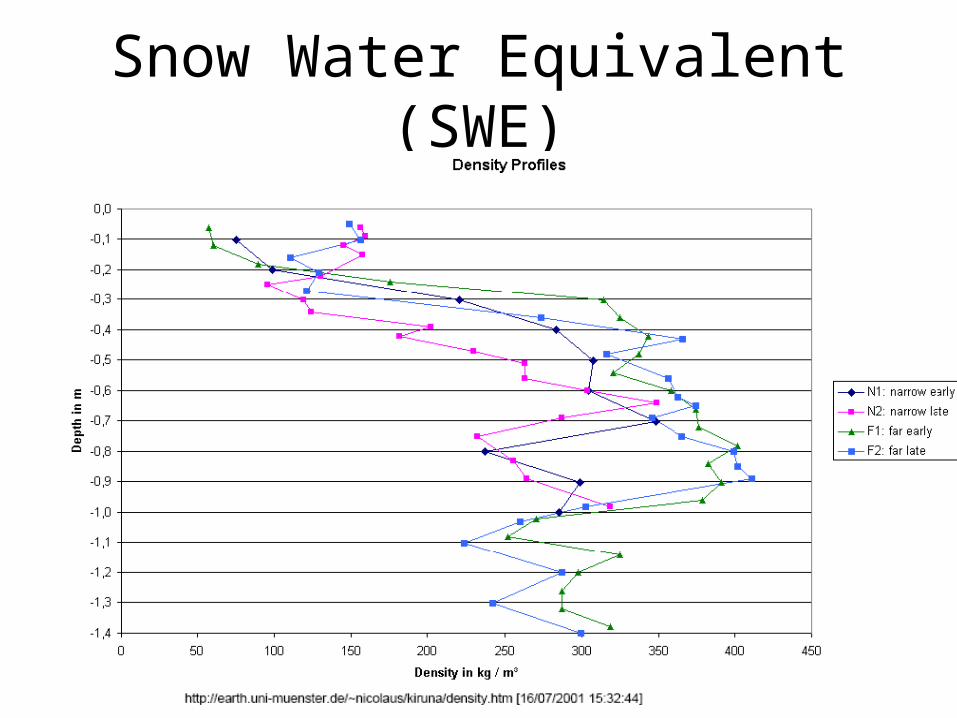
Snow Water Equivalent (SWE)
Due to scatterers withinthe snow pack
& increases withthickness and
density
Snow pack scattering
Deeper snow packsResult lower TB
TB related to SWE

Snow Water Equivalent (SWE)
Where,• f1 low scattering channel (commonly 18/19 GHz)• f2 high scattering channel (commonly 37 GHz)• A, B offset and slope of the regression • The coefficients should be determined for
different climate and land cover conditions. • Thus, no single global algorithm can estimate
snow depth and/or SWE under all snowpack and land cover conditions.
TB related to SWE SWE = A+ B [ΔTB(f1,f2) ]
Snow Water Equivalent (SWE)
• Water presence, alters the emissivity of snow, and results higher brightness temperatures
• For accurate SWE, snow should be in dry conditions. Thus, prefer early morning passes (local time)
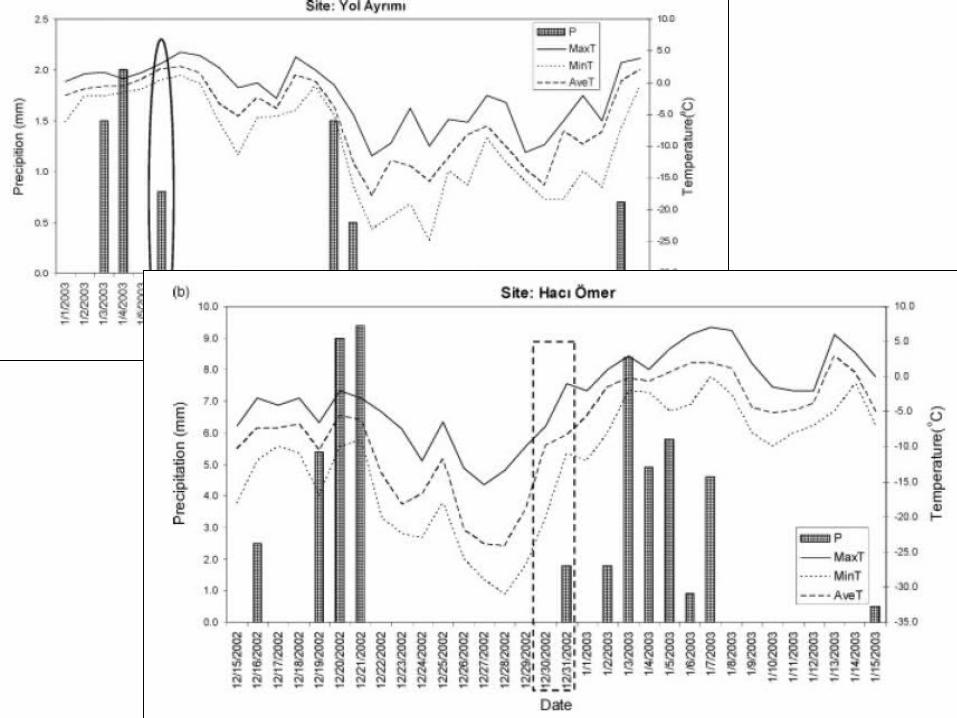

Snow Water Equivalent (SWE)
• Depth hoar formation in bottom of the snowpack (mainly in cold regions), will increase the scattering and reduce surface emission, resulting an overestimation of snow depth and SWE.

Snow Water Equivalent (SWE)

Snow Water Equivalent (SWE)• Snow pack changes in time, seasonal aging or
metamorphism changes microwave emission of snow.
• To account for seasonal variability of mw emission from snow, they should be compiled for entire season, over several years.

Snow Water Equivalent (SWE)
Snow Water Equivalent (SWE)
• WHY?
• SWE provides important information for water resources management and is a major research topic in RS assessment of snow cover and melt.

RS HYDROLOGY
• Runoff at the outlet of the watershed is an integrated result of the spatially varying sub-parts of the whole basin
• Similarity is a serious problem in basins with pronounced topography, because of the high spatial variability of hydrometeorological parameters in these regions.
• Hard/impossible to handle with classical terms• Increase in satellite platforms and improvements in the
data transmission and processing algorithms, remote sensing (RS) enables to handle these spatial variations.
• RS is gaining importance in distributed watershed modeling by its spatial variation handling capacity.
RS HYDROLOGY
• The advances in RS and GIS enable new data to scientific community. New data necessitate improvements in hydrological modeling rather than using the conventional methods.
• “Existing models are designed for a limited number of types of input and may need to be made more flexible to make optimum use of the range of possible inputs.” (Hydalp,2000)
• New models would enable new input from RS & GIS and provide better hydrological outputs, enabling the understanding of the complex world.
• Thus, there will be mutual developments between RS, GIS and hydrological modeling, leading improvements in the other ones.

RS HYDROLOGY
• However, there has always been, a trade off between the scientific complexity and practical applicability
• The frontiers of snowmelt modelers, Vivan 1979 , developed regression equations. These equations worked well under the circumstances similar to in which the model is developed. However, in new situations, the model may not be dependable.
• On the other extreme, a fully developed model in which all the temporal and spatial variable parameters are handled may demand large data amounts. Difficult to calibrate the parameters and hard to understand the physical background by end users and difficult to get the input variables.
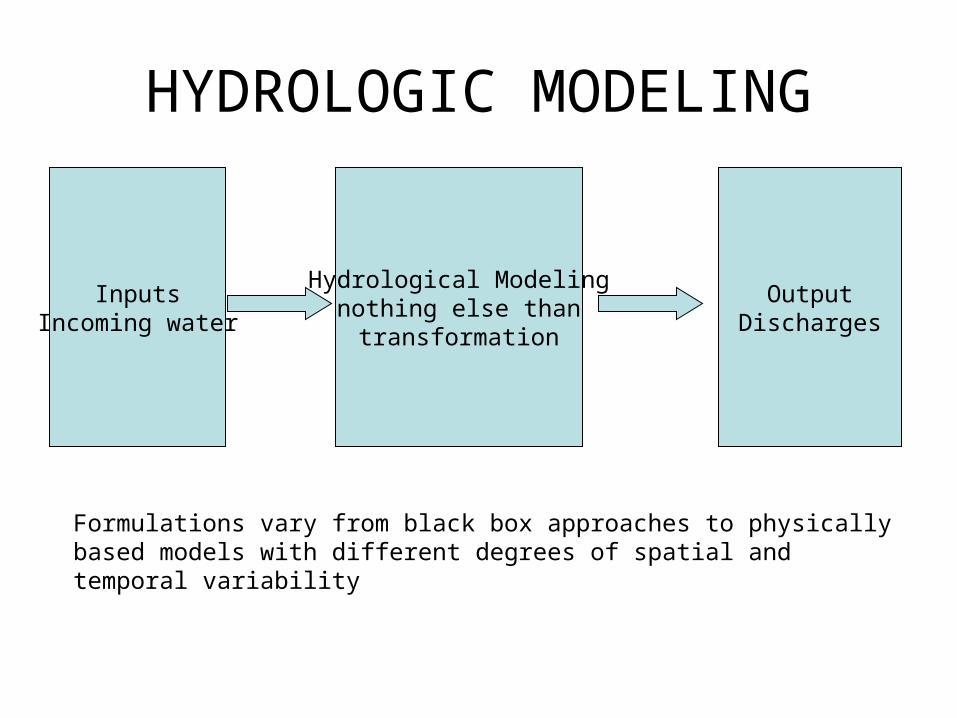
HYDROLOGIC MODELING
Hydrological Modelingnothing else than
transformation
InputsIncoming water
OutputDischarges
Formulations vary from black box approaches to physically based models with different degrees of spatial and temporal variability

HYDROLOGIC MODELING
• Formulations may depend to the type of the precipitation i.e. on rainfall (liquid) or snowfall (solid).
• When precipitation occurs as snowfall, the discharge timing is not only a function of precipitation timing, but also the heat supplied to the snowpack either by temperature or by radiation.

HYDROLOGIC MODELING
In either forms, the total runoff volume is stilltotal precipitation minus
losses;however, snowfall is stored in
snowpack until warmer weather allows the phase change from snow/ice to liquid (i.e. melting).

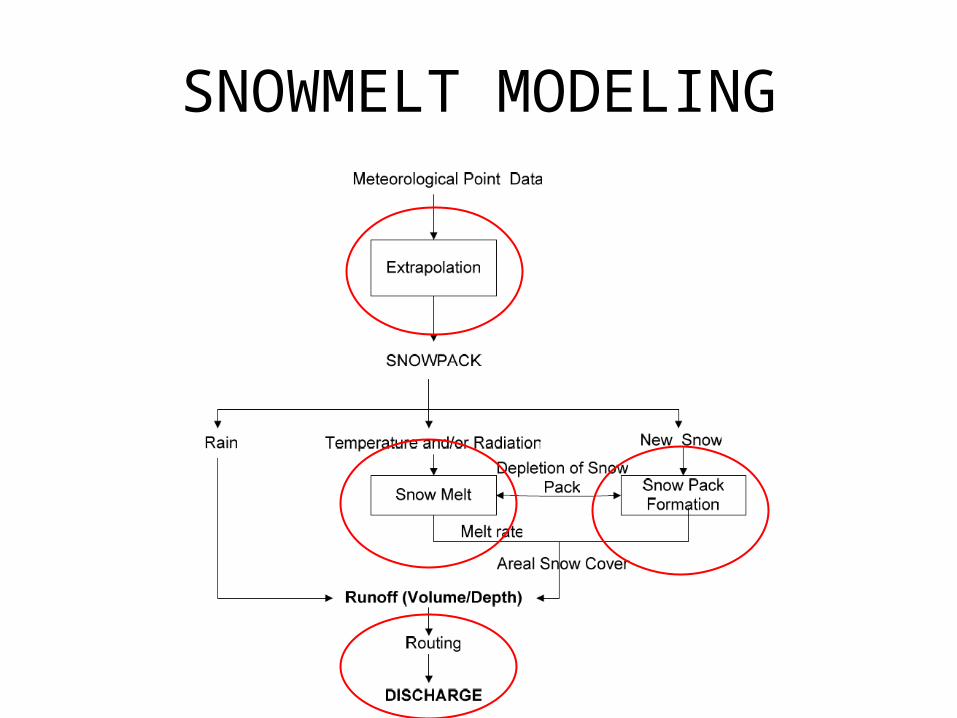
SNOWMELT MODELING
Snowmelt runoff modeling has four main components;
1. Extrapolation of meteorological data
2. Point melt rate calculations
3. Integration of melt water over the snow covered areas
4. Runoff Routing
SNOWMELT MODELING
Extrapolation of Meteorological Data
• In snowmelt dominated basins, very hard if not impossible to find meteorological stations in adequate number and good quality with even distribution.
• Existing stations mostly located in major valleys rather than the more inaccessible high portions of the basin, where most of the snow exist.
• Thus, a necessity to use data from a station even though it may be a long distance away and at a much lower elevation from the snowpack.
Extrapolation of Meteorological Data
• Air temperature, mainly used for two purposes in the snowmelt models.
• Both as threshold temperature, separating precipitation as rainfall or snow and as critical temperature, used for estimating snowmelt rates.
• May not to be same and both may be other than zero. • Since air temperature alters with elevation, temperature lapse rates
must be used to convert the measured air temperature at the lower station to the air temperature at the snowpack location.
• Although, most runoff models assume a fixed value for the lapse rate, the actual value may be a varying value depending on the present meteorological conditions.
• Often the temperature lapse rate, threshold and critical temperature values are treated as calibration parameters (Hydalp, 2000) of the model used.

Extrapolation of Meteorological Data
• Distribution of precipitation from point stations to the rest of the basin has been a problem in the hydrology.
• Come up with, unrealistic and inaccurate results. • Besides, the systematic under catch of snow by
most rain gauges especially under high wind speeds has long been reported in literature such as Sevruk (1983).
• Precipitation amount increases with elevation.

Extrapolation of Meteorological Data
• Exists numerous methods from simple arithmetic averaging, Theissen polygons to inverse distance relations. These methods allow the extrapolation in a horizontal plane (2D), disregarding the topography of the area under study.
• Some methods such as De-trended Kriging (Garen, 2003) when distributing the meteorological variables takes the topography into consideration.
• Preliminary study must be performed since some times, distributing the variables in 2D may give better results than distribution in 3D (Weibel et al., 2002).

Point Melt Rate Calculations
• The energy flux that a surface absorbs or emits is dependent to the sum of the:
• Net all wave radiation (sum of net short (net solar) and long wave (net thermal) radiation)
• Sensible heat transfer to the surface by turbulent exchange from atmosphere
• Latent heat of condensation or evaporation• Heat added by precipitation (if the temperature
of precipitation is different than the surface temperature)
• Heat conducted from ground
Point Melt Rate Calculations
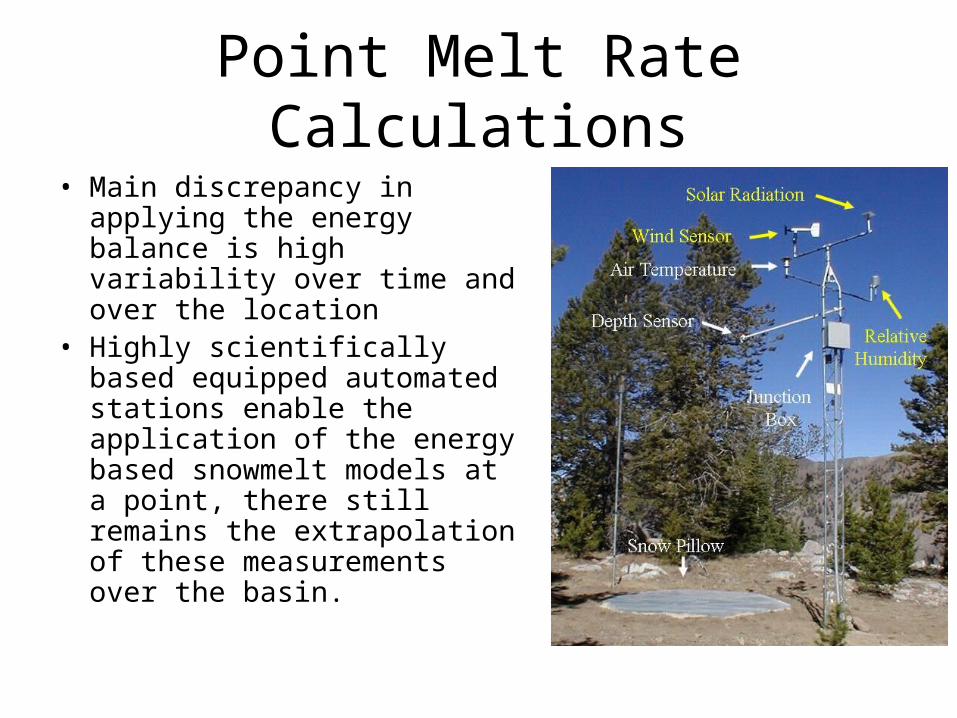
• Main discrepancy in applying the energy balance is high variability over time and over the location
• Highly scientifically based equipped automated stations enable the application of the energy based snowmelt models at a point, there still remains the extrapolation of these measurements over the basin.
Point Melt Rate Calculations
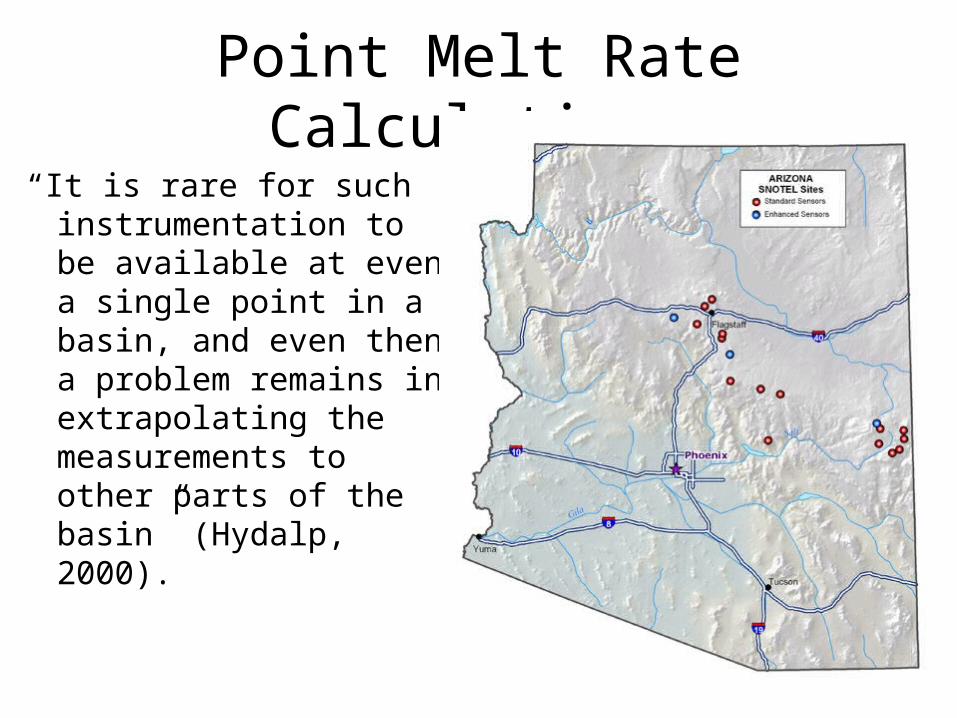
“It is rare for such instrumentation to be available at even a single point in a basin, and even then a problem remains in extrapolating the measurements to other parts of the basin” (Hydalp, 2000).
Point Melt Rate Calculations• Instead of measuring all components some approximations are
provided, called “parametric energy balance” methods. • In here, some energy components are derived from available data. • Such as;
Incident radiation, F(latitude, time of year, shading effects, cloud cover and snow albedo). Sensible heat= wind speed * air temperature
Precipitation heat supply = Rainfall rate * Rainfall temperature • But still, extrapolating over the other parts of the basin ?. • And additional assumptions about the seasonal variations of these
terms should be made.
Point Melt Rate Calculations
• Air temperature, common factor in all energy balance equations except the net radiation.
• However, there is generally a good correlation between them (Hydalp, 2000).
• Temperature can be considered as the driving factor for the day to day variations of the heat supply to snowpack.
Integration of melt water over the snow covered areas
• Depletion of snow cover takes place over a period called “melting season” during both incident solar radiance and air temperatures increase.
• SC doesn’t disappear at the same time everywhere in the basin.
• Even uniform melting, differences in initial snow distribution, results variations. (longer SC @ higher elevations)
Integration of melt water over the snow covered areas
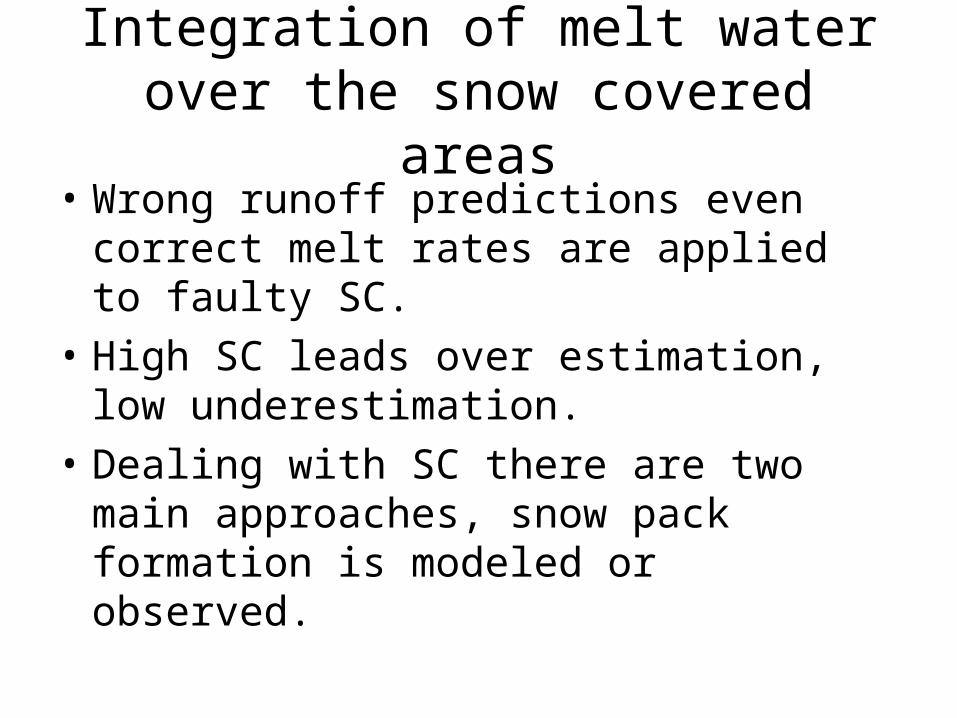
• Wrong runoff predictions even correct melt rates are applied to faulty SC.
• High SC leads over estimation, low underestimation.
• Dealing with SC there are two main approaches, snow pack formation is modeled or observed.

Integration of melt water over the snow covered areas
Formation observed;
• Snow on the surface is monitored.
• May start with initialization of the melting
• RS may be helpful
• Actually one of the practical uses of RS in hydrology since 1970’s
• Basis of Snowmelt Runoff Model (SRM)
Integration of melt water over the snow covered areas
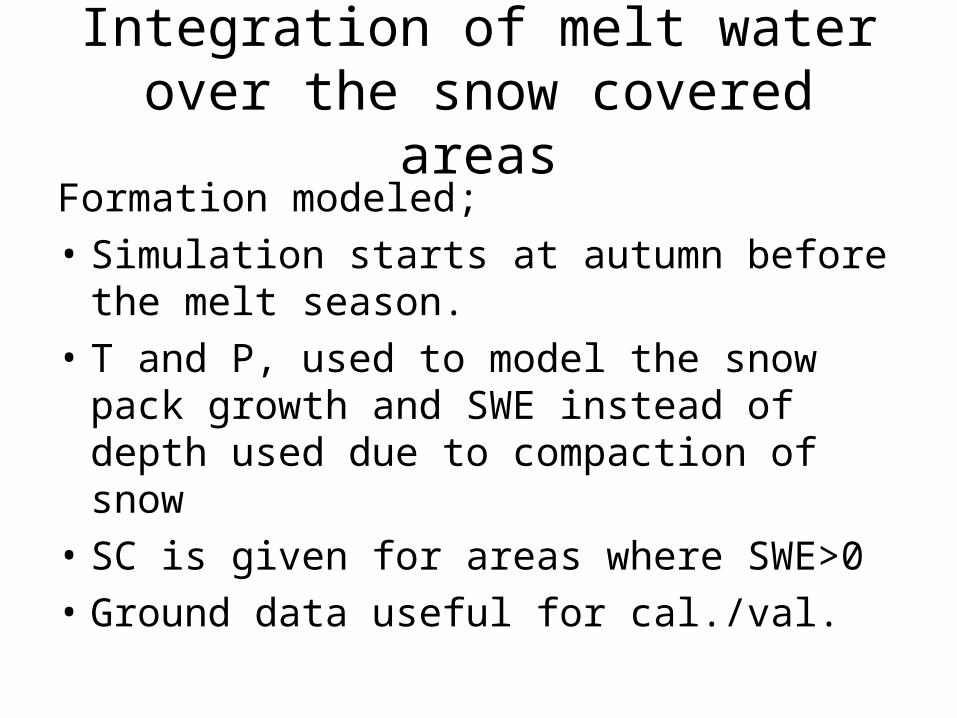
Formation modeled;
• Simulation starts at autumn before the melt season.
• T and P, used to model the snow pack growth and SWE instead of depth used due to compaction of snow
• SC is given for areas where SWE>0
• Ground data useful for cal./val.

Runoff Routing
infiltration
percolation

Runoff Routing
• Simplified in conceptual terms, upper and lower stores for fast and slow flow.

Runoff Routing
• Stores can provide linear or nonlinear flow rates
Q = A.S
A not constant F(S or Q)

Runoff Routing
• Stores can be in series, parallel or both.
• Two or even single may provide good approximations for daily rainfall runoff predictions
• An extra snowpack model may be needed.
Quality Assessment Model Accuracy
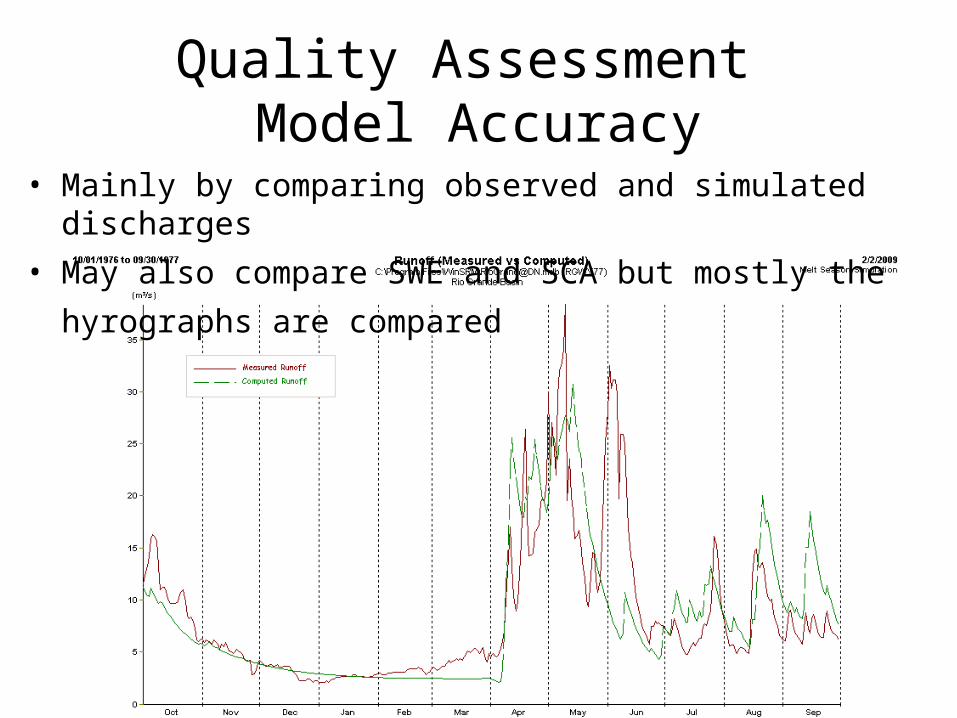
• Mainly by comparing observed and simulated discharges
• May also compare SWE and SCA but mostly the hyrographs
are compared
Quality Assessment Model Accuracy
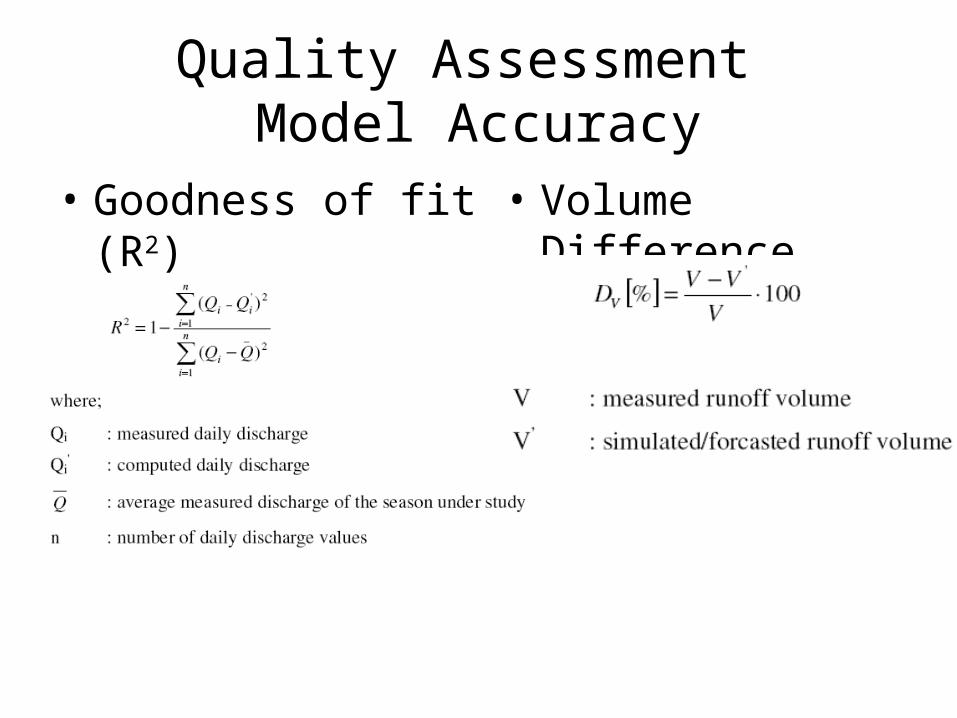
• Goodness of fit (R2)Nash & Sutcliffe
• Volume Difference

Not Sleepy yet?
BREAK?
Snowmelt Runoff Model (SRM)
• Developped by Martinec in 1975 in Swiss Snow and Avalanche Research Institute.
• Changed & developed with collaboration of Albert Rango (US ARS),
Ralph Roberts (US ARS),
Michael Baumgartner (University of Bern)
Klaus Seidel (University of Zürich)• Various versions exist.
http: // hydrolab.arsusda.gov/cgibin/srmhome
Snowmelt Runoff Model (SRM)
• Contrary to general purpose hydrological models with extra snow modules,
• SRM, initially developed to predict the snowmelt runoff
• Year around simulation capability was also shown by Martinec et al., (1998).
• Applied over 100 basins in 25 countries @ altitudes 32-60 oN & 33-54oS with basin sizes varying from <1 to 120 000 km2 documented in about 80 scientific references (Seidel and Martinec, 2004)

SnowMelt Runoff Model
SemiDistributed
Physically based
Deterministic
Same input same output
SnowMelt Runoff Model
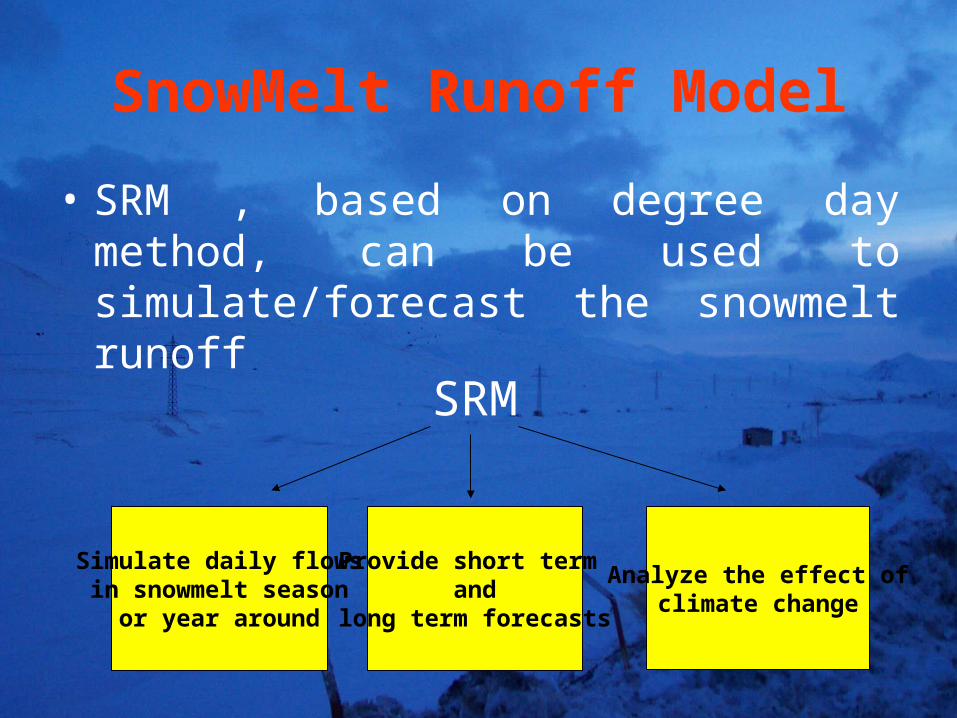
• SRM , based on degree day method, can be used to simulate/forecast the snowmelt runoff
Simulate daily flowsin snowmelt season
or year around
Provide short term and
long term forecasts
Analyze the effect ofclimate change
SRM

Snowmelt Runoff Model (SRM)Basin is divided in to elevation zones
Precp. & Temp extrapolated from base and snowmelt in each zone computed
SCA values are provided to determine melting area information
Losses from evap and ground water handled
Runoff from all zones summe up before routing
Total amount routed by single store
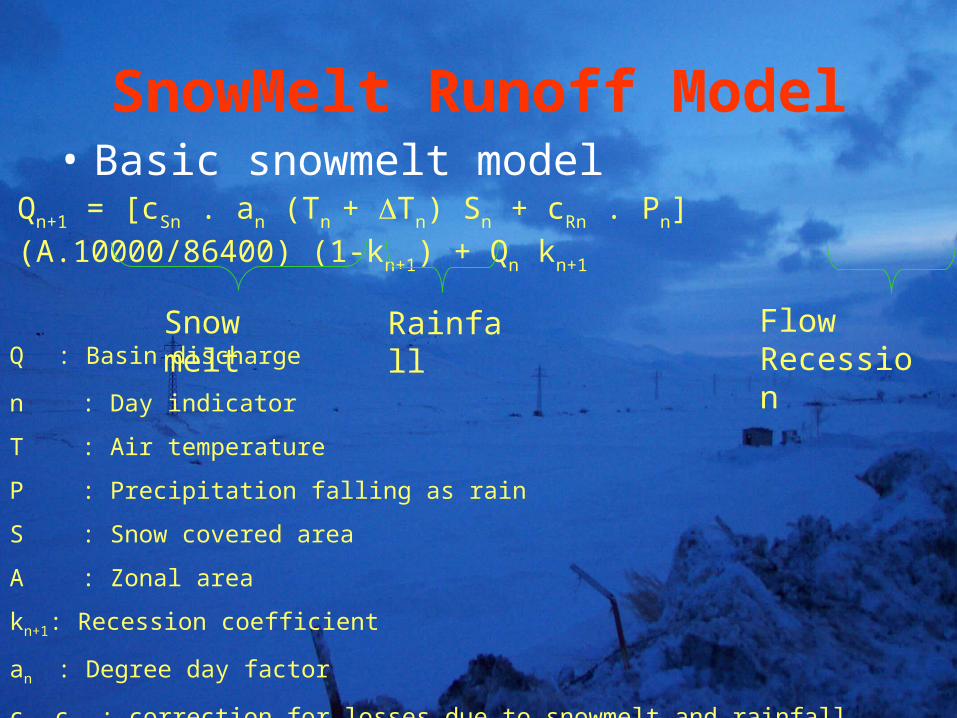
SnowMelt Runoff Model• Basic snowmelt model
Qn+1 = [cSn . an (Tn + Tn) Sn + cRn . Pn] (A.10000/86400) (1-kn+1) + Qn kn+1
Snow melt Rainfall Flow RecessionQ : Basin discharge
n : Day indicator
T : Air temperature
P : Precipitation falling as rain
S : Snow covered area
A : Zonal area
kn+1: Recession coefficient
an : Degree day factor
csn,crn : correction for losses due to snowmelt and rainfall

SnowMelt Runoff Model
• Basic snowmelt model
Qn+1 = [cSn . an (Tn + Tn) Sn + cRn . Pn] (A.10000/86400) (1-kn+1) + Qn kn+1
Snow melt Rainfall Flow Recession
uses
7 Parameters3 Variables

SnowMelt Runoff Model
Variables (Inputs)
Temperature PrecipitationSnow Covered
Area %
Meteorological Stations Aerial Photos
or
Satellite Data ForecastedMeasured

SnowMelt Runoff Model
Variables (Inputs)

SnowMelt Runoff ModelVariables (Inputs) T & P
T or P; either from single station or from separate sites for each zone.
Single/synthetic station; T and P lapse rates are needed to extrapolate values. LR can be variable seasonally.
P type (snow/rain) f(Tcrit)Snow on no SCA temporary snow pack, becomes Q as
sufficient melt conditionsRain on snow pack, becomes Q if ripe snow existRain on no SCA direct runoffMelting effect of rain is neglected

SnowMelt Runoff ModelVariables (SCA)
Time series of daily SCA, snow depletion curves(SDC) or conventional depletion curves (CDC), is needed
Initially ground observations and aerial photos, used. Recently satellite images are utilized.

MODIS

MODIS
AQUA & TERRA
NOAA AVHRR
Image Processing
Snow covered area determination
SCA

NOAA/AVHRR
MODIS

April 1/10/12/26
May 21/22
June 12/13
April 1/10/12/26
May 22
June 11/12/13/
14/25/30
MODIS
MOD10A1
Daily Snow Cover
NOAA AVHRR
MODIS
MOD10A2
8 Daily Snow Cover
2004_089 2004_137
2004_097 2004_145
2004_105 2004_153
2004_113 2004_161
2004_121 2004_169
2004_129 2004_177

Snow Covered Area (SCA) Determination
0.0
10.0
20.0
30.0
40.0
50.0
60.0
70.0
80.0
90.0
100.0
1-Apr 8-Apr 15-Apr 22-Apr 29-Apr 6-May 13-May 20-May 27-May 3-Jun 10-Jun 17-Jun 24-Jun 1-Jul 8-Jul
Date
SC
A (
%)
Zone E (L.B.)
Zone E (U.B.)
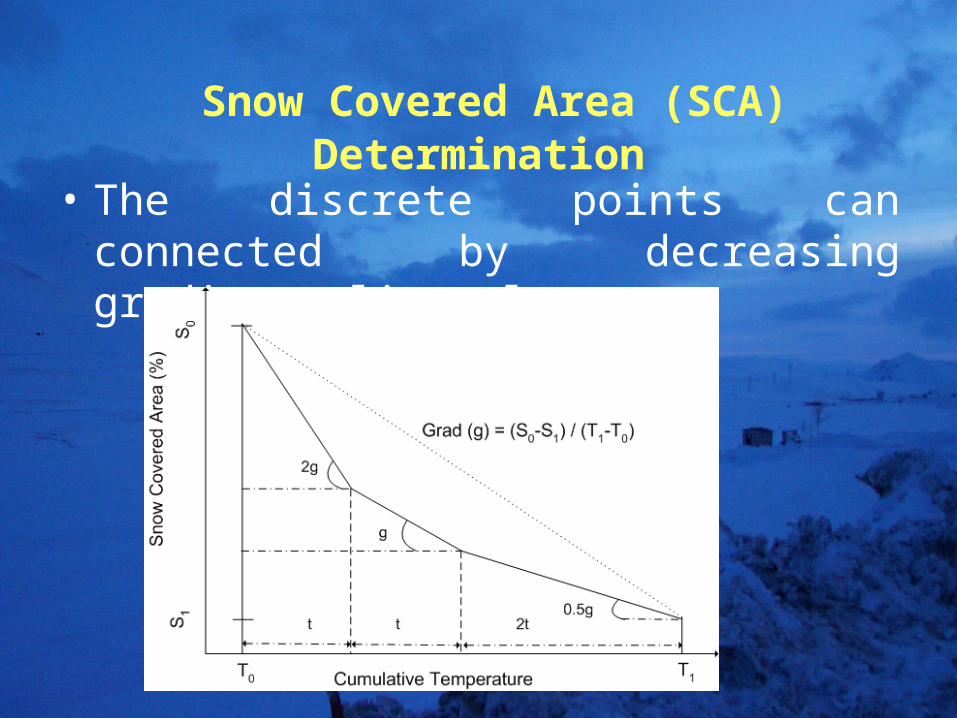
Snow Covered Area (SCA) Determination
• The discrete points can connected by decreasing gradients linearly.

Snow Covered Area (SCA) Determination
• Or by exponential equation.

Snow Covered Area (SCA) Determination
0.0
10.0
20.0
30.0
40.0
50.0
60.0
70.0
80.0
90.0
100.0
1-Apr 8-Apr 15-Apr 22-Apr 29-Apr 6-May 13-May 20-May 27-May 3-Jun 10-Jun 17-Jun 24-Jun 1-Jul 8-Jul
Date
SC
A (
%)
Zone E (L.B.)
Zone E (U.B.)
SnowMelt Runoff Model
• Disappearing patterns expected to be same year to year.
• Although, differences in winter accumulations and melting conditions may vary, a family of CDC’s might be expected for a basin, zone, all similar in shape but timing varying f(initial SWE) (Hydalp,2000)

SnowMelt Runoff Model
Variables (Inputs)
Temperature PrecipitationSnow Covered
Area %
SnowMelt Runoff Model
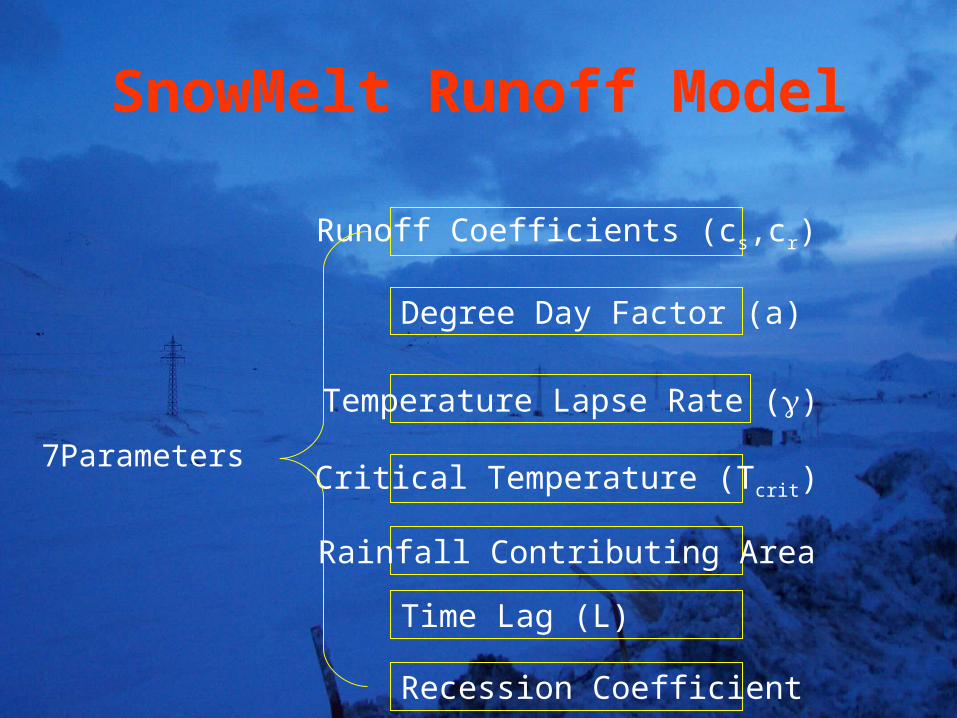
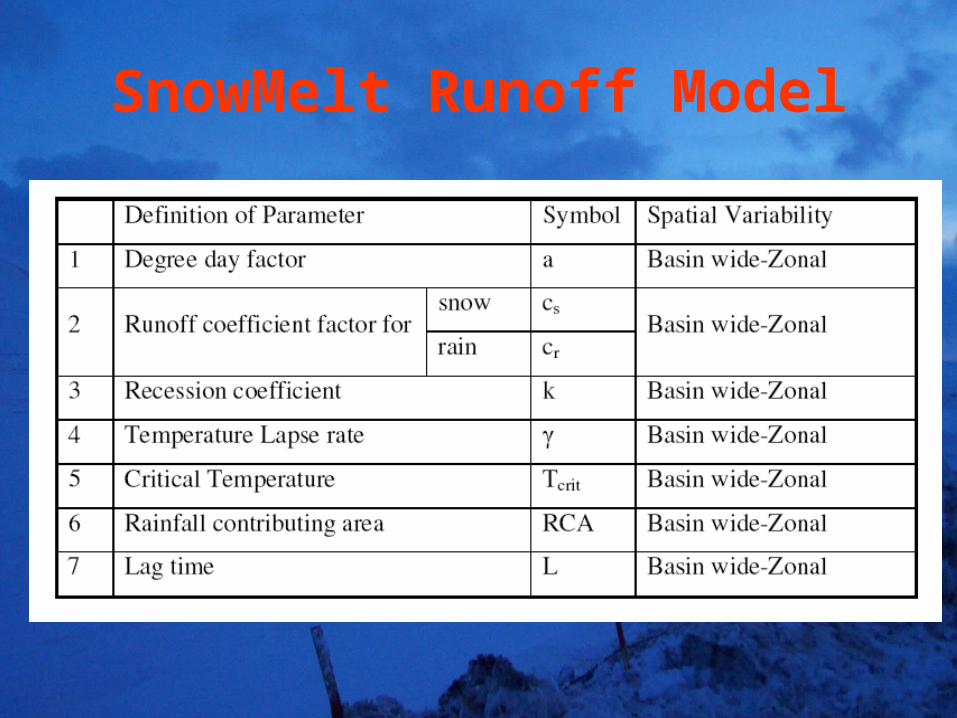
7Parameters
Runoff Coefficients (cs,cr)
Rainfall Contributing Area
Recession Coefficient
Degree Day Factor (a)
Temperature Lapse Rate ()
Critical Temperature (Tcrit)
Time Lag (L)
SnowMelt Runoff Model

SnowMelt Runoff Model
Degree day factor
Converts the number of degree days (temperature values above a certain base temperature) (oC d) into snowmelt depths M(cm)
M= a*T
Comparing the degree day values with the daily decrease of snow water equivalent.
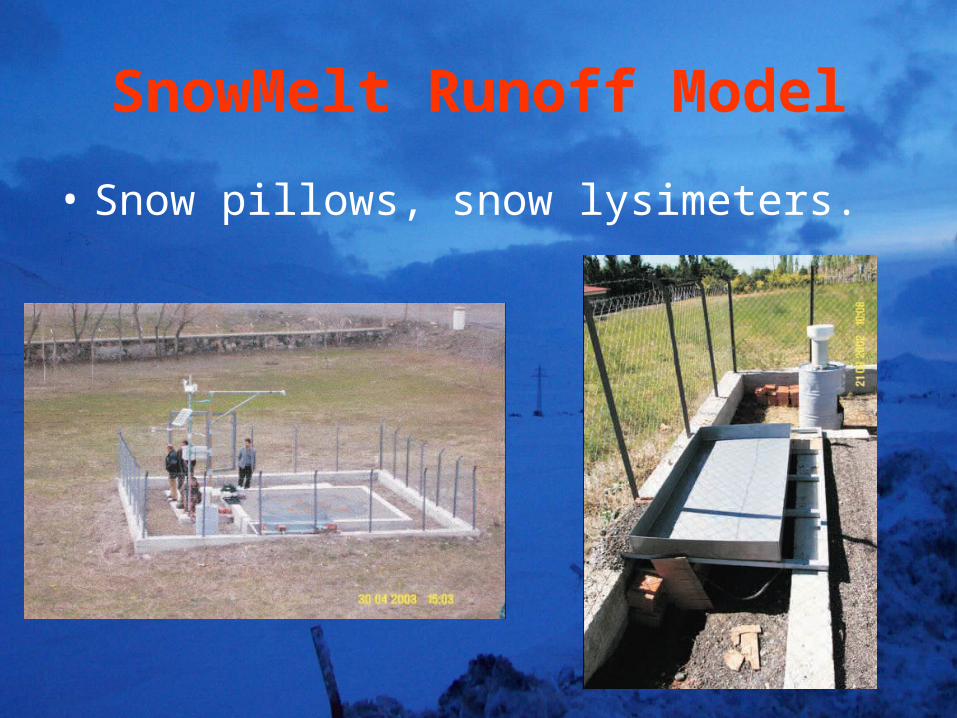
SnowMelt Runoff Model
• Snow pillows, snow lysimeters.

SnowMelt Runoff Model
• In case of no data;
can be used.
Shows a daily variation, expected as some energy terms are neglected.
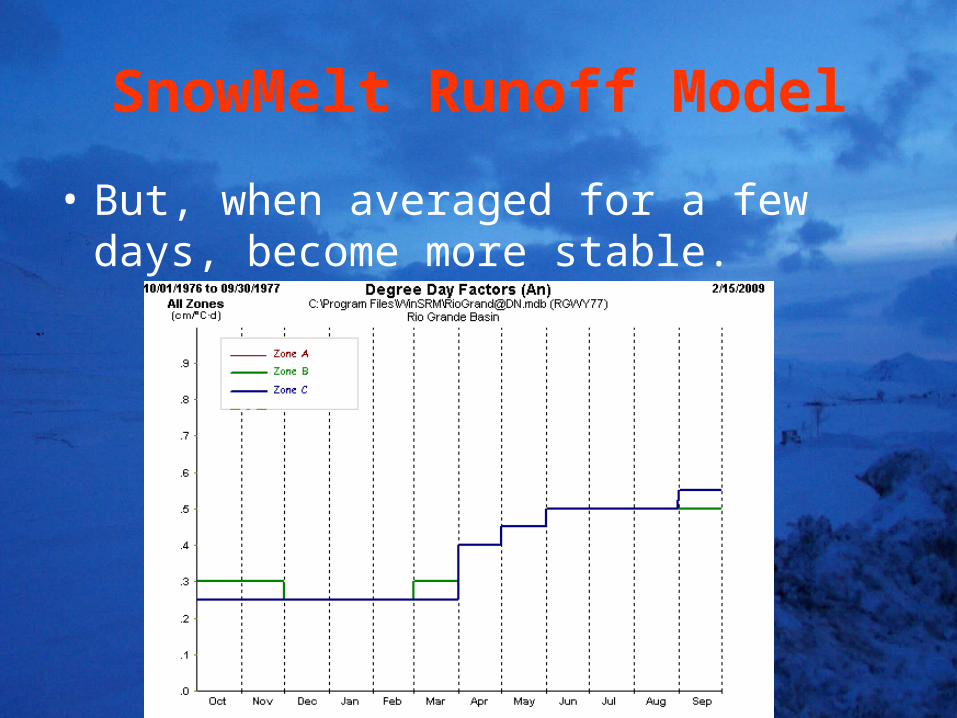
SnowMelt Runoff Model
• But, when averaged for a few days, become more stable.
SnowMelt Runoff Model
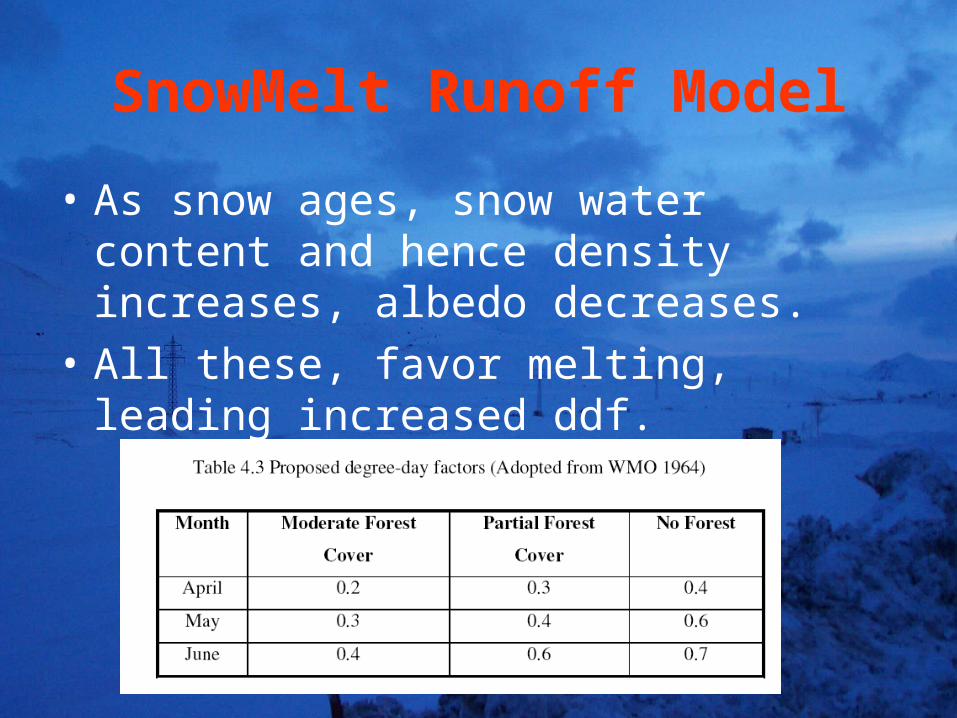
• As snow ages, snow water content and hence density increases, albedo decreases.
• All these, favor melting, leading increased ddf.

SnowMelt Runoff Model
• Ddf will maintain its popularity since temperature is tentatively, a good measure of energy flux, in addition to easy to measure and forecast (Martinec and Rango, 1986).
SnowMelt Runoff Model
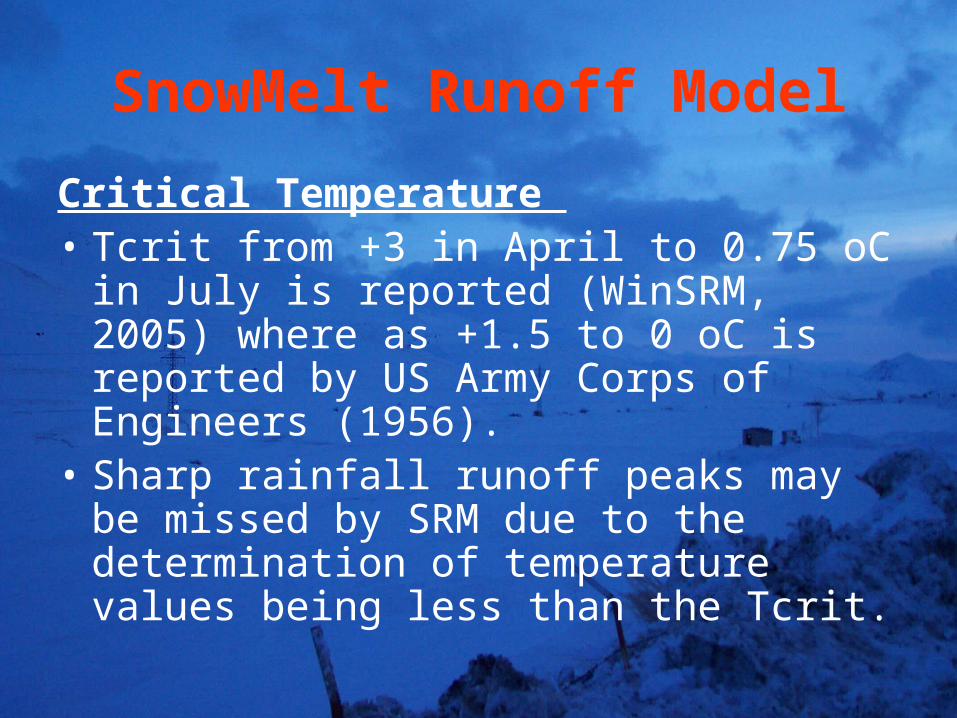
Critical Temperature (Tcrit)• determine the type of precipitation • i.e. either rainfall and contribute to runoff
immediately (T > Tcrit) • or snowfall (T < Tcrit) and lead to
accumulation of snowpack and a delayed runoff
• Thus, new snowfalls are kept in storage until warm days allow the melting.
SnowMelt Runoff Model
Critical Temperature • Tcrit from +3 in April to 0.75 oC in July is
reported (WinSRM, 2005) where as +1.5 to 0 oC is reported by US Army Corps of Engineers (1956).
• Sharp rainfall runoff peaks may be missed by SRM due to the determination of temperature values being less than the Tcrit.

SnowMelt Runoff Model
• Value may be changed, but daily values used, and rain can occur during the warmer or colder period of the day.

SnowMelt Runoff Model
Temperature Lapse Rate• Defines a temperature gradient across the watershed, used
in extrapolating temperature values from a given station. • SRM accepts a single, basin wide temperature lapse rate
or zonal temperature lapse rates.• Higher temperature lapse rates for winter and lower values
for the summer months are expected (Hydalp, 2000). • The depletion of snow cover may represent requirement of
the value change of the lapse rate. • High temperatures from extrapolation by a LR value but no
change in snow areal extent is , then probably no appreciable snowmelt is taking place (WinSRM, 2005) and the LR should be modified accordingly.

SnowMelt Runoff Model

SnowMelt Runoff Model
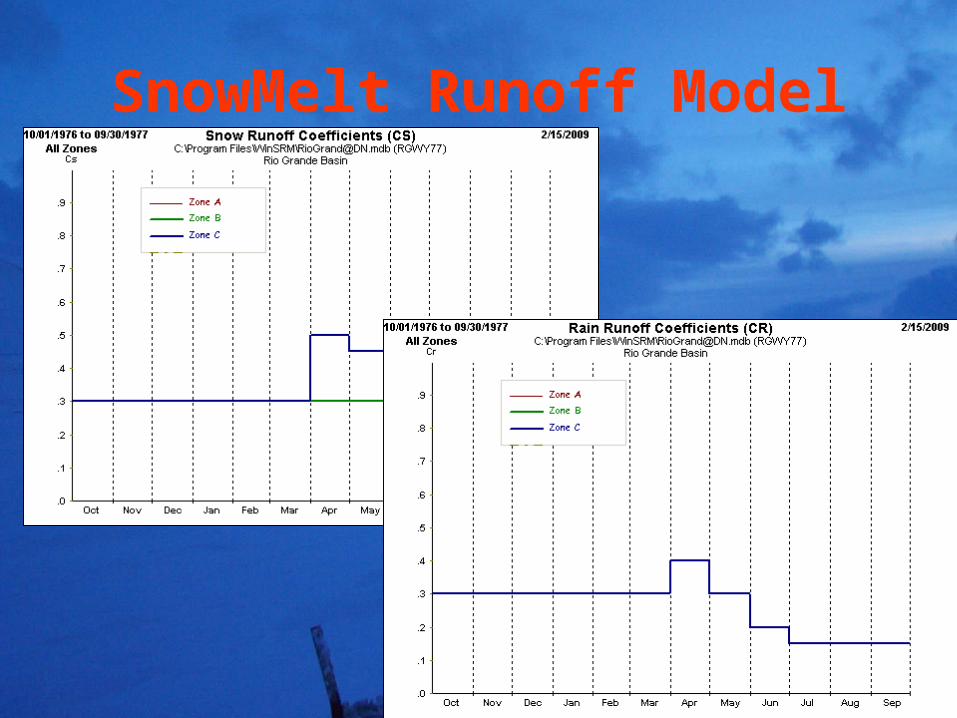
Runoff Coefficients• Explain, differences between the basin runoff and the
available precipitation (either snowfall or rainfall) • Account for the volume of water, which does not leave
the basin, F(the site characteristics, such as soil type, soil depth, elevation, slope, aspect, vegetation type and vegetation density) (Levick, 1998).
• SRM uses two runoff coefficients cs and cr related to snow melting and rainfall respectively. The two values are expected to be different from each other due to their characteristics.

SnowMelt Runoff Model
Runoff Coefficients• In the early melt period, frozen soil early has lower
infiltration and storage capacities. • Spring will thaw the soil and snow melt will soak in the
soil, leading a drop in the runoff coefficients. • As soil becomes saturated, the values will increase
again.• Thus, monthly variations in runoff coefficients are
expected and can be explained by an analysis of the seasonal changes in vegetation and climate (Levick, 1998, Kaya 1999).
SnowMelt Runoff Model
SnowMelt Runoff Model
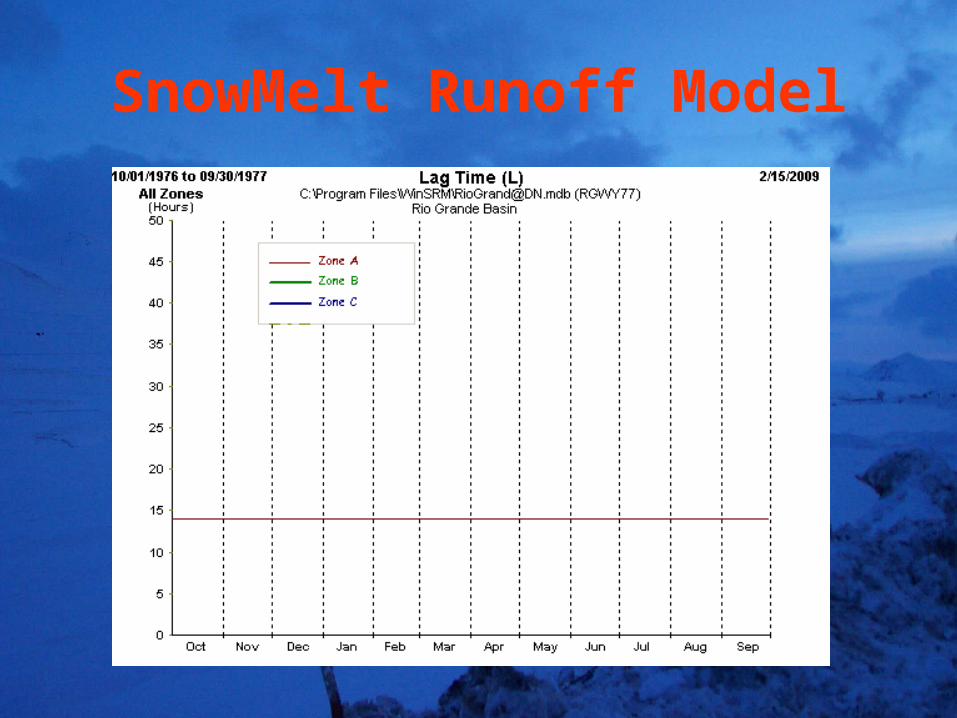
Time Lag• Indicates the time delay between the daily rise
in temperature and runoff production. • Used for time wise matching of the observed
and calculated peaks in the simulation mode.• Hydrographs of past years and the daily
fluctuating character of the snowmelt enable the predetermination of the time lag value.
• Value can be modified by comparing the timing of simulated hydrograph peaks with the observed hydrograph peaks.
SnowMelt Runoff Model
SnowMelt Runoff Model
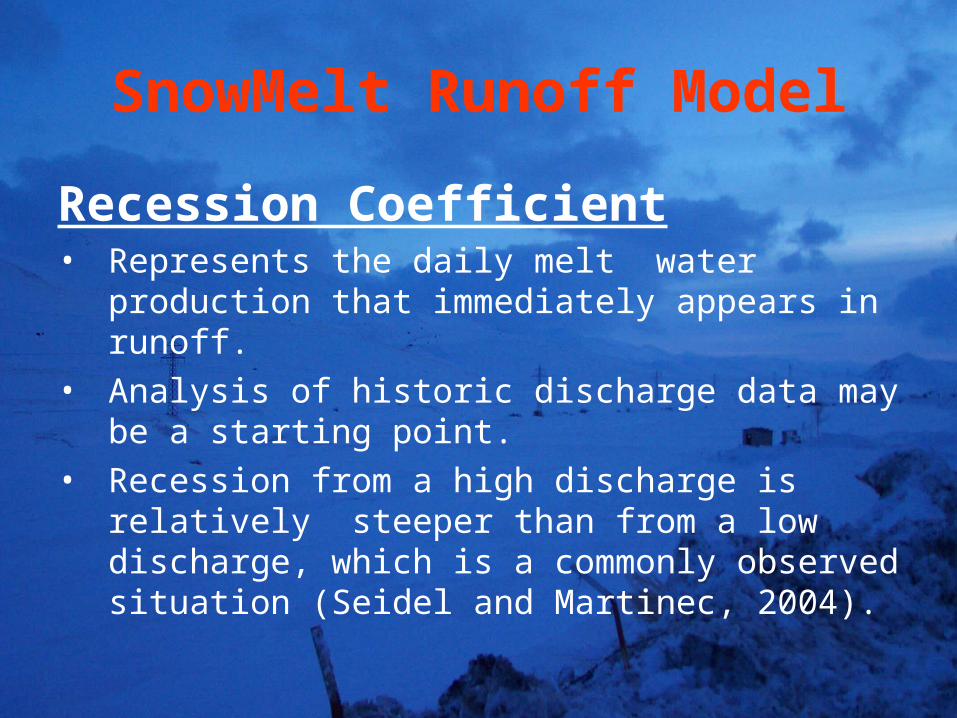
Recession Coefficient• Represents the daily melt water production
that immediately appears in runoff. • Analysis of historic discharge data may be a
starting point. • Recession from a high discharge is relatively
steeper than from a low discharge, which is a commonly observed situation (Seidel and Martinec, 2004).
SnowMelt Runoff Model
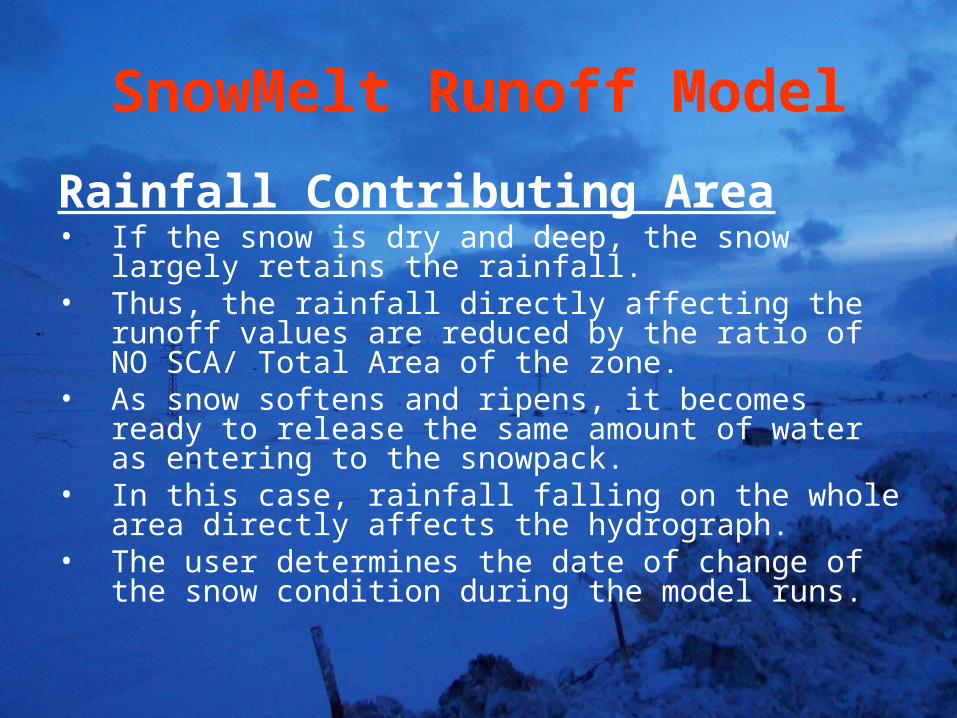
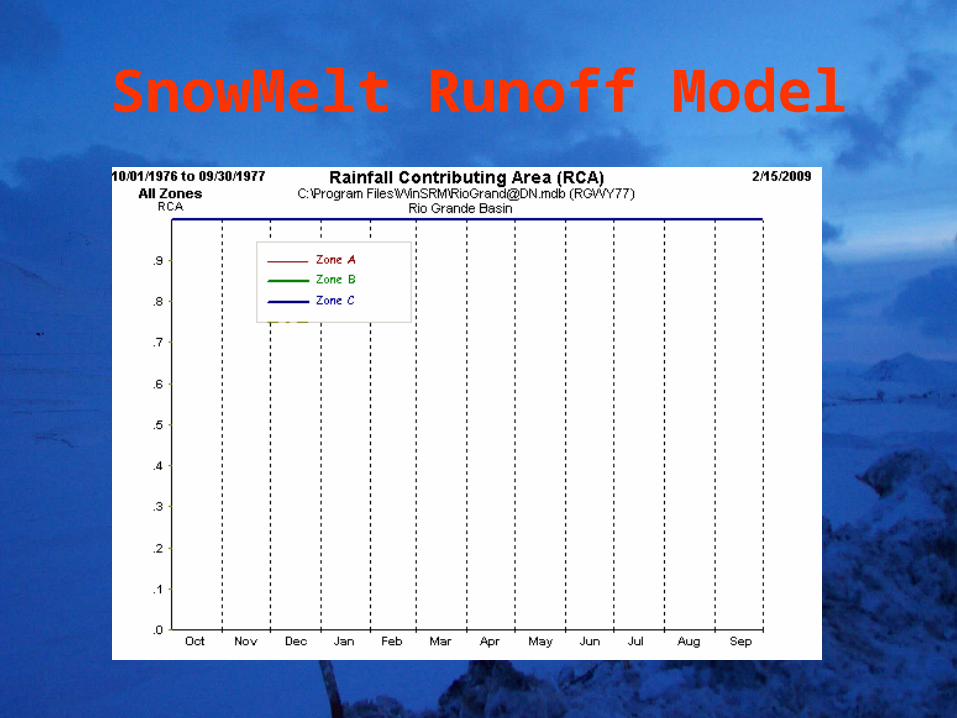
Rainfall Contributing Area• If the snow is dry and deep, the snow largely retains
the rainfall.• Thus, the rainfall directly affecting the runoff values are
reduced by the ratio of NO SCA/ Total Area of the zone.
• As snow softens and ripens, it becomes ready to release the same amount of water as entering to the snowpack.
• In this case, rainfall falling on the whole area directly affects the hydrograph.
• The user determines the date of change of the snow condition during the model runs.
SnowMelt Runoff Model


THANK YOU FOR YOUR ATTENTION
QUESTIONS?