specificaties voor versie 3.0 landelijk asbestvolgsysteem
TRANSCRIPT
Individual level simulation for the design of cost-effective
research portfolios in elderly breast cancer: Using indirect
evidence to derive prior distributions for simulation
parameters.
Paul Richards, Prof Alan Brennan,
Health Economics and Decision Science,
School of Health and Related Research,
The University of Sheffield
Email for correspondence: [email protected]
9 December 2011
Abstract
Health economic modelling and value of information techniques provide an alternative framework for
research study design to traditional statistical practice. These methods consider the expected increase in
net-benefit gained by carrying out a study and re-evaluating the optimal decision. The potential value of
different study designs can be assessed by considering their associated EVSI, which requires a mechanism
for the generation of study results. The technique of Bayesian clinical trial simulation (BCTS) can be used
for this purpose. Both health economic modelling and BCTS require the specification of a prior distribution
on parameters describing key characteristics of interest (for example, treatment efficacy or health state
utility values). In the context of research planning it is likely that the direct evidence base will be small and
so more generalised evidence synthesis methods will be required which permit the inclusion of indirect
evidence and expert opinion.
In this paper an ongoing research project is introduced which aims to assess the potential for using BCTS
and value of information techniques in the planning of research portfolios in postmenopausal breast cancer,
with particular focus on decision problems concerning the optimal treatment strategies in the elderly. A
generalised evidence synthesis model is presented to demonstrate an example of how indirect evidence
from randomised controlled trials can be used to specify a prior distribution on treatment effectiveness for
a BCTS model. Possibilities for adjusting this analysis to account for possible sources of bias are discussed.
WORK IN PROGRESS, DO NOT CITE 1 INTRODUCTION & RATIONALE
1 Introduction & Rationale
1.1 Role of decision modelling in health economic evaluation
The role of decision modelling in cost effectiveness analysis and health technology appraisal is well es-
tablished. Decisions are typically made by considering the net benefit (or equivalently the incremental
cost-effectiveness ratio against a given threshold) associated with each intervention strategy under consider-
ation, and decision theory tells us that the optimal strategy is that which maximises the expected net benefit
[10]. However, it is vital that uncertainty surrounding these expected values is correctly captured, as in most
cases there will be a positive probability that the decision taken is actually sub-optimal.
If uncertainty is sufficiently high it may be beneficial to conduct further research into some aspect of the
decision problem; this will often be a parameter describing treatment effectiveness but could be some other
quantity, such as costs and utilities associated with particular health states. Value of information techniques
provide a framework for answering such questions by explicitly valuing the expected loss associated with
making the ’wrong‘ decision given the decision maker’s cost-effectivness threshold [3]. The quantities
encountered in value of information analyses include the expected value of perfect information (EVPI) and
the expected value of sample information (EVSI), which are respectively defined as the increase in expected
net benefit if parameter uncertainty were eliminated entirely and the increase in net benefit if parameter
uncertainty were reduced, for example by observing results from a research study. The formulae for EVPI
and EVSI in the general case are not given here but can be found in [3, Chapters 6 & 7].
1.2 Role of decision modelling and VOI methods in planning clinical research studies
The role decision modelling can and should play in the early stages of research planning and development is
less clearly defined and is the subject of ongoing research. An HTA report on the subject was published in
2003 [7]. The authors were clear that whilst modelling cannot replace data collection it is able to inform
aspects of trial design such as sample size and follow-up duration and can help identify which parameters
are priorities for further research. In particular, they highlight that modelling at the early stage can help
plan cost-effective research studies by using the expected net benefit of sampling (ENBS) as a decision criterion.
ENBS is simply the difference between the EVSI associated with a particular study design and the costs
associated with completing the study.
The EVSI of a proposed study design can only be calculated analytically if some strong distributional
assumptions are made; for example Claxton [8] details a solution in the case where the incremental net-
benefit is normally distributed. This assumption is unlikely to be a realistic representation of decision
uncertainty, and is based on the sampling of the incremental net-benefit directly rather than the more
intuitive concept of sampling data to inform a subset of model parameters [3]. Theoretically, EVSI can
always be estimated numerically using Monte Carlo simulation [2] providing that a suitable model can be
specified to generate the results of the hypothetical study, and update the prior uncertainty in light of these
results.
1
WORK IN PROGRESS, DO NOT CITE 1 INTRODUCTION & RATIONALE
1.3 Potential role of Bayesian clinical trial simulation in planning efficient research portfolios
Bayesian clinical trial simulation (or BCTS) simply means the Monte Carlo simulation of clinical study
results based on available evidence. O’Hagan et al [23] demonstrate how BCTS can be used to assess a
property of a clinical trial they term assurance, the unconditional probability of a trial being successful
against some analysis objective (for example, rejecting some null hypothesis at a given significance level)
given prior uncertainty. This has an advantage over the more traditional property of statistical power, which
does not take prior uncertainty about treatment effectivenes fully into account and is conditional on the
assumption that it is equal to some fixed value. BCTS is a flexible technique and can be applied using any of
the usual model structures commonly used in health economics (Markov, discrete event simulation, etc).
BCTS has been applied in the context of Phase 2b and Phase 3 trials for a rhematoid arthiritis therapy, with
the probability of thel late stage trials being successful assessed using simulations based on the results of
Phase 2a trials [21].
From the discussion of the previous section it is clear that BCTS may be used in the calculation of EVSI
for a given study design. A predicted posterior distribution may be produced by running the BCTS model
for a sampled set of parameter values taken from the prior distribution and combining these results with
the prior. The EVSI may then be estimated using nested Monte Carlo simulation, with an outer loop of
simulation generating a set of possible posterior distributions and an inner loop of simulation to carry out
a probabilistic sensitivity analysis of the cost-effectiveness model under each posterior uncertainty and
calculating the expected net benefit in each case. The EVSI is then estimated as the mean difference between
these posterior expected net benefits and the prior expected net benefit. This is computationally intensive as
a number of nested simulation loops are required [3], although there are a number of approximate methods
available to speed up calculations ([2], for example).
1.4 Evidence based specification of prior distributions
In order for the results of BCTS and EVSI to be useful in the development of a clinical research programme
it is important that the prior distribution for the relevant clinical and economic parameters accurately
reflects the key stakeholders’ uncertainties at the planning stage. By the nature of the exercise there is
likely to be a lack of high quality evidence directly relating to the question of interest. What evidence
does exist may be observational or otherwise have questionable internal validity which may lead to biased
conclusions. Furthermore, the evidence may not be generalisable to the decision problem, for example if the
study considers a different population or uses slightly different intervention strategies. Evidence sources
which do not directly inform the model parameters of interest are termed indirect evidence for the remainder
of this paper.
From a Bayesian perspective it is perfectly acceptable for such evidence to inform our beliefs about possible
parameter values a priori. Over the past few years there has been some discussion as to whether the principles
of systematic reviewing should move from the identification and inclusion of the ’best available evidence‘ to
’all available evidence’ [1]. Techniques which consider the synthesis of disparate data sources are termed
generalised evidence synthesis by Spiegelhalter et al [27] and multiparameter evidence synthesis by Ades and
2
WORK IN PROGRESS, DO NOT CITE 1 INTRODUCTION & RATIONALE
Sutton [1]. In this framework we may also consider the prior opinions of experts as data to include in our
synthesis, which can be gathered using Bayesian elicitation methods [22].
Despite this, health technology assessments are almost always based on at least one randomised controlled
trial or large, high quality observational study. It is unlikely that NICE would make a cost-effectiveness
decision on the basis of indirect evidence alone. However, in the context of early-stage modelling for research
planning, systematic identification, modelling and synthesis of indirect evidence and expert opinion can
produce a useful characterisation of prior decision uncertainty which is transparent and open to critique by
stakeholders.
1.5 Description of PhD project
My PhD research project aims to investigate the potential for BCTS and decision modelling to help plan
efficient research programmes in postmenopausal breast cancer. A discrete event simulation model is being
built which incorporates the natural history of the disease, screening and diagnosis, and treatment from
early to advanced stage disease. This model is an adaptation of a screening model previously developed at
ScHARR1. The project will use the model to investigate the uncertainty surrounding the optimal decision
for three clinical decision problems based on current knowledge and prior beliefs on health related costs
and benefits;
1. Surgery plus adjuvant anastrozole versus primary endocrine therapy with anastrozole for elderly
women with hormone-receptor positive early stage breast cancer.
2. Surgery with or without adjuvant anthracycline based chemotherapy for elderly women with hormone-
receptor negative/weakly positive early stage breast cancer.
3. Primary anastrozole therapy versus no treatment as preventative therapy for postmenopausal women
at high-risk of developing breast cancer.
The ESTEEM and ACTION randomised controlled trials were designed to address the first two of these
questions, however both failed to recruit to protocol and were forced to close prematurely [6]. The IBIS-II A
trial is currently still recruiting patients to address the third but will not report mature results for several
years. Discrete event BCTS models are being developed in order to simulate results from different study
designs which address these questions. These results will then be used to calculate the ENBS and assurances
of different study portfolio designs in order to make recommendations for cost-effective research design.
However, the main interest of this project lies in the methodological challenges encountered when carrying
out this exercise in practice, and it is one such challenge which forms the focus of the remainder of this
paper.
1.6 Structure of paper
The focus of the remainder of this paper is the derivation of a prior distribution for a key effectiveness
parameter in the BCTS model of the ESTEEM decision problem based on indirect evidence from randomised
1Unpublished at time of writing
3
WORK IN PROGRESS, DO NOT CITE 2 METHODS & DATA
controlled trials. This is a work in progress and at this stage the analyses presented should be treated as
an exposition of ideas rather than a final analysis or firm methodological recommendation. The methods
used in the analysis and the data sources are introduced in the next section. The results of the analysis
are presented and are followed by a discussion highlighting some of the issues involved in carrying out
this exercise and the direction of future research, including a description of an extension to the modelling
involving Bayesian elicitation from experts to quantify the effects of bias in the analysis. A selection of
points for discussion are given at the end of the document.
2 Methods for synthesising indirect evidence on the difference in time to disease
relapse
2.1 ESTEEM simulation model
The ESTEEM trial was designed to test the hypothesis that primary endocrine therapy (PET) with the
aromatase inhibitor anastrozole is non-inferior to surgery plus adjuvant anastrozole therapy for elderly
women (aged ≥75) with hormone-receptor positive early breast cancer. It was motivated by the observation
that although current NICE guidance is that all women with early breast cancer should recieve surgery
as primary therapy unless procluded by comorbidity, up to 40% of NHS patients aged over 75 are treated
primarily with PET [31]. The trial aimed to recruit 1200 patients, however it was forced to close prematurely
in 2010 when it became clear that this target would not be met [6].
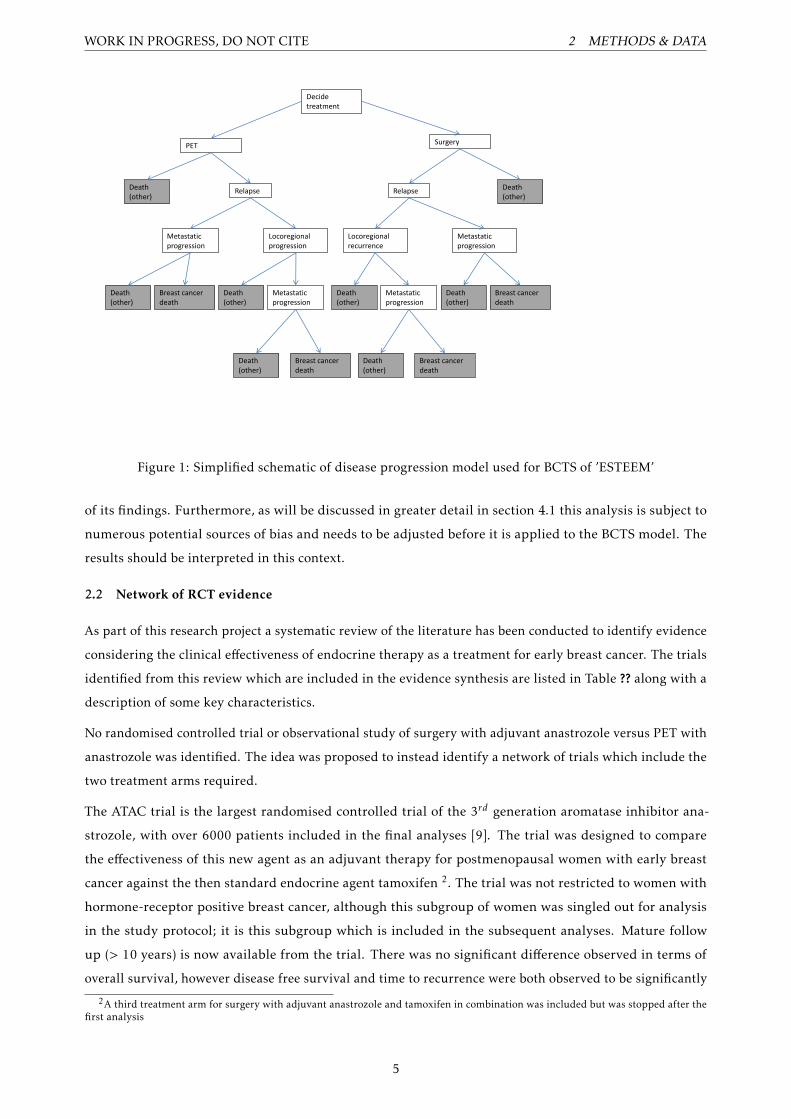
As part of the PhD project described in the previous section BCTS and health economic modelling are to
be used to investigate whether alternative study designs or cohort studies would be cost-effective. BCTS
models have been developed which allow for the simulation of results from a number of designs for both
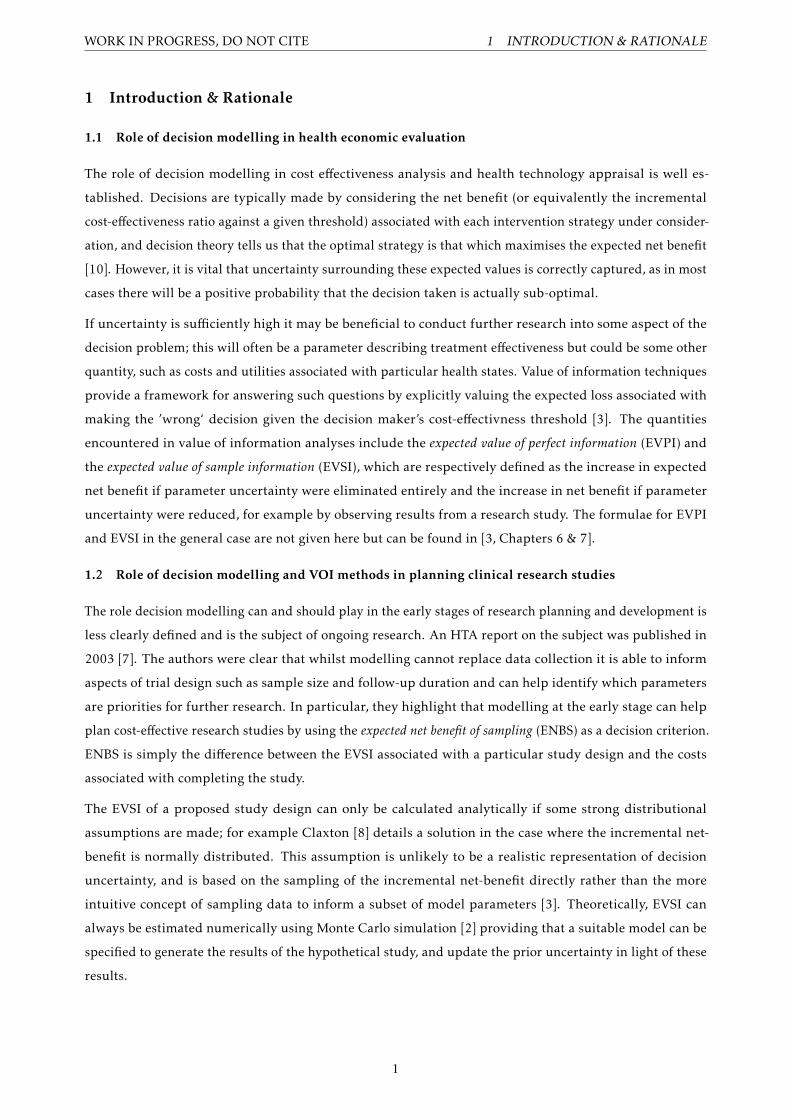
randomised controlled trials and prospective observational cohort studies. The models all share a common
state transition model for disease progression, a simplified schematic of this is shown in Figure 2.1. In
order to specify the BCTS models, prior uncertainty for all the necessary parameters must be characterised
using a probability distribution. The parameters required for each model are dependent on the underlying
study design but examples include those describing the difference in time to disease relapse and time to
metatstatic progression between treatments, utility values associated with disease states and treatment,
and probabilities of resource use. Costs related to study design, such as the additional costs of increased
follow-up must also be taken into account.
The focus of this paper is on how indirect evidence can be synthesised to help quantify prior uncertainty
about the difference in time to first disease relapse (defined as the time to the first observation of either
local progression or recurrence and metastatic progression), a key effectiveness parameter in the BCTS
and health economic models. An analysis based on an identified network of indirect evidence is detailed
below. For the purposes of this example the only evidence included is from randomised controlled trials,
as this evidence has already been reviewed over the course of the research project. A systematic review
of the observational evidence base is ongoing and the analyses presented below will be updated in light
4
WORK IN PROGRESS, DO NOT CITE 2 METHODS & DATA
Decide treatment
Surgery PET
Relapse Death (other)
Relapse
Locoregional progression
Locoregional recurrence
Metastatic progression
Metastatic progression
Breast cancer death
Metastatic progression
Metastatic progression
Breast cancer death
Breast cancer death
Breast cancer death
Death (other)
Death (other)
Death (other)
Death (other)
Death (other)
Death (other)
Death (other)
Figure 1: Simplified schematic of disease progression model used for BCTS of ’ESTEEM’
of its findings. Furthermore, as will be discussed in greater detail in section 4.1 this analysis is subject to
numerous potential sources of bias and needs to be adjusted before it is applied to the BCTS model. The
results should be interpreted in this context.
2.2 Network of RCT evidence
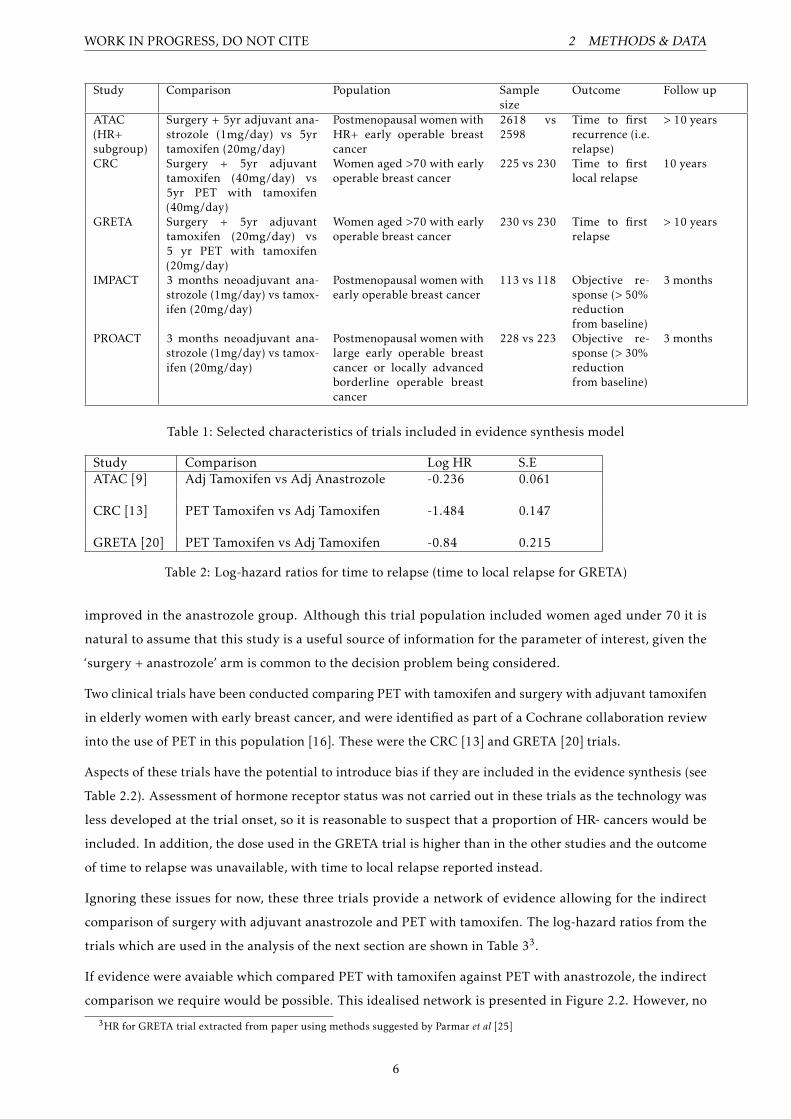
As part of this research project a systematic review of the literature has been conducted to identify evidence
considering the clinical effectiveness of endocrine therapy as a treatment for early breast cancer. The trials
identified from this review which are included in the evidence synthesis are listed in Table ?? along with a
description of some key characteristics.
No randomised controlled trial or observational study of surgery with adjuvant anastrozole versus PET with
anastrozole was identified. The idea was proposed to instead identify a network of trials which include the
two treatment arms required.
The ATAC trial is the largest randomised controlled trial of the 3rd generation aromatase inhibitor ana-
strozole, with over 6000 patients included in the final analyses [9]. The trial was designed to compare
the effectiveness of this new agent as an adjuvant therapy for postmenopausal women with early breast
cancer against the then standard endocrine agent tamoxifen 2. The trial was not restricted to women with
hormone-receptor positive breast cancer, although this subgroup of women was singled out for analysis
in the study protocol; it is this subgroup which is included in the subsequent analyses. Mature follow
up (> 10 years) is now available from the trial. There was no significant difference observed in terms of
overall survival, however disease free survival and time to recurrence were both observed to be significantly
2A third treatment arm for surgery with adjuvant anastrozole and tamoxifen in combination was included but was stopped after thefirst analysis
5
WORK IN PROGRESS, DO NOT CITE 2 METHODS & DATA
Study Comparison Population Samplesize
Outcome Follow up
ATAC(HR+subgroup)
Surgery + 5yr adjuvant ana-strozole (1mg/day) vs 5yrtamoxifen (20mg/day)
Postmenopausal women withHR+ early operable breastcancer
2618 vs2598
Time to firstrecurrence (i.e.relapse)
> 10 years
CRC Surgery + 5yr adjuvanttamoxifen (40mg/day) vs5yr PET with tamoxifen(40mg/day)
Women aged >70 with earlyoperable breast cancer
225 vs 230 Time to firstlocal relapse
10 years
GRETA Surgery + 5yr adjuvanttamoxifen (20mg/day) vs5 yr PET with tamoxifen(20mg/day)
Women aged >70 with earlyoperable breast cancer
230 vs 230 Time to firstrelapse
> 10 years
IMPACT 3 months neoadjuvant ana-strozole (1mg/day) vs tamox-ifen (20mg/day)
Postmenopausal women withearly operable breast cancer
113 vs 118 Objective re-sponse (> 50%reductionfrom baseline)
3 months
PROACT 3 months neoadjuvant ana-strozole (1mg/day) vs tamox-ifen (20mg/day)
Postmenopausal women withlarge early operable breastcancer or locally advancedborderline operable breastcancer
228 vs 223 Objective re-sponse (> 30%reductionfrom baseline)
3 months
Table 1: Selected characteristics of trials included in evidence synthesis model
Study Comparison Log HR S.EATAC [9] Adj Tamoxifen vs Adj Anastrozole -0.236 0.061
CRC [13] PET Tamoxifen vs Adj Tamoxifen -1.484 0.147
GRETA [20] PET Tamoxifen vs Adj Tamoxifen -0.84 0.215
Table 2: Log-hazard ratios for time to relapse (time to local relapse for GRETA)
improved in the anastrozole group. Although this trial population included women aged under 70 it is
natural to assume that this study is a useful source of information for the parameter of interest, given the
‘surgery + anastrozole’ arm is common to the decision problem being considered.
Two clinical trials have been conducted comparing PET with tamoxifen and surgery with adjuvant tamoxifen
in elderly women with early breast cancer, and were identified as part of a Cochrane collaboration review
into the use of PET in this population [16]. These were the CRC [13] and GRETA [20] trials.
Aspects of these trials have the potential to introduce bias if they are included in the evidence synthesis (see
Table 2.2). Assessment of hormone receptor status was not carried out in these trials as the technology was
less developed at the trial onset, so it is reasonable to suspect that a proportion of HR- cancers would be
included. In addition, the dose used in the GRETA trial is higher than in the other studies and the outcome
of time to relapse was unavailable, with time to local relapse reported instead.
Ignoring these issues for now, these three trials provide a network of evidence allowing for the indirect
comparison of surgery with adjuvant anastrozole and PET with tamoxifen. The log-hazard ratios from the
trials which are used in the analysis of the next section are shown in Table 33.
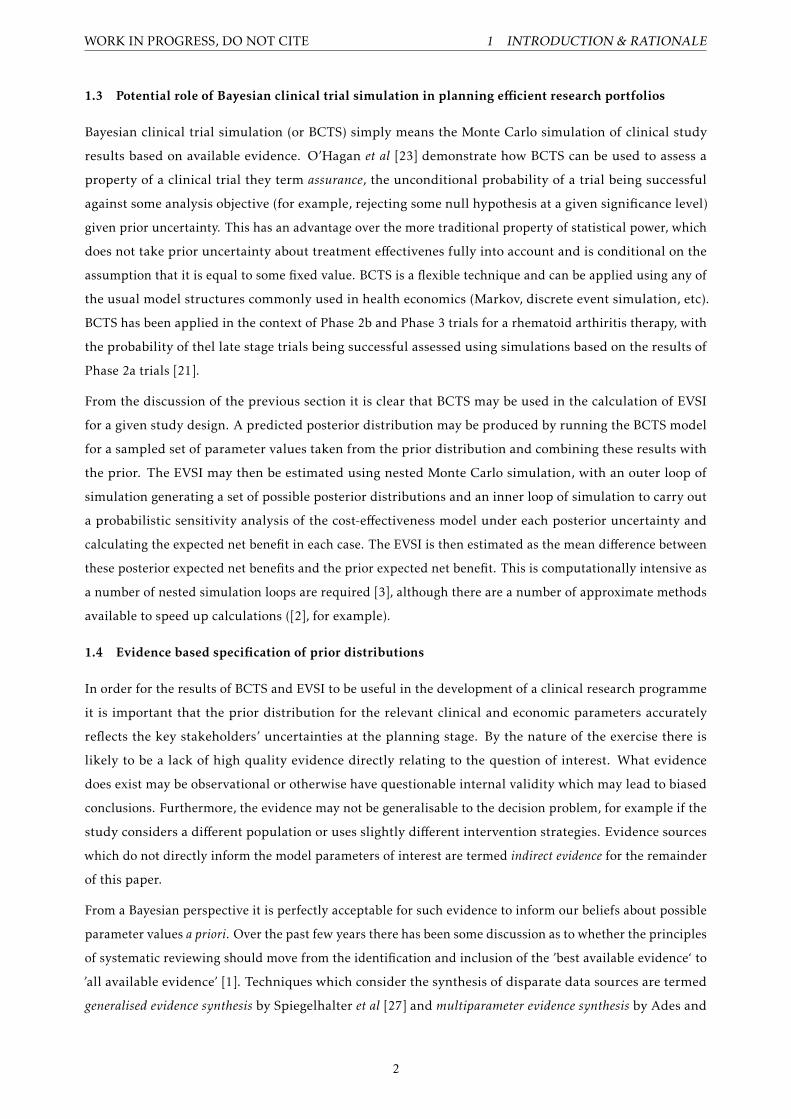
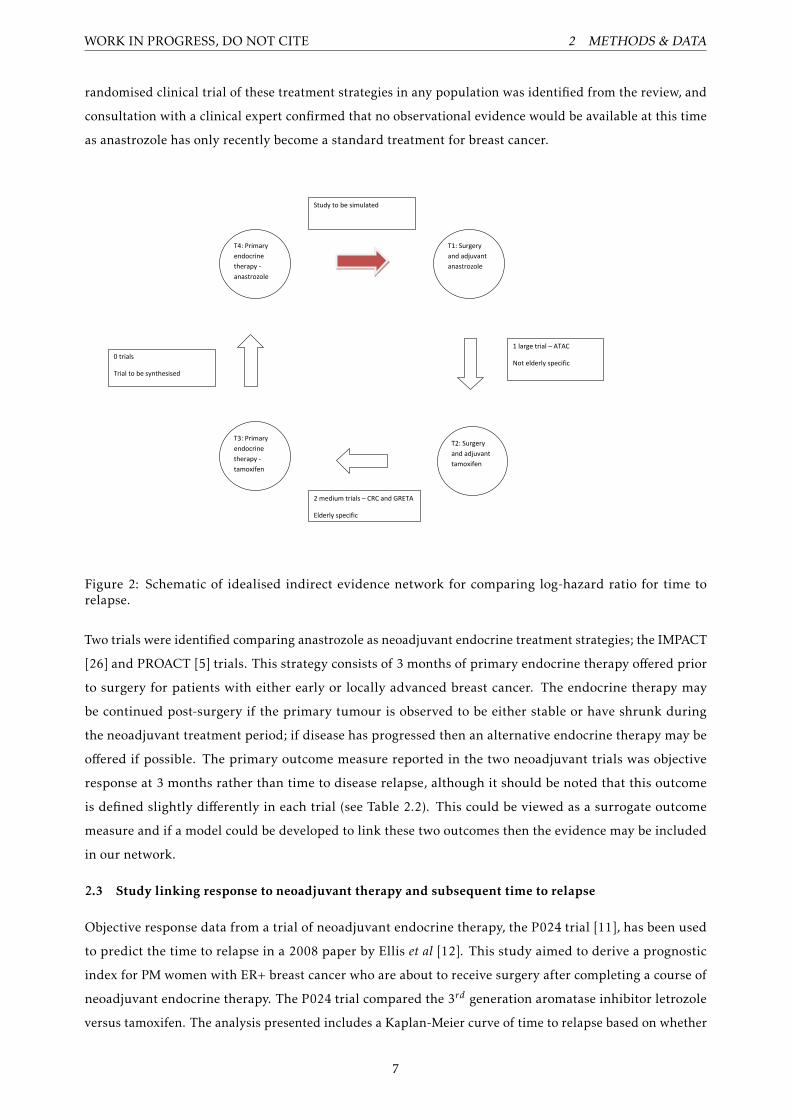
If evidence were avaiable which compared PET with tamoxifen against PET with anastrozole, the indirect
comparison we require would be possible. This idealised network is presented in Figure 2.2. However, no
3HR for GRETA trial extracted from paper using methods suggested by Parmar et al [25]
6
WORK IN PROGRESS, DO NOT CITE 2 METHODS & DATA
randomised clinical trial of these treatment strategies in any population was identified from the review, and
consultation with a clinical expert confirmed that no observational evidence would be available at this time
as anastrozole has only recently become a standard treatment for breast cancer.
T4: Primary
endocrine
therapy -
anastrozole
T3: Primary
endocrine
therapy -
tamoxifen
T2: Surgery
and adjuvant
tamoxifen
T1: Surgery
and adjuvant
anastrozole
1 large trial – ATAC
Not elderly specific
2 medium trials – CRC and GRETA
Elderly specific
0 trials
Trial to be synthesised
Study to be simulated
Figure 2: Schematic of idealised indirect evidence network for comparing log-hazard ratio for time torelapse.
Two trials were identified comparing anastrozole as neoadjuvant endocrine treatment strategies; the IMPACT
[26] and PROACT [5] trials. This strategy consists of 3 months of primary endocrine therapy offered prior
to surgery for patients with either early or locally advanced breast cancer. The endocrine therapy may
be continued post-surgery if the primary tumour is observed to be either stable or have shrunk during
the neoadjuvant treatment period; if disease has progressed then an alternative endocrine therapy may be
offered if possible. The primary outcome measure reported in the two neoadjuvant trials was objective
response at 3 months rather than time to disease relapse, although it should be noted that this outcome
is defined slightly differently in each trial (see Table 2.2). This could be viewed as a surrogate outcome
measure and if a model could be developed to link these two outcomes then the evidence may be included
in our network.
2.3 Study linking response to neoadjuvant therapy and subsequent time to relapse
Objective response data from a trial of neoadjuvant endocrine therapy, the P024 trial [11], has been used
to predict the time to relapse in a 2008 paper by Ellis et al [12]. This study aimed to derive a prognostic
index for PM women with ER+ breast cancer who are about to receive surgery after completing a course of
neoadjuvant endocrine therapy. The P024 trial compared the 3rd generation aromatase inhibitor letrozole
versus tamoxifen. The analysis presented includes a Kaplan-Meier curve of time to relapse based on whether
7
WORK IN PROGRESS, DO NOT CITE 2 METHODS & DATA
or not patients achieved objective response after 3 months of neoadjuvant therapy was concluded (with
treatment arms combined) (Figure 2-C of [12]). The hazard ratio of time to relapse for responders is
calculated using the Cox proportional hazards model both as the lone independent variable and with other
covariates included.
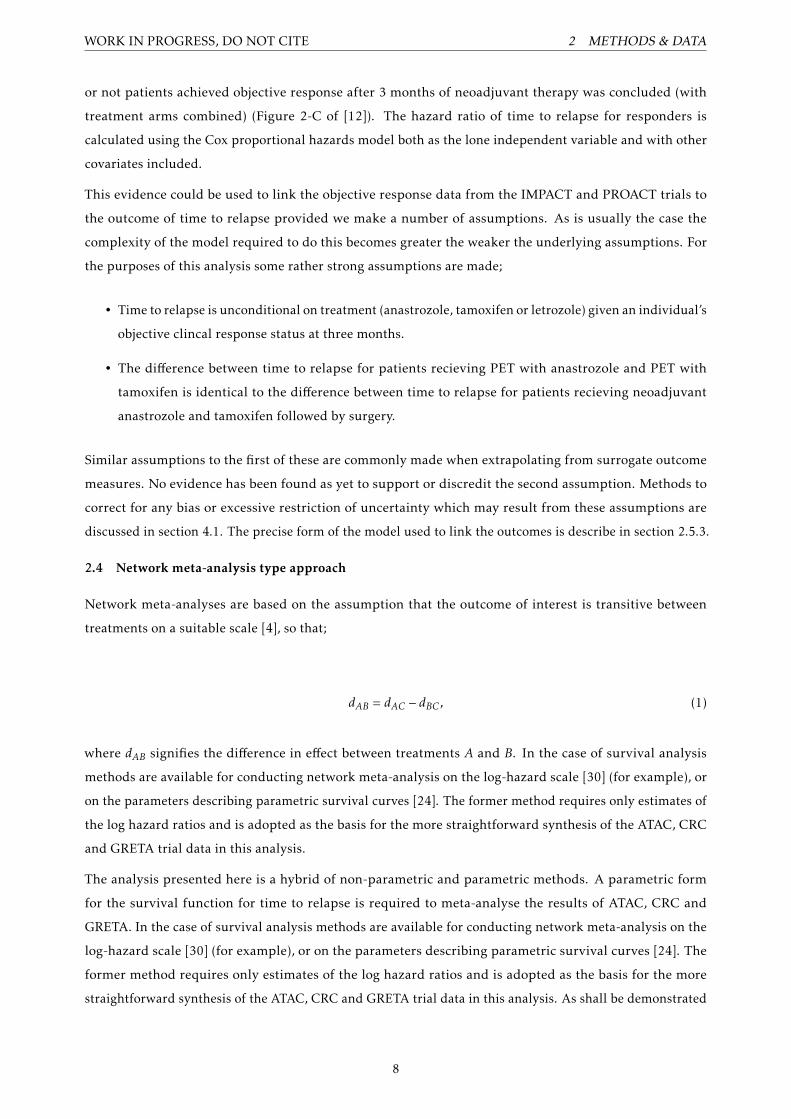
This evidence could be used to link the objective response data from the IMPACT and PROACT trials to
the outcome of time to relapse provided we make a number of assumptions. As is usually the case the
complexity of the model required to do this becomes greater the weaker the underlying assumptions. For
the purposes of this analysis some rather strong assumptions are made;
• Time to relapse is unconditional on treatment (anastrozole, tamoxifen or letrozole) given an individual’s
objective clincal response status at three months.
• The difference between time to relapse for patients recieving PET with anastrozole and PET with
tamoxifen is identical to the difference between time to relapse for patients recieving neoadjuvant
anastrozole and tamoxifen followed by surgery.
Similar assumptions to the first of these are commonly made when extrapolating from surrogate outcome
measures. No evidence has been found as yet to support or discredit the second assumption. Methods to
correct for any bias or excessive restriction of uncertainty which may result from these assumptions are
discussed in section 4.1. The precise form of the model used to link the outcomes is describe in section 2.5.3.
2.4 Network meta-analysis type approach
Network meta-analyses are based on the assumption that the outcome of interest is transitive between
treatments on a suitable scale [4], so that;
dAB = dAC − dBC , (1)
where dAB signifies the difference in effect between treatments A and B. In the case of survival analysis
methods are available for conducting network meta-analysis on the log-hazard scale [30] (for example), or
on the parameters describing parametric survival curves [24]. The former method requires only estimates of
the log hazard ratios and is adopted as the basis for the more straightforward synthesis of the ATAC, CRC
and GRETA trial data in this analysis.
The analysis presented here is a hybrid of non-parametric and parametric methods. A parametric form
for the survival function for time to relapse is required to meta-analyse the results of ATAC, CRC and
GRETA. In the case of survival analysis methods are available for conducting network meta-analysis on the
log-hazard scale [30] (for example), or on the parameters describing parametric survival curves [24]. The
former method requires only estimates of the log hazard ratios and is adopted as the basis for the more
straightforward synthesis of the ATAC, CRC and GRETA trial data in this analysis. As shall be demonstrated
8

WORK IN PROGRESS, DO NOT CITE 2 METHODS & DATA
in section 2.5.3 the synthesis of evidence using the neoadjuvant trials is simplified if a parametric form is
assumed for the survival curves of time to relapse by response group introduced earlier in the section.
For the remainder of this section the full evidence synthesis model is specified step by step.
2.5 Step by step specification of evidence synthesis model
2.5.1 Step 1. Linking evidence from trials with relapse as an outcome using Normal likelihood
It is not necessary to make any parametric assumptions about the underlying survival curves for patients (in
nodes 1 2 3) in order to perform an indirect comparison on the log-hazard ratios. A fixed effects model4
based on a normal likelihood is used to synthesise the data as per Woods et al [30]. Using the notation of the
authors we have;
x̄s,k,b ∼N(ln
(hs,khs,b
), se2
s,k,b
)
where s indicates a study comparing treatment k to baseline b with x̄s,k,b and se2s,k,b the estimated log
hazard and corresponding variance, and ln(hs,khs,b
)is the predicted log hazard ratio for that study. Assuming
transitivity on the log-hazard scale we then have
ln(hs,khs,b
)= βk − βb
where βk is the log-hazard ratio for treatment k compared to treatment 1. This clearly implies that β1=0.
In our example treatment number corresponds with the node labels in Figure 2.2. Therefore β2 and β3
represent the log-hazard ratio compared with adjuvant anastrozole of adjuvant tamoxifen and PET tamoxifen
respectively.
In order to fit the model vague proper normal priors are assumed for the parameters β2 and β3. 5
2.5.2 Step 2. Synthesising evidence from the neoadjuvant trials
Meta-analysis of binary outcome data is often performed by combining over the log-odds ratio only. However,
as shall be seen in section 2.5.3 in this case the actual probabilities of response for the two treatments are
required 6.
An alternative method works by reposing the analysis as a logistic regression, modelling the logit of the
response probability on treatment group. The basic logistic regression model of response;
4Although a random effects model is preferable in a Bayesian meta-analysis [14] it is made difficult in this example by the smallnumber of studies being analysed. Attempts to fit the model with a random effect term using MCMC led to very high autocorrelationat distant lags for the β coefficients and other diagnostic assessments did not clearly suggest convergence of the chain after 200,000iterations.
5Specifically βi ∼N (0,106) for i = 2,36Equivalently, the odds of response for one group plus the relevant odds ratio.
9
WORK IN PROGRESS, DO NOT CITE 2 METHODS & DATA
StudyAnastrozole Tamoxifen
n R n R
IMPACT 113 42 108 39
PROACT 228 114 223 103
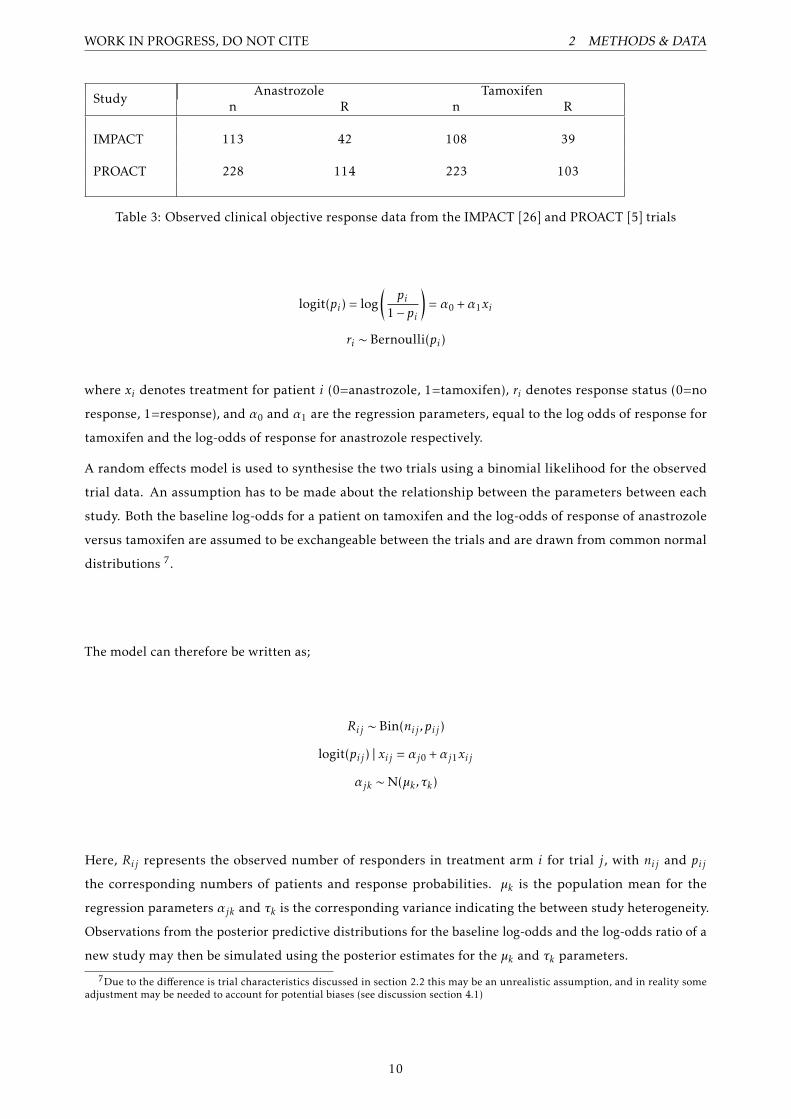
Table 3: Observed clinical objective response data from the IMPACT [26] and PROACT [5] trials
logit(pi) = log(pi
1− pi
)= α0 +α1xi
ri ∼ Bernoulli(pi)
where xi denotes treatment for patient i (0=anastrozole, 1=tamoxifen), ri denotes response status (0=no
response, 1=response), and α0 and α1 are the regression parameters, equal to the log odds of response for
tamoxifen and the log-odds of response for anastrozole respectively.
A random effects model is used to synthesise the two trials using a binomial likelihood for the observed
trial data. An assumption has to be made about the relationship between the parameters between each
study. Both the baseline log-odds for a patient on tamoxifen and the log-odds of response of anastrozole
versus tamoxifen are assumed to be exchangeable between the trials and are drawn from common normal
distributions 7.
The model can therefore be written as;
Rij ∼ Bin(nij ,pij )
logit(pij ) | xij = αj0 +αj1xij
αjk ∼N(µk , τk)
Here, Rij represents the observed number of responders in treatment arm i for trial j, with nij and pij
the corresponding numbers of patients and response probabilities. µk is the population mean for the
regression parameters αjk and τk is the corresponding variance indicating the between study heterogeneity.
Observations from the posterior predictive distributions for the baseline log-odds and the log-odds ratio of a
new study may then be simulated using the posterior estimates for the µk and τk parameters.
7Due to the difference is trial characteristics discussed in section 2.2 this may be an unrealistic assumption, and in reality someadjustment may be needed to account for potential biases (see discussion section 4.1)
10

WORK IN PROGRESS, DO NOT CITE 2 METHODS & DATA
This model is fit to the observed data from the trials given in Table 3. Vague proper normal prior distributions
are used for µ0 and µ1, and U[0,100] distributions are used for τ0 and τ18.
2.5.3 Step 3. Deriving distribution for hazard ratio of PET anastrozole against PET tamoxifen using
data from Ellis et al
If we accept the assumptions detailed in section 2.3, the marginal hazard function for time to recurrence
given an individual recieved treatment k, denoted htr=k , is given by;
htr=k(t) = wkhr=1(t) + (1−wk)hr=0(t)
where wk denotes the probability of response on treatment k and hr=1 and hr=0 denote the conditional hazard
function for time to recurrence for an individual given their response status. The hazard ratio can then be
found by dividing the hazard function for anastrozole by that for tamoxifen;
HRA,T =w1hr=1(t) + (1−w1)hr=0(t)w0hr=1(t) + (1−w0)hr=0(t)
(2)
We see that in order to derive the marginal hazards we require a functional form for both the conditional
hazard functions hr=0(t), hr=1(t) and the probability weights wk . Based on the results of the meta-analysis in
section 2.5.2 we have;
wk =(eα0+kα1
1 + eα0+kα1
)
We can sample values from the predictive posterior distribution of wk based on the IMPACT and PROACT
meta-analysis by plugging in sampled values from the posterior predictive distributions of α0 and α1, i.e.
from N(µk ,τk). This gives us estimates of the response probabilities we might expect from a new study.
Specification of the conditional hazards hr=i(t) requires us to assume a parametric model. In order to fit a
model to the data presented in Ellis et al an estimate of the individual patient data is required. To do this the
Kaplan-Meier curve presented as Figure 2-C in [12] was digitally extracted using the open source software
package Enguage Digitizer (available from http://digitizer.sourceforge.net/) and a life table estimate
of the underlying data was derived using the methods developed by Hoyle & Henley [18]. This method uses
the estimated survival probabilities, read off from the Kaplan-Meier curve, at time points between those at
which the numbers at risk are reported to obtain a more refined estimate of the underlying data, assuming
constant censoring in each reporting interval.
8This represents a vague prior belief, allowing for potentially very high heterogeneity, whilst preventing sampled values being soextreme as to cause problems in the MCMC procedure
11
WORK IN PROGRESS, DO NOT CITE 3 RESULTS
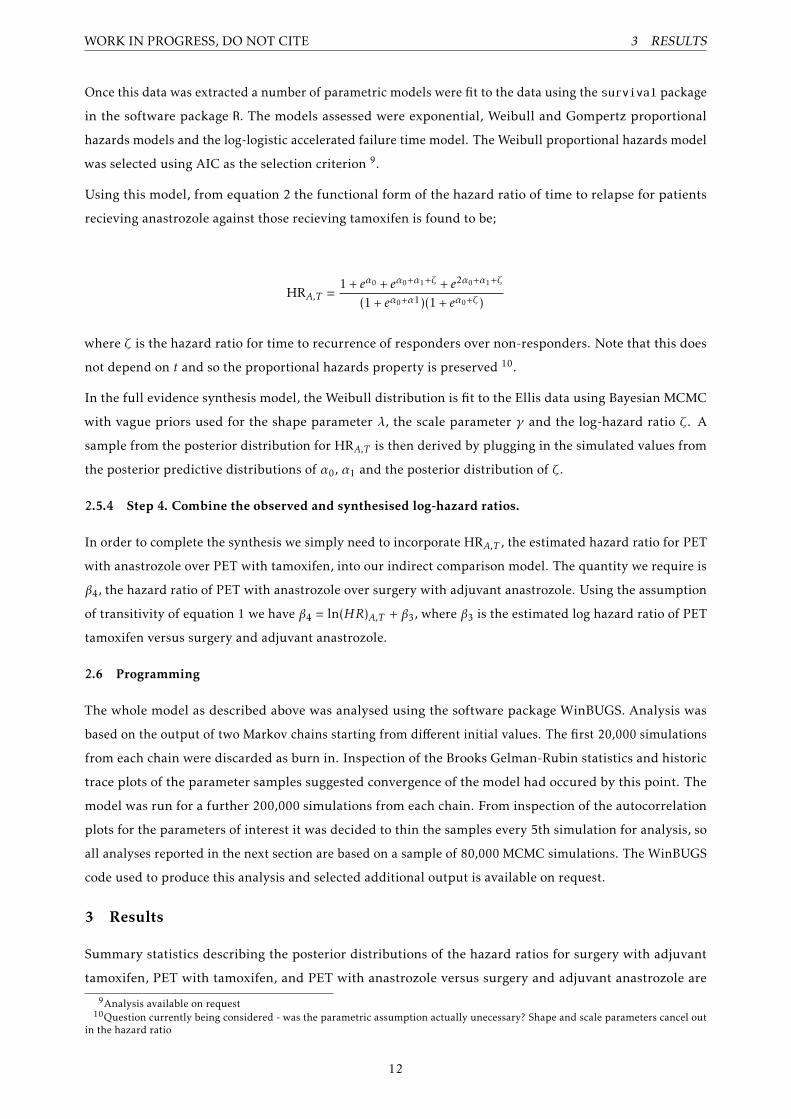
Once this data was extracted a number of parametric models were fit to the data using the survival package
in the software package R. The models assessed were exponential, Weibull and Gompertz proportional
hazards models and the log-logistic accelerated failure time model. The Weibull proportional hazards model
was selected using AIC as the selection criterion 9.
Using this model, from equation 2 the functional form of the hazard ratio of time to relapse for patients
recieving anastrozole against those recieving tamoxifen is found to be;
HRA,T =1 + eα0 + eα0+α1+ζ + e2α0+α1+ζ
(1 + eα0+α1)(1 + eα0+ζ)
where ζ is the hazard ratio for time to recurrence of responders over non-responders. Note that this does
not depend on t and so the proportional hazards property is preserved 10.
In the full evidence synthesis model, the Weibull distribution is fit to the Ellis data using Bayesian MCMC
with vague priors used for the shape parameter λ, the scale parameter γ and the log-hazard ratio ζ. A
sample from the posterior distribution for HRA,T is then derived by plugging in the simulated values from
the posterior predictive distributions of α0, α1 and the posterior distribution of ζ.
2.5.4 Step 4. Combine the observed and synthesised log-hazard ratios.
In order to complete the synthesis we simply need to incorporate HRA,T , the estimated hazard ratio for PET
with anastrozole over PET with tamoxifen, into our indirect comparison model. The quantity we require is
β4, the hazard ratio of PET with anastrozole over surgery with adjuvant anastrozole. Using the assumption
of transitivity of equation 1 we have β4 = ln(HR)A,T + β3, where β3 is the estimated log hazard ratio of PET
tamoxifen versus surgery and adjuvant anastrozole.
2.6 Programming
The whole model as described above was analysed using the software package WinBUGS. Analysis was
based on the output of two Markov chains starting from different initial values. The first 20,000 simulations
from each chain were discarded as burn in. Inspection of the Brooks Gelman-Rubin statistics and historic
trace plots of the parameter samples suggested convergence of the model had occured by this point. The
model was run for a further 200,000 simulations from each chain. From inspection of the autocorrelation
plots for the parameters of interest it was decided to thin the samples every 5th simulation for analysis, so
all analyses reported in the next section are based on a sample of 80,000 MCMC simulations. The WinBUGS
code used to produce this analysis and selected additional output is available on request.
3 Results
Summary statistics describing the posterior distributions of the hazard ratios for surgery with adjuvant
tamoxifen, PET with tamoxifen, and PET with anastrozole versus surgery and adjuvant anastrozole are
9Analysis available on request10Question currently being considered - was the parametric assumption actually unecessary? Shape and scale parameters cancel out
in the hazard ratio
12
WORK IN PROGRESS, DO NOT CITE 4 DISCUSSION
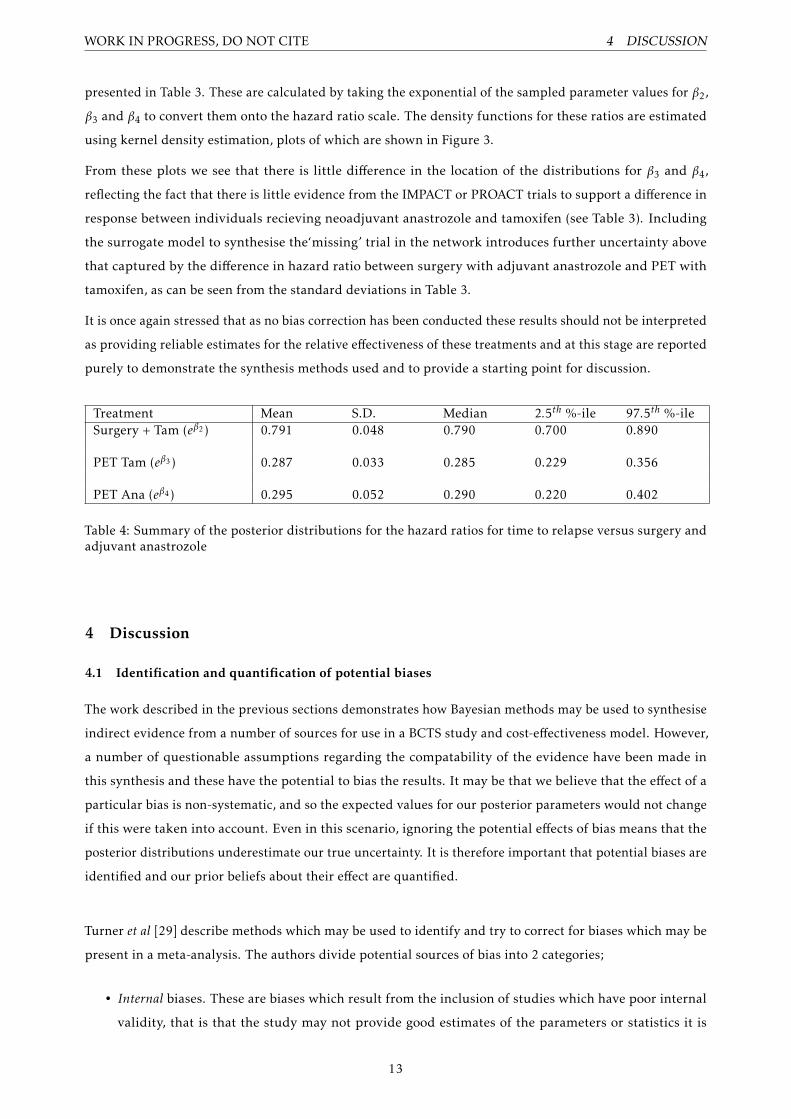
presented in Table 3. These are calculated by taking the exponential of the sampled parameter values for β2,
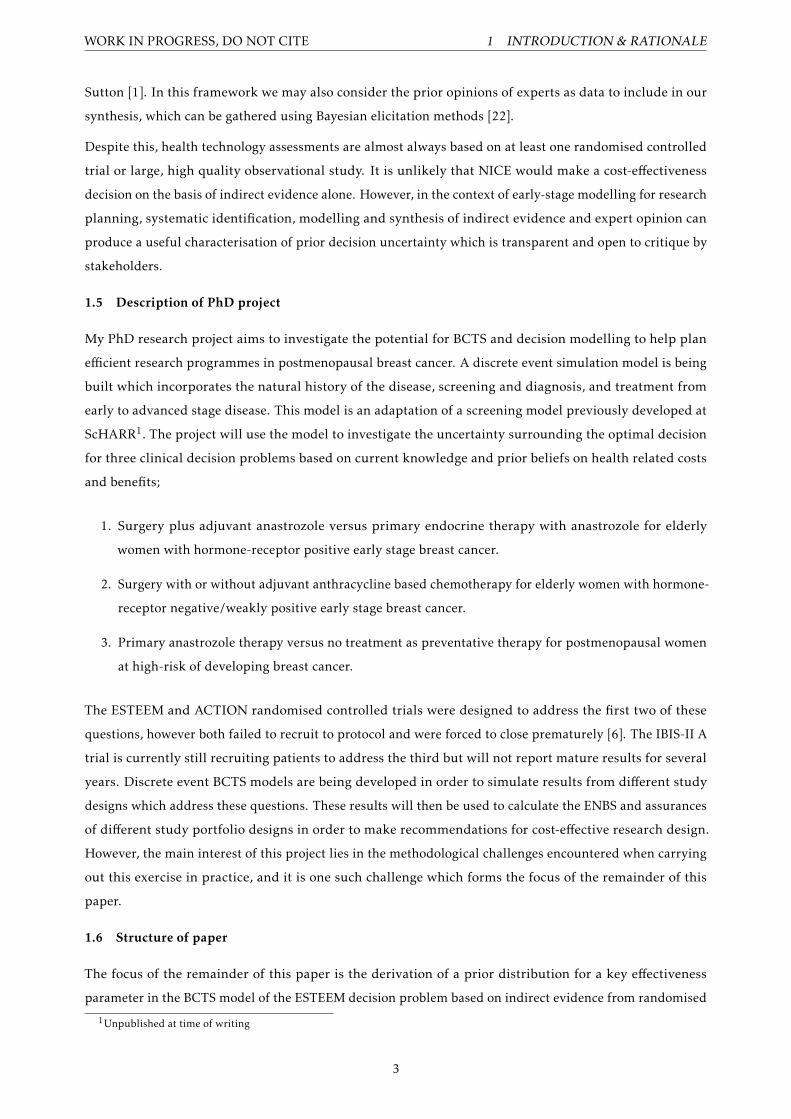
β3 and β4 to convert them onto the hazard ratio scale. The density functions for these ratios are estimated
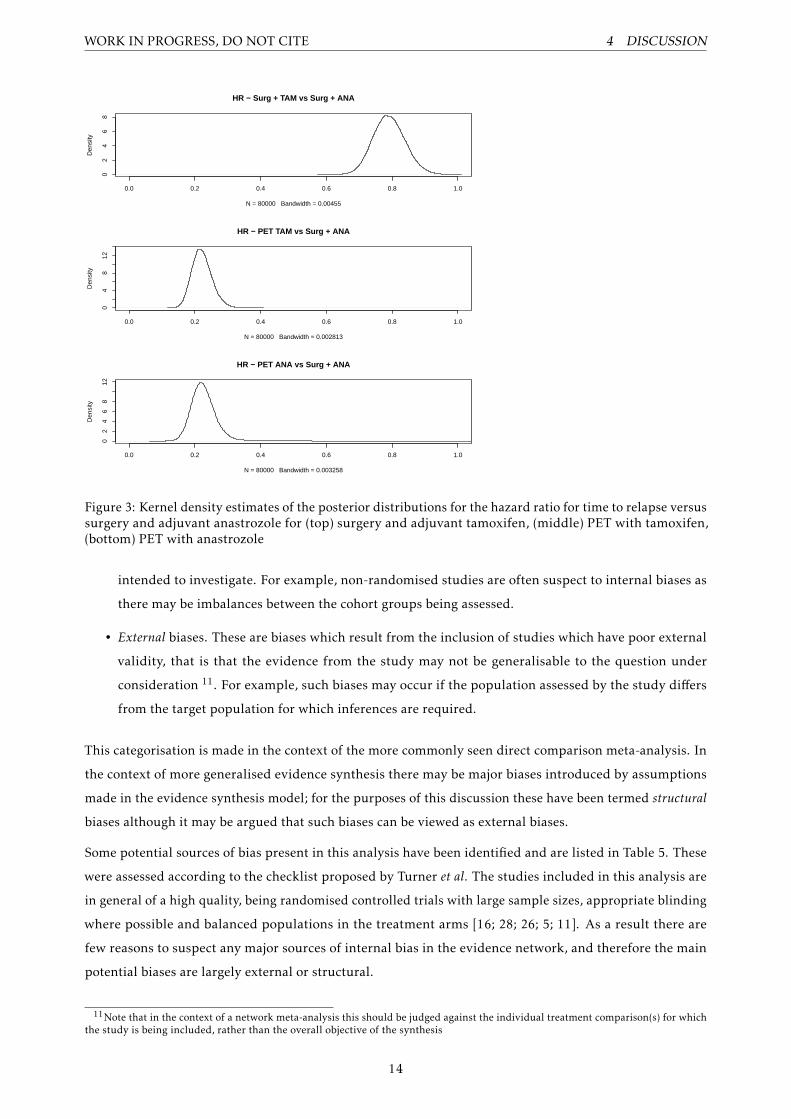
using kernel density estimation, plots of which are shown in Figure 3.
From these plots we see that there is little difference in the location of the distributions for β3 and β4,
reflecting the fact that there is little evidence from the IMPACT or PROACT trials to support a difference in
response between individuals recieving neoadjuvant anastrozole and tamoxifen (see Table 3). Including
the surrogate model to synthesise the‘missing’ trial in the network introduces further uncertainty above
that captured by the difference in hazard ratio between surgery with adjuvant anastrozole and PET with
tamoxifen, as can be seen from the standard deviations in Table 3.
It is once again stressed that as no bias correction has been conducted these results should not be interpreted
as providing reliable estimates for the relative effectiveness of these treatments and at this stage are reported
purely to demonstrate the synthesis methods used and to provide a starting point for discussion.
Treatment Mean S.D. Median 2.5th %-ile 97.5th %-ileSurgery + Tam (eβ2 ) 0.791 0.048 0.790 0.700 0.890
PET Tam (eβ3 ) 0.287 0.033 0.285 0.229 0.356
PET Ana (eβ4 ) 0.295 0.052 0.290 0.220 0.402
Table 4: Summary of the posterior distributions for the hazard ratios for time to relapse versus surgery andadjuvant anastrozole
4 Discussion
4.1 Identification and quantification of potential biases
The work described in the previous sections demonstrates how Bayesian methods may be used to synthesise
indirect evidence from a number of sources for use in a BCTS study and cost-effectiveness model. However,
a number of questionable assumptions regarding the compatability of the evidence have been made in
this synthesis and these have the potential to bias the results. It may be that we believe that the effect of a
particular bias is non-systematic, and so the expected values for our posterior parameters would not change
if this were taken into account. Even in this scenario, ignoring the potential effects of bias means that the
posterior distributions underestimate our true uncertainty. It is therefore important that potential biases are
identified and our prior beliefs about their effect are quantified.
Turner et al [29] describe methods which may be used to identify and try to correct for biases which may be
present in a meta-analysis. The authors divide potential sources of bias into 2 categories;
• Internal biases. These are biases which result from the inclusion of studies which have poor internal
validity, that is that the study may not provide good estimates of the parameters or statistics it is
13
WORK IN PROGRESS, DO NOT CITE 4 DISCUSSION
0.0 0.2 0.4 0.6 0.8 1.0
02
46
8HR − Surg + TAM vs Surg + ANA
N = 80000 Bandwidth = 0.00455
Den
sity
0.0 0.2 0.4 0.6 0.8 1.0
04
812
HR − PET TAM vs Surg + ANA
N = 80000 Bandwidth = 0.002813
Den
sity
0.0 0.2 0.4 0.6 0.8 1.0
02
46
812
HR − PET ANA vs Surg + ANA
N = 80000 Bandwidth = 0.003258
Den
sity
Figure 3: Kernel density estimates of the posterior distributions for the hazard ratio for time to relapse versussurgery and adjuvant anastrozole for (top) surgery and adjuvant tamoxifen, (middle) PET with tamoxifen,(bottom) PET with anastrozole
intended to investigate. For example, non-randomised studies are often suspect to internal biases as
there may be imbalances between the cohort groups being assessed.
• External biases. These are biases which result from the inclusion of studies which have poor external
validity, that is that the evidence from the study may not be generalisable to the question under
consideration 11. For example, such biases may occur if the population assessed by the study differs
from the target population for which inferences are required.
This categorisation is made in the context of the more commonly seen direct comparison meta-analysis. In
the context of more generalised evidence synthesis there may be major biases introduced by assumptions
made in the evidence synthesis model; for the purposes of this discussion these have been termed structural
biases although it may be argued that such biases can be viewed as external biases.
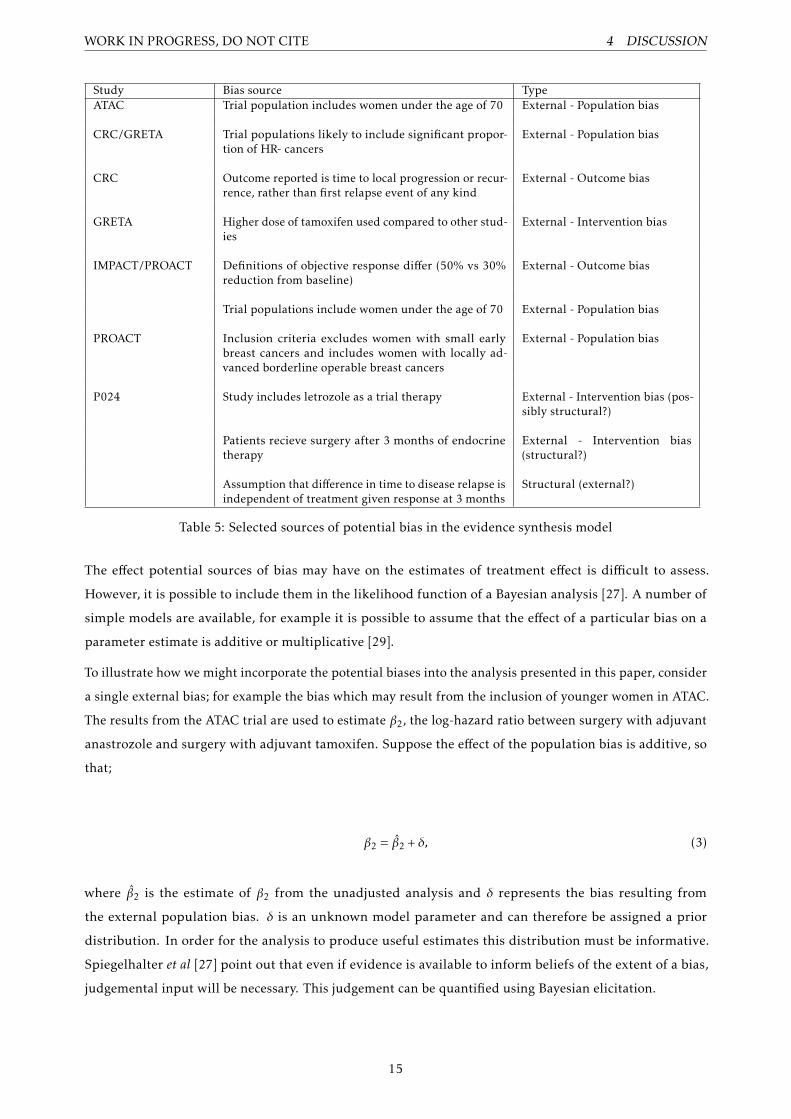
Some potential sources of bias present in this analysis have been identified and are listed in Table 5. These
were assessed according to the checklist proposed by Turner et al. The studies included in this analysis are
in general of a high quality, being randomised controlled trials with large sample sizes, appropriate blinding
where possible and balanced populations in the treatment arms [16; 28; 26; 5; 11]. As a result there are
few reasons to suspect any major sources of internal bias in the evidence network, and therefore the main
potential biases are largely external or structural.
11Note that in the context of a network meta-analysis this should be judged against the individual treatment comparison(s) for whichthe study is being included, rather than the overall objective of the synthesis
14
WORK IN PROGRESS, DO NOT CITE 4 DISCUSSION
Study Bias source TypeATAC Trial population includes women under the age of 70 External - Population bias
CRC/GRETA Trial populations likely to include significant propor-tion of HR- cancers
External - Population bias
CRC Outcome reported is time to local progression or recur-rence, rather than first relapse event of any kind
External - Outcome bias
GRETA Higher dose of tamoxifen used compared to other stud-ies
External - Intervention bias
IMPACT/PROACT Definitions of objective response differ (50% vs 30%reduction from baseline)
External - Outcome bias
Trial populations include women under the age of 70 External - Population bias
PROACT Inclusion criteria excludes women with small earlybreast cancers and includes women with locally ad-vanced borderline operable breast cancers
External - Population bias
P024 Study includes letrozole as a trial therapy External - Intervention bias (pos-sibly structural?)
Patients recieve surgery after 3 months of endocrinetherapy
External - Intervention bias(structural?)
Assumption that difference in time to disease relapse isindependent of treatment given response at 3 months
Structural (external?)
Table 5: Selected sources of potential bias in the evidence synthesis model
The effect potential sources of bias may have on the estimates of treatment effect is difficult to assess.
However, it is possible to include them in the likelihood function of a Bayesian analysis [27]. A number of
simple models are available, for example it is possible to assume that the effect of a particular bias on a
parameter estimate is additive or multiplicative [29].
To illustrate how we might incorporate the potential biases into the analysis presented in this paper, consider
a single external bias; for example the bias which may result from the inclusion of younger women in ATAC.
The results from the ATAC trial are used to estimate β2, the log-hazard ratio between surgery with adjuvant
anastrozole and surgery with adjuvant tamoxifen. Suppose the effect of the population bias is additive, so
that;
β2 = β̂2 + δ, (3)
where β̂2 is the estimate of β2 from the unadjusted analysis and δ represents the bias resulting from
the external population bias. δ is an unknown model parameter and can therefore be assigned a prior
distribution. In order for the analysis to produce useful estimates this distribution must be informative.
Spiegelhalter et al [27] point out that even if evidence is available to inform beliefs of the extent of a bias,
judgemental input will be necessary. This judgement can be quantified using Bayesian elicitation.
15

WORK IN PROGRESS, DO NOT CITE 4 DISCUSSION
Turner et al present a full bias elicitation case-study based on a meta-analysis of studies considering the
effectiveness of anti-D prohphylaxis for prevention of postnatal sensitization in Rhesus negative women,
however the authors report that this required a significant investment of time and is dependent on having
access to appropriate experts.
4.2 Direct elicitation of treatment effectiveness parameter
An alternative to eliciting the potential effects of bias in the network meta-analysis would be to elicit the
prior distribution for the difference in effectiveness of the two treatment strategies directly from clinical
experts. Although it is usually accepted that evidence from randomised or observed studies should be used
over clinical judgement where possible [15], in the context of research planning elicitation may well be
an acceptable alternative, particularly when the evidence base only helps address the research question
indirectly. Furthermore, any indirect evidence which is available may be presented to the expert prior to
elicitation. We could perhaps conceptualise the elicitation process as a model translating the evidence into a
prior distribution in the same way as the mathematical evidence synthesis. A key advantage of the direct
elicitation approach over bias elicitation is that it should be time saving as only one quantity needs to be
elicited per parameter, and the modelling effort is substantially reduced.
In practice the elicitation question must be framed carefully, as previous research has demonstrated that
individuals find it difficult to coherently answer questions about probabilities [22]. For example, in this
case study it may be preferable to ask questions about the expected number of relapses in each treatment
arm at selected time points for a hypothetical cohort, rather than talking about more abstract quantities
such as hazard ratios. Another consideration is the selection of appropriate individuals to elicit from. Hora
and von Winterfeldt [17] list 6 criteria for expert selection, including ’tangible evidnece of expertise’ and
’understanding of the problem area’. I would argue that whilst a clinical expert would satisfy these criteria
for direct elicitation, for bias elicitation it may be that input from a statistical expert is required instead
although the case is by no means clear cut.
At this stage it is unclear as to whether bias adjusted evidence synthesis methods or direct elicitation would
be preferable in the context of BCTS and cost-effectiveness modelling. This is the subject of an ongoing
study, with elicitation of both biases and direct estimates of treatment effectiveness scheduled for February
2012.
4.3 Other points for discussion
4.3.1 Generalisability of synthesis methods to other types of data
It should be noted that although the case study here considers treatment effectiveness, they could be applied
to consider other aspects of a decision model such as utilitiy values and resource use. It may be the case that
the most appropriate method for specifying the prior distribution will differ for different types of parameter,
although the principles of direct and indirect evidence and the analytic tools available for evidence synthesis
should be similar.
16
WORK IN PROGRESS, DO NOT CITE 4 DISCUSSION
4.3.2 Extent of evidence network
Although we have considered the potential biases due to including indirect evidence in our synthesis model
for our prior beliefs, bias is also possible if relevant evidence is omitted. In this example the approach
taken to formulating the network shown in Figure 2.2 was to identify the best quality evidence addressing
one part of the decision problem (ATAC) and attempt to find the ’shortest‘ network which permitted the
required comparison. The best approach to defining the scope of network meta-analyses is a subject of
ongoing research and debate [19].
4.3.3 Alternative specification of meta-analysis models
The meta-analysis of hazard ratios described in section 2.5.1 is based on a normal likelihood for the log-
hazard ratio, a commonly used method with sound basis in statistical theory. However, the log-hazard ratio
is not a sufficient statistic for the underlying survival distributions needed in the BCTS. One approach is to
estimate the hazard function for one of the treatments in the network for which there is sufficient data and
apply the hazard ratios to derive all the others. This should be done within the overall synthesis model if
possible. The choice of baseline hazard is somewhat arbitrary in this case, and if proportional hazards does
not hold accross all pairs of nodes in the network different choices will have different effects in the BCTS
model.
If at least a life-table estimate of the underlying data is available, Ouwens et al [24] describe a Bayesian
meta-analytic method which compares differences in parameters for the most commonly used survival
distributions. This allows the survival curves to be retrieved from the analysis for use in a simulation
model. It also obviates the need to assume proportional hazards, with the weaker assumption of common
parametric form required instead. Life table estimates can be digitally extracted from published survival
curves, as per section 2.5.3 in this paper. However, attempts to apply this method in our analyses were
unsuccessful (MCMC did not converge). The reason for this is unclear at this stage but it may be due to the
small number of studies being assessed.
4.3.4 Evidence synthesis for full HTA vs evidence synthesis for research planning
The discussion is concluded by returning to the theme discussed in section 2.5.1. In the Bayesian framework
any evidence which the decision maker feels is relevant to their beliefs about a parameter value should be
considered when making a decision. Despite this, health technology assessments are usually based on at
least one randomised controlled trial or large, high quality observational study which are directly related to
the decision problem being considered. Indirect evidence is usually only ever considered if such studies are
unavailable and/or unfeasible.
In light of this it could be argued that there is in fact a distinction between evidence which is relevant
at the full HTA stage of a decision problem and evidence which is relevant in research and development.
However, in the context of early-stage modelling for research planning, systematic identification, modelling
and synthesis of indirect evidence and expert opinion can produce a useful characterisation of prior decision
uncertainty which is transparent and open to critique by stakeholders.
17

WORK IN PROGRESS, DO NOT CITE REFERENCES
5 Conclusion and future work
In this paper we have shown how a prior distribution for an effectiveness parameter for a Bayesian clinical
trial simulation model can be derived from indirect evidence and suggested how this analysis could be
improved by correcting for different sources of bias through expert elicitation. Once this is complete the
next stage in the project is to apply this prior distribution to the BCTS model described above to assess the
cost-effectiveness of a number of study designs to address the ‘ESTEEM’ decision problem, by calculating
their expected net-benefit of sampling. This process is also being carried out for the other decision problems
described in section 1.5, and it is anticipated that this project will be complete in September 2012.
References
[1] A E Ades and A J Sutton, Multiparameter evidence synthesis in epidemiology and medical decision-making: current approaches, Journal
of the Royal Statistical Society A: Statistics in Society 169 (2006), 5–35.
[2] Alan Brennan and Samer Kharroubi, Efficient computation of partial expected value of sample information using bayesian approximation,
Journal of Health Economics 26 (2007), 122–148.
[3] Andrew Briggs, Karl Claxton, and Mark Sculpher, Decision modelling for health economic evaluation, first edition ed., Oxford
University Press, 2008.
[4] DM Caldwell, AE Ades, and JPT Higgins, Simultaneous comparison of multiple treatments: combining direct and indirect evidence,
British Medical Journal 331 (2005), 897–900.
[5] Luigi Cataliotti, Aman U Buzdar, Shinzaburo Noguchi, Jose Bines, Yuichi Takatsuka, Katarina Petrovka, Pierre Dube, and Celia
de Oliveira, Comparison of anastrozole versus tamoxifen as preoperative therapy in postmenopausal women with hormone receptor-positive
breast cancer, the pre-operative arimidex compared to tamoxifen (proact) trial, Cancer 106 (2006), no. 10, 2095–2103.
[6] K L Cheung, D A Morgan, L Winterbottom, H Richardson, I Ellis, and D Porock, A vision to potimise the management of primary
breast cancer in older women, The Breast 19 (2010), no. 2, 153–155.
[7] J Chilcott, A Brennan, A Booth, J Karnon, and P Tappenden, The role of modelling in prioritising and planning clinical trials., Health
technology assessment (Winchester, England) 7 (2003), no. 23, iii, 1–125.
[8] Karl Claxton, The irrelevance of inference: a decision-making approach to the stochastic evaluation of health care technologies, Jornal of
Health Economics 6 (1997), 217–227.
[9] Jack Cuzick, Ivana Sestak, Michael Baum, Aman Buzdar, Anthony Howell, Mitch Dowsett, and John F Forbes, Effect of anastrozole
and tamoxifen as adjuvant treatment for early-stage breast cancer: 10 year analysis of the atac trial, The Lancet (2010).
[10] Michael F Drummond, Mark J Sculpher, George W Torrance, Bernie O’Brien, and Gre L Stoddart, Methods for the economic
evaluation of health care programmes, third edition ed., Oxford Medical Publications, 2005.
[11] M J Ellis, A Coop, and B Singh, Letrozole is more effective neoadjuvant endocrine therapy than tamoxifen for eebb-1- and/or erbb-2-
positive estrogen receptor-positive primary breast cancer: evidence from a phase iii randomized trial, Journal of Clinical Oncology 19
(2001), no. 18, 3808–3816.
[12] Matthew J Ellis, Yu Tao, Jingqin Luo, Roger A’Hern, Dean B Evans, Ajay S Bhatnagar, Hilary A Chaudri-Ross, Alexander von
Kameke, William R Miller, Ian Smith, Wolfgang Eiermann, and Mitch Dowsett, Outcome prediction for estrogen receptor-positive
breast cancer based on postneoadjuvant endocrine therapy tumour characteristics, Journal of the National Cancer Institute 100 (2008),
no. 19, 1380–8.
[13] M Fennessy, T Bates, K MacRae, D Riley, J Houghton, and M Baum, Late follow-up of a randomized trial of surgery plus tamoxifen
versus tamoxifen alone in women aged over 70 years with operable breast cancer, British Journal of Surgery 91 (2004), no. 6, 699–704.
18

WORK IN PROGRESS, DO NOT CITE REFERENCES
[14] Andrew Gelman, John Carlin, Hal Stern, and Donald Rubin, Bayesian data analysis, CRC Press, 2004.
[15] Gordon Guyatt, Brian Haynes, Roman Jaeschke, Maureen O Meade, Mark Wilson, Victor Montori, and Scott Richardson, The
philosophy of evidence-based medicine, Users’ Guide to the Medical Literature, 2002.
[16] Daniel Hind, Lynda Wyld, Catherine Beverley, and Malcolm W Reed, Surgery versus primary endocrine therapy for operable primary
breast cancer in elderly women (70 years plus), Cochrane Database of Systematic Reviews 1 (2006), no. CD004272.
[17] S C Hora and D von Winterfeld, Nuclear waste and future societies: A look into the deep future,, Technological Forecasting and Social
Change 56 (1997), 155–170.
[18] Martin W Hoyle and William Henley, Improved curve fits to summary survival data: application to economic evaluation of health
technologies, BMC Medical Research Methodology 11 (2011), no. 139.
[19] Tianjing Li, Milo A Puhan, Swaroop S Vedula, Sonal Singh, and Kay Dickersin, Network meta-analysis - highly attractive but more
methodological research is needed., BMC Medicine 11 (2011), no. 139.
[20] G Mustacchi, R Ceccherini, S Milani, A Pluchinotta, A De Matteis, L Maiorino, A Farris, A Scanni, and F Sasso, Tamoxifen alone
verus adjuvant tamoxifen for operable breast cancer of the elderly: long-term results of the phase iii randomized controlled multicenter
greta trial, Annals of Oncology 14 (2003), 414–420.
[21] Richard M Nixon, Antony O’Hagan, Jeremy Oakley, Jason Madan, John Stevens, Nick Bansback, and Alan Brennan, The rheumatoid
arthiritis drug development model: a case study in bayesian clinical trial simulation, Pharmaceutical Statistics 8 (2009), 371–389.
[22] Anthony O’Hagan, Caitlin E Buck, Alireza Daneshkhah, J. Richard Eiser, Paul H Garthwaite, David J Jenkinson, Jeremy E Oakley,
and Tim Rakow, Uncertain judgements: Eliciting expert’s probabilities, first edition ed., Wiley, 2006.
[23] Anthony O’Hagan and John Stevens, Bayesian assessment of sample size for clinical trials of cost-effectiveness, Medical Decision
Making 21 (2001), 219–230.
[24] M Ouwens, Z Philips, and J Janse, Network meta-analysis of parametric survival curves, Research Synthesis Methods 1 (2010), no. 3,
258–271.
[25] Mahesh K B Parmar, Valter Tom, and Lesley Stewart, Extracting summary statistics to perform meta-analyses of the published literature
for survival endpoints, Statistics in Medicine 17 (1998), no. 24, 2815–2834.
[26] I E Smith, M Dowsett, S R Ebbs, J M Dixon, A Skene, J U Blohmer, S E Ashley, S Francis, I Boeddinghaus, and G Walsh, Neoadjuvant
treatment of postmenopausal breast cancer with anastrozole, tamoxifen, or both in combination: the immediate preoperative anastrozole,
tamoxifen, or combined with tamoxifen (impact) multicenter double-blind randomized trial, Journal of Clinical Oncology 23 (2005),
no. 22, 5108–5116.
[27] David J Spiegelhalter, Keith R Abrams, and Jonathon P Myles, Bayesian approaches to clinical trials and health-care evaluation, Wiley,
2004.
[28] The ATAC (Arimidex, Tamoxifen Alone or in Combination) Trialists’ Group, Anastrozole alone or in combination with tamoxifen
versus tamoxifen alone for adjuvant treatment of postmenopausal women with early breast cancer: first results of the atac randomised
trial, The Lancet 359 (2002), 2131–2139.
[29] Rebecca M Turner, David J Spiegelhalter, Gordon C S Smith, and Simon G Thompson, Bias modelling in evidence synthesis, Journal
of the Royal Statistical Society A: Statistics in Society 172 (2009), 21–47.
[30] Beth S Woods, Neil Hawkins, and David A Scott, Network meta-analysis on the log-hazard scale, combining count and hazard ratio
statistics accounting for multi-arm trials: A tutorial, BMC Medical Research Methodology 10 (2010), no. 54, 219–230.
[31] L Wyld, D K Garg, I D Kumar, H Brown, and M W Reed, Stage and treatment variation with age in postmenopausal women with
breast cancer: compliance with guidelines, British Journal of Cancer 90 (2004), 1486–1491.
19