spitzer and the sombrero galaxy (ngc 4594) - arxiv · arxiv:astro-ph/0603160v1 7 mar 2006...
TRANSCRIPT

arX
iv:a
stro
-ph/
0603
160v
1 7
Mar
200
6
Spitzer and JCMT Observations of the Active Galactic Nucleus in
the Sombrero Galaxy (NGC 4594)
George J. Bendo1,2, Brent A. Buckalew3 Daniel A. Dale4, Bruce T. Draine5, Robert D.
Joseph6, Robert C. Kennicutt, Jr.7,2, Kartik Sheth3, John-David T. Smith2, Fabian
Walter8, Daniela Calzetti9, John M. Cannon8, Charles W. Engelbracht2, Karl D. Gordon2,
George Helou3, David Hollenbach10, Eric J. Murphy11, and Helene Roussel8
ABSTRACT
We present Spitzer 3.6-160 µm images, Spitzer mid-infrared spectra, and
JCMT SCUBA 850 µm images of the Sombrero Galaxy (NGC 4594), an Sa
galaxy with a 109 M⊙ low luminosity active galactic nucleus (AGN). The bright-
est infrared sources in the galaxy are the nucleus and the dust ring. The spectral
energy distribution of the AGN demonstrates that, while the environment around
the AGN is a prominent source of mid-infrared emission, it is a relatively weak
source of far-infrared emission, as had been inferred for AGN in previous research.
The weak nuclear 160 µm emission and the negligible polycyclic aromatic hydro-
carbon emission from the nucleus also implies that the nucleus is a site of only
weak star formation activity and the nucleus contains relatively little cool in-
terstellar gas needed to fuel such activity. We propose that this galaxy may
be representative of a subset of low ionization nuclear emission region galaxies
1Astrophysics Group, Imperial College, Blackett Laboratory, Prince Consort Road, London SW7 2AZ,
United Kingdom; [email protected]
2Steward Observatory, University of Arizona, 933 North Cherry Avenue, Tucson, AZ 85721 USA.
3California Institute of Technology, MC 314-6, Pasadena, CA 91101 USA.
4Department of Physics and Astronomy, University of Wyoming, Laramie, WY 82071 USA.
5Princeton University Observatory, Peyton Hall, Princeton, NJ 08544-1001 USA.
6Institute for Astronomy, University of Hawaii, 2680 Woodlawn Drive, Honolulu, HI 96822 USA.
7Institute of Astronomy, University of Cambridge, Cambridge CB3 0HA, United Kingdom
8Max-Planck-Institut fur Astronomie, Konigstuhl 17, D-69117 Heidelberg, Germany
9Space Telescope Science Institute, 3700 San Martin Drive, Baltimore, MD 21218 USA.
10NASA Ames Research Center, MS 245-3, Moffett Field, CA 94035-1000 USA.
11Department of Astronomy, Yale University, P.O. Box 208101, New Haven, CT 06520 USA.

– 2 –
that are in a quiescent AGN phase because of the lack of gas needed to fuel
circumnuclear star formation and Seyfert-like AGN activity. Surprisingly, the
AGN is the predominant source of 850 µm emission. We examine the possible
emission mechanisms that could give rise to the 850 µm emission and find that
neither thermal dust emission, CO line emission, bremsstrahlung emission, nor
the synchrotron emission observed at radio wavelengths can adequately explain
the measured 850 µm flux density by themselves. The remaining possibilities
for the source of the 850 µm emission include a combination of known emission
mechanisms, synchrotron emission that is self-absorbed at wavelengths longer
than 850 µm, or unidentified spectral lines in the 850 µm band.
Subject headings: galaxies: active, galaxies: individual (NGC 4594), galaxies:
ISM, galaxies: nuclei, infrared: galaxies
1. Introduction
A key yet simple point in understanding the infrared spectral energy distributions
(SEDs) of galaxies is separating the component of the dust emission that is primarily heated
by an active galactic nucleus (AGN) from the component that is primarily heated by star for-
mation. Such simple knowledge is vital for examining the connection between starbursts and
AGN, particularly those that are dust-enshrouded; for modeling the SEDs of dust emission
from galaxies; for validating or modifying the unified model of AGN; and for understand-
ing distant, unresolved AGN. This issue is especially important in debates on the origins of
far-infrared emission in powerful AGNs such as quasi-stellar objects (see Genzel & Cesarsky
2000, for a discussion).
Results from the Infrared Astronomical Satellite (IRAS) have shown that the 60 µm / 25 µm
flux ratios of Seyfert galaxies and other AGN were lower than for starbursts and other spiral
galaxies (e.g. de Grijp et al. 1985; Osterbrock & de Roberts 1985; de Grijp et al. 1987; Kai-
ley & Lebofsky 1987; Rodriguez Espinosa et al. 1987; Rowan-Robinson & Crawford 1989).
The enhancement in the 25 µm emission was interpreted as originating from the environ-
ment of the AGN, whereas the 60 and 100 µm emission was interpreted as originating from
star formation activity. However, since both the AGN and star formation were co-spatial,
disentangling the infrared SEDs of both has proved to be difficult.
A few studies that either combined ground-based mid-infrared and IRAS data (e.g.
Maiolino et al. 1995) or used Infrared Space Observatory data (e.g. Rodriguez Espinosa &
Perez Garcia 1997; Perez Garcia et al. 1998, 2000) began to separate the infrared emission
– 3 –
from AGN and star formation in nearby galaxies. Most of the evidence suggesting that
the far-infrared emission is related to star formation rather than AGN activity relies on
the similarities between the far-infrared SEDs of Seyfert and non-Seyfert galaxies, on the
consistency of the far-infrared SEDs in a broad range of Seyfert galaxies, and on the relation
between far-infrared emission and stellar emission. While these results are good evidence for
the far-infrared emission of Seyfert galaxies originating from circumnuclear star formation,
the results are only inferences.
Generally, it is very challenging to separate the infrared emission from dust heated by
an AGN and the infrared emission from dust heated by circumnuclear star formation. The
problem lies not only with the limited resolution of previous instrumentation. The major
problem is that many nearby Seyfert galaxies have circumnuclear star formation that will
produce centralized dust emission that is difficult to disentangle from far-infrared emission
from dust heated by the AGN. Both sources of emission are effectively superimposed.
The Sombrero Galaxy (NGC 4954) at a distance of 9.2 Mpc (the average of measure-
ments from Ford et al. (1996) and Ajhar et al. (1997)) is ideal for studying the separate
SEDs of dust heated by the AGN and dust heated by starlight. The galaxy’s nucleus is
classified in Ho et al. (1997) as a low ionization nuclear emission region (LINER). It does
contain a supermassive black hole with a mass of 109 M⊙ (Kormendy et al. 1996), and the
AGN is detected as a point source in hard X-ray (e.g. Pellegrini et al. 2002, 2003) and radio
(e.g. Hummel et al. 1984) emission. What makes this particular LINER unique is that the
the geometry of the mid- and far-infrared dust emission is relatively easy to model, and the
dust that is primarily heated by star formation is mostly concentrated in a ring relatively
far from the AGN, as shall be demonstrated in this paper. Therefore, the SED of the dust
heated by the AGN can be separated from the SED of the diffuse interstellar dust. This
galaxy has been studied in the infrared/submillimeter waveband in previous works (e.g. Rice
et al. 1988; Schmitt et al. 1997; Krause et al. 2005), but these studies were limited by the
resolution of the IRAS data and could only examine the global SED in the far-infrared.
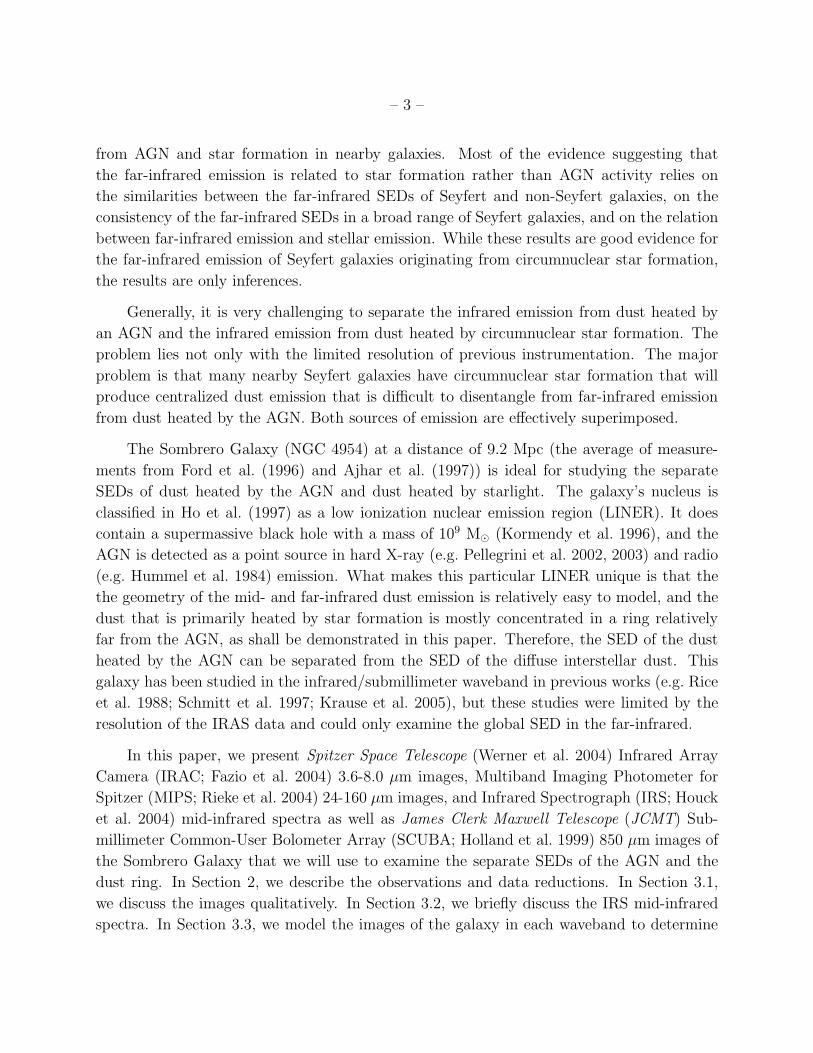
In this paper, we present Spitzer Space Telescope (Werner et al. 2004) Infrared Array
Camera (IRAC; Fazio et al. 2004) 3.6-8.0 µm images, Multiband Imaging Photometer for
Spitzer (MIPS; Rieke et al. 2004) 24-160 µm images, and Infrared Spectrograph (IRS; Houck
et al. 2004) mid-infrared spectra as well as James Clerk Maxwell Telescope (JCMT) Sub-
millimeter Common-User Bolometer Array (SCUBA; Holland et al. 1999) 850 µm images of
the Sombrero Galaxy that we will use to examine the separate SEDs of the AGN and the
dust ring. In Section 2, we describe the observations and data reductions. In Section 3.1,
we discuss the images qualitatively. In Section 3.2, we briefly discuss the IRS mid-infrared
spectra. In Section 3.3, we model the images of the galaxy in each waveband to determine

– 4 –
SEDs for global emission and for the separate physical components of the galaxy. Then, in
Section 4, we discuss the major results from the SED of the AGN.
2. Observations and Data Reduction
2.1. 3.6-8.0 µm Images
The 3.6 - 8.0 µm data were taken with IRAC on the Spitzer Space Telescope on 2004
June 10 in IRAC campaign 9 and on 2005 January 22 in IRAC Campaign 18 as part of
the SINGS survey (Kennicutt et al. 2003). The observations consist of a series of 5′ × 5′
individual frames that are offset 2.′5 from each other. The two separate sets of observations
allow asteroids to be recognized and provide observations at orientations up to a few degrees
apart to ease removal of detector artifacts. Points in the center are imaged eight times in 30
s exposures. The full-width half-maxima (FWHM) of the point spread functions (PSFs) are
1.′′6− 1.′′9 for the four wavebands.
The data are processed using a special SINGS IRAC pipeline. First, a geometric distor-
tion correction is applied to the individual frames. Data from the second set of observations
are rotated to the same orientation as the first set of observations. Bias levels are subtracted
from the 5.7 µm data by subtracting a bias frame (made by combining all data frames for
the observations) from each frame. Next, the image offsets are determined through image
cross-correlation. Following this, bias drift is removed. Finally, cosmic ray masks are cre-
ated using standard drizzle methods, and final image mosaics are created using a drizzle
technique. The final pixel scales are set at ∼ 0.′′75. A final background is measured in small
regions outside the target that are free of bright foreground/background sources, and then
this final background is subtracted from the data. The contribution of uncertainties in the
background (both in terms of the statistical fluctuations of the pixels and the uncertainty in
the mean background subtracted from the data) to uncertainties in the integrated global flux
densities is less than 0.1%. The dominant source of uncertainty is the 30% uncertainty in
the calibration factor (including the uncertainty in the extended source calibration) applied
to the final mosaics.
2.2. 24-160 µm Images
The 24, 70, and 160 µm data were taken with MIPS on the Spitzer Space Telescope on
2004 July 10 and 12 in MIPS campaign 10 as part of the SINGS survey. The observations
were obtained using the scan-mapping mode in two separate visits to the galaxy. Two

– 5 –
separate sets of observations separated by more than 24 h allow asteroids to be recognized
and provide observations at orientations up to a few degrees apart to ease removal of detector
artifacts. As a result of redundancy inherent in the scan-mapping mode, each pixel in the
core map area was effectively observed 40, 20, and 4 times at 24, 70, and 160 µm, respectively,
resulting in integration times per pixel of 160 s, 80 s, and 16 s, respectively. The FWHM of
the PSFs of the 24, 70, and 160 µm data are 6′′, 15′′, and 40′′, respectively.
The MIPS data were processed using the MIPS Data Analysis Tools (Gordon et al.
2005) version 2.80. The processing for the 24 µm data differed notably from the 70 and
160 µm data, so they will be discussed separately.
First, the 24 µm images were processed through a droop correction (that removes an
excess signal in each pixel that is proportional to the signal in the entire array) and a
non-linearity correction. Following this, the dark current was subtracted. Next, scan-mirror-
position dependent flats and scan-mirror-position independent flats were applied to the data.
Latent images from bright sources, erroneously high or low pixel values, and unusually noisy
frames were also masked out. Finally, mosaics of the data from each set of observations were
made. In each mosaic, the background was subtracted in two steps. First, to remove the
broad zodiacal light emission, a function that varied linearly in the x and y directions was
fit to the region outside the optical disk in a box three times the size of the optical major
axis of the galaxy. This plane was then subtracted from the data. Next, to remove residual
background emission from cirrus structure near the galaxy, an additional offset measured
in multiple small circular regions near the optical disk was subtracted. After this final
subtraction, the two mosaics were averaged together to produce the final 24 µm mosaic.
In the 70 and 160 µm data, readout jumps and cosmic ray hits were first removed from
the data. Next, the stim flash frames taken by the instrument were used as responsivity
corrections. The dark current was subtracted from the data, an illumination correction was
applied, and then short term variations in signal (i.e. short-term drift) were subtracted from
the data. (This last step also subtracts off the background.) Following this, erroneously high
or low pixel values were identified statistically or visually and removed from the data. Single
70 and 160 µm mosaics were made from all of the data, and a residual offset measured in
two regions to the north and south of the target was subtracted from the final maps.
The background noise is a relatively small contributor (less than 0.1%) to the uncer-
tainties in the integrated global flux densities. The dominant source of uncertainty is the
uncertainty in the calibration factors applied to the final mosaic, which is 10% at 24 µm and
20% at 70 and 160 µm.

– 6 –
2.3. 850 µm Image
The 850 µm data were taken with SCUBA at the JCMT on UT dates 2004 January
17-18. Six maps (each of which were ten integrations, or 10.7 min of on-target integration)
were taken in jiggle map mode, with each map covering 2.′3 hexagonal regions. Each map
was slightly offset from the others to ensure that no holes in the maps were created by noisy
bolometers. The total map effectively covers the inner 3′×2.′25 region of the galaxy, with 60
integrations (64 min of on-target integration) of observing time of the galaxy nucleus. The
FWHM of the PSF of the 850 µm data is 15′′.
The 850 µm data were processed with the SCUBA User Reduction Facility (Jenness &
Lightfoot 1998). The data were first flatfielded and corrected for atmospheric extinction.
Noisy bolometers were removed next, followed by spike removal. Then the background sig-
nal was subtracted using the signal from several bolometers at the north and south edges
of the images. The data were calibrated using observations of the submillimeter standards
CRL 618 and IRC +10216 and then regridded onto the sky plane. An additional back-
ground subtraction was then performed to remove any residual offset that appears when the
bolometer signals are regridded onto the sky plane. The background noise is a relatively
small contributor to the uncertainties in the integrated fluxes (approximately 1%) . The
dominant source of uncertainty is the 10% uncertainty in the calibration factor applied to
the final image.
2.4. Mid-Infrared Spectra
The 5-38 µm spectra were taken with IRS on the Spitzer Space Telescope on 2004 June
24 and 28 in IRS campaign 9 as part of the SINGS survey. The observations were taken
in the spectral mapping mode, in which the slit is moved in a raster pattern to build up
a redundantly-sampled spectral map of the target region. The observations presented here
were made with the short-low (5-15 µm, R=50-100), long-low (14-38 µm, R=50-100), and
long-high (20-37 µm, R=600) IRS modules. The observations were made as a series of
pointings where the spectrometer’s slits were stepped across the center of the galaxy. As a
result, the observations produce spectral cubes. The sizes of the observed regions depend
primarily on the specific module used for the observation.
S12 processed BCD data were used for this analysis. The data were assembled into three-
dimensional spectral cubes using Cubism (see Kennicutt et al. 2003, Section 6.2). When the
spectral cubes are built, bad pixels are identified and masked out, background subtraction
is performed, and flux calibration is applied to the data. The calibration uncertainties are

– 7 –
25 %.
3. Results
3.1. Images of NGC 4594
Figure 1 shows the 3.6, 8, 24, 70, 160, and 850 µm images of NGC 4594. Throughout
these wavebands, the sources of emission consist mainly of a nuclear source, a ring with an
approximate semimajor axis of ∼ 140′′ (∼ 6.2 kpc), a thin disk inside the ring composed
of stars and dust (referred to as the inner disk in this paper), and a bulge. The relative
contributions of each of these components to each waveband vary substantially. Aside from
these four components, no other significant sources of emission are visible in the galaxy.
In nearby galaxies, the 3.6 µm band is dominated by stellar emission (e.g. Lu et al.
2003). In NGC 4594, the bulge and the inner disk are the two extended features with the
highest surface brightnesses at this waveband. The ring is nearly invisible.
The 8 µm emission from spiral galaxies contains a mixture of polycyclic aromatic hydro-
carbon (PAH) emission, hot thermal emission from very small grains, and the Rayleigh-Jeans
tail of stellar blackbody emission (e.g. Helou et al. 2000; Lu et al. 2003). In the observations
of NGC 4594 in this waveband, the ring is a much more prominent source of emission, which
implies that it is a strong source of PAH and hot dust emission. Note that the ring (at this
resolution) is relatively featureless; only a few knots of enhanced 8 µm emission are visible
in the ring. Small extensions from the ring that resemble spiral arms are just barely visible
on the east and west ends of the ring. Emission from the inner disk is still visible in this
waveband. The bulge emission, which originates from stars (and possibly from hot dust in
the atmospheres of evolved stars), is much weaker than at 3.6 µm.
The 24 µm band mostly traces very small grain emission (e.g. Li & Draine 2001),
although it could also include stellar emission or thermal emission from strongly-heated
large dust grains. In this waveband, the nucleus is a more prominent source of emission than
at shorter wavelengths. The ring and the inner disk are also still strong sources of emission.
Except for a bright knot in the southwest portion of the ring, the ring contains no notable
structures. The bulge almost disappears completely at this wavelength, although faint traces
of the emission are still visible to the north and south of the ring.
The 70 µm band is one of two bands used in this paper that primarily traces large grain
emission (e.g. Li & Draine 2001). The appearance of the 70 µm image looks similar to the
24 µm image. The nucleus, the inner dust disk, and the ring are all still visible, but the bulge

– 8 –
is indistinguishable from the background noise (as is expected, since little cool interstellar
dust is associated with the bulges of galaxies).
In the 160 µm band, which also traces large grain emission (e.g. Li & Draine 2001),
the ring is the most prominent source. The inner disk is a weak source of emission in this
waveband, and it cannot be easily distinguished from the ring. In stark contrast to the 24
and 70 µm images, the nucleus is almost completely invisible. These results suggest that
the environment of the active nucleus contains relatively little dust and that the dust that
is present is heated very strongly.
Even more surprising than the relatively weak 160 µm emission from the nucleus is
the relatively strong emission from the nucleus observed at 850 µm. Typically, the 850 µm
emission traces ∼20-30 K dust emission related to the 160 µm emission (e.g. Dunne & Eales
2001; Bendo et al. 2003; Regan et al. 2004). If these previous results applied to this galaxy,
then the ring would be the strongest feature observed at 850 µm, and the nucleus would
be relatively faint. Instead, the nucleus is the only submillimeter source detected above the
3σ level, which implies that the submillimeter emission arises from some source other than
∼20-30 K dust.
To understand these images better, we will need to create models of the images that
include components for each of the images. The results of fitting the models to the data will
include flux densities that can be used to construct SEDs. This is done in Section 3.3. First,
however, we will look at the results from the mid-infrared spectroscopy.
3.2. Mid-Infrared Spectra of the Nucleus and Ring
We can further examine the nature of the nucleus and ring of this galaxy using the IRS
spectra. The goal is to understand the primary sources of the dust heating in the nucleus
and ring, and specifically to understand if the dust in the nucleus is heated by star formation
or by the AGN. An AGN is clearly present in this galaxy, since a central synchrotron source
has been detected in radio (e.g. Hummel et al. 1984) and X-ray (e.g. Pellegrini et al. 2002,
2003) observations and a 109 M⊙ central object has been detected through stellar dynamics
(Kormendy et al. 1996). The results for this galaxy will reveal whether the AGN is the
dominant energy source for the nucleus or if star formation is a significant factor. These
data can also be used as a test of mid-infrared spectral line diagnostics on the spectrum of
a known low-luminosity AGN.
The regions in which spectra were extracted are shown in Figure 2. Spectra for individual
regions in the galaxy are shown in Figure 3 and 4. Notable features measured in the spectrum

– 9 –
of the AGN are listed in Table 1.
The nuclear spectrum is consistent with what is expected from an AGN. Metal lines
such as [Ne II], [Ne III], [O IV], and [S III] are present, but PAH features (such as the features
at 6.2, 7.7, 11.3, 16.4, and 17.1 µm are weak or absent. Interestingly, some high excitation
lines, notably the [Ne V] line at 14.3 µm, are also absent. This is not surprising, as this is
a LINER nucleus with low levels of ionization, although [Ne V] emission often corresponds
to AGN activity. The absence of these high excitation lines in this galaxy’s spectrum may
have implications for using high excitation lines as a diagnostic for detecting AGNs in other
LINERs. Aside from the absence of high excitation lines, the spectral lines are consistent
with AGN activity. In the diagnostic diagrams of Genzel et al. (1998) and Peeters et al.
(2004), the high [O IV] / [Ne II] ratio and the weak 6.2 and 7.7 µm PAH features indicate
that this is a source dominated by AGN activity. In the alternate diagnostic diagram of
D. A. Dale et al. (2006, in preparation), where the 34.8 µm [Si II] is used in place of the
25.9 µm [O IV] line, the nucleus also falls in the AGN dominated regime.
The spectrum of the ring is more consistent with star formation activity than the nucleus.
PAH emission from the ring, especially in the 11.3 µm band, is much stronger. Qualitatively,
the stronger PAH features would shift this galaxy into the star formation regime in the
diagnostic diagrams of Genzel et al. (1998), Peeters et al. (2004), and D. A. Dale et al.
(2006, in preparation). Unfortunately, the observations are too limited to show that the
spectrum of the ring is consistent with star formation. The long-high observations, which
are needed to measure the 25.9 µm [O IV] line, do not adequately cover the ring. The signal-
to-noise ratio is too low for the low-resolution spectrum between 5 and 8 µm for accurate
measurement of the 6.2 and 7.7 µm PAH features. Finally, because of the limitations of
the spatial resolution, a significant fraction of the flux at wavelengths greater than 20 µm
may include emission from the AGN, thus making measurements of the 25.9 µm [O IV] and
34.8 µm [Si II] lines suspect.
Images of the 11.3 µm PAH feature and 25.9 µm [O IV] line emission in Figure 5 bolster
these results. These images were made from the IRS data. To produce the images, the
continuum was identified and subtracted on a pixel-by-pixel basis, leaving just the spectral
feature emission. In the resulting map for the PAH feature, the emission originates entirely
from the ring of the galaxy. Even if PAH emission is treated as only a qualitative tracer
of star formation, these results suggest that the star formation is confined to the ring. The
[O IV] emission, however, originates mostly from the nucleus. These results from the PAH
and [O IV] maps are consistent with the interpretation of an AGN dominating the energetics
of the nucleus.
Although generally the absence of nuclear PAH emission implies weak star formation

– 10 –
activity (e.g. Genzel et al. 1998; Peeters et al. 2004), PAH emission may be absent in some
situations where strong star formation is present. PAH emission is absent in low metallicity
star formation regions (e.g. Engelbracht et al. 2005). This could be an explanation for the
absence of PAH emission from the nucleus of NGC 4594. However, since the metallicity of
the ISM usually peaks in the centers of galaxies and since PAH emission is seen in the ring,
the metallicity of the center is probably above the metallicity threshold necessary for PAH
emission. PAH emission may also be absent in star formation regions because of the presence
of hard radiation fields (e.g. Madden et al. 2005). If this is the case for NGC 4594, the hard
radiation field would be from the AGN, which is the dominant source of X-ray photons in the
nuclear environment (Pellegrini et al. 2002, 2003). So, even if circumnuclear star formation is
present, the AGN still dominates the interstellar radiation field in the vicinity of the nucleus.
Placed in the context of dust heating, the weak nuclear PAH emission indicates that the dust
emission is primarily heated by the AGN.
3.3. Broadband Spectral Energy Distributions for the Different Spatial
Components
To further investigate the dust heated by the AGN (which we will refer to as the AGN
emission for simplicity), we will examine the 3.6 - 850 µm broadband SEDs. First, it is
necessary to separate the emission from the AGN from the various other spatial components
in the galaxy, so we will first model the 3.6-160 µm images in Section 3.3.1. The parameters
from the models fit to the data include flux densities that are then used to construct SEDs.
These SEDs are analyzed in Section 3.3.2.
3.3.1. Image Modeling
The basic image models consists of four parts: an unresolved nuclear point source (from
the region heated by the AGN), a dust ring with a radius and radial width described by the
Gaussian function e−(r−r0)
2
2w2 , an inner dust disk with an exponential profile described as e−rh
that was truncated at the radius of the ring, and a bulge with a simplified de Vaucouleurs
profile e−7.67r0.25ell , where rell = (( x
rx)2 + ( y
ry)2)0.5 (with rx and ry representing the semimajor
and semiminor axes of the ellipse that contains half of the total light from the bulge). Each
component also has a scaling term that gives the total flux density of the component. These
components were convolved to the resolutions of the various Spitzer wavebands with PSFs

– 11 –
created with STinyTim1, a PSF simulator designed for Spitzer (Krist 2002). An additional
background term was also included in the analysis, although this term was statistically
consistent with zero.
To streamline the processing, a few simplifications were made in the modeling. The
galaxy center was fixed to match the observed galaxy center. The ratio of the minor and
major axes for the disk and the ring were treated as only one free parameter (i.e. the ratios
were the same for the ring and disk). The position angle of the major axes for the ring, disk,
and bulge components was also treated as only one free parameter. The models were fit only
to the region enclosed by the ellipse where the B-band surface brightness reaches 25 mag
arcsec−2, as defined in the Third Reference Catalogue of Bright Galaxies (de Vaucouleurs et
al. 1991). The total of the flux densities for all the components was forced to equal the total
flux density within the optical disk. Uncertainties from the fits were generally estimated by
the variations in the parameters to fits performed on the north, south, east, or west halves
of the optical disk.
Because of variations among the different observations, the fits were customized slightly
for each waveband. The customizations are described below:
1. At 3.6-24 µm, matching the exact shape of the PSF of the nucleus became too difficult
(mainly because of the limitations of the STinyTim software), so the inner 10′′ at
3.6-8 µm and the inner 30′′ at 24 µm were not included in the initial fits to the data
(although the portion of the PSF that extends outside this region from the nucleus
was included). After the models were fit to the data, we used the results to determine
the flux densities of the bulge, disk, and ring components within this inner region.
These components’ flux densities were subtracted from the total flux density within
the central region to produce an estimate of the nuclear flux densities that were next
aperture corrected using the PSFs from STinyTim.
2. At 3.6 and 4.5 µm, the ring feature was very faint. If the ring radius and width were
allowed to vary as free parameters, the results failed to model either the ring or disk
components of the galaxy properly. Therefore, the ring radius and width were fixed to
match the parameters from the 5.7-70 µm data, although the ratio of the minor and
major axes and the position angle of the major axis were allowed to vary.
3. At 70 and 160 µm, emission from the bulge is no longer discernible in the data. If the
bulge is included in the 70 µm model, the resulting bulge model produces physically
1Available from http://ssc.spitzer.caltech.edu/archanaly/contributed/browse.html.

– 12 –
implausible results. The bulge is therefore not included in these models. Additionally,
the value of the residual background term from the fits, which is statistically equal to
0, demonstrates that the bulge component does not need to be included.
4. In the 160 µm fits, the 40′′ resolution of the data as well as the low sampling (where
each location is only observed 4 times) make the spatial parameters fit to the data
questionable. Therefore, the parameters describing the shapes of the profiles were
fixed to values determined from the 5.7-70 µm data, and the fits were performed
only to determine the flux densities of the different components. Uncertainties were
estimated by examining the change in the fits when the spatial parameters were varied
1σ.
As an example of the fits, the separate nucleus, inner disk, ring, and bulge components
of the model for the 24 µm data are shown in Figure 6. The observed 24 µm image, the
model 24 µm image, and the residuals from subtracting the model from the observed image
are shown in Figure 7. Note that the structures in the residual basically show substructure in
the PSF of the nucleus, which is a manifestation of the limitations of the STinyTim software,
and substructure in the ring, which is not perfectly described by a Gaussian function and
which does contain some bright knots and faint extensions at the east and west ends of the
ring that possibly correspond to the faint outer ring described by Bajaja et al. (1984) or faint
spiral arm structures. Otherwise, the residual image shows no evidence of any additional
structures present in the data.
The parameters that describe the shapes of the model components are presented in Ta-
ble 2. The weighted mean and standard deviations of the 5.7-70 µm parameters describing
the disk and ring (used as described above in the 3.6, 4.5, and 160 µm fits) are described
in Table 3. Note that, in the 5.7-70 µm range, the variation in the parameters between
wavebands is statistically small. This demonstrates that the shape of the features is rel-
atively invariant across this wavelength range. We can infer that each component can be
approximated as uniform in color across this wavelength range, because if color gradients
were present, the parameters describing the shapes of the components would vary across
different wavebands. For example, if the inner disk had a color gradient, this would manifest
itself as a variation in the scale length of the exponential function that describes the inner
disk, with some wavebands having a shorter scale length than others. Since no statistical
variation in this scale length is present, no color gradient is present.
The flux densities from the fits are given in Table 4. The uncertainties in the tables
are from the fits; these uncertainties effectively reflect the contribution of background noise
or substructures to the uncertainty. Calibration uncertainties, which are given in the final
column of the table, are usually but not always higher.

– 13 –
At 850 µm, the emission from outside the nucleus is negligible. No significant structures
are visible at above the 3σ level, although some emission fainter than 3σ may be associated
with the dust ring. As an approximation, however, this source can be treated as a single
unresolved source. To obtain a nuclear flux density, we simply measured the emission within
the central 1′ of the galaxy. The measured flux density is 0.25 Jy with a calibration uncer-
tainty of 10%. Note that this flux density measurement is consistent with the 870 µm flux
density measurement of 0.230 ± 0.035 Jy measured by Krause et al. (2005). However, we
note that some fraction of the flux density within this aperture may originate from the inner
disk and ring. We used the parameters given in Tables 3 and 4 as well as the models of the
SEDs of each component discussed in Section 3.3.2 to construct models of the disk and ring
at 850 µm. These models show that that 20% or less of the measured 850 µm emission may
originate from the inner disk and ring. This estimate, however, relies on an extrapolation
of SED models from shorter wavelengths; the 850 µm flux densities of these sources cannot
be constrained with these data. (Note that the predicted 850 µm surface brightnesses of the
disk and ring are equivalent to the noise levels in the map.) Therefore, in Table 4, we report
the flux density of the nucleus to be 0.25 Jy with an uncertainty of 0.05 Jy (20%).
3.3.2. Analysis of the Spectral Energy Distributions of the Separate Model Components
The SEDs of the total emission within the optical disk of the galaxy as well as the SEDs
for the nucleus, disk, ring, and bulge components are presented in Figure 8. For comparison
to the SEDs of nearby galaxies, we used the results of fitting semi-empirical dust models
to the global SEDs of SINGS galaxies in (Dale et al. 2005) to determine what the SED
of a typical galaxy was. The median α (the index for the power law that describes the
distribution of the intensities of the raditation fields that heat the dust) of the models fit to
these galaxies is 2.375. The semi-empirical model with this α is plotted on top of the SEDs
in Figure 8 as dotted lines. Additionally, emission models comprised of starlight added to
the physical dust models of Li & Draine (2001) have been fit to the SEDs of the nucleus, the
inner disk, and the ring. The models treat the dust as a mixture of amorphous silicate and
carbonaceous grains (including PAHs) with a size dsitribution that reproduces the optical
and ultraviolet extinction in the Milky Way. The dust grains in this model are then heated
by starlight with a distribution of intensities given by a power law. In fitting this model to
the data, the parameters allowed to vary included the mass of the dust, the index for the
power law describing the distribution of intensities of the raditation fields that heat the dust,
the maximum and minimum of the radiation fields, the PAH abundance, and the starlight
intensity. These models are plotted on top of the SEDs in Figure 8 as solid lines.

– 14 –
The global SED appears similar to the typical SEDs of nearby spiral galaxies (e.g.
Regan et al. 2004; Dale et al. 2005). The SEDs of the individual components, however,
look very different from each other. In the following paragraphs, the SEDs of the individual
components are discussed as they appear in Figure 8 except for the SED of the nucleus,
which is discussed last.
The disk 70 µm / 160 µm color is relatively warm compared to the ring emission and
the total emission but it is close to the what is expected for the typical galaxy in Dale et al.
(2005). The far-infrared color temperature (defined in this paper as the temperature of the
blackbody function modified by a λ−2 emissivity law that fits the 70 and 160 µm data)can
be used as an approximation of the dust temperature. In the case of the inner disk, the
far-infrared color temperature is 26 ± 2 K. The interstellar radiation field determined from
fitting the Li & Draine (2001) model to the data can also be used as an indicator of how
much the dust is heated. In the inner disk, the average intensity of the radiation field is
approximately four times the local value (i.e. the interstellar radiation field near the Sun).
The Li & Draine (2001) models also predict that the total dust mass is 3.5× 10⁵ M⊙. Note
that this is a relatively small amount of dust compared to the total dust mass of the ring
(given in the next paragraph).
The colors of the dust ring are comparable to the colors of typical nearby galaxies,
although the 160 µm emission is slightly higher than what is expected for the typical SED in
Dale et al. (2005). The far-infrared color temperature is 19± 2 K, and the average intensity
of the radiation field determined from the Li & Draine (2001) model fits is equivalent to
the local value. The total dust mass predicted for the ring by the model is 7.9 × 10⁶ M⊙.
Assuming that the gas-to-dust mass ratio is similar to the value of 165 for the Milky Way (Li
2005), the gas mass as determined from the dust mass is 1.3× 10⁹ M⊙. For comparison, the
atomic gas mass given in Bajaja et al. (1984) is 3.2× 10⁸ M⊙ (when scaled to a distance of
9.2 Mpc) and the upper limit of the molecular gas mass given in Bajaja et al. (1991) is given
as 4.4×10⁸ M⊙ (when scaled to a distance of 9.2 Mpc). The upper limit on the total atomic
and molecular gas mass is therefore approximately 7.6× 10⁸ M⊙, which is within a factor of
2 of the gas mass estimate of the dust mass. These results suggest that the majority of the
expected mass of dust in this galaxy can be accounted for in the ring.
The SED of the bulge decreases monotonically from short wavelengths to long wave-
lengths and virtually disappears at 70 µm. The slope of the SED is shallower than what
is expected from blackbody emission, possibly hinting at the presence of hot dust in the
atmospheres of evolved stars in the bulge (see Bressan et al. 1998, for example). At 8 µm,
half of the global flux from NGC 4594 originates from the bulge, and at 24 µm, the bulge
still contributes 1/3 of the total flux.

– 15 –
Of most interest, however, is the unusual SED of the nucleus. Note the relatively hot
colors compared to the ring and disk. The 24 µm / 70 µm and 24 µm / 160 µm colors
are relatively high. The far-infrared color temperature is 25 ± 2 K, and according to the
Li & Draine (2001) dust model fit to the data, the average radiation field in the nucleus is
approximately six times the local value. Strangely, the 70 - 850 µm emission almost appears
to be flat, in contrast to the ring and inner disk SEDs. Of particular interest is the 160 and
850 µm emission. Placed in the context of the SEDs of other nearby galaxies, the 70 µm
emission and especially the 160 µm emission is relatively weak compared to emission at
24 µm and shorter wavelengths. The 850 µm emission is of interest in that it is abnormally
high compared to the 70 and 160 µm data and it cannot be reproduced by the Li & Draine
(2001) dust model fits.
Note that the nuclear emission represents the enhancement of emission by the AGN
itself. As demonstrated in Section 3.2, star formation is either absent from the nucleus or
makes only a negligible contribution to the radiation field in the center of the galaxy. Passive
heating from evolved stars in the inner disk or the bulge is another possibility. However,
note that the scale lengths of the inner disk and the bulge do not vary between 5.7 and
70 µm. This indicates that the infrared colors of the bulge and disk do not vary and that
the nuclear emission is not the result of an enhancement in the nuclear infrared colors from
evolved stars. The nuclear infrared emission must be enhanced by the AGN.
4. Discussion
The 24 - 850 µm regime of the nuclear SED leads to two significant results. The first
result is the especially low 160 µm emission from the nuclear region (compared to emission
at 24 µm and shorter wavelengths) and its possible connection to the weak circumnuclear
star formation activity (as revealed by the absence of PAH emission). The other result is
the unusually high 850 µm emission, which appears to originate from a source other than
the ∼ 20 − 30 K dust typically found in the interstellar medium of other galaxies or in the
ring and inner disk of this galaxy. We discuss these two results below.
4.1. The Implications of the Weak Nuclear 160 µm Emission
The weak 160 µm emission from large, cool grains in the environment around this AGN
is best understood when placed in the context of the relation between far-infrared emission
and either AGN or star formation activity in other AGN host galaxies. Early results from
– 16 –
IRAS, such as Rodriguez Espinosa et al. (1987) and Rowan-Robinson & Crawford (1989),
had suggested that far-infrared emission from nearby Seyert galaxies was associated with
star formation, not AGN activity. In later studies of Seyfert galaxies, including Maiolino et
al. (1995), Rodriguez Espinosa & Perez Garcia (1997), Perez Garcia et al. (1998), and Perez
Garcia et al. (2000), the far-infrared dust emission, while still observed to be strongly peaked
near the centers of the galaxies, had been shown to be associated with star formation, and
the contribution of dust heated by the AGN to the nuclear emission was minimal.
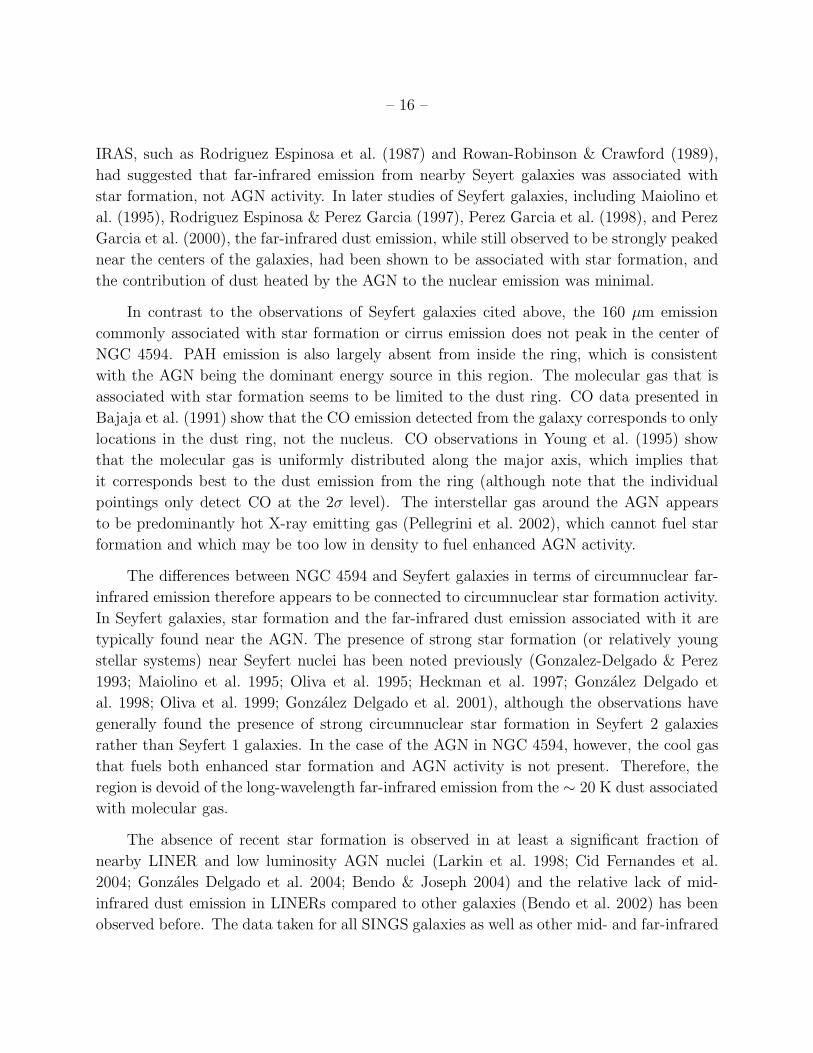
In contrast to the observations of Seyfert galaxies cited above, the 160 µm emission
commonly associated with star formation or cirrus emission does not peak in the center of
NGC 4594. PAH emission is also largely absent from inside the ring, which is consistent
with the AGN being the dominant energy source in this region. The molecular gas that is
associated with star formation seems to be limited to the dust ring. CO data presented in
Bajaja et al. (1991) show that the CO emission detected from the galaxy corresponds to only
locations in the dust ring, not the nucleus. CO observations in Young et al. (1995) show
that the molecular gas is uniformly distributed along the major axis, which implies that
it corresponds best to the dust emission from the ring (although note that the individual
pointings only detect CO at the 2σ level). The interstellar gas around the AGN appears
to be predominantly hot X-ray emitting gas (Pellegrini et al. 2002), which cannot fuel star
formation and which may be too low in density to fuel enhanced AGN activity.
The differences between NGC 4594 and Seyfert galaxies in terms of circumnuclear far-
infrared emission therefore appears to be connected to circumnuclear star formation activity.
In Seyfert galaxies, star formation and the far-infrared dust emission associated with it are
typically found near the AGN. The presence of strong star formation (or relatively young
stellar systems) near Seyfert nuclei has been noted previously (Gonzalez-Delgado & Perez
1993; Maiolino et al. 1995; Oliva et al. 1995; Heckman et al. 1997; Gonzalez Delgado et
al. 1998; Oliva et al. 1999; Gonzalez Delgado et al. 2001), although the observations have
generally found the presence of strong circumnuclear star formation in Seyfert 2 galaxies
rather than Seyfert 1 galaxies. In the case of the AGN in NGC 4594, however, the cool gas
that fuels both enhanced star formation and AGN activity is not present. Therefore, the
region is devoid of the long-wavelength far-infrared emission from the ∼ 20 K dust associated
with molecular gas.
The absence of recent star formation is observed in at least a significant fraction of
nearby LINER and low luminosity AGN nuclei (Larkin et al. 1998; Cid Fernandes et al.
2004; Gonzales Delgado et al. 2004; Bendo & Joseph 2004) and the relative lack of mid-
infrared dust emission in LINERs compared to other galaxies (Bendo et al. 2002) has been
observed before. The data taken for all SINGS galaxies as well as other mid- and far-infrared
– 17 –
surveys of nearby LINERs and low luminosity AGN should be used to determine whether
AGN nuclei like NGC 4594 are also weak yet hot infrared sources.
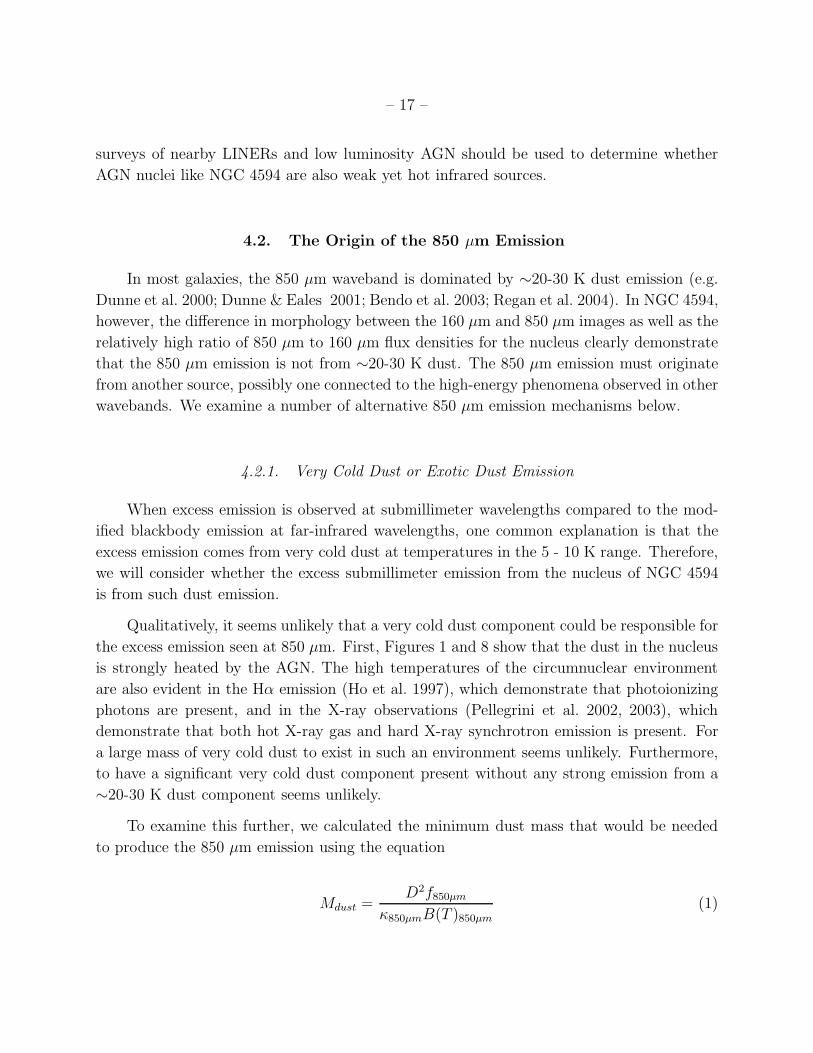
4.2. The Origin of the 850 µm Emission
In most galaxies, the 850 µm waveband is dominated by ∼20-30 K dust emission (e.g.
Dunne et al. 2000; Dunne & Eales 2001; Bendo et al. 2003; Regan et al. 2004). In NGC 4594,
however, the difference in morphology between the 160 µm and 850 µm images as well as the
relatively high ratio of 850 µm to 160 µm flux densities for the nucleus clearly demonstrate
that the 850 µm emission is not from ∼20-30 K dust. The 850 µm emission must originate
from another source, possibly one connected to the high-energy phenomena observed in other
wavebands. We examine a number of alternative 850 µm emission mechanisms below.
4.2.1. Very Cold Dust or Exotic Dust Emission
When excess emission is observed at submillimeter wavelengths compared to the mod-
ified blackbody emission at far-infrared wavelengths, one common explanation is that the
excess emission comes from very cold dust at temperatures in the 5 - 10 K range. Therefore,
we will consider whether the excess submillimeter emission from the nucleus of NGC 4594
is from such dust emission.
Qualitatively, it seems unlikely that a very cold dust component could be responsible for
the excess emission seen at 850 µm. First, Figures 1 and 8 show that the dust in the nucleus
is strongly heated by the AGN. The high temperatures of the circumnuclear environment
are also evident in the Hα emission (Ho et al. 1997), which demonstrate that photoionizing
photons are present, and in the X-ray observations (Pellegrini et al. 2002, 2003), which
demonstrate that both hot X-ray gas and hard X-ray synchrotron emission is present. For
a large mass of very cold dust to exist in such an environment seems unlikely. Furthermore,
to have a significant very cold dust component present without any strong emission from a
∼20-30 K dust component seems unlikely.
To examine this further, we calculated the minimum dust mass that would be needed
to produce the 850 µm emission using the equation
Mdust =D2f850µm
κ850µmB(T )850µm(1)

– 18 –
where D is the distance to the object (9.2 Mpc), f850µm is the 850 µm flux density, κ850µm
represents the absorption opacity of the dust at 850 µm (0.431 cm2 g−1; Li & Draine 2001),
and B(T )850µm is the surface brightness of a pure blackbody at a temperature T . The
minimum dust mass will correspond to the warmest temperature that is still consistent with
the data. This temperature will describe the modified blackbody function that fits both the
160 µm and 850 µm measurements. Using an emissivity varying as λ−2 (which approximates
the emissivity of dust in the far-infrared and submillimeter; see Li & Draine 2001), the
modified blackbody that best fits the 160 and 850 µm data has a temperature of 9 ± 2 K.
This is consistent with a dust mass of 1.9×10⁷ M⊙. Note, however, that a substantial part of
the 160 µm emission probably comes from warmer dust emission, as would be implied from
the emission at 70 µm (see, for example, the model fit to the nuclear SED in Figure 8). The
temperature of this hypothetical very cold component could be lower, which would drive the
dust mass of the very cold component higher.
Assuming a gas-to-dust mass ratio of 165, the minimum dust mass calculated above
implies a total gas mass of 3.2× 10⁹ M⊙ in the central 15′′ region of the galaxy (or within a
radius of 330 pc of the center). This gas mass is higher than the upper limit of 7.8×10⁸ M⊙
for the global total of atomic and molecular gas in NGC 4594 (as calculated in Section 3.3.2),
so it is implausible to expect so much gas to be present in the center. Furthermore, the black
hole in the AGN itself is 109 M⊙. It is implausible to think that a mass of cold gas multiple
times larger than the mass of the central AGN could be located in an environment where
significant numbers of high energy photons from the AGN and hot gas are present (e.g.
Pellegrini et al. 2002, 2003). Even if only half the submillimeter emission originates from
∼ 10 K dust, the implied molecular gas mass is still larger than the mass of the black hole.
Therefore, we reject the possibility that a very cold dust component is generating the 850 µm
emission.
Another possibility is that the submillimeter emission might be produced by grains with
a much larger submillimeter opacity than the grains that appear to be responsible for the bulk
of the far-infrared and submillimeter emission observed from most galaxies. Exotic grains
such as fractal grains have been proposed as an explanation for the excess submillimeter
emission observed from objects such as the Milky Way (Reach et al. 1995) and NGC 4631
(Dumke et al. 2004). Such dust would have temperatures of 5 - 10 K and would radiate
predominantly at submillimeter wavelengths.
This explanation, however, has problems. Even if the exotic grains have a sufficiently
high ratio of submillimeter opacity to optical-ultraviolet opacity to remain at ∼10K in the
intense radiation field, the required dust mass would remain unacceptably large unless the
grains have a submillimeter opacity orders of magnitude larger than normal dust. While

– 19 –
very large submillimeter opacities have been reported for some laboratory materials (e.g.,
material ”BE” of Mennella et al. 1998), no evidence suggests that such materials exist in
interstellar space (e.g., B. T. Draine 2006, in press).
4.2.2. CO Emission
The contribution of CO(3-2) emission to broadband 850 µm emission has been a concern
when using these wavebands for measurements of dust SEDs in the 15 - 30 K range. Usually,
CO(3-2) emission is only a minor contribution to the total submillimeter emission, although
some exceptional cases have been identified (e.g. Klaas et al. 2001).
Bajaja et al. (1991) detected the CO(1-0) line 140′′ east and west of the nucleus in
NGC 4594 but did not detect the central position because of instrumental problems. The
data in (Young et al. 1995) show that the CO(1-0) emission does not peak in the center of
the galaxy but is instead uniformly distributed along the major axis (although note that
CO is detected in the individual pointings at only the 2σ level). Qualitatively, these data
suggest that the CO(1-0) emission is primarily in the dust ring, not in the nucleus.
To estimate the possible 850 µm flux density of the CO(3-2) line in the nucleus, we will
use the (Young et al. 1995) CO(1-0) upper limit of 1.6 K km s−1 for the center of NGC 4594.
Using the conversion factor of 42 Jy/K from Young et al. and the assumed line width of
400 km s−1, the upper limit of the flux density of the CO(1-0) transition is ∼ 0.017 Jy.
Assuming that the CO J levels are thermalized at a rotational temperature Trot >15 K, we
estimate an upper limit for the flux density of ∼ 1.5 Jy for the CO(3-2) transition. Using the
relative width of the potential line (∼ 400 km s−1) and the SCUBA 850W filter bandpass
(40 GHz) we obtain an upper limit for the contribution of the CO flux density at 850 µm
of ∼ 20 mJy, which is much less than the 250 mJy measured for the nucleus. We therefore
conclude that emission from CO cannot explain all of the emission at 850 µm.
4.2.3. Synchrotron Emission
Synchrotron emission has been observed at submillimeter wavelengths in such AGN as
NGC 4374 (Leeuw et al. 2000) and NGC 1275 (Irwin et al. 2001). Therefore, it is a natural
possibility as the source of the submillimeter emission in this galaxy.
To determine the contribution of synchrotron emission at 850 µm, we will extrapolate
from radio observations to the submillimeter. The best published multiwavelength radio
data taken for this galaxy come from de Bruyn et al. (1976) and Hummel et al. (1984).

– 20 –
Their results show that all of the radio emission from NGC 4594 originates from the AGN,
which appears as an unresolved source. The SED shows that the radio emission consists of
synchrotron emission with a break at approximately 6 cm (5 GHz) caused by synchrotron
self-absorption. A power law fit to the 2-6 cm (15.0-5.0 GHz) data from Hummel et al.
(1984) shows that flux density is proportional to λ0.2. Using this power law fit to extrapolate
from centimeter to submillimeter wavelengths as shown in Figure 9, we predict an 850 µm
flux density of 0.056 Jy, which is approximately a factor of 4 lower than the measured flux
density.
Variable submillimeter synchrotron emission is a possibility. The synchrotron emission
from the AGN is variable, but the variability may not be significant enough to explain the
difference between the observed 850 µm flux density and the extrapolations of synchrotron
emission to those wavelengths. Decades of observations show that the 6 cm radio emission
has only been observed to vary at the 10 - 20 % level (de Bruyn et al. 1976; Ekers et
al. 1983; Krause et al. 2005). Bajaja et al. (1988) and references therein found that the
20 cm flux density increased by ∼ 70 % between 1980 and 1985. However, this increase
was not observed at other wavelengths, nor is it clear that this variability is seen at other
wavelengths. At 3.6 cm, Thean et al. (2000) measured a flux density of 84.7 ± 0.05 mJy in
1995-1996, and Krause et al. (2005) measured a flux density of 90 ± 10 mJy in 2003. These
values are lower than the 113 ± 12 mJy measured by (de Bruyn et al. 1976). However,
it is unclear whether this represents a decrease in the luminosity of the source itself or
an improvement in the calibration of measurements at these wavelengths. Moreover, this
decrease is unlikely to correspond to an increase in synchrotron emission at 850 µm unless
the power law describing the synchrotron emission changes as well. Finally, we would like
to state that the consistency between the 850 µm flux density measured in this paper and
the 870 µm flux density measured in Krause et al. (2005) implies that the submillimeter
emission is not variable at a level greater than the measurement uncertainties (10 %), at
least on periods of ∼ 3 yr. Therefore, it is unlikely that the submillimeter emission observed
at 850 µm was captured at a maximum in emission while the radio emission was taken at a
minimum.
Nonetheless, we are still hesitant to rule out synchrotron emission entirely as a source
of the 850 µm emission. The extrapolation from radio wavelengths did yield an estimate of
the 850 µm emission that was within less than a factor of 10 of the measured flux density.
The power law used in the extrapolation was determined using only three data points, and
the extrapolation extended over a factor of 10 in wavelength. So, we caution that the
extrapolations are not entirely reliable and that the actual synchrotron emission may be
higher or lower than what we determined here.

– 21 –
It is also possible that the 850 µm emission is from synchrotron emission unrelated to the
centimeter wavelength emission. Such synchrotron emission would need to be self-absorbed
at wavelengths longer than 850 µm. To determine if such a synchrotron component is present
would require further observations in multiple wavebands between 350 µm and 2 cm.
4.2.4. Bremsstrahlung
A final possibility is that bremsstrahlung emission is responsible for the 850 µm emission.
Bremsstrahlung emission has been detected in some nearby objects, such as M 82 (e.g.
Condon 1992), but has never been identified as a dominant source at 850 µm.
Since bremsstrahlung emission and recombination line emission both originate from
ionized hydrogen gas, it is possible to relate the two emission processes to infer the expected
bremsstrahlung emission. To convert the Hα flux to 850 µm flux density, we will use the
equations from Appendix A in Caplan & Deharveng (1986). We assume that the temperature
is ∼ 104 K and the contribution of HeII to the bremsstrahlung emission is negligible. This
gives the conversion
fν(850µm; Jy) = 5.29× 10⁹f(Hα; erg cm−2 s−1) (2)
Ho et al. (1997) give the Hα flux as as measured in a 2′′ wide region as 1.05 ×
10−13 erg cm−2 s−1. This yields an expected 850 µm bremsstrahlung flux density of 5.5×10⁻⁴
Jy. This is a factor of 400 too low to explain the observed 850 µm flux density from the
AGN. Note that the Ho et al. measurements are not corrected for dust extinction. However,
the low extinction measured with the Hα / Hβ ratio in Ho et al. implies that the extinc-
tion correction for the Hα flux would not significantly change the estimate of the 850 µm
bremsstrahlung emission. Therefore, we conclude that some other emission process must be
responsible.
4.2.5. Conclusions on the Origin of the 850 µm Emission
This analysis has shown that no known emission mechanism can satisfactorily explain
the observed 850 µm flux density of 0.25 Jy from the nucleus of NGC 4594. Synchrotron
emission seemed to be the most plausible single mechanism to explain the 850 µm emission,
although the 0.056 Jy flux density at 850 µm inferred from the radio synchrotron emission
falls short of the observed flux density. However, it it still possible that this synchrotron

– 22 –
emission contributes a fraction of the total 850 µm flux density. CO emission, with a flux
density of 0.020 Jy, and bremsstrahlung emission, with a flux density of 5.5 × 10⁻⁴ Jy, are
also physically plausible emission mechanisms that may contribute to the 850 µm band.
Very cold dust (at temperatures of ∼ 10 K) is not a physically plausible source of 850 µm
emission, although some small amount of the flux density (approximately 2% according to
the Li & Draine (2001) dust models fit to the nuclear SED in Section 3.3.2) may be dust
emission from warmer dust.
Even though multiple emission mechanisms may contribute to the total nuclear emission
at 850 µm, the total flux density of ∼ 0.080 Jy from all known physically plausible emission
mechanisms (synchrotron, CO, bremsstrahlung, and warm dust emission) still falls short of
the 0.250 Jy flux density observed at 850 µm. The possibility remains that some mechanism
that is dissociated from the emission mechanisms observed in all other wavebands, such
as synchrotron emission that is self-absorbed longward of 850 µm or unidentified spectral
line emission, could be responsible for a significant fraction of the 850 µm nuclear emission.
Additional submillimeter and millimeter photometry and spectroscopy are needed to identify
the source of the 850 µm emission, which should provide further clues about the nature of
this and other similar massive AGN.
5. Conclusions
We have extracted the SEDs of the nucleus, inner disk, ring, and bulge in the Sombrero
Galaxy, NGC 4594. The SED of the nucleus is notably unusual in that the emission spectrum
requires the dust to be hot, that the 160 µm emission is notably weak compared to emission
at 24 µm and shorter wavelengths, and that some source other than large ∼20-30 K dust
grains powers the 850 µm emission.
The relatively weak 160 µm nuclear emission appears to indicate that the LINER activity
seen in this galaxy is a result of the lack of cool gas needed to fuel stronger Seyfert activity.
The corresponding lack of star formation implied by the data is in line with previous studies,
which have found weak nuclear star formation activity in many (but not all) LINERs and low
luminosity AGN. Moreover, the strong far-infrared dust emission from the ISM near Seyfert
nuclei as well as the strong circumnuclear star formation in Seyfert galaxies also provide
credence to this idea.
The abnormally high 850 µm emission from the nuclear region cannot be explained as
any kind of dust emission, as synchrotron emission related to that seen at centimeter wave-
lengths, or as bremsstrahlung emission. A combination of mechanisms may be necessary

– 23 –
to explain the 850 µm emission. It is possible that the 850 µm emission may come from
an emission source that cannot be inferred from observations in other wavebands, such as
synchrotron emission that is self-absorbed at wavelengths longer than 850 µm or unidenti-
fied spectral line emission in the 850 µm band. Further observations at submillimeter and
millimeter wavelengths are needed to determine the nature of the emission.
Future observations of low luminosity AGN with the Spitzer Space Telescope may reveal
more galaxies with similarly weak nuclear 160 µm emission. Already, SINGS observations
of the low-luminosity AGN NGC 2841 indicate that it may have a similar spectral energy
distribution. Such anomalous nuclear emission should be placed into context by comparing
these sources to similar LINERs and to Seyfert galaxies. The end result may be the iden-
tification of key differences between these two classes of objects. We also anticipate that a
comparison of 160 µm Spitzer images with 15′′ resolution submillimeter or millimeter data
will reveal other galaxies with anomalously high submillimeter or millimeter emission, which
should lead to identification of the source of the emission and a more complete view of the
energetics of AGN.
Support for this work, part of the Spitzer Space Telescope Legacy Science Program,
was provided by NASA through contract 1224769 issued by the Jet Propulsion Laboratory,
California Institute of Technology under NASA contract 1407. BTD was supported in part
by NSF grant AST-0406833.
REFERENCES
Ajhar, E. A., Tonry, J. L., Blakeslee, J. P., Dressler, A., Holtzman, J. A., & Postman, M.
1997, AJ, 114, 626
Bajaja, E., Dettmar, R.-J., Hummel, E., & Wielebinski, R. 1988, A&A, 202, 35
Bajaja, E., Krause, M., Dettmar, R.-J., & Wielebinski, R. 1991, A&A, 241, 411
Bajaja. E., van der Burg, G., Faber, S. M., Gallagher, J. S., Knapp, G. R., & Shane, W. W.
1984, A&A, 141, 309
Bendo, G. J., et al. 2002, AJ, 124, 1380
Bendo, G. J., et al. 2003, AJ, 125, 2361
Bendo, G. J., & Joseph, R. D. 2004, AJ, 127, 3338

– 24 –
Bressan, A., Granato, G. L., & Silva, L. 1998, A&A, 332, 135
Caplan, J., & Deharveng, L. 1986 A&A, 155, 297
Cid Fernandes, R., et al. 2004, ApJ, 605, 105
Condon, J. J. 1992, ARA&A, 30, 575
Dale, D. A., et al. 2005, ApJ, 633, 857
de Bruyn, A. G., Crane, P. C., Price, R. M., & Carlson, J. B. 1976, A&A, 46, 243
de Grijp, M. H. K., Miley, G. K., Lub, J., & de Jong, T. 1985, Nature, 314, 240
de Grijp, M. H. K., Miley, G. K., & Lub, J. 1987, A&AS, 70, 95
de Vaucouleurs, G., de Vaucouleurs, A., Corwin, H. G., Buta, R. J., Paturel, G., & Fouque,
P. 1991, Third Reference Catalogue of Bright Galaxies (Berlin: Springer-Verlag)
Dumke, M., Krause, M., & Wielebinski, R. 2004, A&A, 414, 475
Dunne, L., & Eales, S. A. 2001, MNRAS, 327, 697
Dunne, L., Eales, S., Edmunds, M., Ivison, R., Alexander, P., & Clements, D. L. 2000,
MNRAS, 315, 115
Ekers, R. D., Fanti, R., & Miley, G. K. 1983, A&A, 120, 297
Engelbracht, C. W., Gordon, K. D., Rieke, G. H., Werner, M. W., Dale, D. A., & Latter,
W. B. 2005, ApJ, 628, L29
Fazio, G. G., et al. 2004, ApJS, 154, 10
Ford, H. C., Hui, X., Ciardullo, R., Jacoby, G. H., & Freeman, K. C. 1996, ApJ, 458, 455
Genzel, R., et al. 1998, ApJ, 498, 579
Genzel, R., & Cesarsky, C. J. 2000, ARA&A, 38, 761
Gonzales Delgado, R. M., Cid Fernandez, R., Perez, E., Martins, L. P., Storchi-Bergmann,
T., Schmitt, H., Heckman, T., & Leitherer, C. 2004, ApJ, 605, 127
Gonzalez Delgado, R. M., Heckman, T., & Leitherer, C. 2001, ApJ, 546, 845
Gonzalez Delgado, R. M., Heckman, T., Leitherer, C., Meurer, G., Krolik, J., Wilson, A. S.,
Kinney, A., & Koratkar, A. 1998, ApJ, 505, 174

– 25 –
Gonzalez-Delgado, R. M., & Perez, E. 1993, Ap&SS, 205, 127
Gordon, K. D., et al. 2005, PASP, 177, 503
Heckman, T. M., Gonzalez-Delgado, R., Leitherer, C. Meurer, G. R., Krolik, J., Wilson, A.
S., Koratkar, A., & Kinney, A. 1997, ApJ, 482, 114
Helou, G., Lu, N. Y., Werner, M. W., Malhotra, S., & Silbermann, N. 2000, ApJ, 532, L21
Ho, L. C., Filippenko, A. V., & Sargent, W. L. W. 1997, ApJS, 112, 315
Holland, W. S., et al. 1999, MNRAS, 303, 659
Houck, J. R., et al. 2004, ApJS, 154, 18
Hummel, E., van der Hulst, J. M., & Dickey, J. M. 1984, A&A, 134, 207
Irwin, J. A., Stil, J. M., & Bridges, T. J. 2001, MNRAS, 328, 3591
Jenness, T., & Lightfoot, J. F. 1998, “Reducing SCUBA Data at the James Clerk Maxwell
Telescope”, in Astronomical Data Analysis Software and Systems VII, ASP Conf. Ser.,
145, 216
Kailey, W. F., & Lebofsky, M. J. 1987, ApJ. 326, 653
Kennicutt, R. C., Jr., et al. 2003, PASP, 115, 928
Klaas, U., et al. 2001, A&A, 379, 823
Kormendy, J., et al. 1996, ApJ, 473, L91
Krause, M., Wielebinski, R., & Dumke, M. 2005, preprint (astro-ph/0510796)
Krist, J. 2002, Tiny Tim/SIRTF User’s Guide (Pasadena: SSC)
Larkin, J. E., Armus, L., Knop, R. A., Soifer, B. T., & Matthews, K. 1998, ApJS, 114, 59
Leeuw, L. L., Sansom, A. E., & Robson, E. I. 2000, MNRAS, 311, 683
Li, A. 2005, in Penetrating Bars Through Masks of Cosmic Dust, ed. D. L. Block, I. Puerani,
K. C. Freeman, R. Groess, & E. K. Block (Dordrecht: Springer), 535
Li, A., & Draine, B. T. 2001, ApJ, 554, 778
Lu, N., et al. 2003, ApJ, 588, 199
– 26 –
Madden, S. C., Galliano, F., Jones, A. P., & Sauvage, M. 2005, preprint (astro-ph/0510086)
Maiolino, R., Ruiz, M., Rieke, G. H., & Keller, L. D. 1995, ApJ, 446, 561
Mennella, V, Brucato, J.R., Colangeli, L., Palumbo, P., Rotundi, A., & Bussoletti, E. 1998,
ApJ, 496, 1058
Oliva, E., Origlia, L., Maiolino, R., & Moorwood, A. F. M. 1995, A&A, 301, 55
Oliva, E., Origlia, L., Maiolino, R., & Moorwood, A. F. M. 1999, A&A, 350, 9
Osterbrock, D. E., & de Roberts, M. M. 1985, PASP, 97, 598
Peeters, E., Spoon, H. W. W., & Tielens, A. G. G. M. 2004, ApJ, 613, 986
Pellegrini, S., Baldi, A., Fabbiano, G., & Kim, D.-W. 2003, ApJ, 597, 175
Pellegrini, S., Fabbiano, G., Fiore, F., Trinchieri, G., & Antonelli, A. 2002, A&A, 383, 1
Perez Garcia, A. M., Rodriguez Espinosa, J. M., & Fuensalida, J. J. 2000, ApJ, 529, 875
Perez Garcia, A. M., Rodriguez Espinosa, J. M., & Santolaya Rey, A. E. 1998, ApJ, 500,
685
Reach, W. T., et al. 1995, ApJ, 451, 188
Regan, M. W., et al. 2004, ApJS, 154, 204
Rice, W., Lonsdale, C. J., Soifer, B. T., Neugebauer, G., Kopan, E. L., Lloyd, L. A., De
Jong, T., & Habing, H. J. 1988, ApJS, 68, 91
Rieke, G. H., et al. 2004, ApJS, 154, 25
Rodriguez Espinosa, J. M., & Perez Garcia, A. M. 1997, ApJ, 487, L33
Rodriguez Espinosa, J. M., Rudy, R. J., & Jones, B. 1987, ApJ, 312, 555
Rowan-Robinson, M., & Crawford, J. 1989, MNRAS, 238, 523
Schmitt, H. R., Kinney, A. L., Calzetti, D., & Storchi Bergmann, T. 1997, AJ, 114, 592
Thean, A., Pedlar, A., Kukula, M. J., Baum, S. A., & O’Dea, C. P. 2000, MNRAS, 314, 573
Werner, M. W., et al. 2004, ApJS, 154, 1
Young, J. S., et al. 1995, ApJS, 98, 219

– 27 –
This preprint was prepared with the AAS LATEX macros v5.2.

– 28 –
-11:39:00
-11:38:00
-11:37:00
-11:36:00
-11:35:00
3.6 µm
-11:39:00
-11:38:00
-11:37:00
-11:36:00
-11:35:00
Dec
linat
ion
(J20
00)
8 µm
12:40:15 12:40:00 12:39:45Right Ascension (J2000)
-11:39:00
-11:38:00
-11:37:00
-11:36:00
-11:35:00
24 µm
Fig. 1.— 3.6, 8, 24, 70, 160, and 850 µm images of NGC 4594. Each images is 10′ × 5′, with
north up and east to the left. The scaling of the brightness in all images is logarithmic. Note
that only the inner ∼ 3′× ∼ 2.25′ region was covered in the 850 µm band and that the very
bright and dark pixels at the edges of this region are an artifact of the data processing.

– 29 –
-11:39:00
-11:38:00
-11:37:00
-11:36:00
-11:35:00
70 µm
-11:39:00
-11:38:00
-11:37:00
-11:36:00
-11:35:00
Dec
linat
ion
(J20
00)
160 µm
12:40:15 12:40:00 12:39:45Right Ascension (J2000)
-11:39:00
-11:38:00
-11:37:00
-11:36:00
-11:35:00
850 µm
Fig. 1.— Continued.

– 30 –
12:39:58 12:40:00 12:40:02Right Ascension(J2000)
-11:37:45
-11:37:30
-11:37:15
-11:37:00
-11:36:45
Dec
linat
ion
(J20
00)
Fig. 2.— The 8 µm image of the central 75′′ of NGC 4594, with boxes showing the regions in
which mid-infrared spectra were extracted. The cyan square in the center shows where the
low-resolution 5-38 µm spectrum for the nucleus was extracted. The dark blue rectangles at
top and bottom show where the low-resolution 5-38 µm spectrum for the ring was extracted.
The green rectangle in the center shows where the high-resolution 25-27 µm spectrum for
the nucleus was extracted.

– 31 –
0
20
40
60
80
Sur
face
Brig
htne
ss
(MJy
/sr)
Nucleus
PA
H
PA
H
PA
H
[Ne
II]
PA
HH
2 / P
AH
[Ne
III]
[S II
I]
[O IV
]
/ [F
e II]
[S II
I]
[Si I
I] 5 10 15 20 25 30 35
Wavelength (µm)
0
2
4
6
8
Sur
face
Brig
htne
ss
(MJy
/sr)
Ring
PA
H
PA
H
PA
H
[Ne
II]
PA
HH
2 / P
AH
[Ne
III]
[S II
I]
[O IV
]
/ [F
e II]
[S II
I]
[Si I
I]
Fig. 3.— 5-38 µm low-resolution IRS spectra of the nucleus and the ring in NGC 4594.
The gray regions around the lines represent the uncertainties in the spectra. Major spectral
features are identified in the plot. Note the weak or absent PAH features in the nucleus, in
contrast to the strong PAH features in the ring. Because of the limitations of the spatial
resolution of the telescope, the spectral features longward of 20 µm in the ring spectrum
probably include emission from the center. See the text for additional details. See Figure 4
to see a higher-resolution 25.5-26.5 µm spectrum of the nucleus where the [O IV] and [Fe II]
lines are separated.

– 32 –
25.6 25.8 26.0 26.2Wavelength (µm)
30
35
40
45
50
Sur
face
Brig
htne
ss
(MJy
/sr)
[O IV
]
[Fe
II]
Fig. 4.— 25.5-26.5 µm high-resolution IRS spectrum of the nucleus in NGC 4594. The gray
regions around the lines represent the uncertainties in the spectra. This plot shows the detail
in the [O IV] and [Fe II] line emission.

– 33 –
12:39:58 12:40:00 12:40:02Right Ascension(J2000)
-11:37:45
-11:37:30
-11:37:15
-11:37:00
-11:36:45
Dec
linat
ion
(J20
00)
PAH(11.3 µm)
12:39:58 12:40:00 12:40:02Right Ascension(J2000)
[O IV](25.9 µm)
Fig. 5.— Images of the 11.3 µm PAH feature (left) and the 25.9 [O IV] line (right) for
the inner 75′′ of NGC 4594. These are images made from the IRS spectral cubes. The
continuum has been identified and subtracted from the two wavebands on a pixel-by-pixel
basis. Note that the PAH emission originates primarily from the ring, whereas the [O IV]
emission originates primarily from the nucleus.

– 34 –
Fig. 6.— Models of the AGN, inner disk, ring, and bulge (all convolved with the 24 µm
model PSF) made using the parameters determined from fitting the models to the 24 µm
image. This is presented as an example of the image models that were fit to the data. For
display purposes, the brightnesses of the model components are not scaled relative to each
other.

– 35 –
-11:39:00
-11:38:00
-11:37:00
-11:36:00
-11:35:00
Observed Image
-11:39:00
-11:38:00
-11:37:00
-11:36:00
-11:35:00
Dec
linat
ion
(J20
00)
Model Image
12:40:15 12:40:00 12:39:45Right Ascension (J2000)
-11:39:00
-11:38:00
-11:37:00
-11:36:00
-11:35:00
Residual Image
Fig. 7.— The observed 24 µm image, the model 24 µm image, and the residuals from
subtracting the model from the observed image. This is presented as an example of the
image models that were fit to the data. The optical disk of the galaxy (as given by de
Vaucouleurs et al. (1991)) is overplotted as green ovals to show the region over which the fit
was performed.
– 36 –
0.01
0.10
1.00
10.00
100.00 Total
0.01
0.10
1.00
10.00
100.00 Nucleus
0.01
0.10
1.00
10.00
100.00
Flu
x D
ensi
ty (
Jy) Disk
0.01
0.10
1.00
10.00
100.00 Ring
10 100 1000Wavelength (µm)
0.01
0.10
1.00
10.00
100.00 Bulge
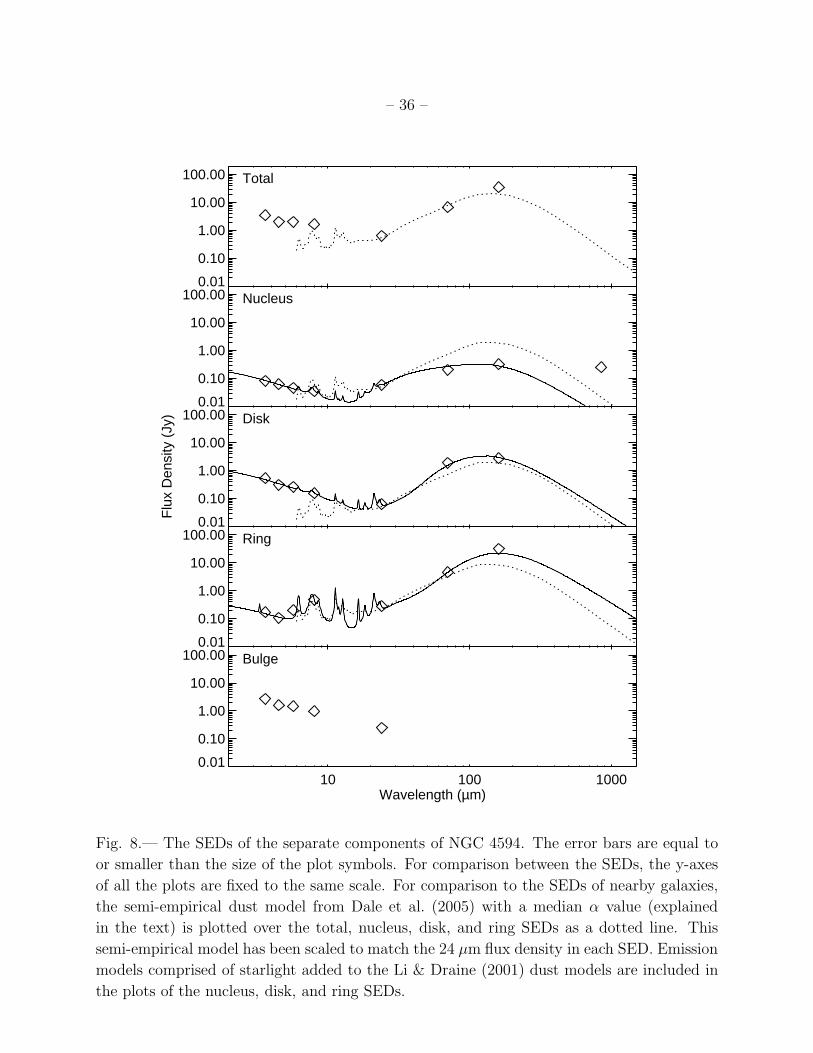
Fig. 8.— The SEDs of the separate components of NGC 4594. The error bars are equal to
or smaller than the size of the plot symbols. For comparison between the SEDs, the y-axes
of all the plots are fixed to the same scale. For comparison to the SEDs of nearby galaxies,
the semi-empirical dust model from Dale et al. (2005) with a median α value (explained
in the text) is plotted over the total, nucleus, disk, and ring SEDs as a dotted line. This
semi-empirical model has been scaled to match the 24 µm flux density in each SED. Emission
models comprised of starlight added to the Li & Draine (2001) dust models are included in
the plots of the nucleus, disk, and ring SEDs.
– 37 –
101 102 103 104 105 106
Wavelength (µm)
0.01
0.10
1.00
Flu
x D
ensi
ty (
Jy)
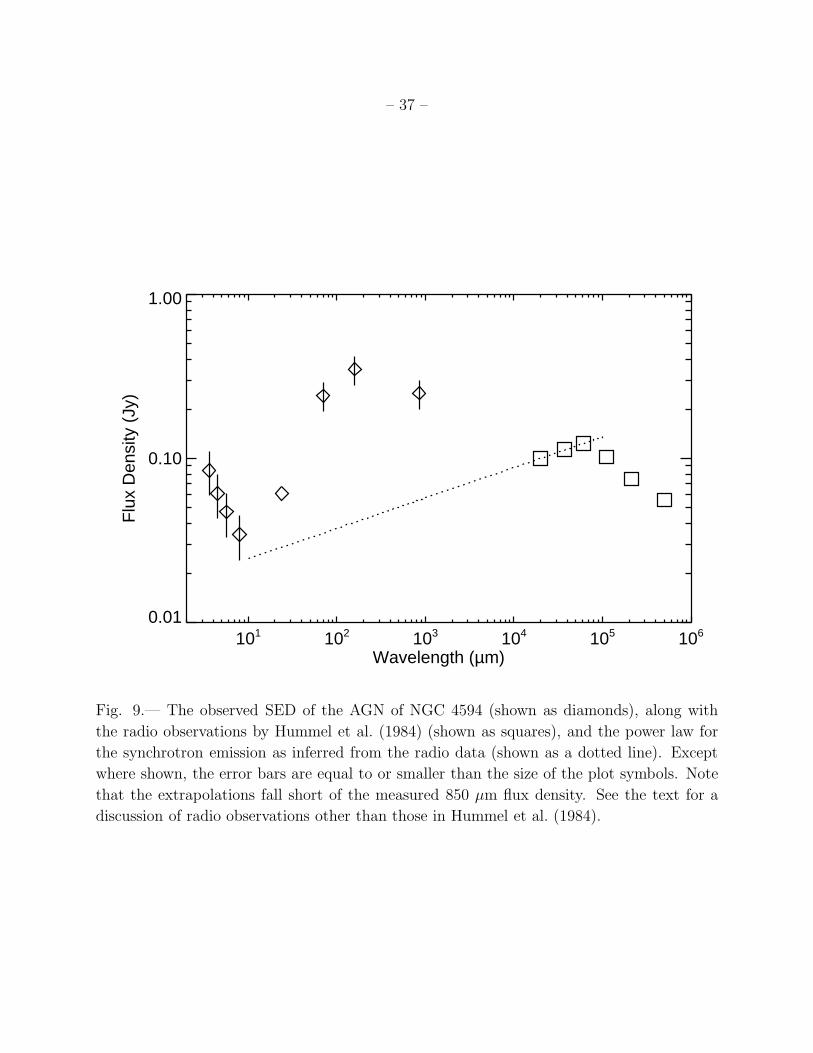
Fig. 9.— The observed SED of the AGN of NGC 4594 (shown as diamonds), along with
the radio observations by Hummel et al. (1984) (shown as squares), and the power law for
the synchrotron emission as inferred from the radio data (shown as a dotted line). Except
where shown, the error bars are equal to or smaller than the size of the plot symbols. Note
that the extrapolations fall short of the measured 850 µm flux density. See the text for a
discussion of radio observations other than those in Hummel et al. (1984).

– 38 –
Table 1. Measurement of Select Spectral Lines in the Nucleus of NGC 4594
Feature Measurement
6.2 µm PAH feature equivalent width 0.0023± 0.0004 µm
6.2 µm PAH feature/continuum ratio 0.035± 0.07
7.7 µm PAH feature equivalent width < 0.006 µm
7.7 µm PAH feature/continuum ratio < 0.04
12.8 µm [Ne II] line strength (1.86± 0.10)× 10−13 erg cm−2 s−1
25.9 µm [O IV] line strength (5.21± 0.17)× 10−14 erg cm−2 s−1
34.8 µm [Si II] line strength (7.2± 0.2)× 10−14 erg cm−2 s−1

–39
–
Table 2. Spatial Model Parameters of the Separate Components of NGC 4594 from Fits to Data
Wavelength Disk / Ring / Bulge Disk / Ring Inner Disk Ring Parameters Bulge Scaling Parameter
Major Axis Minor/Major Scale Radiusb Widthb Major Minor
Position Anglea Axis Ratio Lengthb Axis Axis
50′′.5± 0′′.5 141′′ ± 4′′ 78.′′.0± 1′′.13.6 µm 89◦.4± 0◦.4 0.0996 ± 0.0003
2.25± 0.02 kpcc c
6.29± 0.18 kpc 3.48± 0.05 kpc
51′′.3± 0′′.9 139′′ ± 5′′ 80′′ ± 5′′4.5 µm 89◦.4± 0◦.4 0.1010 ± 0.0018
2.29± 0.04 kpcc c
6.2± 0.2 kpc 3.6± 0.2 kpc
54′′ ± 3′′ 145′′.9± 1′′.6 24′′.5± 0′′.3 170′′ ± 4′′ 102′′.5± 1′′.65.7 µm 89◦.24± 0◦.03 0.1026 ± 0.0010
2.4± 0.13 kpc 6.51 ± 0.07 kpc 1.092± 0.013 kpc 7.58± 0.18 kpc 4.57± 0.07 kpc
46′′ ± 3′′ 144′′ ± 2′′ 21′′.3± 0′′.8 180′′ ± 9′′ 101′′.1± 1′′.28 µm 89◦.25± 0◦.14 0.099± 0.003
2.05± 0.13 kpc 6.42 ± 0.09 kpc 0.95± 0.04 kpc 8.0± 0.4 kpc 4.5± 0.05 kpc
45′′ ± 7′′ 144′′.9± 1′′.5 19′′.4± 0′′.5 180′′ ± 50′′ 100′′ ± 16′′24 µm 89◦.27± 0◦.04 0.0959 ± 0.0009
2.0± 0.3 kpc 6.46 ± 0.07 kpc 0.87± 0.02 kpc 8± 2 kpc 4.5± 0.7 kpc
39′′ ± 5′′ 143′′.9± 1′′.4 20′′.1± 1′′.670 µm 89◦.5± 0◦.3 0.102± 0.005
1.7± 0.2 kpc 6.42 ± 0.06 kpc 0.90± 0.07 kpc· · · · · ·
aThis angle is in degrees east from the North-South axis.
bAngular values for these paramteres refer to angular distances along the major axis.
cValues were fixed to weighted mean values from 5.7 - 70 µm data given in Table 3.

– 40 –
Table 3. Weighted Mean and Standard Deviation of the Mean of Disk and Ring Model
Parameters from 5.7 - 70 µm data
Quantity Value
Disk/Ring Major Axis Position Anglea 89◦.25± 0◦.06
Disk/Ring Major/Minor Axis Ratio 0.0990± 0.0015
48′′ ± 3′′Inner Disk Scale Lengthb
2.14± 0.13 kpc
144′′.7± 0′′.5Ring Radiusb
6.45± 0.02 kpc
22′′.9± 1′′.1Ring Widthb
1.02± 0.05 kpc
aThis angle is in degrees east from the North-South axis.
bAngular values for these paramteres refer to angular
distances along the major axis.

– 41 –
Table 4. Flux Density Model Parameters of the Separate Components of NGC 4594
Wavelength Flux Density (Jy)a Calibration
(µm) Global Nucleus Inner Disk Ring Bulge Uncertainty (%)
3.6 3.50 0.0847 ± 0.0008 0.529 ± 0.006 0.168± 0.011 2.684± 0.017 30
4.5 2.09 0.0614 ± 0.0008 0.309 ± 0.009 0.111± 0.003 1.595± 0.016 30
5.7 2.01 0.0473 ± 0.0003 0.265 ± 0.006 0.199± 0.004 1.496± 0.003 30
8 1.64 0.0344 ± 0.0009 0.156 ± 0.009 0.482± 0.008 0.96± 0.02 30
24 0.65 0.061 ± 0.006 0.062 ± 0.014 0.277± 0.006 0.25± 0.03 10
70 6.7 0.203 ± 0.018 1.9± 0.2 4.6± 0.2 · · · 20
160 35.1 0.33± 0.05 2.8± 0.2 32.0 ± 0.2 · · · 20
850 · · · 0.25± 0.05 · · · · · · · · · 10
aThe uncertainties in these columns are from the fits to the data and do not include the calibration uncertainties.
The calibration uncertainties are listed in the final column.