statistical tables (unaudited) - charleston county€¦ · statistical tables this section of the...
TRANSCRIPT

STATISTICAL TABLES(UNAUDITED)
171

STATISTICAL TABLES
This section of the County of Charleston South Carolina's comprehensive annual financial report presentsdetailed trend and other information as a context for understanding what the information in the basicfinancial statements, notes to the basic financial statements, required supplementary information andother supplementary information says about the County's overall financial health.
PageNumber
FinancialTrends 173 - 179These schedules contain trend information to help the reader understandhow the government's financial performance and well-being havechanged over time.
Revenue Gapacity 180 - 184These schedules contain information to help the reader assess theCounty's most significant local revenue source, the property tax.
Debt Capacity 185 - 189These schedules present information to help the reader assess theaffordability of the County's current level of outstanding debt and theCounty's ability to issue additional debt in the future.
Demographic and Economic lnformation 190 -191These schedules offer demographic and economic indicators to help thereader understand the environment within which the County's financialactivities take place.
Operating lnformation 192 - 200These schedules contain service and infrastructure data to help thereader understand how the information in the County's financial reportrelates to the services the County provides and the activities it performs.
FinancialAssurance Coverage 201
Sources: Unless othenruise noted, the information in these schedules is derived from the comprehensiveannual financial reports for the relevant year.
172

COUNTY OF CHARLESTON, SOUTH CAROLINANET ASSETS BY COMPONENT
LAST TEN FISCAL YEARS(Accrual Basis of Account¡ng)
UNAUDITED
Govemmental Activit¡eslnvested in Cepital Assets, Net of Related DebtRestrictedUnrestricted
Total Governmental Activities Nei Assets
Business-type Activitieslnvested in Capital Assets, Net of Related DebtRestrictedUnrcstricted
Total Bus¡ness-type Activit¡es Net assets
Pr¡mary Governmentlnvested ¡n Cap¡tal Assets, Net of Related DebtRestrictedUnrestricted
Tota¡ Primary Government Net Assets
$ 62,472.068 $ 68,800,430 $ 77,600,6'1042,838,691 41,395,383 71,479,95167,663,283 71,705,234 54,076,612
2010 2012
$40,126,334 $49,998,715 $ 57,3s9,439 $ 73,784,397 $ 89,153,294 $102,685,537 $ 99,40e,429 $ 98,333,460 $109,879,879 $113,295,76728,420,510 32,932,674 60,338,152 51,638,770 69,829,579 120,020,898 26,497,016 31,716,002 133,951,227 297,250,87941,986,611 33,263,298 11,749,363 37,628,366 26,178,518 (61,981,588) (1,257,571) (41,322,471) (205,897,191) (428,921,2601
$110,533,455 $116,194,687 $ 129,446,954 $ 163,051,533 $ 185,161,391_ $160,724,847 $124,648,874 $ 88,726,991 S 37,933,915 $ (18,374,614)
$22,345,734 $18,801,7.15 920,241,171 $ 17,983,156 $24,637,561 $26,839,792 $27,790,358 $30,486,244 83?,625,114 $38,035,20214,418,181 8,462,709 11,141,799 49,159,942 34,873,968 38,021,909 39,974,530 41,832,681 48,107,916 54,181,91725,676,672 38,441,936 42,327,249 15,023,549 36,781,998 40,032,892 35,882,091 30,461,308 29,145,836 27,593,816
$62,440,587 $65,706,360 $ 73,710,219 $ 82,166,647 $ 96,293,527 $104,894,593 $103,646,979 $102,780,233 $109,878,866 $119,810,935
$ 91,767,5s3 $ 113,790,855 $'129,525,329 $ 127,199,787 $ 128,819,704 $ 142,504,993 $ 15'r,330,969100,798,712 104,703,547 158,042,807 66,471,546 73,548,683 182,059,143 351,432,79652,651,915 62,960,516 (21,948,696) 34,624,52O (10,861,163) (176,751,355) (401,327,444)
$172,974,O42 $181,901,047 $ 203,157,173 $ 245,218,180 $ 281,4s4,918 $265,619,440 $ 228,295,853 $ 191,5O7,224 $ 147,812,781 101 321
173

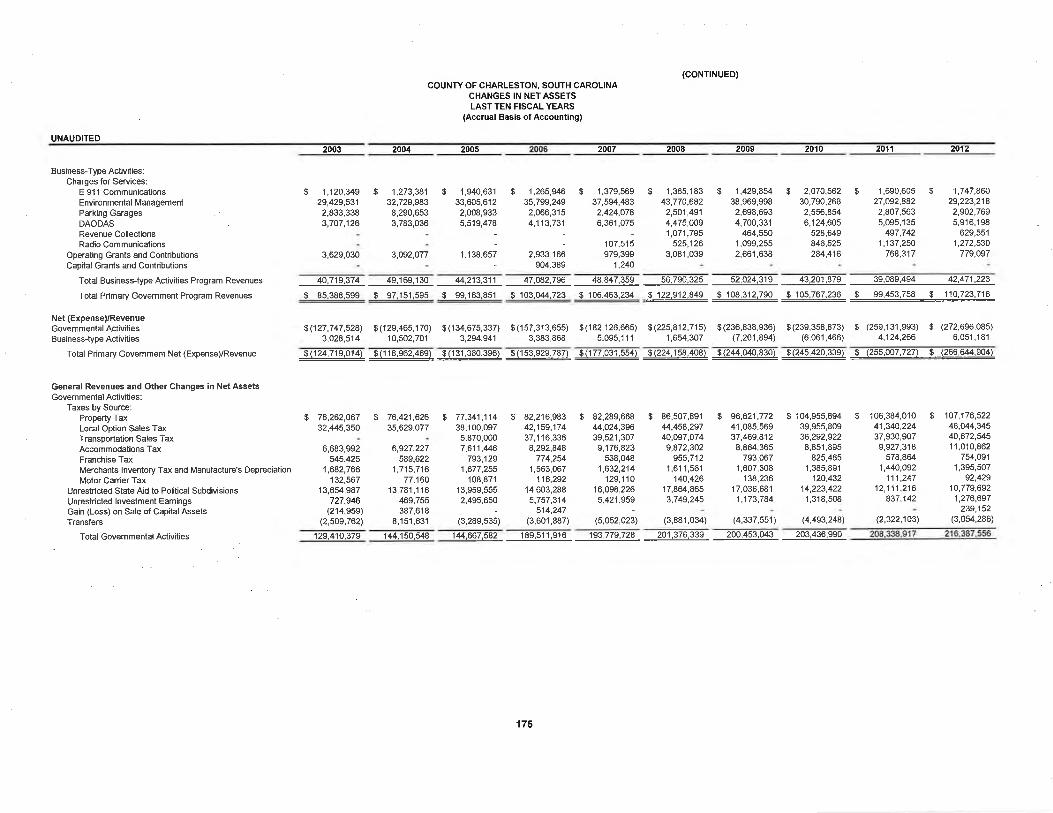
COUNTY OF CHARLESTON, SOUTH CAROLINACHANGES IN NET ASSETSLAST TEN FISCAL YEARS
(Accrual Basis of Accounting)
UNAUDITED
2011 2012
ExpensesGovernmental Act¡vities:
General GovemmentPubl¡c SafetyJudic¡alPublic WorksHealth and WelfareEconomic DevelopmentCulture and RecreationEducal¡onlnterest and F¡scal Charges
Total Govemmental Activit¡es Expenses
Bus¡ness-Type Activities:E 91'l CommunicationsEnv¡ronmental [/anagementPark¡ng GaragesDOADASRevenue CollectionsRadio Communications
Total Business-Type Act¡v¡ties Expenses
Total Primary Government Expenses
Program RevenuesGovemmental Activities:
Charges for Services:General GovemmentPublic SafetyJud¡cialPublic WorksHealth and WelfareCulture and RecreationEducation
Operat¡ng Grants and ContributionsCap¡tal Grants and Contributions
Total Govemmental Activities Program Revenues
172,416,753 177,447,635 189,625,877 213,275,582 239,742,540 291,935,239 293,i27,407 301,524,230 319,496,257 340,948,578
$ 42,030,86957,667,47415,150,95014,249,3651 3,ô98,800
584.991't4,744,'t853,592,277
10,697,842
923,5062ô,266,1 86
2,705,'t877,795,981
$ 13,676,ô116,721,2235,900,66'l
1 08,535804,262
68,828
1 7,389,105
$ 44,073,90360,1 99,7561ô,303,00013,047,44512,255,223
1,057,50717,464,8773,735,8959,306,029
905,42727,252,627
2,322,9808,185,395
$ 15,¿140,672
7,878,5047,292,55',1
143,354558,244
66,441'10,1 70
16,592,529
$ 48,480,73065,4'11,63017,626,76114,569,6321 1,823,ô14
943,669'16,731,110
3,93'1,0381 0,1 07,ô93
1,'167,08029,335,704
1,922¡698,493,417
s 17,935,2756,290,7517,253,058
I 79,664788,557
73,303
19,298,3593,1 31 ,573
$ 54,974,08767,475,922't9,o42,O9223,717,878'1o,992,770
3,48't,1171 8,1 33,3085,004,959
10,453,,149
888,81232,430,587
1,7'12,3108,667,219
I 19,041,1ô16,157,7627,778,889
't96,'t471,150,312
201,705
21.435,951
$ ô5,198,09965,ô19,71520,545,79040,1 85,78311,'t12,177
't,324,79021,307,239
5,137,8439,31 1,104
984,11230,229,939
1,753,7198,984,048
'1,800,430
$ 18,098,6606.622,9767,641,4241,927,4684,930,221
179,007
18,216,1 19
$ 65,852,89379,153,O5222,20',t,44231,011,12412,879,1643,228,377
53,822,2075,325,300
18,461,ô80
1 ,015,96839,064,678
2,008,3959,348,8531,724,4771.973.647
$ '16,034,883'11,396,678
8,319,2314,94'l,33ô
612,O294,003,383
20,814,984
$ 57,001,16679,004,93228,605,37539,605,73013,2'11,079
858,48348,254,152
5,651,92120,934,5ô9
1,096,40943,209,'1252,149,0558,97ô,8461 ,641 ,6152,1 53.1 63
$ 10,852,7211 i ,079,4199,285,8094,123,329
476,7561,767,195
1A,703,242
$ 51 ,006,419 $77,890,85825,578,69756,597,2071ô,552,89'l
6,078,1 074 t ,390,976
5,719,55321,109,522
1,199,87633,738,089
't,969,3228,407,7231,721,4302.226.905
$ 9,697,1 35 $11,478,2888,892,ôô0I ,939, 1 08
412,732912,786
29,232,648
55,6ô7,451 $82,516,82126,1 16,1 1380,325,1 85
7,903,0901,457,'tO7
38,88ô,3875,884,830
20,739,273
'I,564,753
19,920,437'1,967,543
7,802,7421,483,3462,226,407
13,632,343 $19,420,O408,379,7031,780,797
233,266882,902
15,639,213396,000
60,157,22586,501,93826,577,93592,740,984
7, r 73,5094,314,493
30,820,5176,642,621
26,019,356
't,616,20721,278,OU
1,974,9777,760,727I,320,8512,469,246
9,999,74212,539,2467,738,3718,821,907
250,352511j70
25,771,2802,620,425
37,690,860 38,ô66,429 40,918,370 43,698,928 43,752,248 55,13ô,018 59,226,2'13 49,263,345 34,965,228 36,420,042
$210,107,ô13 $216,114,064 $23O,U4,247 $256,974,510 $283,494,788 8347,071,257 $3s2,3s3,620 $351,187,575 $ 354,461,485 $ 377,368,620
44,669,225 47 ,982,465 54,950,s40 55,961 ,927 57,615,875 66,t2?,524 56,288,471 62,565,357 60,3ô4,2ô4 68,252,493
174
(coNïNUEDICOUNIY OF CHARLESTON, SOUTH CAROLINA
CHANGES IN NET ASSETSLAST TEN FISCAL YEARS
(Accrual Bas¡s of Accounting)
UNAUDITED2003 2004 2005 2007 2008 2009 2010 zo1't 2012
Business-Type Act¡vities:Charges for Services:
E 9l'l Commun¡cationsEnv¡ronmental ManagementParking GeragesDAODASRevenue CollectionsRadio Communications
Operating Grants and ContributionsCapital Grants and Contributions
Total Bus¡ness-type Act¡v¡ties Program Revenues
Total Primary Govemment Program Revenues
Net (Expense)rRevenueGovemmental Activit¡esBus¡nesslype Activities
Total Primary Govemment Net (Expense)/Revenue
General Revenues and Other Changes ¡n Net AssetsGovemmental Activities:
Taxes by Source:Property TaxLo€l Opt¡on Sales TaxTransportation Salès TaxAccommodat¡ons TaxFranchise TaxMerchants lnventory Tax end Manufacture's Deprec¡ationMotor CaÍier Tax
Unrestricted State A¡d to Political Subd¡v¡sions
Unrestricted lnvestment EamingsGain (Loss) on Sale of Cap¡tal AssetsTransfers
Total Govemmental Activities
$ 1,120,349 $ 1,273,38't $29,429,531 32,729,9832,833,338 8,290,6533,707j26 3,783,036
1,940,631 $ 1,265,946 $ 1,379,569 $ 1,365,18333,605,612 35,799,249 37,594,483 43,770,6822,008,933 2,066,315 2,424,078 2,501,4915,s1e,478 4,113,731_ ô,36r,07s
i,¿11,132107,515 525,126
1.138.657 2.933.166 979.399 3,08'1,039
$ 1,429,854 $ 2,070,562 $38,969,998 30,790,2682,698,ô93 2,556.8544,700,331 6,124,6054il,550 528,649
1,099,255 84ô,5252,661,638 284,416
'l,690,605 S
27,092,8822,807,5635,095,1 35
497,742't,'137,250
768,31 7
1 ,747,86029,223,218
2,902,7695,916,'198
629,5511,272,530
779,O973,ô29,030
1,682,766'132,567
3,O92,077
1,715,71677j60
- 904.389 1,240
40,719,374 49,169,130 44,213,311 47,0A2,796 48,847,359 56,790,325 52,024,319 43,201,879 39,089,494 42,47',t,223
$ 85,388,599 $ 97,151,595 $ 99,163,851 S103,0¿t4,723 $106,463,234 5122,912,849 $108,312,790 $105,767,236 $ 99,453,758 $ 110,723,716
s(127J47,528) $(129,4ôs,170) $(134,675,337) $(157,313,65s) $(182,126,665) S(225,8't2,715) $(236,838,e36) $(23e,358,873) $ (25e,131,ee3) $ (272,696,085)
3,O28,5't4 tO,sO2,7O1 3,294,941 3,383,868 5,095,1'11 1,654,307 (7,201,894) (ô,061,466) 4,124¿66 6,051,181
s(124,7'te,o14\ S(118,e62,46e) $(131,3s0,3eô) $(153,e2e,287). _$t1zzp9].99q _$l?4J_q!.19Ð _$1?11!1qÉ9E _$1491?9É99I s (255,007,?2?) $ (266,644'904)
$ 7ô.2ô2,0ô7 ç 76,42't,62632,445,350 35,629,077
6,683.992 6,927,22754s.425 589.622
13,654,987 13,781,11ô727,946 469,755
$ 77,341,11438,1 00,097
5,870,0007,611,446
793,'t291 ,677,255
108,8711 3,959,5552,495,ô50
$ 82,216,98342,159,17437,1 16,336
8,292,848774,254
'I,563,067
116,29214,603,2885,757,314
$ 82,2e9,66844,O24,39639,521,307
9,176,823538,048
1,632,2',t4129,1't0
1 ô,098,2265.421,959
$ 86,507,89144,458,29740,o97,O749,872302
955,7121,61't,5ô1
't40,42617,8ô4,8653,749,245
$ 96,621,7724t,085,56937,469,812
8,8ô4,365793,067
1,607,3081 38,236
1 7,036,6811,173,784
$ 104,955,89439,955,80936,292,922
8,851,895825,465
1 ,385,891120,432
14,223,422't ,318,s08
$ 106,384,01041,3/¡0,22437,930,907
9,927,318578,864
1,440,092111,247
12,111,216837,142
(2,322,103)
$ 1O7,176,52246,044,34540,672,5451 1 ,010,862
754,0911,395,507
92,4291 0,779,692
1,276,697239,152
(3,054,286)(214,959) 387,618 - 514,247
(2,509,762) 8,151,631 (3,28s,s35) (3,ô01,887) (5,052,023) (3,881,034) (4,337,551) (4,493,248\
'129,410,379 1¿14,'150,548 144,667,58? 189,51 1,916 193,779,728 201,376,339 200,453,043 203,436'990
175

{coNTTNUED)COUNTY OF CHARLESTON, SOUTH CAROLINA
CHANGES IN NET ASSETSLAST TEN FISCAL YEARS
(Accrual Basis of Account¡ng)
Bus¡ness-type act¡vit¡es:Property TaxesAlcoholic Beverage TaxMerchants lnventory tax and Manufacture's DepreciationUnrestricted lnvestment EamingsGain (Loss) on Sale of Cap¡tal AssetsTransfers
Totâl Business-type Activities
Total Primâry Govemment
Special ltemsChange in Net Assets:
Governmental Act¡vitiesBusiness-type Activ¡t¡es
Total Primâry Government
359 $51 4,357
'10,832
640,025(22,975\
48$528,466
10,832396,4't2
64$542,927
10,832832,632
ô5$523,037
-$505,366
-$542,927
10,8322,446,O82
65,886
q
542,92710,832
747,83545.467
-$542,927
10,8321 02,1 8845,525
-$537,486
10,83285,30318,643
2 322 103
594,682'10,832
3 t ,880't 89,208
3 054 286
10,832 10,8321,782,440 3,368,ô08
3.811 94.9402,509,762 (8,151,631) 3,2æ,535 3,60r,887 5,052,023 3,881,034 4,337,551 4,493,248
3,652,3ô0 (7,2't5,873\ 4,675,990 5,922,072 9,031,769 6,946,761 5,684,ô12 5,194,720 2,974,367 3,880,888
$133,0ô2,739 $136,934,675 $149,343,572 $'195,433,988 ç202,811,497 $208,323,'100 $206,137,655 $208,631,710 $ 211,313,284 $ 220,268,444
$(7,573,526)$(9,151,217)$ 3,471,464 $ 1,383,940 $ - $ - $
(5,910,675) 5,534,'161 13,463,709 33,582,201 11,653,063 (24,436,376\ (36,385,893) (35,921,883) (50,793,076) (5ô,308,s29)
6,680,874 3,28ô,828 7,970,931 9.305.940 14,126.880 8.601 ,068 (1,517,282\ (866,746) 7,098,ô33 9,932,0ô9
$ 770,199 $ 8,820,989 $ 21,434,640 $ 42,888,141 $ 25,779,943 $(15,835,308) $(37,903,175) $(36,788,ô29) $ (43,694,443) $ (46,376,460)
176

COUNTY OF CHARLESTON, SOUTH CAROLINAFUND BALANCES OF GOVERNMENTAL FUNDS
LAST TEN FISCAL YEARS(Morlified Accrual Basis of Accounting)
UNAUDITED
2003 2004 2005 2006 2007 20'to
General FundReservedUnreservedNonspendable - inventoryAssignedUnassigned
Total General Fund
All Other Govemmental FundsReserved:
lnventories and Prepaid ltemsEncumbrancesDebt Serv¡ceCapital Projects FundsTransportation and Road Sales Tax
Unreserved, Reported in:Special Revenue Funds
Restr¡cted - Debt ServiceRestr¡cted - Transportat¡on Sales TaxRestricted - Special Revenue FundsCommitted - Cap¡tal Project Funds
Total All Other Governmental Funds
2,327,89522,571,68',1
s 2,057,482 $ 2,470í0228,453,427 33,899,138
$ 5,202,24243,731,980
$ 3,367,810 $ 1 ,461 ,99446.333,758 43,266,383
$ 2,035,197 $ 2,727,15443,676,650 49,868,870
1 ,080,137 935,07810,093,341 12,579,028
$ 24,8ss,s76 $3o,51o,eoe $36,36e,240 g48,s34,222 $4s,70i,s68 s 44,728,377 s4s,711,847 $s2,5e6,02; tilll3:å33 tiå:lii:ii8
$ 212,67',t $ 204,652 $ 299,021 $ 11,60315,093,314 7,'t63,103 5,628,457 13,318,3339,212,186 11,951,945 26,279,539 18,953,106
37,062,341- 34,782,3s8_ 34,058,613 iã:3å?:î3ä
12,427,657 12,505,052 14,384,'176 12.042,386
$ 11,6029,008,571
18,252,40322,441,83896,021 ,511
16,128,286
s-11,406,70919,702,50682,345,276
230,106,543
18,760,941
$ -$ -$48,296,368 60,767,51817,263,879 20,672,65227,529,136 39,387,522
171,548.405 109,412,393
9,386,959 10,096,92719,694,980 19,122,74390,159,784 213,333,48824,096,463 22,863,71437,748,923 41,930,934
$ 74,008,169 $ 66,607,150 $80,649,806 $ 155,942,550 $161 ,864,211 $ 362,321,975 $274,024,747 $240,337,012 $171 ,700,150 $297,250,879
GASB 54 was implemented fiscal year 2011; fund balance ¡nformat¡on is not available for prior fiscal years.
't77
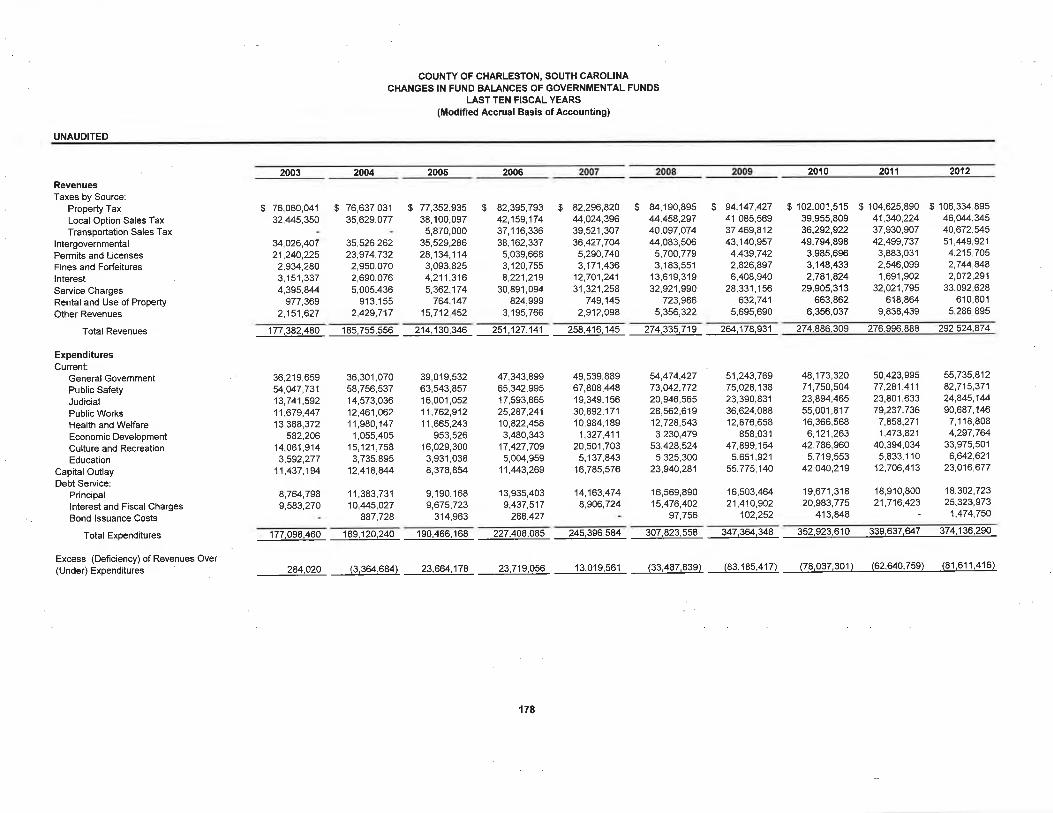
COUNTY OF CHARLESTON, SOUTH CAROLINACHANGES IN FUND BALANCES OF GOVERNMENTAL FUNDS
LAST TEN FISCAL YEARS(Modified Accrual Basis of Account¡ng)
UNAUDITED
2003 2004 2005 2006 2010 2011 2012
RevenuesTaxes by Source:
Property TaxLocal Option Sales TexTransportation Sales Tax
lntergovernmentalPermits and LicensesFines and ForfeitureslnterestService ChargesRental and Use of PropertyOther Revenues
Total Revenues
ExpendituresCurrent:
General GovernmentPublic SafetyJudicialPublic WorksHealth and WelfareEconomic DevelopmentCulture and RecreationEducation
Capital OutlayDebt Service:
Principallnterest and Fiscal ChargesBond lssuance Costs
Total Expenditures
Excess (Deficiency) of Revenues Over(Under) Expenditures
177.382.480 185,755,556 214,130,346 251,127,141 258,416,145 274,335,719 264,178,931 274.886.309 276.996.888 292.524,874
$ 76,060,04132,445,350
u,026,40721,240,2252,9U,2803,1 5l,3374,395,844
977,3692,151,627
36,219,659u,o47,73113,741,59211,679,44713,388,372
582.20614,061,9143,592,277
11,437 ,194
8,764,7989.583.270
$ 76,637,0313s,629,O77
35,526,26223,974,7322,950,0702,690,0765,005,436
913,.155
2.429.717
$ 77,352,93538,100,097
5,870,00035,529,28628,134,114
3,093,8254,211,3165,362,174
764,14715,712,452
$ 82,39s,79342,159,17437,1 16,33638,162,337
5,039,6683,120,7558,221,219
30,891,094824,999
3,195,766
$ 82,296,82044,O24,39639,521,30736,427,7045,290,7403,171,436
12,701,24131.321,2s8
749,1452,912,O98
49,s39,88967,808,448I 9,349,1 5630,892,17110,984,1 89
1,327,41120,s01,703
5,137,84316,785,576
14,163,4748,906,724
$ 84,'190,89544,458,29740,097,O74¿14,083,506
5,700,7793,1 83,551
13,619,31932,921,990
723,9865,356,322
54,474,42773,O42,77220,946,56528,562,61912,728,5433,230,479
53,428,5245,325,300
23,940,281
16,569,89015,476,402
97,756
$ 94,147,42741,085,56937,469,81243,140,9574,439,7422,826,8976,408,940
28,331 , I 56632,741
5,695,690
$ 102,001,51539,955,80936,292,92249,794,898
3,98s,6963,148,4332,781,824
29,905,3'13663,862
6,356,037
$ 104,625,89041,UO,22437,930,90742,499,737
3,883,0312,546,0991,691 ,902
32,021,795618,864
9,838,439
$ 106,334,89s46,O44,U540,672,9551,449,9214,215,7052,744,8482,072,291
33,092,628610,80 1
5,286,89s
36,301,07058,756,53714,573,03612,461,06211,980,147
1,055,40515,121,7583,735,895
12,418,844
I 1,383,73110,445,027
887,728
39,019,53263,543,8s716,001,05211,762,912I 1,665,243
953,5261 6,029,3003,931,0388,378,854
9,1 90,1 689,675,723
314,963
47,343,89965,342,99517,593,86525,287,24110,822,4583,480,343
17,427,7095,004,959
11,443,269
13,935,4039,437,517
288,427
51,243,769 48,173,32075,028,138 71,750,50423,390,83'1 23,894,46536,624,088 s5,001 ,81712,876,658 16,366,568
858,031 6,121,26347,899,1U 42,786,960
s,6s1 ,921 s,719,55355,775,140 42,c/¡O,219
16,503,464 19,671,31821,410,902 20,983,775
102,252 413,U8
50,423,99s 55,735,81277 ,261 ,41 1 82 ,7 1 5 ,37 1
23,801,633 24,845,14479,237,736 90,687,1467,858,271 7,1'18,8081,473,821 4,297,764
40,394,034 33,975,5015,833,110 6,642,621
12,706,413 23,016,677
18,910,800 18,302,72321,716,423 25,323,973
- 1,474,750
177,098,460 189j20240 190,466,168 227,408,085 245,396,534 307,823,558 347,364,348 352,923,610 339,637,647 374,136'290
284,02O (3,364,684) 23,664,178 23,719,056 13,019,561 (33,487,839) (83,185,417) (78,037,301) (62,il0,759) (81'611'416)
178

(coNTINUED)COUNTY OF CHARLESTON, SOUTH CAROLINA
CHANGES IN FUND BAI.ANCES OF GOVERNMENTAL FUNDSLAST TEN FISCAL YEARS
(Modified Accrual Basis of Account¡ng)
UNAUDITED
2003 2004 2005 2006 2007 2008 2009 2010 2011 20't2Other Financ¡ng Sources (Uses)Cap¡tal Lease ProceedsSale of GO Transportation Sales Tax BondsSale of General Obligation BondsRefunding General Obligation Bonds lssuedRefunding Certifìcates of Participation lssuedPremium on Bonds SoldPayment to Refunded Debt Escrow AgentTransfers ln
Transfers OutProceeds from Sale of Capital Assets
Special ltem
Net Change in Fund Balances
Capital Asset Expenditures
Debt Service as aPercentage of Noncapital Expenditures
431,614 $
- 63,740,000- 38,527,153- 2,753,332- (100,978,948)
6,173,477 27,328,853(10,982,211) (22,250,488)
24.645 1.144,447
844,468 $ 841,831 $- 65,000,000
1,429,404 $ 100,539 $- 150,000,000- 75,000,000
775100 $ 702.710 $ 632,831 $ 299,650- 167,000,000- 27,'100,000
$ 915,806 $
- 50,000,00020,775,OOO - 32,095,000
16,1 39,845707,763 1,978,623 - 10,789,016 - 6,493,791 - 27,995,947
(16,749,287) (21 ,447,212) - (36,334,680)11,448,598 26,475,413 20,464,780 30,244,272 30,727,314 29,771,504 69,527,149 33,s66,665(17,580,736) (32,sil,1s1) (28,357,277) (37,208,200) (36,161,026) (s5,52s,2ss) (76,474,112) (40,6e7,8s4)
1,572,599 1,390,616 194,554 46,780 220,347 467,250 70,524 247,378
Total OtherFinancing Sources (Uses) (3,868,283) 10,695,963 (3,616,750) 62,732,332 (6,268,139) 228,972,407 (4,438,265) 51,233,744 (6,243,604) 211,272,066
(9,151,217\ 1,383,940
$ (3,584,263) $ (1,e19,938) 520,047,428 $ 87,835,328 $ 6,751,422_ $19s,484,568 $(87,623,682) $(26,803,5s7)$(68,884,367)$129,660,650
$12,453,729 $'14,125,020 $10,692,730 $16,576,342 $1s,664,602 $2r,139,930 $52,710,904 $42,611,O71 $14,204,807$28,282,000
11 1% 13.O% 10.7o/o 11 2% 10 Oo/o 11 2o/o 129% 132% 12.5% 13.Oo/o
179
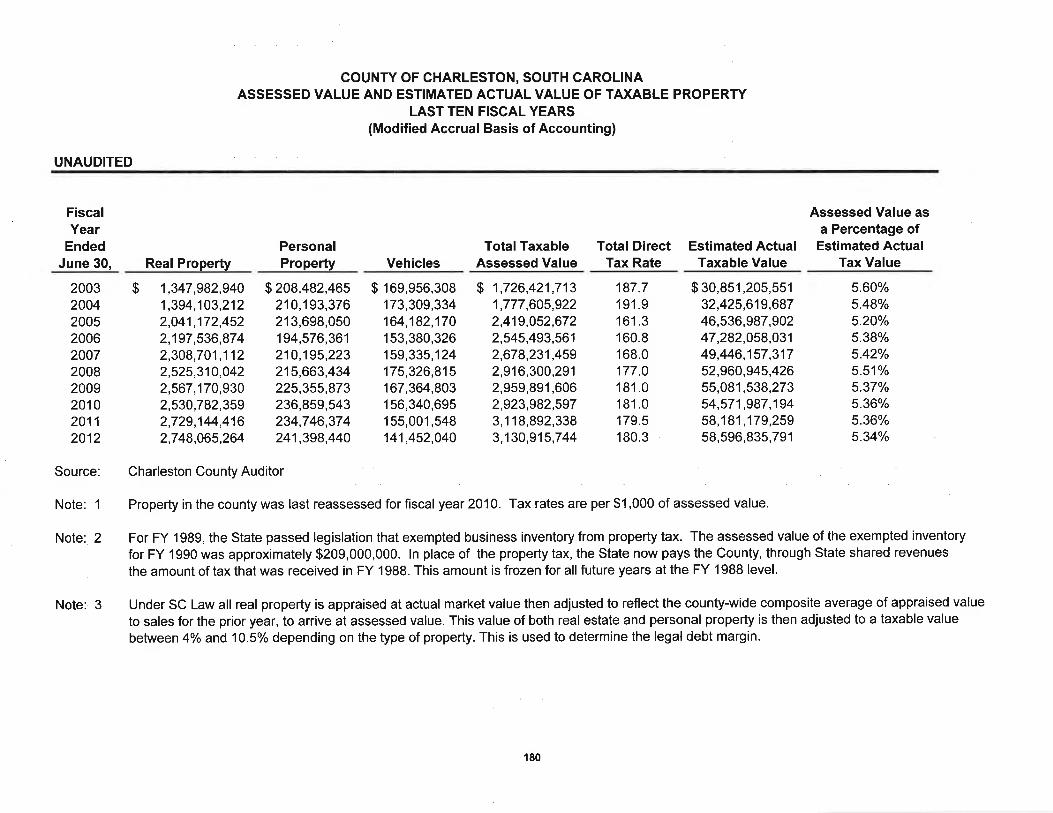
COUNTY OF CHARLESTON, SOUTH CAROLINAASSESSED VALUE AND ESTIMATED ACTUAL VALUE OF TAXABLE PROPERTY
LAST TEN FISCAL YEARS(Modified Accrual Basis of Accounting)
UNAUDITED
FiscalYear
EndedJune 30,
PersonalReal Property Property Vehicles
TotalTaxableAssessed Value
Total Direct Estimated ActualTax Rate Taxable Value
Assessed Value asa Percentage ofEstimated Actual
Tax Value
2003200420052006200720082009201020112012
$ 1,347,982,940 $ 208,482,465 $ 169,956,308 $ 1,726,421,7131 ,394,103,212 210,193,376 173,309,334 1,777 ,605,9222,041,172,452 213,698,050 164,182,170 2,419,052,6722,197,536,874 194,576,361 153,380,326 2,545,493,5612,308,701,112 210,195,223 159,335,124 2,678,231,4592,525,310,042 215,663,434 175,326,815 2,916,300,2912,567,170,930 225,355,873 167,364,803 2,959,891,6062,530,782,359 236,859,543 156,340,695 2,923,982,5972,729,144,416 234,746,374 155,001,548 3,118,892,3382,748p65264 241,398,440 141,452,040 3,130,915,744
187.7 $ 30,851,205,551191.9 32,425,619,687r 61 .3 46,536,987,902160.8 47,282,058,031168.0 49,446,157 ,317177.0 52,960,945,426181.0 55,081 ,538,273181.0 54,571,987,194179.5 58,181 ,179,259180.3 58,596,835,791
5.60%5.48%5.20%5.380/5.420/5.51%5.37%5.36%5.36%5.34%
Source: Charleston County Auditor
Note: 1 Property in the county was last reassessed for fiscal year 2010. Tax rates are per $1 ,000 of assessed value.
Note: 2 For FY 1989, the State passed legislation that exempted business inventory from property tax. The assessed value of the exempted inventory
for FY 1990 was approximately $209,000,000. ln place of the property tax, the State now pays the County, through State shared revenues
the amount of tax that was received in FY 1988. This amount is frozen for all future years at the FY 1988 level.
Note: 3 Under SC Law all real property is appraised at actual market value then adjusted to reflect the county-wide composite average of appraised value
to sales for the prior year, to arrive at assessed value. This value of both real estate and personal property is then adjusted to a taxable value
between 4% and 10.5o/o depending on the type of property. This is used to determine the legal debt margin.
180

COUNTY OF CHARLESTON, SOUTH CAROLINAPROPERTY TAX RATES - DIRECT AND OVERLAPPING GOVERNMENTS
LAST TEN FISCAL YEARS(Rate per $1,000 of Assessed Value)
UNAUDITED
2003 2004 2005 2006 2007 2008 2009 2010
County Direct Rates:Charleston County Government Operat¡ngCharleston County Government Debt ServicePark and Recreation Commission Operat¡ngPark and Recreation Commission Debt ServiceTrident Technical CollegeCounty School Board OperatingCounty School Board Debt Service
Total Direct Rate
Fire District Rates:
City/Town Rates:
Public Service District Rates:
180.2 187 7 ----Æ 1613
21.8 - 50 9 23.2 - 50.9 23-9 - 51.5 16.7 - 38.0
26.2 - 116.4 27 .9 - 116.4 28 5 -'116.4 17.9 - 1 1 5.5
72.1 - 104.5 74.2 - 104.5 74.2 - 111.4 55.2 - 111.2
50.810.43.53.72.1
89.320.4
50.8'10.4
3.53.72.1
1 05.112.1
51.39.93.5ó.12.1
109.012.4
40.26.63.52.1
2.091.1't 5.8
40.26.63.52.1
2.092.813.6
40.2663.52.1
2.095.418.2
40.26.63.62.02.0
98.723.9
40.26.63.71.92.0
98727.9
40.26.63.71.92.0
987279
39.16.13.61.82.4
98.6279
160.8
16.7 - 40.3
18.5 - 92 I
55.2 - 102.3
168 0
12.0 - 41 .5
22.4 - 92.8
51.6 - 102.3
177 0 181.0 181.0 17s5
12 0 - 42.7 12.0 - 47.7 12.0 - 48.4 11.2 - 48.6
22.2 - 92.8 22.2 - 92.8 22.2 - 92.8 22.9 - 90.0
55.2 - 102.3 57 .6 - 102 3 57.6 - 102.3 53.9 - 102 3
181

COUNTY OF CHARLESTON, SOUTH CAROLINACOMPUTATION OF DIRECT AND OVERLAPPING GOVERNMENTAL ACTIVITIES DEBT
GENERAL OBLIGATION BONDSAS OF JUNE 30,2012
Name of Jurisdiction
Gounty of Charleston
Overlapping:Park & Recreation GommissionPublic School Districts
Subtotal
Total 796,610,000 100%
Note: This schedule represents the debt of all county-wide jurisdictions. lndividual cities and other districtswithin Charleston County have debt which is paid separately from their individual tax levies. Theseindividual debts have not been included in the overlapping principal balance because the total debtdiffers within each individual jurisdiction.
This information was obtained from the Charleston County Treasurer's Office.
Principal Balance
$ seg,s4s,ooo
23,615,000209,450,000233,065,000
Percentage ofDebt Applicable tothis Jurisdiction
100Yo
100%100o/o
Jurisdiction'sShare of Debt
$ 563,545,000
23,615,000209,450,000233,065,000
$ 796,610,000
100%
182

COUNTY OF CHARLESTON, SOUTH CAROLINAPRINCI PAL PROPERTY TAXPAYERS
(Modified Accrual Basis of Accounting)
UNAUDITED
2012 2003
Taxþaver Type of Business
TaxableAssessed
Value
Percentageof TotalTaxable
AssessedValue
TaxableAssessed
Value
Percenürgeof TotalTaxable
AssessedValueRank
SC Electric & GasBoeingKapstone KraftBellSouthKiawah Real Estate Co.East Cooper Community HospitalCharleston/North Charleston MSABerkeley Electric Co-OpCharleston Place LLCCummingsKnowlogy of CharlestonComcastRhodiaCellcoTotals
Public UtilityManufacturingManufactu ring/Chem icalPublic UtilityReal EstateHospitalRetailPublic UtilityHotelManufacturingTelecommunicationsCable CompanyManufacturer - ChemicalsTelecommunications
$ 52,138,49729,448,26314,698,07612,565,7607,876,7007,070,8536,230,9405,987,5305,008,5004,411,569
$ 145,436,688
$ 33,381,300
18,088,68019,217,6015,409,640
4,300,6405,651,820
3,860,0203,405,5603,298,8602,868,030
$ 99,482,151
325
64
78910
1
2345b78
910
1.79%1.01%0.50%0.43%0.27%0.24%0.21%o.21%O.17o/o
o.15%
3.3%
1.8o/o
1.9%O.5o/o
0.4o/o
0.6%
0.4%0.3%03%03%
4.99o/o 9.9o/o
Source: Charleston County Auditor
* ln 2009 Westuaco sold its power generation plant and the paper mill to Kapstone Kraft .
183

COUNTY OF CHARLESTONPROPERTY TAX LEVIES AND COLLECTIONS
LAST TEN FISCAL YEARS
UNAUDITED
FiscalYear
EndedJune 30
Original TaxLevy for
Fiscal Year
Adjusted TaxLevy for
FiscalYear
Collected within the FiscalYear of the Levy Collections in
SubsequentYears
Total Collections to Date
Amount Amount
2003200420052006200720082009201020112012
Source:
$ 70,724,09573,504,81971,992,91275,825,36076,026,58378,854,46'l92,649,92192,300,46894,003,51298,322,816
$ 70,724,09573,504,81971,982,91275,825,36076,026,58378,854,46182,649,92192,300,46894,003,51298,322,816
$ 67,801,64570,729,99069,530,82873,525,52473,199,90175,500,62977,757,86786,401,79187,880,32092,301,957
Percentageof Levy
95.9%96.2%96.6%97.O"/"
96.3%95.7o/o
94.1"/"93.6%93.5%93.9%
$ 2,943,9042,689,5962,359,0642,211,9152,706,5333,178,4854,614,9085,886,7834,476,2391,644,227
$ 70,645,44973,419,58671,888,89275,737,43975,906,43478,679,11482,372,77592,288,57492,356,55993,946,184
Percentageof Levy
99.9%99.9%99.9%99.9%99.8%99.8%99.7"/"100.0%98.2%95.5%
This information was provided by the Charleston County Treasurer's Office.
184

COUNTY OF CHARLESTON, SOUTH CAROLINARATIO OF OUTSTANDING DEBT BY TYPE
LAST TEN FISCAL YEARSUNAUDITED
FiscalYear
EndedJune 30
GeneralObligation
Bonds
Certificatesof Capital Revenue
BondsCapitalLeases
Business-Type ActivitiesGrtäicates
$101,745,000 $ 71,416,680 $ 1,415,624 $ 20,418,320 $ 15,785,000100,755,000 71,254,819 1,306,196 13,365,181 14,525,00097,535,000 66,992,312 3,636,998 12,542,688 13,280,000
153,448,297 62,427,073 3,474,091 I 1,065,799 11,723,994146,394,774 57,631,034 3,973,002 10,23',1,634 10,491,229373,504,430 52,628,009 2,947,139 9,356,755 9,194,937363,444,567 47,313,497 3,788,455 8,419,114 7,824,327406,590,609 41,756,721 3,070,072 7,421,993 6,374,140394,957,209 35,245,570 2,910,433 6,252,256 4,943,673597,380,150 31,582,499 2,038,252 5,609,545 3,232,299
See the Schedule of Demographic and Economic Statistics for personal income and population data.
Governmental Activities
ofTotal Percentage
Primary of PersonalGovernment lncome
PerGapita
$ 649605576711666
1,3091,2391,3091,2691,821
Participation Leases Participation
2003200420052006200720082009201020112012
Ratio of Outstanding Debt to Personal lncome
5.Oo/o
4.5%
4.O%
3.5%
3.0%
2.5%
2.Oo/o
1.5%
1.0%
0.5%
o.o%2003 2010 2011 2012
- $210,780,624- 201,206,196- 193,986,999- 242,139,234- 228,621,673- 447,631,170- 430,799,960- 465,213,425- 444,109,141- 639,842,734
2.2%1.9%1.7%1.9o/o
1.7%3.6%3.2%3.3o/o
3.2%4.5%
Outstanding Debt Per Capita
$1,900
$1,700
$1,500
$1,300
$1 ,100
$900
$700
$5002003 2004 2010 2011 2012
18s

COUNTY OF CHARLESTON, SOUTH CAROL¡NARATIO OF GENERAL OBLIGATION BONDED DEBT TO
ASSESSED VALUE AND GENERAL OBLIGATION BONDED DEBT PER CAPITALAST TEN FISCAL YEARS
UNAUDITED
FiscalYear2003200420052006200720082009201020112012
EstimatedPopulation316,611321,014324,224329,482331,917342,973348,046355,276350,209351,336
Gross G.O.Bonded Debt
Ratio of G.O.Bonded Debt toAssessed Value
G.O. BondedDebt PerCapita
321314301471
4441,0581,0151,1021,0881,604
Assessed Value$ 30,851,205,551
32,425,619,68746,536,987,90247,282,058,03149,446,157,31752,960,945,42655,081,538,27354,571,987,19458,181 ,179,25958,596,835,791
$101 ,745,000100,755,00097,535,000
155,025,000147,470,000362,730,000353,265,000391,525,000380,935,000563,545,000
0.33%O.31o/o
0.21o/o
0.33%0.30%0.68%O.640/o
0.72o/o
0.65%0.96%
Note 1 Details regarding the County of Charleston's Outstanding Debt can be found in the notes to the basic financial statements.
Note 2 See the Schedule of Assessed Value and Estimated Actual Value of Taxable Property for the Property Value Data.
Note 3 See the Schedule for Demographic and Economic Statistics for population data.
Ratio of GO Bonded Dept to Assessed Value
2003 2004 2005 2006 2007 2008 2009 2010 201't 2012
GO Bonded Debt Per Capita
1,800
1,6001,400
1,2001,000
800600400200
02003 2004
186

COUNTY OF CHARLESTON, SOUTH CAROLINARATIO OF TOTAL TÐ( SUPPORTED DEBT TO
ASSESSED VALUE AND TOTAL TÆ( SUPPORTED DEBT PER CAPITALAST TEN FISCAL YEARS
UNAUDITED
Fiscal EstimatedYear Population2003 316,6112004 321,0142005 324,2242006 329,4822007 331,9'172008 342,9732009 348,0462010 355,2762011 350,2092012 351,336
Assessed Value
GeneralObligation
Bonds
Certificatesof
Participation$ 71,416,680
71,254,81966,992,31262,427,07357,361,03452,628,00947,313,49841,756.72135,245,57031,582,499
Net TaxSupported
Debt$174,577,304
173,316,015168,164,310220,926,154207,628,810429,018,962413,665,460450.707.622432,486,387631.000.901
Ratio of TaxSupported Debt
to AssessedValue0.57o/o
0.53%036%0.47%0.42o/o
0.81o/o
0.75%0.83%0.74%1.O8%
Net TaxSupportedDebt PerGapita
551
540519671626
1,2511,1891,2691,2351,796
GapitalLeases
$ 30,851,205,55132,425,619,68746,536,987,90247,282,058,03149,446,157,31752,960,945,42655,081,538,27354,571,987,19458,181,179,25958,596,835,791
$ 101,745,000100,755,00097,535,000
155,025,000146,394,774373,504,430363,444,567406,590,609394,957,209597,380,150
$1,415,6241,306,1963,636,9983,474,0813,873,0022,886,5232,907,3952,360,2922,283,6082,038,252
Note 1 Details regarding the County of Charleston's Outstanding Debt can be found in the notes to the basic financial statements.Note 2 See the Schedule of Assessed Value and Estimated Actual Value of Taxable Property for the Property Value Data.Note 3 See the Schedule for Demographic and Economic Statistics for population data.
Rat¡o of Tax Supported Debt to Assessed Value
1.20o/o
1.00%
0.80%
0.60%
0.40%
0.20%
0.00%2003 2004 2005 2006 2007 2008 2009 2010 20'l'l 2012
Fiscal Year
Tax Supported Debt Per Capita
2004 2005 2006 2007 2008 2009 2010 2011 2012
1,900 --1,800 +-1,700 +-r,600 +-1,s00 +1,400 -l-1,300 +-1,200 l-1,100 j-1,000,
900800700600500400300200
2003
Fiscal Year
187

COUNTY OF CHARLESTON, SOUTH CAROLINALEGAL DEBT MARGIN INFORMATION
LAST TEN FISCAL YEARS
UNAUDITED
Debt Limit
Total Net Debt Appl¡cable to Debt Lim¡t
Legal Debt Margin
Total Net Debt Appl¡cable to DebtLim¡t as a Percentage of Debt Limit
2003 2004 2005 2006 2007
$140í76,777 5144þ34276 $195,786,861 $205,995,772 $ 216,723,669
80,245,000 78,558,957 75,338,957 69,974,368 64,575,697
$ 235,740,344 $ 239,227,649 $ 23s,980,407 $ 251,666,874 $ 257,590,000
136,260,341 132,862,801 184,650,000 173,825,000 193,600,000
$60,231,777 $ 66,075,319 $120,447,904 $136,021,404 $ 152,147,972 $ 99,480,003 $ 106,364,848 $ 51,330,,107 $ 77,841,874 $ 63,990,000
57.1% 54.3% 38.5% 34.0% 29.80/o 57.80/o 55.5% 78.2% 69.1% 75.2Yo
Net Debt as a Percentage of Debt Llm¡t
2003 2004 2005 2006 2007 2008 2009 20'to 2011 2012
Legal Debt Marg¡n Calculation for F¡scal Year 2012
Total Assessed Value
Debt Limit (8% of Total Assessed Value)
Amount of Debt Appl¡cable to Debt Limit:Total Bonded DebtLess: Debt lssued Through Referendum
Total Amount of Debt Appl¡cable to Debt Limit
Legal Debt Margin
$ 3,219,875,002
257,590,000
563,545,000(369,945,000)
193,600,000
$ 63,990,000
assessed value of the property therein w¡thout voter approval.

COUNTY OF CHARLESTON, SOUTH CAROLINAPLEDGED REVENUE COVERAGE
REVENUE BOND COVERAGEENVIRONMENTAL MANAGEMENT ENTERPRISE FUND
UNAUDITED
Debt Service Requirements
FiscalYear
GrossRevenues
$ 30,172,89633,291,52334,588,46137,566,51040,753,40345,999,98939,875,18931,007,57627,288,18729,579,086
OperatingExpenses
$ 23,621,98325,611,60127,570,46531,391,26629,554,14139,615,96342,880,89733,276,01319,130,05320,512,271
Net RevenueAvailable forDebt Service
$ 6,550,9137,679,9227,017,9966,175,244
11,199,2626,384,026
(3,005,708)(2,268,437)8,1 58,1 349,066,8r 5
Principal
$ 1,005,0001,060,0001,245,0001,225,0001,275,0001,335,0001,405,0001,480,0001,555,0001,630,000
lnterest Coverage
3.264.323.763.295.963.41-1.60-1.21
4.334.82
Total
2003200420052006200720082009201020112012
Note: I
Note:2
Note: 3
$ 1,002,579716,904620,262651,750602,750539,000472,250402,000328,000250,250
$ 2,007,5791,776,9041,865,2621,876,7501,877,7501,874,0001,877,250'1,882,000
1,883,0001,880,250
Details regarding the County of Charleston's outstanding debt can be found in the notes to the basic financial statements.
Gross revenues include interest, operating grants, and loss on disposal of capital assets.
Total operating expenses are exclusive of depreciation and amortization.
189

COUNTY OF CHARLESTONDEMOGRAPHIC AND ECONOMIC STATISTICS
LAST TEN F¡SCAL YEARSUNAUDITED
FiscalYear
EndedJune 30
Personallncome
Per GapitaPersonallncome
UnemploymentRate
SchoolEnrollmentPopulation
324,900332,561336,865340,625343,522342,973348,046355,276350,209351,336
MedianAge
34.535.335.536.236.036.036.036.936.035.0
2003200420052006200720082009201020112012
$ 9,763,420,00010,569,980,00011,594,427,00012,517,629,00013,295,048,00012,380,254,00013,295,048,00013,844,61 1 ,00013,845,863,00014,079,924,000
30,05131,78434,41936,74938,70236,09738,19938,96939,53640,075
4.2o/o
4.4o/o
4.7%5.0%5.0%4.5o/o
5.3o/o
8.6%9.4o/o
7.8o/o
4't,71243,81443,46543,33542,74242,30s42,48242,94243,79645,076
Some of the statistics for Fiscal Year Ended June 30, 2004 and beyond are estimated from past year trend analys¡s.
Population
360,000
355,000
350,000
345,000
340,000
335,000
330,000
325,000
320,000
315,000
The following Data Sources were used to develop this information:South Carolina Office of Research and StatisticsCharleston County Chamber of CommerceCharleston County School District - 45 Day EnrollmentSouth Carolina Association of Counties
Per Capital Personal lncoms
50,000
45,000
40,000
35,000
30,000
25,0002003 2004 2005 2006 2007 2008 2009 2010 2011 2012
190

COUNTY OF CHARLESTON, SOUTH CAROLINAPRINCIPAL EMPLOYERS
CURRENT YEAR AND NINE YEARS AGO
UNAUDITED
Gounty Employment Íor 2012Gounty Employment for 2003
Employer
163,502146,191
2012 2003
Number ofPercentage ofTotal Gounty Number of
Employees
8,2005,0004,000
1,800
2,243
2,447
12,5435,0002,8582,08244,091
Percentage ofTotalCountyEmployment
5.61%3.42%2.74o/o
1.23%
1.53%
1.67%
1.95%1.42%18.16%
Joint Base CharlestonMedical University of South Carolina (MUSC)Charleston County School DistrictRoper St. Francis HealthcareBoeing CharlestonJEM Restaurant Group lnc.Trident Medical Center (Trident Health System)College of CharlestonCounty of CharlestonWal-MartPiggly Wiggly Carolina Co. lnc.City of CharlestonUS Navy 1
Charleston Air Force Base 1
Mead WestvacoColumbia/HCA Carolna's HQ & Med CenterTotals 67,200
Employees Rank Employment
22,00013,0005,3005,1 005,9003,0002,5002,4002,3002,3001,8001,600
27.640/o
245
10
I
7
1
369
1
2345b78I10
13/6%7.95%3.24%3.12%3.61%1.83%1.53%1.47o/o
1.41%1.41o/o
110%0.98%
t ln 2O1O all military installations were combined to form Joint Base Charleston
Source: Charleston Metro Chamber of Commerce, Center for Business Research.
191

COUNTY OF CHARLESTON, SOUTH CAROLINAFULL-TIME EQUIVALENT COUNTY GOVERNMENT EMPLOYEES BY FUNCTION
LAST TEN FISCAL YEARS
UNAUDITED
Function 20042003 2005 2006 2007 2008 2009 2010 2011 2012
General GovernmentCounty CouncilAdministratorAssessorAssist Admin for FinanceAssist Admin for Gen SvcsAssist Admin for Human SvcsAssist Admin Trans. & PWAuditorBudgetCommunity ServicesDelinquent TaxElectionsA/oter RegistrationFacilities Mgnt.FinanceHuman ResourceslnternalAuditorlnternal ServicesLegalLegislative DelegationNondepartmentalOrganization DevelopmentProcurement ServicesRadio CommunicationsRegister Mesne ConveyanceRevenue CollectionsSafety & Risk ManagementTechnology ServicesTreasurerZoning/PlanningOther (No Longer Used)
Total General Government
15.00 15.00 15.00 15.003.00 3.00 3.00 3.00
30.00 30.00 30.00 30.005.00 6.00 6.00 6.006.00 6.00 6.00 6.0013.00 13.00 8.00 9.0019.00 18.00 '18.00 18.0025.00 25.00 25.00 26.00
6.00465.91 383.91 382.41 380.41
31.006.00
12.2512.0O
8.5020.0014.0015.002.00
149.605.563.00
11.005.00
44.005.00
11.007.00
44.005.00
30.006.00
11.2512.008.50
17.0014.0014.002.00
77.605.563.00
11.007.00
47.005.00
30.006.00
11.2512.0010.0017.0014.0014.002.00
76.605563.00
11.007.00
47.005.00
30.006.00
11.2512.0010.0017.0014.0014.002.00
72.605.563.00
11.007.00
47.004.00
300
29.008.009.75
12.0010.0016.0014.0014.002.00
68.606.563.00
4.0016.00
33.006.006.00
17.0018.0024.00
11.007.00
49.004.00
3.00
29.008.009.75
12.0010.0014.0014.0014.002.00
68.606.423.00
4.0016.00
33.0022.00
6.0017.0018.0024.00
11.006.31
53.004.004.003.00
30.008.008.75
10.00r 0.0012.OO
15.00'17.00
2.0067.80
8.423.00
4.3516.00
32.0022.00
6.0017.0018.0024.00
I 1.005.31
51.004.004003.00
29.007.008.15
10.0010 0011.0013.0015.002.00
61.807.423.00
3.3515.00
27.0022.00
6.0016.0018.0022.00
11.006.80
53.004.003.004.000.10
31.008.007.40
10.0062.0013.0016.002.00
60.006.673.00
12.00
14.00
27.0030.00
5.0016.0019.0021.00
12.005.90
53.004.003.003.000.10
31.007.006.40
10.0075.2512.0017.002.00
30.506.413.004.00
14.00
27.0025.00
5.0025.2520.0020.60
192
388.91 404.77 412.63 385.03 444.97 422.41

(coNTTNUED)COUNTY OF CHARLESTON, SOUTH CAROLINA
FULL.TIME EQUIVALENT COUNTY GOVERNMENT EMPLOYEES BY FUNCTIONLAST TEN FISCAL YEARS
UNAUDITED
Function 2003 2004 200s 2006 2007 2008 2009 2010 2011 2012
22.00
7.00167.00
1.00702.31
21.00
6.00170.00
1.00741.31
21.00
20.0016'1.00
1.00777._31
22.00
25.00169.00
1.00779.31
22.00
27.00174.00
1.00780.31
22.00
30.00174.00
2.00792.31
24.001.00
30.00165.00
808.112.00
21.0072.5024.50
139.50
834.112.00
22.00 21.00100.25 120.0034.00 33.00
134.00 l5'1.50
828._74 836._74
Public SafetyBuilding lnspectionsConsolidated DispatchEmergency ManagementEmergency Medical Svcs.PlanningSheriffTechnology ServicesOther (No Longer Used)
Total Public Safety
JudicialClerk of CourtCoronerMagistrates CourtsMaster-ln-EquityProbate CourtsPublic DefenderSolicitor
TotalJudicial
Public WorksAdministratorRevenue CollectionsChief Deputy AdministratorEnvironmental ManagementOrganizational DevelopmentProcurement Svcs.Public WorksTransportation Development
Total Public Works
899.31 939.31 980.31 996.3'1 1,004.31 1,020.31 1,030.11 1.093.61 1 18.99 1.162.24
53.006.00
67.896.00
19.30
77.00
11.00
127.00
162.00
53.006.00
ô7.896.00
19.30
79.00
11.00
126.00
1s9.00
53.006.00
68.896.00
19.30
79.00
12.00
126.00
159.00
53.006.00
70.416.00
19.30
81.00
12.001.00
126.00
161.00
54.006.00
70.416.00
19.30
88.00
13.001.00
126.00
r68.00
54.007.00
70.417.00
20.30
91.00
54.008.00
69.417.00
20.30s2.0093.00
55.008.00
68.397.00
19.3052.0096.00
56.00 57.008.00 9.00
68.13 68.637.00 7.00
19.30 19.8052.00 52.00
11 1.00 102.00229.19 231.19 232.19 235.71 243.71 249.71 303.71 305.69 321.43 315.43
1.00128.00
176.00
0.69
127.001.65
164.00
0.69
134.201.65
150.00
0.69 0.30
132.26 130.40
2.OO 3.00138.02 136.0021.63 21.41
300.00 297.00 300.00 308.00296.00
193
305.00 293.34 286.54 294.60 291.11

(coNTTNUED)COUNTY OF CHARLESTON, SOUTH CAROLINA
FULL.TIME EQU¡VALENT COUNTY GOVERNMENT EMPLOYEES BY FUNCTIONLAST TEN FISCAL YEARS
UNAUDITED
Function 2003 2004 2005 200920072006 2008 2010 2011 2012
2.0018.75
125.0026.00
4.00
2.0025.75
131.0024.00
3.00
2.0025.75
131.0024.00
3.00
2.0025.75
131.0024.00
3.00
2.0026.25
133.0023.00
3.00
2.0036.25
137.0023.00
4.00
2.0033.25
129.0024.00400
2.0033.85
111.0020.00
4.00
2.00 1.005.60 5.60
107.00 102.0020.00 20.004.00 4.00
Health and WelfareFacilitiesCopmmunity ServicesDAODASPublic WorksVeterans Affairs
Total Health and Welfare
Culture and RecreationAssist Admin for Transportation
& Emergency ManagementGreenbeltPlanningRevenue Collections
Total Culture and Recreation
Economic DevelopmentTotal Economic Development
175.75 185.75 185.75 185.75 187 .25 202.25 192.25
2.00
170.85 138.60 132.60
1.80
2.00
3.00 3.00 3.00 3.001.003.00
1.001.30
1.00 1.00 2.OO
1.00 2.00 2.00 2.00 2.00 3.00 3.002.00 2.00 3.00 3.001.00 2.OO 2.00
2,071.16 2,038.16 2,079.66 2,100.18 2,135.18 2J86.04 2,237.04
1.80 2.OO r.30
3.00 5.00 5.003.00 5.00 5.00
Total 2,246.52 2,325.59 2,330.09
Source: Charleston County Budget Department
Note: I lncludes the Authorized Full Time Employees for both Government and Business-type Activities
194

COUNTY OF CHARLESTON, SOUTH CAROLINAOPERATING INDICATORS BY FUNCTION/PROGRAM
LAST TEN FISCAL YEARS
UNAUDITED
Function/Proqram 2003 2004 200s 2006 20't2200920082007 20'lo 2011
General GovernmentAuditor - Tax Notices ProcessedRMC Documents RecordedZoning Applications Processedlllegal Businesses Located
Public SafetyBuilding lnspections PerformedBad Check Warrants ServedDaily Costs Per Prisoner
JudicialMarriage Licenses lssuedMaster-in-Equity Cases Disposed of
Health and WelfareVeterans Claims Filed
Economic DevelopmentNumber of New Companies Relocating to CharlestonNumber of New Jobs From Relocating Companies
Number of Expanding Employers in CharlestonNumber of Jobs Resulting from Expansion
Culture & Recreat¡onLibrary Visits Per CapitaLibrary Cards ln Use
Environmental ManagementTotal Tons of lncinerated Waste
Parking GaragesAverage Operating Revenue Per SpaceAverage Operating Expenditure Per Space
503,520143,674
2,761982
15,965
2,63233
2,275833
7,318
6888
4141
5.26309,033
220,000
1,0321,059
520,000142,244
3,340998
18,323
2,43240
2,4291,323
7,438
00
5.50247,82'l
230,673
1,1241,091
545,000143,500
3,400831
22,5637,107
40
3,7121,248
8,505
41,767
1
180
5.60277,688
222,108
1,384685
600,000147,569
3,741714
28,1913,774
40
3,733718
8,038
t
328
6.21
350,320
227,383
1,623945
s90,283133,772
3,336278
23,7026,124
40
3,877998
9,215
1
25
6.38329,189
227,514
1,7771,'115
521,701116,770
3,266346
22,5196,194
55
3,7691,390
9,215
4390
1
30
6.66355,481
211,907
I ,913984
550,00084,7112,846
86
15,472
6,59455
3,8462,227
10,254
6.99310,417
188,626
2,1141,852
575,00090,890
2,500117
12,577gjoT 1
55
3,7643,560
10,688
1
30
34,275
701326,600 2
69,215
2,0431,179
1
1000
3320
ó
2682
300
585,470 583,24087,894 97,1371,206 1,327172 154
17,634 19,40001 o55 55
4,000 4,2003,459 2,063
522 2,871
.)J
120 360
45323 492
6.05 5.54284,617' 269,552
nlanla
2,287 2,2641,742 1,683
Sources: Charleston County Budget Performance MeasuresI The Sheriffs Office no longer performs this function. The Solicitor's "Worthless Check" Unit now performs this functions. No indicators available.
' Library system was purged of old unused accounts in2012.
195

COUNTY OF CHARLESTONCAPITAL ASSETS BY FUNCTION
LAST TEN FISCAL YEARS
UNAUDITED
Function 2003 2004 2005 2006 2007 2008 2009 2010 2011 2012
General GovernmentAutomobiles 60 70 77 80 84 91 80 79 92 1 18Buildings 21 21 28 28 28 44 97 99 104 102
Public SafetyPolice Gars 149 197 231 290 325 316 332 324 336 333Fire Trucks 0 6 7 I 11 11 10 10 10 10Ambulances 0 0 17 23 24 28 22 23 24 25
JudicialMagistrate Courts 14 14 14 14 15 15 15 15 '15 15
Public WorksPaved Streets (in Miles) 124 163 186 195 132 129 128 129 129 131
Ground Equipment 31 32 33 43 51 62 60 65 67 69Heavy Trucks 20 21 21 25 29 35 35 35 35 34
Environmental ManagementCollection/Refuse Trucks 20 23 27 33 37 45 44 48 44 47Ground Equipment 11 '13 13 16 19 24 26 25 26 27
Culture & RecreationLibraries, Main and Branches 16 16 16 16 16 16 16 11 11 11
Note 1. Town of James lsland was created in 2007 creating a decrease in county owned infrastructure.
Note 2. Some indicators have been added through the years.
Note 3. There was a review of buildings in fiscal year 2008 that reorganized the buildings and assigned more to the general government.
Note 4. Charleston County owns 11 libraries and leases 5 libraries.
196

COUNTY OF CHARLESTON, SOUTH CAROLINASOLID WASTE USER FEE RATE HISTORY
LAST TEN FISCAL YEARS
UNAUDITED
Residential Non-Residential
FiscalYearEnded June
30Single Family
Residences (l)Multi-Family
Residences (2)One-half Cubic Yardor Less Per Week (3)
More Than One-halfGubic Yard Per Week (4)
(s)
2003200420052006200720082009201020112012
155155155155155172172172172172
78787878788686868686
63636363637070707070
8989898989oo
999999oo
(1) Per residence.
(2) Per unit.
(3) Per property.
(4) Per average number of cubic yards per week.
(5) ln 2011 County Council approved a one time $25.00 credit for all Single Family and Multi-Family Residences.
197

COUNTY OF CHARLESTON, SOUTH CAROLINAUSER FEE BILLING HISTORY
LAST TEN FISCAL YEARS
UNAUDITED
FiscalYearEnded June
30 User Fee Billed
User Fee Appliedto Payment of
the Disposal Fee
(350,000)13,772,42611,676,96510,805,77710,636,050
9,846,1816,347,9044,868,2767,006,550
User Fee Appliedto OtherPurposes
$ 23,809,469 $17,960,1819,992,175
24,631,6371 1,843,919I 0,1 59,1 5021,138,07422,689,167
7,286,31511,517 ,490
Net Unused UserFee
Year End WorkingCapitalBalance
(A)
$ ¿5,216,61942,618,10036,491,11133,144,02342,744,16038,076,48335,697,07944,456,59451,691,33842,524,045
User FeeRevenue
2012201120102009200820072006200520042003
26,328,706 $23,734,85227,815,33827,398,66226,840,07523,539,94423,203,44022,808,94321,547,73521,093,317
26,407,98823,737,17027,111,68926,708,36526,229,89223,174,60421,464,63621,802,32721,321,88420,689,423
2,598,5196,126,9893,347,088
(9,600,137)4,667,6772,379,404
(8,759,515)(7,234,744)9,167,2932,165,383
(A) Working capital balance net of revenue bond related funds.
198

COUNTY OF CHARLESTON, SOUTH CAROLINADISPOSAL FEE HISTORYLAST TEN FISCAL YEARS
UNAUDITED
Gross Disposal Fee Trust Sources Used To Pay Disposal Fee Trust
Fiscal YearEnded June
30
IncineratorOperations Debt Service
Total DisposalFee
Steam Sales(r)
s-Electric Sales Equity Payment
User Fee Total SourcesApplied to Used to Pay
Disposal Fee Disposal Feelnterestlncome
2012201120102009200820072006200520042003
4,886,40711,000,70710,676,23910,217,1889,742,4837,910,8147,719,1907,849,844
10,372,14211,200,56111,865,2941',t,523,25810,015,2797,326,3495,769,1426,064,112
15,258,54922,203,26822,541,53321,740,44619,757,76215,237,16313,488,33213,913,956
13,772,4261'1,676,86510,805,77710,636,0509,846,1816,347,9044,868,2767,006,550
15,258,54922,203,26822,541,53321,740,44619,757,76215,237J6313,487,33213,913,956
630,6185,760,1815,984,8613,772,5003,430,8333,6s4,2653,498,3333,363,333
583,3054,590,6735,312,2765,787,1244,698,3084,493,5144,856,8303,329,393
272,200175,549438,619
1,544,7721,782A40
761,480263,893214,680
(1) ln April 1996 the United States Navy closed its base in Charleston, South Carolina.Since that date the Navy has been making the minimum required payments under the Navy Steam Agreement.
The Incinerator was demolished in December 2010.
199

COUNTY OF CHARLESTON, SOUTH CAROLINAKEY FAC|LITY OPERATTONAL DATA (r)
SOLID WASTE ENTERPRISE FUND
2002 2003 2005 2006 200720042001 201020092008 2011
MSW Processed (tons)Ash Generated (wet tons)Ash Generation Rate (percent of MSW)Boiler Availability (percent of time)
Unit AUnit B
Facility Utilization (percent of designsteaming rate)Steam Sales (Mlbs)Electricity Sales (MWh)
(1) Facility Operating Years from December1 through November 30 of the year listed.
The lncinerator was demolished inDecember 2010
200,682 209,896 207,24954,920 55,813 55,01327.4% 26.60/o 26.5%
230,673 225,005 226,16355,643 55,700 58,55724.1o/o 24.8o/o 25.9o/o
91.5% 89.6% 89.5%94.5Yo 89.6% 91.7o/o
95.5% 92.4% 93.9%500,000 500,000 500,00072,767 66,106 69,853
82.4o/o
84.5%80.3% 87.5%81.7% 84.9o/o
222,11058,33526.3o/o
88.6olo
86.0%
91.2o/o
500,00067,027
203,02950,700
25.00o/o
83.10%81.70%
84.600/0
500,00059,593
N/AN/A
N/AN/AN/A
N/AN/A
N/AN/A
N/AN/AN/A
N/AN/AN/A
N/AN/AN/A
N/AN/AN/A
N/AN/AN/A
84.7o/o 80.6% 87.2%500,000 500,000 500,00049,908 54,826 66,557
200

COUNTY OF CHARLESTON, SOUTH CAROLINAFINANCIAL ASSURANCE COVERAGE
MUNICIPAL SOLID WASTE LANDFILL FACIL]TIES
LOCAL GOVERNMENT FINANCIAL TEST:
1. Financial component:
A. Bond rating requirement: lnvestment grade bond rating of no less than BBB.The County's current general obligation bond ratings are:
Moody's lnvestors Service AaStandard & Poors Corporation AAAFitch, lnc. AAA
B. Financial ratio alternative:The prescribed financial ratios computed under GAAP are:
1. Ratio of cash and marketable securities to total ependitures - Primary Government
Cash and cash equivalentsTotal expenditures
Requirement is no less than 5 percent
2. Ratio of annualdebt seruice ependitures - Primary Government
Total debt service ependituresTotal expenditures
Requirement is no more than 20 percent
Financial assurance limitation test:
Financial assurance limitation under f inancial test:
Total Revenue - Primary Government
Maximum percent of revenue eligible forseÌf -insured local government f inancial test
Limitation on deferred cost of closure
$ 382,446,145
431"
$ (22,109,00s)$ (5,360,000)
36.71ïo
10.46To
$ 1M,451,842
$ 17,538,000
$ 146,913,842
Total estimated closure and post-closure costs for County landfills:
Estimated costs from Note lll.G. on landf ill closure $ 45,007,005Less: Expenditures to date
Restricted assets committed to closure
Balance of closure costs being deferred
Additional permissible deferred cost
201

THIS PAGE INTENTIONALLY LEFT BLANK