united states government accountability office premiums in the private individual market are...
TRANSCRIPT

GAO-09-730R State High-Risk Health Insurance Pools
United States Government Accountability Office
Washington, DC 20548
July 22, 2009
The Honorable Henry A. Waxman Chairman Committee on Energy and Commerce House of Representatives
The Honorable John D. Dingell Chairman Emeritus Committee on Energy and Commerce House of Representatives
The Honorable Frank Pallone, Jr. Chairman Subcommittee on Health Committee on Energy and Commerce House of Representatives
Subject: Health Insurance: Enrollment, Benefits, Funding, and Other Characteristics of
State High-Risk Health Insurance Pools
A growing number of states—35 as of June 2009—have created high-risk health insurance pools (HRPs) primarily to provide coverage to individuals whose health status limits their access to coverage in the private individual health insurance market.1 HRPs—typically state-run nonprofit associations—often contract with a private health insurance carrier to administer the pool and offer a range of health plan options to such individuals, who are commonly referred to as medically uninsurable.2 Plan options vary within pools and from state to state, and like the private individual market, HRPs typically impose waiting periods
1Participants in the private individual market include self-employed people; people whose employers do not offer health insurance coverage; people not in the labor force; early retirees who no longer have employment-based coverage and are not yet eligible for Medicare; and people who lose their jobs and have exhausted or are ineligible for continuation of employer-based coverage. 2Individuals who—due to a preexisting health condition—have been rejected for coverage or charged higher premiums in the private individual market are typically eligible for HRP coverage. Other groups of individuals may also be eligible for HRP coverage. States may use HRPs to implement the group market to individual market portability provision of the Health Insurance Portability and Accountability Act (HIPAA) of 1996. Pub. L. No. 104-191, title I, §111, 110 Stat. 1936, 1978. HIPAA requires that individuals with prior group coverage must have continued access to nongroup coverage with any preexisting condition waiting periods waived. In addition, states can designate HRPs as qualified health coverage for displaced workers and retirees eligible for the federal Health Coverage Tax Credit, under the Trade Adjustment Assistance Reform Act of 2002. Pub. L. No. 107-210, Div. A, §201 (a), 116 Stat. 935, 954.
for coverage of preexisting conditions to discourage medically uninsurable individuals from foregoing health insurance until they require care.3
Because of the higher health care costs typically incurred by medically uninsurable individuals, all pools operate at a loss. Premiums for HRP health plans are higher than for plans offered to healthy individuals in the private health insurance market; however, these premiums are capped to limit enrollees’ costs and are thus insufficient to cover the costs of enrollee health care claims.4 As a result, all HRPs supplement their revenues through various funding mechanisms, such as assessments on health insurance carriers and state general revenues.
Federal grants are also awarded to establish and fund HRPs. As part of the Trade Adjustment and Assistance Reform Act of 2002, Congress established a program to provide grants to HRPs to offset losses and establish HRPs—commonly referred to as operational and seed grants, respectively.5 Subsequent legislation authorized funding for the program through 2010, including grants to be used for supplemental consumer benefits—commonly referred as bonus grants.
to
n the
6 Since 2003, the grant program has awarded nearly $286 million to state HRPs for various purposes. The Centers for Medicare & Medicaid Services (CMS), withiDepartment of Health and Human Services (HHS), administers this federal grant program.
Recent health care reform proposals call for an expanded role for HRPs to enhance health insurance options for the medically uninsurable. Because of the federal funding provided to HRPs, you expressed interest in obtaining data on several aspects of each state HRP. In this report, we describe (1) HRP enrollment and enrollee demographics; (2) HRP plans’ cost-sharing provisions, coverage restrictions, and premiums, and comparable information for certain private market health plans; and (3) HRPs’ governance, expenditures, and funding.
To address our three objectives, we administered a Web-based data collection instrument (DCI) to senior officials of the 34 HRPs in operation in 2008.7 The data obtained were generally for fiscal year 2008, although for certain questions we obtained additional historical data. Because each HRP offers multiple plan options to enrollees, in order to simplify comparisons of plan-specific cost-sharing provisions, benefits, coverage restrictions, and premiums, we limited many of our comparisons to each pool’s most popular plan—i.e., the plan chosen by the most enrollees. Collectively, the most popular plans covered 41 percent of
3Most states offer waivers for the waiting period for coverage of preexisting medical conditions. Examples of criteria to qualify for a waiver often include involuntary termination of coverage by a previous carrier or previous creditable coverage within the past 12 months, among others. HIPAA-eligible enrollees are not subject to preexisting condition restrictions. 4Where funding is limited, an HRP may need to restrict enrollment by various means, such as by temporarily closing the pool to new enrollees or maintaining a waiting list. 5Pub. L. 107-210, Div. A, § 201(b), 116 Stat. 935, 959. 6See, the Deficit Reduction Act of 2005, Pub. L. 109-171, § 6202, 120 Stat. 4, 134 (2006) and the State
High Risk Pool Funding Extension Act of 2006, Pub. L. 109-172, § 2, 120 Stat. 185. The State High Risk Pool Funding Extension Act authorized a total of $75 million in operational and bonus grants for each of fiscal years 2006 through 2010 and $15 million in seed grants for fiscal year 2006. Bonus grants are to be used for supplemental consumer benefits such as premium subsidies, disease management programs, and HRP expansion efforts. 7We did not include the North Carolina HRP in our DCI because it was not operational until 2009.
GAO-09-730R State High-Risk Health Insurance Pools 2

the enrollees across the 34 HRPs.8 To ensure the clarity and precision of our DCI questions, we pretested the DCI with officials of the National Association of State Comprehensive Health Insurance Plans (NASCHIP), an organization that provides educational resources and information to assist state HRPs in their operation. We also received comments on the DCI from a CMS official involved in the HRP federal grant program. We received responses to the DCI from all 34 HRPs, although not every HRP responded to every question in the DCI. We relied on the data as reported by the HRPs and did not independently verify or evaluate these data. However, we reviewed all responses for reasonableness and consistency, and we clarified apparent irregularities by comparing the data to other sources, such as an annual compendium of HRP statistical information compiled by NASCHIP. In addition, we followed up with state HRP representatives for clarification where necessary. Based on these activities, we determined these data were sufficiently reliable for the purpose of our report.
We supplemented information obtained through the DCI with additional data and analyses. For our first objective, we estimated the number of individuals potentially eligible for HRP enrollment because they were uninsured and had one or more preexisting health condition. To do this, we used 2006 Medical Expenditure Panel Survey (MEPS) data to determine the percentage of uninsured individuals with at least one chronic condition that was diagnosed or treated in 2006. We then applied that percentage to Current Population Survey (CPS) estimates of the number of uninsured individuals in each of the 34 states with HRPs.9,10 We assessed the reliability of the MEPS and CPS data by reviewing related documentation and by testing the MEPS data to identify outliers, missing data, and other potential sources of errors, and we determined they were sufficiently reliable for our purposes. For our second objective, we compared selected HRP benefits and coverage restrictions to those found in employer-sponsored health insurance plans by obtaining data from two annual surveys—the Kaiser Family Foundation and Health Research and Educational Trust (KFF/HRET) Employer
Health Benefits Annual Survey and the Mercer National Survey of Employer-Sponsored
Health Plans.11 KFF/HRET presents annual data based on its survey of a random sample of private and public-sector employers, which it implements from July through May each year. Mercer presents annual data based on its survey of a random sample of private-sector employers, which it implements in July of each year. For each of these surveys, we reviewed
8In this report, we refer to the primary policyholders as enrollees. 9The MEPS and CPS data we used were the most currently available at the time we performed our work. We used the 2006 MEPS, which is a set of large-scale surveys of families and individuals, their medical providers, and employers across the United States administered by the Agency for Healthcare Research and Quality. MEPS collects information regarding individuals’ demographics, health status, and insurance status, among other characteristics. We also used data published in the U.S. Census Bureau’s report, Income, Poverty, and Health Insurance Coverage in the United States: 2007, on the 3-year average (2005-2007) of the uninsured populations by state. These data were based on the CPS Annual Social and Economic Supplement, which is a household survey that collects demographic information, such as employment and health insurance status, among other characteristics. 10Our estimate of individuals potentially eligible for HRP enrollment may be understated because we excluded from our MEPS analysis individuals with conditions that are not always chronic in nature or that were diagnosed or treated prior to 2006. Conversely, our estimate could be overstated to the extent it includes uninsured individuals who may not be eligible because they had access to other private or public coverage but chose not to enroll. The CPS estimates of the uninsured in each state are subject to sampling error of plus or minus 1.3 percent at the 90 percent confidence level. 11We compared HRP benefits and coverage restrictions to those in employer-sponsored plans because, according to model legislation prescribed by the National Association of Insurance Commissioners (NAIC), HRP plan benefit levels and deductibles should be comparable to coverage provided by large employers in the state. NAIC model legislation provides a basis for the uniform regulation of HRPs throughout the states.
GAO-09-730R State High-Risk Health Insurance Pools 3

the survey instruments and methodology and determined that the data were sufficiently reliable for our purposes. To compare trends in HRP premiums to those in the private health insurance market, we compared HRP premium data reported in our DCI to premium estimates for the private individual health insurance market published by America’s Health Insurance Plans (AHIP)—a health insurance trade association—and for the employer-sponsored health insurance market published by KFF/HRET. Finally, for our third objective, we supplemented the HRP funding information we obtained through the DCI with CMS documentation on the federal grants and through interviews with the CMS official who manages these grants. We did not independently verify or evaluate information we received from CMS.
We conducted our work from July 2008 to June 2009 in accordance with all sections of GAO’s Quality Assurance Framework that are relevant to our objectives. The framework requires that we plan and perform the engagement to obtain sufficient and appropriate evidence to meet our stated objectives and to discuss any limitations in our work. We believe that the information and data obtained, and the analysis conducted, provide a reasonable basis for any findings and conclusions in this product.
Results in Brief
HRP Enrollment and Demographics of Those Enrolled
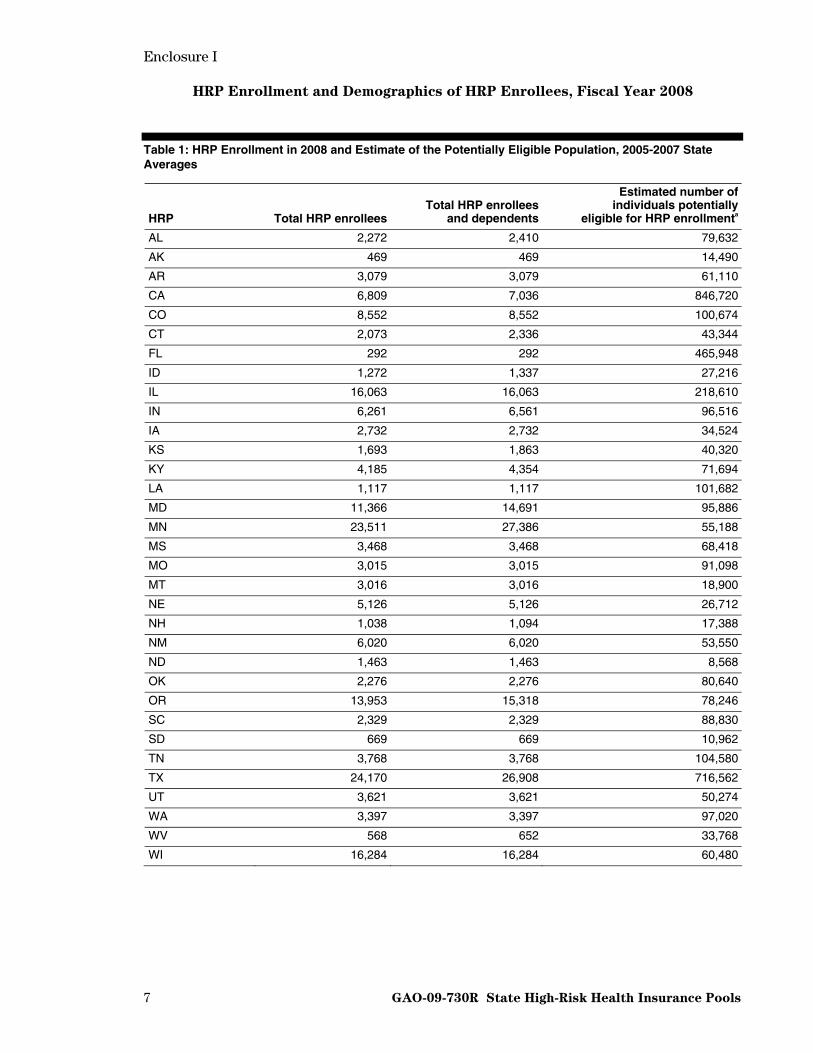
• HRP enrollment—enrollees and their dependents—totaled 199,418 in the 34 HRPs in 2008. We estimated nearly 4 million additional individuals to be potentially eligible for enrollment in an HRP based on their uninsured status and preexisting health conditions.12
• All HRPs accepted new applicants in 2008 except for California, which had a waiting list of about 1,030, and Florida, which has been closed to new enrollment since 1991.
• The average age of HRP enrollees in 2008 was 49 years and their average length of enrollment was 3 years. Among the 6 HRPs that collected employment or income data,13 about half of the enrollees were employed, and the average household income was about $41,000.
Enclosure I provides additional information on HRP enrollment and enrollee demographics.
HRP Cost-sharing Provisions, Coverage Restrictions, and Premiums
• In 2008, the average annual deductible for the most popular plan offered by each of the 34 HRPs was $1,593—almost three times as high as the average annual deductible of $560 among employer-sponsored health insurance plans. About 63 percent of enrollees in these most popular HRP plans had deductibles of $1,000 or greater. In comparison, almost 88 percent of enrollees in employer-sponsored plans had a deductible of under $1,000 or no deductible.
12GAO estimated the potentially eligible population, including dependents, by (1) determining the percentage of uninsured individuals with at least one chronic condition using 2006 MEPS data, and (2) applying that percentage to CPS estimates of the 3-year average uninsured population in each of the 34 states with an HRP (2005-2007). The CPS estimates are subject to sampling error of plus or minus 1.3 percent at the 90 percent confidence level. 13Employment information was provided by Colorado, Maryland, Oregon, Utah, and Wisconsin. Income information was provided by Indiana, Maryland, Oregon, Utah, and Wisconsin for new enrollees only.
GAO-09-730R State High-Risk Health Insurance Pools 4

• About 18 percent of enrollees in the 34 most popular HRP plans in 2008 were in plans that did not cover maternity care and about 3 percent were in plans that did not cover mental health services. Almost all enrollees in the most popular plans had access to prescription drug and transplant coverage.
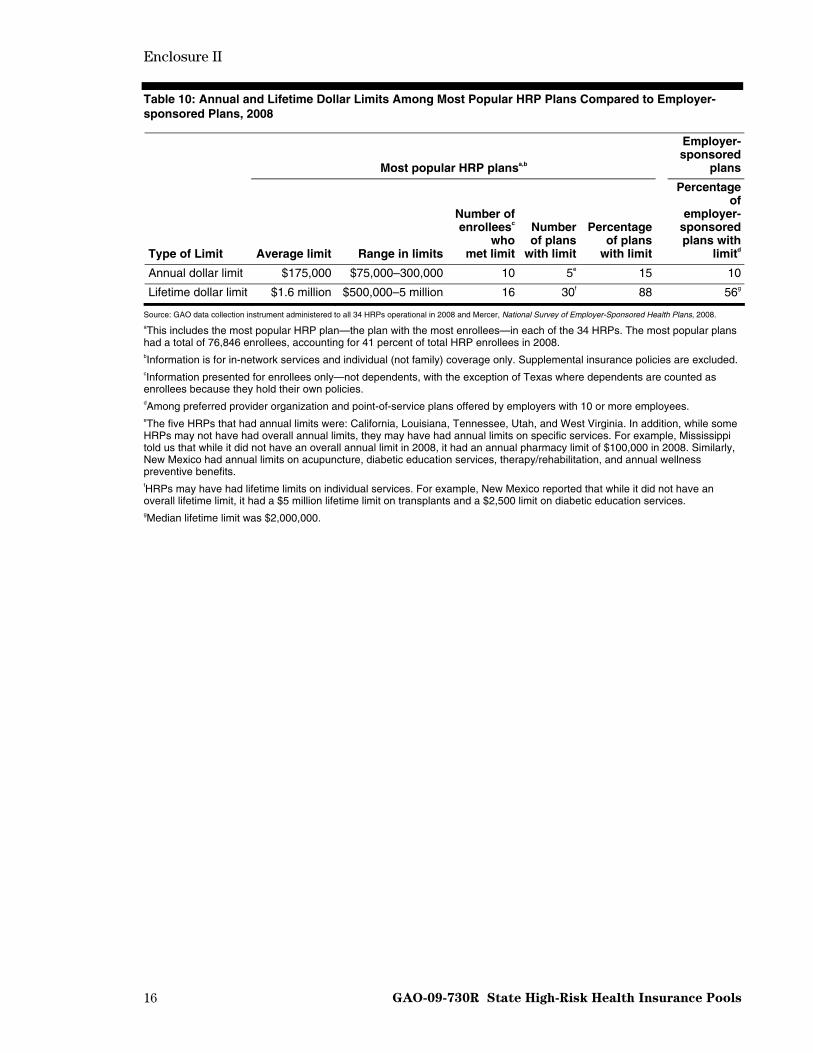
• Fifteen percent of the most popular plans (5 plans) in 2008 had annual maximum coverage limits. These annual limits ranged between $75,000 and $300,000 and averaged $175,000. By comparison, 10 percent of employer-sponsored plans had annual limits. Almost 90 percent of the most popular plans (30 plans) had lifetime dollar limits, which ranged between $500,000 and $5,000,000 and averaged $1.6 million. By comparison, 56 percent of employer-sponsored plans had lifetime limits.
• Between 2004 and 2008, average monthly HRP premiums rose by 14 percent across all plans, from $424 to $485. During the period 2004 through 2006, HRP average monthly premiums increased by 6 percent while average premiums in the employer-sponsored health insurance and the individual health insurance markets both increased by 15 percent. During the period 2007 through 2008, HRP average monthly premiums increased by 6 percent and employer-sponsored market premiums increased by 5 percent. No comparable individual market premium data were available for these 2 years.
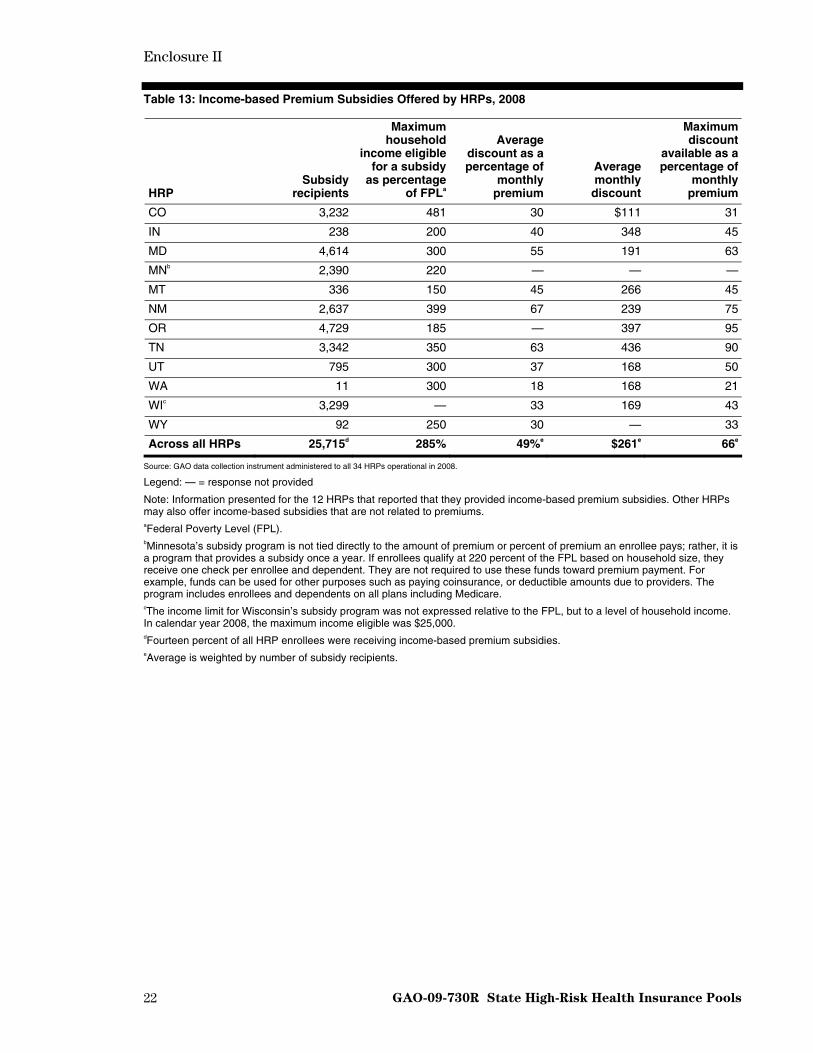
• Fourteen percent of all HRP enrollees received income-based premium subsidies, which were offered by 12 HRPs in 2008. The average monthly subsidy received was $261, or about 49 percent of the subsidy recipients’ average monthly premium of about $538.
Enclosure II provides additional information on HRP cost-sharing provisions, coverage restrictions, and premiums.
HRP Governance, Expenditures, and Funding
• Collectively, in 2008, HRP governing boards included representatives from health insurance carriers (41 percent of board members), state government (13 percent), medical providers (9 percent), enrollees (7 percent), and employers (3 percent), among others.14
• Total claims paid by HRPs in 2008 were about $1.9 billion, accounting for almost 95 percent of total HRP expenditures. The average claims per enrolled individual totaled $9,437 in 2008, an increase of about 39 percent since 2003.
• In 2008, premium revenue contributed 54 percent of HRP funding, and insurance carrier assessments contributed about 23 percent.
• HRPs were awarded a total of approximately $286 million in federal grants between 2003 and 2008, according to CMS. Almost 83 percent of these funds were operational grants, almost 15 percent were bonus grants, and less than 3 percent were seed grants. Federal grants comprised less than 2 percent of total HRP funding in 2008.
14Percentages provided are out of total voting board members. HRP governing boards may also include nonvoting members.
GAO-09-730R State High-Risk Health Insurance Pools 5

• Of the $75 million in federal grants that HRPs were awarded in 2006, about 55 percent were used to cover operational losses, about 17 percent to reduce premiums, and about 14 percent to support income-based premium subsidy programs, according to reports submitted to CMS. HRPs used the rest of the funds for various purposes, such as disease management programs and reduction in cost sharing, increasing benefit coverage, and marketing and outreach.15
Enclosure III contains more information on HRP governance, expenditures, and funding.
Agency Comments
We provided a draft of this report to HHS and NASCHIP for comment. In response, HHS provided written comments, stating that our report contains a wealth of valuable information on HRPs. We have reproduced these comments in enclosure IV. HHS and NASCHIP also provided technical comments, which we incorporated as appropriate.
– – – – –
As agreed with your offices, unless you publicly announce its contents earlier, we plan no further distribution of this report until 30 days from its issue date. At that time, we will send copies of this report to the Secretary of HHS, relevant congressional committees, and other interested members. The report will also be available at no charge on GAO’s Web site at
John E. Dicken
http://www.gao.gov.
Director, Health Care Issues
Enclosures – 5
15Such funds were next awarded in 2008. Annual reports on how HRPs used these 2008 grants were not available at the time of this report, so they were not included in our analysis.
GAO-09-730R State High-Risk Health Insurance Pools 6
Enclosure I
7 GAO-09-730R State High-Risk Health Insurance Pools
HRP Enrollment and Demographics of HRP Enrollees, Fiscal Year 2008
Table 1: HRP Enrollment in 2008 and Estimate of the Potentially Eligible Population, 2005-2007 State Averages
HRP Total HRP enrolleesTotal HRP enrollees
and dependents
Estimated number of individuals potentially
eligible for HRP enrollmenta
AL 2,272 2,410 79,632
AK 469 469 14,490
AR 3,079 3,079 61,110
CA 6,809 7,036 846,720
CO 8,552 8,552 100,674
CT 2,073 2,336 43,344
FL 292 292 465,948
ID 1,272 1,337 27,216
IL 16,063 16,063 218,610
IN 6,261 6,561 96,516
IA 2,732 2,732 34,524
KS 1,693 1,863 40,320
KY 4,185 4,354 71,694
LA 1,117 1,117 101,682
MD 11,366 14,691 95,886
MN 23,511 27,386 55,188
MS 3,468 3,468 68,418
MO 3,015 3,015 91,098
MT 3,016 3,016 18,900
NE 5,126 5,126 26,712
NH 1,038 1,094 17,388
NM 6,020 6,020 53,550
ND 1,463 1,463 8,568
OK 2,276 2,276 80,640
OR 13,953 15,318 78,246
SC 2,329 2,329 88,830
SD 669 669 10,962
TN 3,768 3,768 104,580
TX 24,170 26,908 716,562
UT 3,621 3,621 50,274
WA 3,397 3,397 97,020
WV 568 652 33,768
WI 16,284 16,284 60,480

Enclosure I
GAO-09-730R State High-Risk Health Insurance Pools 8
HRP Total HRP enrolleesTotal HRP enrollees
and dependents
Estimated number of individuals potentially
eligible for HRP enrollmenta
WY 716 716 9,198
Across all HRPs 186,643 199,418 3,968,748
Source: GAO data collection instrument administered to all 34 HRPs operational in 2008 and analysis of data from the 2006 Medical Expenditure Panel Survey (MEPS) and U.S Census Bureau, Income, Poverty, and Health Insurance Coverage in the United States: 2007. aGAO estimated the potentially eligible population, including dependents, by (1) determining the percentage of uninsured individuals with at least one chronic condition using 2006 MEPS data, and (2) applying that percentage to Current Population Estimates (CPS) estimates of the 3-year average uninsured population in each of the 34 states with an HRP (2005-2007). The CPS estimates are subject to sampling error of plus or minus 1.3 percent at the 90 percent confidence level. The MEPS and CPS data used were the most current available at the time we performed our work.
Table 2: HRPs with Waiting Lists or Closed to Enrollment, 2004-2008
Year HRPs with a waiting list (maximum number of individuals on the list) HRPs closed to enrollment
2004 Illinois (279) Florida
2005 Illinois (173) Florida
2006 California (864) Florida
2007 California (232) Florida
2008 California (1,030) Florida
Source: GAO data collection instrument administered to all 34 HRPs operational in 2008.

Enclosure I
9 GAO-09-730R State High-Risk Health Insurance Pools
Table 3: Demographics of HRP Enrollees, by State HRP, 2008
Employment statusa,b
Percentage of enrollees who are:
HRP
Average age
(years) Employed Unemployed Retired
Average household income of
new enrolleesc
Percent male
Average length of
enrollment (in months)
Percent who are HIPAA-
eligibled
Percent who are
HCTC-eligiblee
AL 51 — — — — 45.6 9 100.0f 0.0
AK 50 — — — — 48.6 50 32.4 0.0
AR — — — — — 47.7 42 45.1 0.6
CA — — — — — 43.7 36 — —
CO 45 29.8 63.4 2.1 — 46.9 26 9.4 0.1
CT 47 — — — — 48.4 53 49.4 0.8
FL 50 — — — — 50.3 N/Ag 0.0 0.0
ID 47 — — — — 45.0 31 — —
IL 50 — — — — 44.6 47 64.3 1.4
IN 48 — — — $27,500 54.9 31 37.8 0.1
IA 49 — — — — 50.3 22 43.0 0.0
KS 51 — — — — 44.2 42 17.9 0.2
KY 48 — — — — 51.1 29 40.3 0.0
LA 50 — — — — 52.8 41 60.6 0.2
MD 49 57.8 29.1 12.1 $35,000 45.6 16 30.2 1.5
MN — — — — — — — 5.2 0.1
MS 51 — — — — 45.0 43 36.6 —
MO 48 — — — — 50.8 25 40.1 —
MT 50 — — — — 45.0 42 46.3 0.1
NE 47 — — — — 52.6 59 45.2 0.0
NH 47 — — — — 47.3 19 25.4 1.4
NM 48 — — — — 45.9 24 17.7 0.0
ND — — — — — — — 2.6 0.2
OK — — — — — — — 43.6 0.0
OR 46 42.5 29.5 13.0 $29,366 41.2 31 13.7 0.2
SC 50 — — — — 48.0 36 66.7 1.2
SD 47 — — — — 49.6 31 100.0f 0.0
TN 51 — — — — 40.3 6 12.1 —
TX 51 — — — — 46.6 42 43.1 0.1
UT 46 47.9 5.4 3.0 $70,573 40.5 60 35.0 0.0
WA 49 — — — — 57.1 45 0.0 0.0
WV 49 — — — — 42.1 13 — —
WI 51 51.1 37.0 — $54,200h 54.5 40 — —
WY 51 — — — — 48.0 — 0.8 —
Across all HRPs 49i 47 32 9 $41,136i 47 36i 28 0.3
Source: GAO data collection instrument administered to all 34 HRPs operational in 2008.
Legend: — = response not provided
N/A: Not applicable

Enclosure I
GAO-09-730R State High-Risk Health Insurance Pools 10
Note: Information presented for enrollees only—not dependents, with the exception of Texas where dependents are counted as enrollees because they hold their own policies. aEmployment status was provided by five states—Colorado and Wisconsin collected these data from new enrollees only, and Maryland, Oregon, and Utah collected it from all enrollees. bPercentages may not add to 100 because some enrollees may fall into other or unknown employment status categories. cAverage income was provided by the five HRPs that collected income data for new enrollees in 2008. dHIPAA-eligible refers to those individuals who qualify for HRP enrollment because of the Health Insurance Portability and Accountability Act of 1996, which allows for portability of health coverage for those with prior group coverage. eHCTC-eligible refers to those individuals who qualify for HRP enrollment because of the Health Coverage Tax Credit, which provides tax credits for health insurance premiums for certain eligible displaced workers and retirees. fPool is open to HIPAA-eligibles only. gThe Florida HRP has been closed to new enrollment since 1991 and, in 2008, had 292 enrollees. hIncome data were provided on a voluntary basis by 77 percent of new enrollees in Wisconsin. iAverages are weighted based on HRP enrollment.

Enclosure II
11 GAO-09-730R State High-Risk Health Insurance Pools
HRP Plan Cost-sharing Provisions, Benefits, Coverage Restrictions, and Premiums
Table 4: Average Annual Deductible of Most Popular HRP Plans Compared to Employer-sponsored Plans, 2008
Most popular HRP plansa Employer-sponsored plansb
Average annual deductible $1,593c $560
Source: GAO data collection instrument administered to all 34 HRPs operational in 2008 and Kaiser Family Foundation and Health Research & Educational Trust, Employer Health Benefits: 2008 Annual Survey (Menlo Park, Calif., and Chicago, Ill.: 2008).
Note: Deductibles are for self-only coverage and in-network services. aThis includes the most popular HRP plan—the plan with the most enrollees—in each of the 34 HRPs. The most popular plans had a total of 76,846 enrollees, accounting for 41 percent of total HRP enrollees in 2008. bPreferred provider organization plan types. cAverage was weighted by the number of HRP enrollees in the 33 most popular plans that had deductibles greater than zero.
Table 5: Distribution of Enrollees by Annual Deductible Level in All HRP Plans and Most Popular HRP Plans, Compared to Employer-sponsored Plans, 2008
HRPs
All HRP plans Most popular HRP plansa Employer-sponsored plansb
Annual deductible Percentage of
total enrolleescPercentage of
total enrolleesc
Percentage of covered workers in employer-
sponsored plansd
No deductible 1.8 1.0 32.0
$1–$499 6.0 4.1 35.4
$500–$999 17.1 32.2 20.4
$1,000–$1,999 27.1 17.8 8.8
$2,000–$2,999 24.5 39.1
$3,000–$4,999 4.6 1.7
$5,000 or more 17.8 4.1 2.7e
Source: GAO data collection instrument administered to all 34 HRPs operational in 2008 and Kaiser Family Foundation and Health Research & Educational Trust, Employer Health Benefits: 2008 Annual Survey (Menlo Park, Calif., and Chicago, Ill.: 2008).
Note: Deductibles are for self-only coverage and in-network services. Information presented for enrollees only—not dependents, with the exception of Texas where dependents are counted as enrollees because they hold their own policies. aThis includes the most popular HRP plan—the plan with the most enrollees—in each of the 34 HRPs. The most popular plans had a total of 76,846 enrollees, accounting for 41 percent of total HRP enrollees in 2008. bPreferred provider organization plan types. cPercentages do not add to 100 because HRP enrollees in supplemental insurance plans were excluded. dPercentages do not add to 100 due to rounding. eData for employer-sponsored plans were only available for deductibles of $2,000 or more.
Enclosure II
GAO-09-730R State High-Risk Health Insurance Pools 12
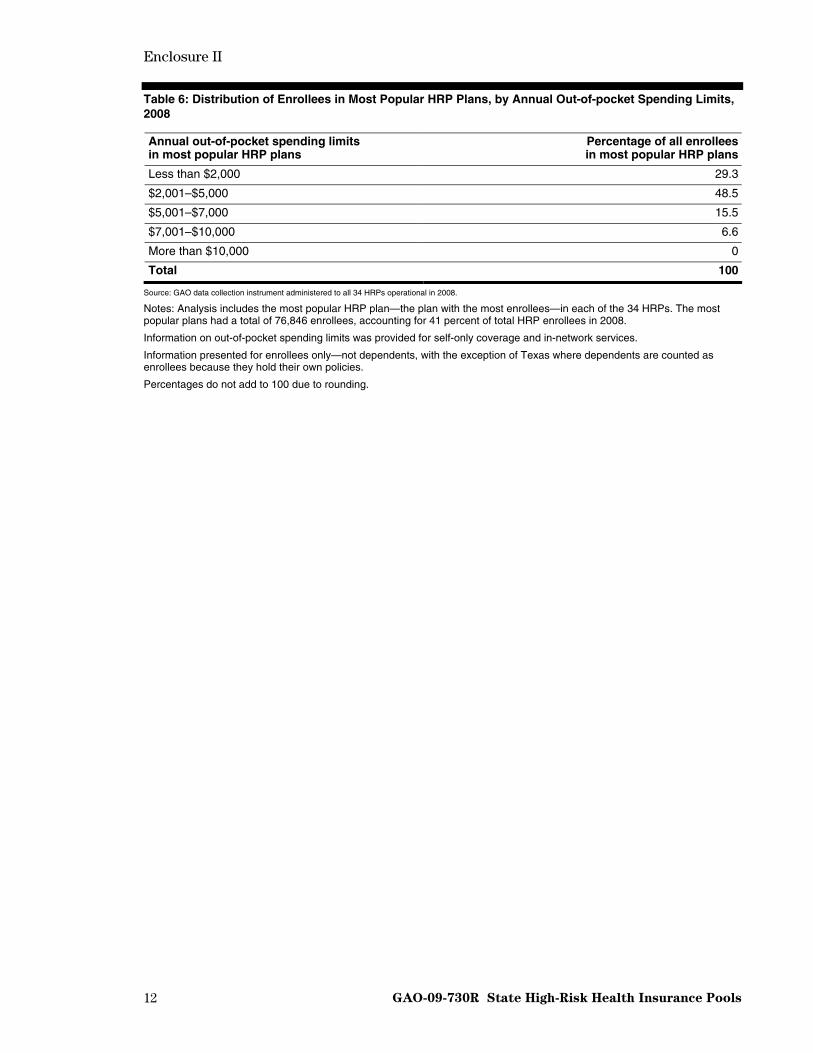
Table 6: Distribution of Enrollees in Most Popular HRP Plans, by Annual Out-of-pocket Spending Limits, 2008
Annual out-of-pocket spending limits in most popular HRP plans
Percentage of all enrollees in most popular HRP plans
Less than $2,000 29.3
$2,001–$5,000 48.5
$5,001–$7,000 15.5
$7,001–$10,000 6.6
More than $10,000 0
Total 100
Source: GAO data collection instrument administered to all 34 HRPs operational in 2008.
Notes: Analysis includes the most popular HRP plan—the plan with the most enrollees—in each of the 34 HRPs. The most popular plans had a total of 76,846 enrollees, accounting for 41 percent of total HRP enrollees in 2008.
Information on out-of-pocket spending limits was provided for self-only coverage and in-network services.
Information presented for enrollees only—not dependents, with the exception of Texas where dependents are counted as enrollees because they hold their own policies.
Percentages do not add to 100 due to rounding.

Enclosure II
13 GAO-09-730R State High-Risk Health Insurance Pools
Table 7: Annual Out-of-pocket Spending Limit in Each State HRP’s Most Popular Plan, and Costs that Could Exceed the Limit, 2008
Cost-sharing features
HRP
Annual out-of-pocket
spending limit
Overall annual
deductible
Separate hospital
deductible
Separate prescription
drug deductible
Separate mental health
deductible Coinsurance
Copay for prescription
drugs
Copay for
mental health
Copay for physician
office visits
AL N/A
AK $10,000
AR $2,000 ●
CA $2,500 CO $2,000 ● ● ●
CT $7,500 ● ● ● ● ● ●
FL —
ID $10,000 ● ●
IL $1,500 ●
IN $1,500 ● ●
IA $5,000 ● ●
KS $3,000
KY $4,000 ● ● ● ●
LA $9,500
MD $3,000 ● ● MN $3,000
MSa N/A ● ● ●
MO $5,000
MT $7,500
NE $3,500 ● ● ●
NH $3,500 ● ●
NM $2,500 ● ND $3,000 OK $10,000 ● ● OR $1,500 ● SC $5,000
SD $3,250 ●
TN $5,000 ●
TX $5,500 ● ● ●
UT $2,000 ● ● WA $1,500 ● ● ● ● ●
WV $3,000 ● ● ● ● ● ● ●
WI $3,500 ●
WY $2,000 ● ●
Source: GAO data collection instrument administered to all 34 HRPs operational in 2008
Legend: ● = Cost is not subject to the annual out-of-pocket maximum
= Cost is subject to the annual out-of-pocket maximum

Enclosure II
14 GAO-09-730R State High-Risk Health Insurance Pools
N/A = Not applicable because the most popular plan did not have an annual out-of-pocket maximum
— = Response not provided
Notes: Blank cells indicate that the cost was not a feature of the plan’s cost-sharing structure.
Analysis includes the most popular HRP plan—the plan with the most enrollees—in each of the 34 HRPs. The most popular plans had a total of 76,846 enrollees, accounting for 41 percent of total HRP enrollees in 2008.
Information on out-of-pocket spending limits was provided for self-only coverage and in-network services. aMississippi does not have an overall policy regarding the out-of-pocket maximum, but it has a $5,000 out-of-pocket maximum on allowable hospital charges, after which the policy pays allowable hospital charges at 100 percent.
Table 8: Coverage of Selected Benefits Among Most Popular HRP Plans Compared to Employer-sponsored Plans, 2008
Most popular HRP plansa,b Employer-
sponsored plans
Benefit Number of plans
that cover benefit
Percentage of enrolleesc in plans that cover benefit
Percentage of workers in plans
that cover benefit
Maternity care 30 82 NA
• Maternity care covered as a riderd 4 10 NA
Transplants 33 100e NA
Mental health services 31 97 98
Prescription drugs 34 100 98
Source: GAO survey of 34 HRPs operational in 2008 and Kaiser Family Foundation and Health Research & Educational Trust, Employer Health Benefits: 2008 Annual Survey (Menlo Park, Calif., and Chicago, Ill.: 2008).
Legend: NA = Not available aThis includes the most popular HRP plan—the plan with the most enrollees—in each of the 34 HRPs. The most popular plans had a total of 76,846 enrollees, accounting for 41 percent of total HRP enrollees in 2008. bInformation is for in-network services and individual (not family) coverage only. Supplemental insurance policies are excluded. cInformation presented for enrollees only—not dependents, with the exception of Texas where dependents are counted as enrollees because they hold their own policies. dPrivate individual health insurance plans may offer optional coverage of additional services, such as maternity care. This extra coverage is referred to as an optional rider. eThe percentage of enrollees with coverage of transplants was 99.7, which rounds to 100.

Enclosure II
GAO-09-730R State High-Risk Health Insurance Pools 15
Table 9: Selected Cost-sharing Features and Coverage Limits Among Most Popular HRP Plans Compared to Employer-sponsored Plans, 2008
Most popular HRP plansa,b
Employer-sponsored plans
Cost-sharing features and limits on coverage Number of plans
Percentage of enrollees in plans
with feature and/or limitc
Percentage of covered workers
in plans with feature and/or limitd
Separate cost sharing for inpatient hospital care, in addition to the overall plan deductible 21 56 79
Preventive services exempt from plan deductible 15 57 89
Separate prescription drug deductible for plans that cover prescription drugs 13 41 11
Required coinsurance for prescription drugs for plans that cover prescription drugs 26 76 NA
Out-of-pocket annual maximums that apply to cost sharing for prescription drugs for plans that cover prescription drugs 9 18 11
Thirty or less mental health outpatient visits covered in a year by plans that cover mental health benefits 13e 19 59f
Additional cost sharing for emergency room care 12 49 NA
Source: GAO data collection instrument administered to all 34 HRPs operational in 2008 and Kaiser Family Foundation and Health Research & Educational Trust, Employer Health Benefits: 2008 Annual Survey (Menlo Park, Calif., and Chicago, Ill.: 2008).
Legend: NA = Not available aThis includes the most popular HRP plan—the plan with the most enrollees—in each of the 34 HRPs. The most popular plans had a total of 76,846 enrollees, accounting for 41 percent of total HRP enrollees in 2008. bInformation is for in-network services and individual (not family) coverage only. Supplemental insurance policies are excluded. cInformation presented for HRP enrollees only—not dependents, with the exception of Texas where dependents are counted as enrollees because they hold their own policies. dPreferred provider organization plan types. eSuch limits may apply to some mental health services only. For example, the New Mexico HRP reported that its mental health limits apply only to chemical dependency services. fInformation for mental health outpatient visits is for covered workers with outpatient mental health coverage and not specified for in- or out-of-network coverage.
Enclosure II
GAO-09-730R State High-Risk Health Insurance Pools 16
Table 10: Annual and Lifetime Dollar Limits Among Most Popular HRP Plans Compared to Employer-sponsored Plans, 2008
Most popular HRP plansa,b
Employer-sponsored
plans
Type of Limit Average limit Range in limits
Number of enrolleesc
who met limit
Number of plans
with limit
Percentage of plans
with limit
Percentage of
employer-sponsored plans with
limitd
Annual dollar limit $175,000 $75,000–300,000 10 5e 15 10
Lifetime dollar limit $1.6 million $500,000–5 million 16 30f 88 56g
Source: GAO data collection instrument administered to all 34 HRPs operational in 2008 and Mercer, National Survey of Employer-Sponsored Health Plans, 2008. aThis includes the most popular HRP plan—the plan with the most enrollees—in each of the 34 HRPs. The most popular plans had a total of 76,846 enrollees, accounting for 41 percent of total HRP enrollees in 2008. bInformation is for in-network services and individual (not family) coverage only. Supplemental insurance policies are excluded. cInformation presented for enrollees only—not dependents, with the exception of Texas where dependents are counted as enrollees because they hold their own policies. dAmong preferred provider organization and point-of-service plans offered by employers with 10 or more employees. eThe five HRPs that had annual limits were: California, Louisiana, Tennessee, Utah, and West Virginia. In addition, while some HRPs may not have had overall annual limits, they may have had annual limits on specific services. For example, Mississippi told us that while it did not have an overall annual limit in 2008, it had an annual pharmacy limit of $100,000 in 2008. Similarly, New Mexico had annual limits on acupuncture, diabetic education services, therapy/rehabilitation, and annual wellness preventive benefits. fHRPs may have had lifetime limits on individual services. For example, New Mexico reported that while it did not have an overall lifetime limit, it had a $5 million lifetime limit on transplants and a $2,500 limit on diabetic education services. gMedian lifetime limit was $2,000,000.

Enclosure II
17 GAO-09-730R State High-Risk Health Insurance Pools
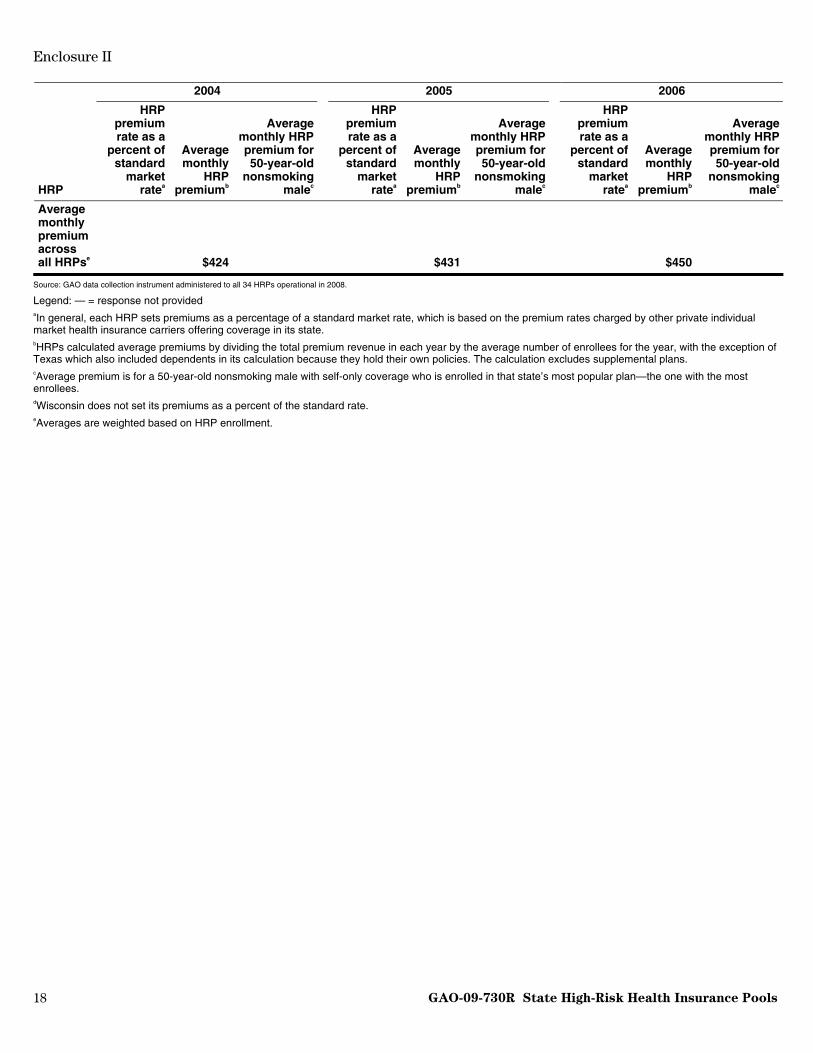
Table 11a: HRP Average Monthly Premiums, by State HRP, 2004-2006
2004 2005 2006
HRP
HRP premium rate as a
percent of standard
market ratea
Average monthly
HRP premiumb
Average monthly HRP premium for 50-year-old
nonsmoking malec
HRP premium rate as a
percent of standard
market ratea
Average monthly
HRP premiumb
Average monthly HRP premium for 50-year-old
nonsmoking malec
HRP premium rate as a
percent of standard
market ratea
Average monthly
HRP premiumb
Average monthly HRP premium for 50-year-old
nonsmoking malec
AL 98 $448 $358 104 $486 $412 127 $539 $478
AK 137 462 580 142 494 580 145 511 614
AR 140 463 622 140 395 389 150 419 416
CA 125 519 666 125 444 683 125 435 736
CO 144 379 689 144 376 571 134 405 622
CT 150 651 658 150 712 567 150 623 651
FL 200 — — 200 — — 200 — —
ID 125 303 250 125 330 260 131 349 252
IL 138 496 610 138 517 623 137 523 660
IN 138 496 515 134 528 546 133 575 590
IA 150 681 860 150 457 329 150 471 360
KS 130 475 621 134 483 640 134 494 656
KY 130 400 324 130 424 357 130 480 369
LA 184 609 483 183 535 529 183 575 482
MD 147 272 267 131 306 273 121 283 273
MN 112 308 382 120 342 359 123 380 315
MS 150 356 316 150 375 322 150 400 366
MO 175 382 338 168 251 355 168 417 396
MT 117 349 311 134 395 358 138 426 383
NE 135 488 401 135 510 435 135 510 434
NH 140 459 458 136 477 505 125 424 498
NM — 420 625 — 374 407 147 250 407
ND 135 304 378 135 336 402 135 363 420
OK 150 497 674 150 418 674 150 545 848
OR 102 391 482 111 344 434 110 376 506
SC 200 734 — 200 835 665 200 878 737
SD 150 139 377 150 380 429 150 404 471
TN — — — — — — — — —
TX 200 479 397 200 489 420 200 510 456
UT 125 355 369 141 404 434 142 443 497
WA 120 416 582 120 524 777 113 514 791
WV — — — 148 830 474 140 595 512
WId 140 — 360 140 442 417 144 474 437
WY 150 669 711 174 675 782 179 801 899
Enclosure II
GAO-09-730R State High-Risk Health Insurance Pools 18
2004 2005 2006
HRP
HRP premium rate as a
percent of standard
market ratea
Average monthly
HRP premiumb
Average monthly HRP premium for 50-year-old
nonsmoking malec
HRP premium rate as a
percent of standard
market ratea
Average monthly
HRP premiumb
Average monthly HRP premium for 50-year-old
nonsmoking malec
HRP premium rate as a
percent of standard
market ratea
Average monthly
HRP premiumb
Average monthly HRP premium for 50-year-old
nonsmoking malec
Average monthly premium across all HRPse $424 $431 $450
Source: GAO data collection instrument administered to all 34 HRPs operational in 2008.
Legend: — = response not provided aIn general, each HRP sets premiums as a percentage of a standard market rate, which is based on the premium rates charged by other private individual market health insurance carriers offering coverage in its state. bHRPs calculated average premiums by dividing the total premium revenue in each year by the average number of enrollees for the year, with the exception of Texas which also included dependents in its calculation because they hold their own policies. The calculation excludes supplemental plans. cAverage premium is for a 50-year-old nonsmoking male with self-only coverage who is enrolled in that state’s most popular plan—the one with the most enrollees. dWisconsin does not set its premiums as a percent of the standard rate. eAverages are weighted based on HRP enrollment.
Enclosure II
19 GAO-09-730R State High-Risk Health Insurance Pools
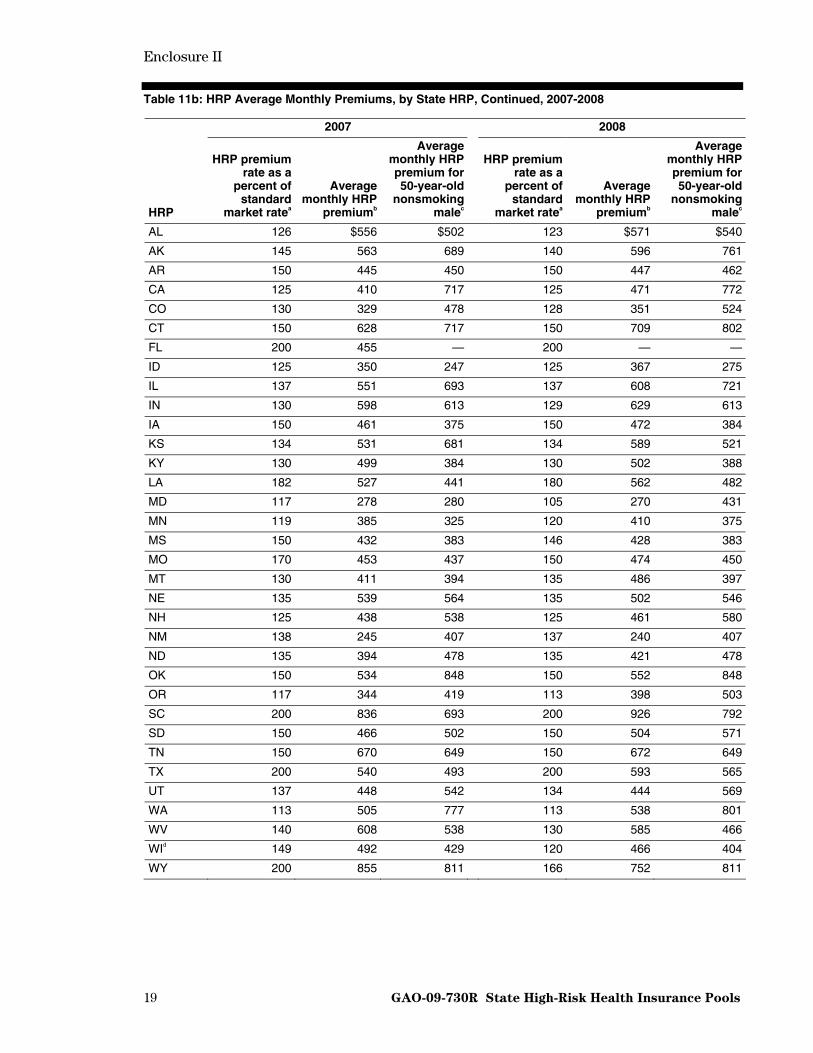
Table 11b: HRP Average Monthly Premiums, by State HRP, Continued, 2007-2008
2007 2008
HRP
HRP premium rate as a
percent of standard
market ratea
Average monthly HRP
premiumb
Average monthly HRP premium for 50-year-old
nonsmoking malec
HRP premium rate as a
percent of standard
market ratea
Average monthly HRP
premiumb
Average monthly HRP premium for 50-year-old
nonsmoking malec
AL 126 $556 $502 123 $571 $540
AK 145 563 689 140 596 761
AR 150 445 450 150 447 462
CA 125 410 717 125 471 772
CO 130 329 478 128 351 524
CT 150 628 717 150 709 802
FL 200 455 — 200 — —
ID 125 350 247 125 367 275
IL 137 551 693 137 608 721
IN 130 598 613 129 629 613
IA 150 461 375 150 472 384
KS 134 531 681 134 589 521
KY 130 499 384 130 502 388
LA 182 527 441 180 562 482
MD 117 278 280 105 270 431
MN 119 385 325 120 410 375
MS 150 432 383 146 428 383
MO 170 453 437 150 474 450
MT 130 411 394 135 486 397
NE 135 539 564 135 502 546
NH 125 438 538 125 461 580
NM 138 245 407 137 240 407
ND 135 394 478 135 421 478
OK 150 534 848 150 552 848
OR 117 344 419 113 398 503
SC 200 836 693 200 926 792
SD 150 466 502 150 504 571
TN 150 670 649 150 672 649
TX 200 540 493 200 593 565
UT 137 448 542 134 444 569
WA 113 505 777 113 538 801
WV 140 608 538 130 585 466
WId 149 492 429 120 466 404
WY 200 855 811 166 752 811

Enclosure II
GAO-09-730R State High-Risk Health Insurance Pools 20
2007 2008
HRP
HRP premium rate as a
percent of standard
market ratea
Average monthly HRP
premiumb
Average monthly HRP premium for 50-year-old
nonsmoking malec
HRP premium rate as a
percent of standard
market ratea
Average monthly HRP
premiumb
Average monthly HRP premium for 50-year-old
nonsmoking malec
Average monthly
premium across all
HRPse $460 $485
Source: GAO data collection instrument administered to all 34 HRPs operational in 2008.
Legend: — = response not provided aIn general, each HRP sets premiums as a percentage of a standard market rate, which is based on the premium rates charged by other private individual health insurance carriers offering coverage in its state. bHRPs calculated average premiums by dividing the total premium revenue in each year by the average number of enrollees for the year, with the exception of Texas which also included dependents in its calculation because they hold their own policies. The calculation excludes supplemental plans. cAverage premium is for a 50-year-old nonsmoking male with self-only coverage who is enrolled in that state’s most popular plan—the one with the most enrollees. dWisconsin does not set its premiums as a percent of the standard market rate. eAverages are weighted based on HRP enrollment.

Enclosure II
GAO-09-730R State High-Risk Health Insurance Pools 21
Table 12: Change in Average Monthly Premiums for all HRPs Compared to Private Health Insurance Market Premiums, 2004 to 2008
2004 through 2006 2007 through 2008 2004 through 2008
2004 2006
Percentage change 2007 2008
Percentage change
Percentage change
Employer-sponsored market
$308 $354 15 $373 $392 5 27
Individual marketa $189 $218b 15 NA NA NA NA
HRPc,d $424 $450 6 $460 $485 6 14
Sources: GAO data collection instrument administered to all 34 HRPs operational in 2008; America’s Health Insurance Plans (AHIP) Center for Policy and Research, Individual Health Insurance: A Comprehensive Survey of Affordability, Access, and Benefits, August 2005, (Washington, D.C.: 2005), and Individual Health Insurance 2006-2007: A Comprehensive Survey of Premiums, Availability, and Benefits (Washington, D.C.: 2007); Kaiser Family Foundation and Health Research & Educational Trust, Employer Health Benefits: 2004, 2006, 2007, and 2008 Annual Surveys (Menlo Park, Calif., and Chicago, Ill.: 2004, 2006, 2007, and 2008 respectively).
Legend: NA = Not available aAccording to model legislation prescribed by the National Association of Insurance Commissioners, an HRP should consider basing premiums on the standard market rates charged in the individual market in its state. bAHIP individual market premium data are mostly as of December 2006 and January 2007. cHRPs calculated average premiums by dividing the total premium revenue in each year by the average number of enrollees for the year, with the exception of Texas which also included dependents in its calculation because they hold their own policies. The calculation excludes supplemental plans. In addition, monthly averages were weighted by the number of enrollees across all plans that responded. dTable shows rounded numbers for average monthly HRP premiums. However, percentage change numbers were calculated using non-rounded numbers.
Enclosure II
GAO-09-730R State High-Risk Health Insurance Pools 22
Table 13: Income-based Premium Subsidies Offered by HRPs, 2008
HRP Subsidy
recipients
Maximum household
income eligible for a subsidy
as percentage of FPLa
Average discount as a percentage of
monthly premium
Average monthly
discount
Maximum discount
available as a percentage of
monthly premium
CO 3,232 481 30 $111 31
IN 238 200 40 348 45
MD 4,614 300 55 191 63
MNb 2,390 220 — — —
MT 336 150 45 266 45
NM 2,637 399 67 239 75
OR 4,729 185 — 397 95
TN 3,342 350 63 436 90
UT 795 300 37 168 50
WA 11 300 18 168 21
WIc 3,299 — 33 169 43
WY 92 250 30 — 33
Across all HRPs 25,715d 285% 49%e $261e 66e
Source: GAO data collection instrument administered to all 34 HRPs operational in 2008.
Legend: — = response not provided
Note: Information presented for the 12 HRPs that reported that they provided income-based premium subsidies. Other HRPs may also offer income-based subsidies that are not related to premiums. aFederal Poverty Level (FPL). bMinnesota’s subsidy program is not tied directly to the amount of premium or percent of premium an enrollee pays; rather, it is a program that provides a subsidy once a year. If enrollees qualify at 220 percent of the FPL based on household size, they receive one check per enrollee and dependent. They are not required to use these funds toward premium payment. For example, funds can be used for other purposes such as paying coinsurance, or deductible amounts due to providers. The program includes enrollees and dependents on all plans including Medicare. cThe income limit for Wisconsin’s subsidy program was not expressed relative to the FPL, but to a level of household income. In calendar year 2008, the maximum income eligible was $25,000. dFourteen percent of all HRP enrollees were receiving income-based premium subsidies. eAverage is weighted by number of subsidy recipients.
Enclosure II
GAO-09-730R State High-Risk Health Insurance Pools 23
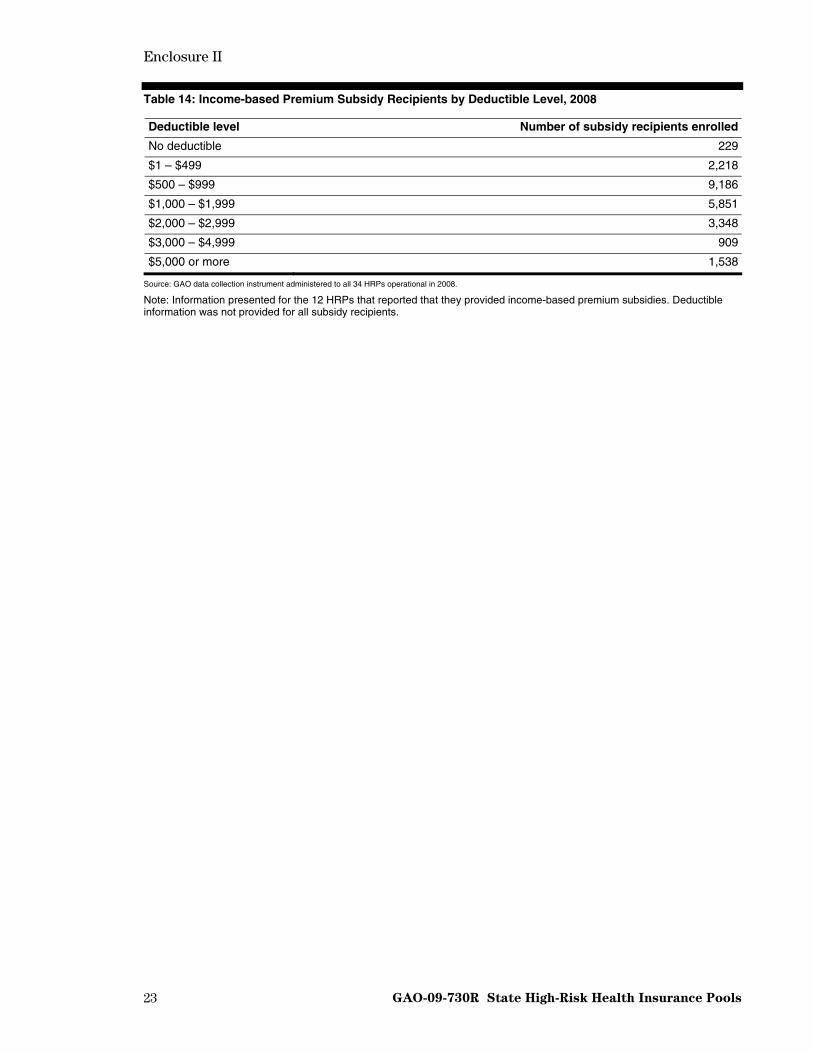
Table 14: Income-based Premium Subsidy Recipients by Deductible Level, 2008
Deductible level Number of subsidy recipients enrolled
No deductible 229
$1 – $499 2,218
$500 – $999 9,186
$1,000 – $1,999 5,851
$2,000 – $2,999 3,348
$3,000 – $4,999 909
$5,000 or more 1,538
Source: GAO data collection instrument administered to all 34 HRPs operational in 2008.
Note: Information presented for the 12 HRPs that reported that they provided income-based premium subsidies. Deductible information was not provided for all subsidy recipients.

Enclosure III
24 GAO-09-730R State High-Risk Health Insurance Pools
HRP Governance, Expenditures, and Funding
Table 15: Composition of HRP Boards of Directors Across All 34 HRPs, 2008
Group Voting members as a
percentage of totalNonvoting members as a
percentage of total
Employers 3 5
Enrollees 7 0
Insurance carriers 41 2
Medical providers 9 15
State government 13 54
Othera 27 24
Source: GAO data collection instrument administered to all 34 HRPs operational in 2008. aOther members of HRP boards of directors include members of insurance and medical representative associations, the general public, and disability agents, among others.

Enclosure III
25 GAO-09-730R State High-Risk Health Insurance Pools
Table 16: Composition of Boards of Directors by State HRP, 2008
Employers Enrollees Insurance carriers Medical providers State government Othera
HRP Voting Nonvoting Voting Nonvoting Voting Nonvoting Voting Nonvoting Voting Nonvoting Voting Nonvoting
AL 2 3 1
AK 5 2
AR 1 4 1 1
CA 5 3
CO 2 4 1 3
CT 9
FL 1 1 1
ID 4 3 4
IL 3 4 10
IN 2 4 1 2
IA 7 1 3 3
KS 1 6 1 3
KY 1 1
LA 1 1 1 2 3 5
MD 1 1 4 3
MN 1 2 6 2
MS 3 1 2 3
MO 3 2 1 4 3
MT 1 7
NE 1 4 2
NH 1 6 1 1 2
NM 4 1 1 5
ND 3 5
OK 1 5 1 2
OR 5 1 1 2 1
SC 5 3
SD 2 1 1 1 6 5 2 3
TN 2 2 2 5 2
TX 2 2 2 3
UT 1 1 2 1 2 5
WA 2 2 4 1 1 1
WV 2 1 3
WI 1 2 4 4 1 2
WY 3 1 3
Source: GAO data collection instrument administered to all 34 HRPs operational in 2008. aOther members of HRP boards of directors include members of insurance and medical representative associations, the general public, and disability agents, among others.

Enclosure III
26 GAO-09-730R State High-Risk Health Insurance Pools
Table 17: Expenditures by State HRP, 2003 and 2008 (dollars in thousands)
Paid claims
HRP Year Medical
Mental health
servicesaPrescription
drugs Total
claimsAdministrative
expensesb Other
expendituresTotal
expendituresc
AL 2003 $23,991 — — $23,991 $263 $19 $24,272
2008 21,225 — — 21,225 363 24 21,612
AK 2003 5,749 — $909 6,658 416 95 7,168
2008 4,558 $54 780 5,392 352 163 5,906
AR 2003 21,375 — — 21,375 2,149 27 23,551
2008 19,635 — — 19,635 2,386 — 22,021
CA 2003 97,565 — — 97,565 4,850 — 102,415
2008 39,201 — — 39,201 2,507 — 41,708
CO 2003 24,876 — 5,568 30,444 3,007 — 33,451
2008 51,401 — 11,227 62,628 5,302 — 67,930
CT 2003 22,391 — — 22,391 725 1,164 24,281
2008 28,108 — 7,543 35,651 521 1,098 37,270
FL 2003 4,371 — 0 4,371 552 — 4,923
2008 2,812 — 865 3,676 630 — 4,306
ID 2003 5,715 0 0 5,715 143 32 5,889
2008 12,578 0 0 12,578 1,360 141 14,079
IL 2003 81,814 — 25,245 107,059 6,131 — 113,191
2008 115,607 — 40,521 156,128 8,883 — 165,011
IN 2003 90,429 0 18,617 109,046 4,538 596 114,180
2008 57,100 0 39,810 96,910 3,991 587 101,488
IA 2003 — — — 1,795 365 — 2,160
2008 25,760 307 5,392 31,459 1,442 201 33,101
KS 2003 11,488 — 1,485 12,974 318 137 13,429
2008 19,334 — 2,930 22,264 322 852 23,438
KY 2003 10,697 91 3,802 14,591 1,281 41 15,914
2008 31,091 527 15,654 47,272 3,122 39 50,433
LA 2003 12,174 0 1,570 13,744 746 338 14,828
2008 7,785 0 1,791 9,576 1,137 381 11,094
MD 2003d 0 0 0 0 96 169 266
2008 75,829 1,817 28,866 106,511 6,568 800 113,880
MN 2003 — — — 175,049 9,079 0 184,128
2008 195,904 — 49,869 245,773 10,207 1,559 257,540
MS 2003 17,956 277 5,524 23,757 1,371 0 25,129
2008 16,260 132 6,625 23,018 1,597 0 24,615
MO 2003 11,666 — 5,062 16,728 2,114 0 18,842
2008 16,407 — 8,387 24,794 2,849 0 27,644
MT 2003 10,369 — 3,481 13,850 1,085 112 15,047
2008 20,968 — 4,539 25,507 1,165 209 26,882

Enclosure III
GAO-09-730R State High-Risk Health Insurance Pools 27
Paid claims
HRP Year Medical
Mental health
servicesaPrescription
drugs Total
claimsAdministrative
expensesb Other
expendituresTotal
expendituresc
NE 2003 32,214 0 12,657 44,871 2,891 93 47,856
2008 39,092 0 15,827 54,920 2,982 675 58,576
NH 2003 1,499 — 60 1,559 323 42 1,925
2008 10,997 83 1,103 12,183 702 142 13,027
NM 2003 7,136 — 2,924 10,060 425 225 10,710
2008 46,283 381 14,189 60,853 2,454 975 64,282
ND 2003 — — — 8,090 281 — 8,370
2008 — — — 10,343 379 — 10,722
OK 2003 16,368 0 6,993 23,361 1,227 0 24,587
2008 16,013 0 8,320 24,333 1,239 0 25,571
OR 2003 45,624 1,508 13,961 61,092 3,976 0 65,069
2008 125,324 7,252 30,453 163,029 7,982 0 171,011
SC 2003 18,973 — — 18,973 1,405 275 20,652
2008 26,630 — — 26,630 1,737 66 28,433
SD 2003 — — — — — — —
2008 3,707 — 1,518 5,225 389 0 5,614
TN 2003 0 0 0 0 0 0 0
2008 20,443 0 4,675 25,118 2,359 0 27,477
TX 2003 124,682 — 52,696 177,378 14,284 0 191,662
2008 182,337 — 80,210 262,547 13,715 0 276,262
UT 2003 12,275 — 3,808 16,083 1,340 — 17,424
2008 21,021 — 4,975 25,996 1,782 — 27,778
WA 2003 — — — 37,493 1,746 0 39,239
2008 30,880 838 23,490 55,208 3,567 0 58,775
WV 2003 0 — 0 0 0 0 0
2008 1,957 — 722 2,679 387 0 3,066
WI 2003 — — — 110,444 4,574 0 115,018
2008 123,458 — 33,364 156,822 6,530 0 163,352
WY 2003 4,568 — — 4,568 51 112 4,731
2008 7,511 — — 7,511 74 314 7,899
Total 2003 715,965 1,876 164,364 1,215,075 71,752 3,479 1,290,306
2008 1,417,216 11,391 443,646 1,882,595 100,982 8,226 1,991,803
Percent changee
+99 +170 +55 +41 +136 +54
Source: GAO data collection instrument administered to all 34 HRPs operational in 2008.
Legend: — = response not provided aWhere mental health services claims are not provided, they are included in the medical claims. bMay include third-party administrative fees, actuarial fees, legal fees, agent fees, etc. cTotals may not add due to rounding. dThe Maryland HRP did not begin providing health insurance coverage until fiscal year 2004. eWhile this table presents expenditure figures in rounded numbers (thousands), the percentage change numbers were calculated based on non-rounded expenditure numbers.

Enclosure III
28 GAO-09-730R State High-Risk Health Insurance Pools
Table 18: Average Claims per Enrolled Individual, by State HRP, 2003 and 2008
HRP 2003 2008
AL $6,114 $8,807
AK 13,755 11,496
AR 6,485 6,377
CA 12,609 5,572
CO 6,251 7,323
CT 9,778 15,262
FL 8,406 12,590
ID 4,369 9,407
IL 6,668 9,720
IN 11,355 13,864
IA 13,806 11,515
KS 7,618 11,951
KY 5,939 10,857
LA 10,047 8,573
MD 0a 7,250
MN 5,194 8,974
MS 5,603 6,637
MO 6,856 8,224
MT 4,553 8,457
NE 7,274 10,714
NH 9,868 11,137
NM 8,383 10,108
ND 4,479 7,070
OK 8,211 10,691
OR 6,180 10,643
SC 10,546 11,434
SD —b 7,810
TN —c 6,666
TX 7,189 9,757
UT 5,661 7,179
WA 14,138 16,252
WV —d 4,109
WI 6,330 9,630
WY 7,016 10,490
Across all HRPs $ 6,795e $9,437e
Source: GAO data collection instrument administered to all 34 HRPs operational in 2008 and GAO analysis of data from the National Association of State Comprehensive Health Insurance Plans, Comprehensive Health Insurance for High-Risk Individuals: A State-by-State Analysis, 2008/2009.
Legend: — = response not provided
Note: GAO calculated average claims based on an analysis of total claims and total enrollment—including dependents—for all state HRPs except for Indiana, which directly provided us average claims data. aMaryland’s HRP was first established in 2003. bSouth Dakota’s HRP was first established in 2003. cTennessee’s HRP did not exist in 2003.

Enclosure III
GAO-09-730R State High-Risk Health Insurance Pools 29
dWest Virginia’s HRP did not exist in 2003. eAverages weighted by total enrollment.
Table 19: Sources of HRP Funding Nationwide, 2003 and 2008 (in thousands)
2003 2008
Type of funding ($)Percentage of total
funding ($) Percentage of total
funding
Premiums 763,850 57.4 981,882 54.0
Assessments on health insurance carriers
428,288 32.2 422,815 23.2
Other assessments 28,137 2.1 135,073 7.4
State general revenues 16,683 1.3 93,426 5.1
State tobacco tax 40,000 3.0 39,771 2.2
Federal grantsa 1,844 0.1 31,487 1.7
Other 52,248 3.9 115,063 6.3
Total 1,331,050 100 1,819,517 100b
Source: GAO data collection instrument administered to all 34 HRPs operational in 2008. aFederal grants were awarded by the Centers for Medicare & Medicaid Services. bTotals do not sum to 100 percent due to rounding.

Enclosure III
GAO-09-730R State High-Risk Health Insurance Pools 30
Table 20: Sources of Funding by State HRP, 2003 and 2008
Percentage of total funding
HRP Year Premiums Assessments
on carriersOther
assessments
State general
revenue
State tobacco
taxFederal grantsa Other
Total funding for state HRP
(in thousands)
AL 2003 65.5 33.9 0 0 0 0 0.6 $28,683
2008 72.4 20.3 0 0 0 6.3 1.0 23,071
AK 2003 43.5 56.4 — — — — 0.1 5,939
2008 52.3 38.9 — — — 8 0.7 6,420
AR 2003 61.9 38.1 0 0 0 0 0.1 26,462
2008 76.7 21.6 0 0 0 0.1 1.6 20,963
CA 2003 63.4 0 0 0 36.6 0 0 109,285
2008 45.0 0 11.2 0 43.8 0 0 88,927
CO 2003 67.1 11.9 0 0 0 0 21.0 30,640
2008 44.8 0 0 0 0 2.5 52.7 73,399
CT 2003 62.8 31.3 — — — 5.9 — 25,489
2008 59.5 37.3 — — — 3.3 — 36,205
FL 2003 44.1 55.9 0 0 0 0 0 4,909
2008 51.4 44.0 0 0 0 4.6 0 3,273
ID 2003 73.4 — — 26.0 0 0 0.6 5,889
2008 43.2 — — 43.5 0 6.9 6.5 14,079
IL 2003 77.2 20.6 0 0 0 0 2.2 95,167
2008 73.3 12.9 0 12.5 0 0 1.3 154,297
IN 2003 39.2 60.7 0 0 0 0 0.1 129,245
2008 53.3 11.1 0 33.5 0 1.8 0.4 94,616
IA 2003 27.5 72.3 — — — — 0.2 4,135
2008 57.1 38.8 — — — 2.6 1.4 27,031
KS 2003 76.0 23.3 0 0 0 0 0.6 13,049
2008 49.5 43.7 0 0 0 4.2 2.6 23,754
KY 2003 23.9 21.6 0 0 0 0 54.4 40,249
2008 42.1 21.2 0 0 0 2.7 34.1 60,431
LA 2003 50.6 31.4 4.2 11.6 0 0 2.3 17,219
2008 48.7 10.6 3.6 12.9 0 5.6 18.6 15,512
MD 2003 0 0 72.3 0 0 0 27.7 1,723
2008 31.4 0 61.6 0 0 1.1 5.9 133,878
MN 2003 50.7 48.9 0 0 0 0 0.3 184,128
2008 — — 0 0 0 74.0 26.0 4,651
MS 2003 75.1 24.1 0 0 0 0 0.8 21,623
2008 63.8 29.5 0 0 0 3.2 3.5 28,573
MO 2003 77.2 22.7 0 0 0 0 0.1 15,809
2008 82.1 12.6 0 0 0 3.6 1.6 25,848
MT 2003 65.6 31.6 0 0 0 2.0 0.8 16,756
2008 65.0 29.7 0 0 3.3 0.6 1.3 25,035

Enclosure III
GAO-09-730R State High-Risk Health Insurance Pools 31
Percentage of total funding
HRP Year Premiums Assessments
on carriersOther
assessments
State general
revenue
State tobacco
taxFederal grantsa Other
Total funding for state HRP
(in thousands)
NE 2003 64.7 0 0 0 0 0 35.3 48,900
2008 52.6 0 0 0 0 2.0 45.4 58,781
NH 2003 10.2 88.4 0 0 0 0 1.4 4,794
2008 46.1 47.4 0 0 0 4.5 2.0 13,298
NM 2003 50.6 49.1 0.1 0 0 0 0.2 11,144
2008 23.7 74.1 0 0 0 1.4 0.8 66,210
ND 2003 66.9 33.1 0 0 0 0 0 9,050
2008 62.7 33.9 0 0 0 3.4 0 11,797
OK 2003 56.1 43.9 0 0 0 0 0 27,759
2008 59.8 40.2 0 0 0 0 0 25,202
OR 2003 60.0 38.5 0 0 0 0 1.5 66,864
2008 48.9 47.2 0 0 0 1.5 2.4 167,452
SC 2003 81.4 18.5 0 0 0 0 0.1 16,929
2008 84.5 14.1 0 0 0 0 1.3 29,719
SD 2003 — — — — — — — —
2008 70.3 14.5 0 11.9 0 0 3.3 5,930
TN 2003 — — — — — — — 0
2008 26.4 0 0 72.5 0 1.1 0 30,255
TX 2003 63.8 36.0 0 0 0 0 0.2 191,662
2008 70.5 27.7 0 0 0 1.3 0.6 276,262
UT 2003 74.4 0 0 23.3 0 0 2.2 12,498
2008 55.6 0 0 34.9 0 4.9 4.7 30,982
WA 2003 41.3 58.7 0 0 0 0 0 31,065
2008 30.9 66.0 0 0 0 2.6 0.5 61,664
WV 2003 — — — — — — — 0
2008 60.1 0 35.3 0 0 0 4.6 5,862
WI 2003 51.4 20.1 20.3 7.9 0 0 0.3 129,118
2008 52.5 23.1 23.5 0 0 0 0.8 169,766
WY 2003 66.9 30.8 0 0 0 0 2.3 4,869
2008 62.8 18.8 0 15.3 0 0 3.1 6,377
Source: GAO data collection instrument administered to all 34 HRPs operational in 2008.
Legend: — = response not provided aFederal grants were awarded by the Centers for Medicare & Medicaid Services (CMS). Percentages are based on awards available but may not reflect funds actually drawn down in that year. For example, according to the Minnesota HRP, it was awarded $1,984,248 in federal grants in 2003; however, these funds were not drawn down until 2004.

Enclosure III
GAO-09-730R State High-Risk Health Insurance Pools 32
Table 21: Total Federal HRP Grants Awarded, 2003-2008
Type of federal grant 2003 2004 2005 2006 2007a 2008 Total
Operational $38,538,311 $40,164,646 $74,989,091 $50,000,001 $0 32,669,455 $236,361,504
Bonusb N/A N/A N/A 25,000,000 $0 16,457,045 41,457,045
Seedc 4,202,618 0 0 2,450,000 1,450,000 0 8,102,618
Total $42,740,929 $40,164,646 $74,989,091 $77,450,001 $1,450,000 $49,126,500 $285,921,167
Source: Centers for Medicare & Medicaid Services (CMS).
Legend: N/A = Not applicable aOnly seed grants were awarded in 2007. bBonus grants were not available prior to 2006. cSeed grants were awarded in 2003, 2006, and 2007.

Enclosure III
GAO-09-730R State High-Risk Health Insurance Pools 33
Table 22: Cumulative Federal HRP Grants Awarded, by State HRP, 2003-2008
Type of federal grant
HRP Operational Bonus Seeda Total federal grants
Alabama $6,571,156 $500,000 $0 $7,071,156
Alaska 4,002,711 1,065,640 0 5,068,351
Arkansas 7,195,953 145,420 0 7,341,373
California 0 0 150,000 150,000
Colorado 12,288,357 2,084,917 0 14,373,274
Connecticut 6,828,693 1,125,000 0 7,953,693
District of Columbia 0 0 150,000 150,000
Idaho 2,520,108 350,000 0 2,870,108
Illinois 24,553,892 2,397,444 0 26,951,336
Indiana 12,597,329 1,442,000 0 14,039,329
Iowa 4,157,835 0 0 4,157,835
Florida 0 0 150,000 150,000
Georgia 0 0 150,000 150,000
Kansas 4,475,963 695,000 0 5,170,963
Kentucky 9,505,610 1,725,000 0 11,230,610
Louisiana 4,562,054 1,542,713 0 6,104,767
Maryland 9,421,081 2,025,000 1,000,000 12,446,081
Massachusetts 1,704,415 0 0 1,704,415
Minnesota 15,456,436 3,250,000 0 18,706,436
Mississippi 8,206,031 974,202 0 9,180,233
Missouri 4,735,438 1,550,000 0 6,285,438
Montana 4,860,622 1,104,875 0 5,965,497
Nebraska 5,911,145 1,327,816 0 7,238,961
New Hampshire 3,732,650 1,107,644 1,000,000 5,840,294
New Mexico 7,850,167 1,500,000 0 9,350,167
New York 0 0 150,000 150,000
North Carolina 0 0 1,000,000 1,000,000
North Dakota 2,894,342 178,440 0 3,072,782
Ohio 0 0 150,000 150,000
Oklahoma 10,282,089 1,525,000 0 11,807,089
Oregon 7,958,345 2,450,000 0 10,408,345
Rhode Island 0 0 150,000 150,000
South Carolina 4,128,780 1,250,000 0 5,378,780
South Dakota 2,384,720 521,451 1,000,000 3,906,171
Tennessee 0 0 1,000,000 1,000,000
Texas 21,023,993 3,620,691 0 24,644,684
Utah 5,769,821 1,825,000 52,618 7,647,439
Vermont 0 0 1,000,000 1,000,000
Washington 4,987,098 1,466,892 0 6,453,990
West Virginia 0 0 1,000,000 1,000,000
Wisconsin 13,400,216 2,706,900 0 16,107,116
Enclosure III
GAO-09-730R State High-Risk Health Insurance Pools 34
Type of federal grant
HRP Operational Bonus Seeda Total federal grants
Wyoming 2,394,454 0 0 2,394,454
Total $236,361,504 $41,457,045 $8,102,618 $285,921,167
Source: GAO analysis of Centers for Medicare & Medicaid Services (CMS) data. aCertain operating HRPs were awarded seed grants. For example, Utah’s HRP, which became operational in 1991, was awarded a seed grant in 2003 for program modification.
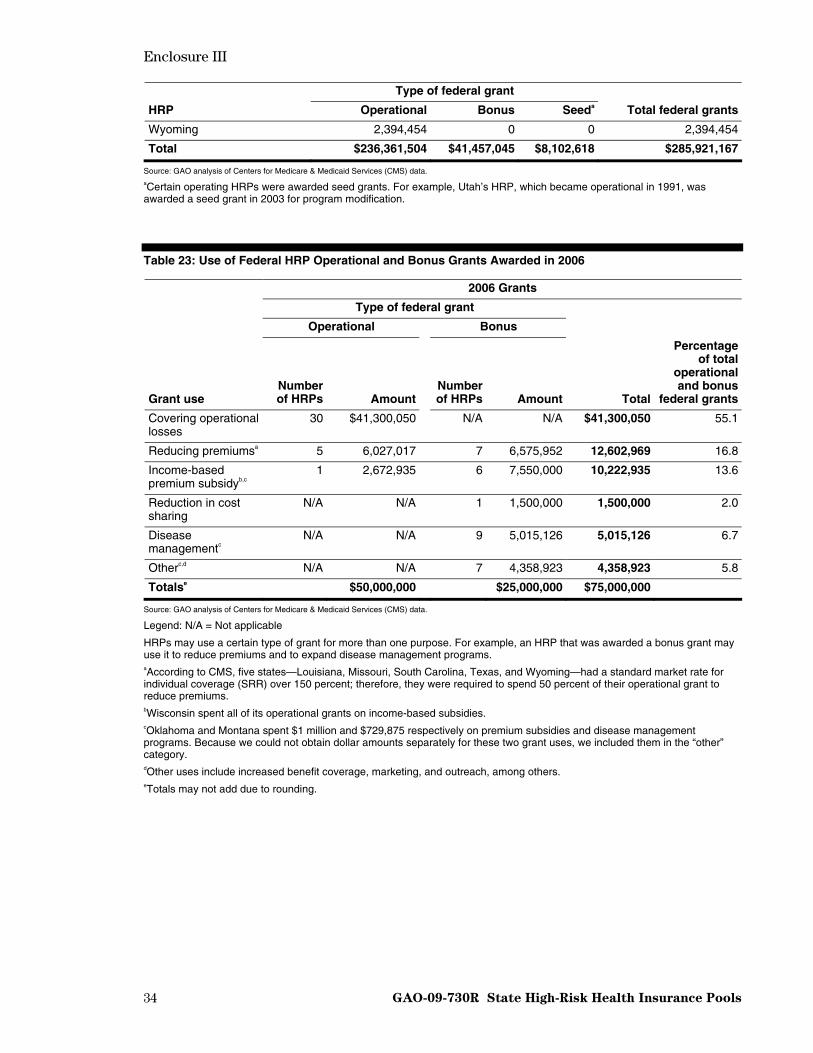
Table 23: Use of Federal HRP Operational and Bonus Grants Awarded in 2006
2006 Grants
Type of federal grant
Operational Bonus
Grant use Number of HRPs Amount
Number of HRPs Amount Total
Percentage of total
operational and bonus
federal grants
Covering operational losses
30 $41,300,050 N/A N/A $41,300,050 55.1
Reducing premiumsa 5 6,027,017 7 6,575,952 12,602,969 16.8
Income-based premium subsidyb,c
1 2,672,935 6 7,550,000 10,222,935 13.6
Reduction in cost sharing
N/A N/A 1 1,500,000 1,500,000 2.0
Disease managementc
N/A N/A 9 5,015,126 5,015,126 6.7
Otherc,d N/A N/A 7 4,358,923 4,358,923 5.8
Totalse $50,000,000 $25,000,000 $75,000,000
Source: GAO analysis of Centers for Medicare & Medicaid Services (CMS) data.
Legend: N/A = Not applicable
HRPs may use a certain type of grant for more than one purpose. For example, an HRP that was awarded a bonus grant may use it to reduce premiums and to expand disease management programs. aAccording to CMS, five states—Louisiana, Missouri, South Carolina, Texas, and Wyoming—had a standard market rate for individual coverage (SRR) over 150 percent; therefore, they were required to spend 50 percent of their operational grant to reduce premiums. bWisconsin spent all of its operational grants on income-based subsidies. cOklahoma and Montana spent $1 million and $729,875 respectively on premium subsidies and disease management programs. Because we could not obtain dollar amounts separately for these two grant uses, we included them in the “other” category. dOther uses include increased benefit coverage, marketing, and outreach, among others. eTotals may not add due to rounding.

Enclosure III
GAO-09-730R State High-Risk Health Insurance Pools 35
Table 24: Use of Federal HRP Operational and Bonus Grants, Awarded in 2006, by State HRP
Grant uses
HRP
Covering operational
losses Premium reduction
Income-based premium subsidy
Reduction in cost sharing
Disease management Othera
Alabama ●
Alaska ● ●
Arkansas ● ●
Colorado ● ●
Connecticut ● ●
Idaho ●
Illinois ● ●
Indiana ● ● ●
Iowa ●
Kansas ● ●
Kentucky ● ●
Louisiana ● ● ● ●
Maryland ● ●
Massachusetts ●
Minnesota ● ●
Mississippi ● ●
Missouri ● ●
Montana ● ● ● Nebraska ● ● New Hampshire ● ● ● ● New Mexico ● ● North Dakota ●
Oklahoma ● ● ●
Oregon ● ●
South Carolina ● ●
South Dakota ● ●
Texas ● ●
Utah ● ●
Washington ● ●
Wisconsinb ●
Wyoming ●
Total 30 7 6 1 11 7
Source: GAO analysis of Centers for Medicare & Medicaid Services (CMS) data.
Legend: ● = grant use
Note: HRPs may use a certain type of grant for more than one purpose. For example, an HRP that was awarded a bonus grant may use it to reduce premiums and to expand disease management programs. aOther uses included increased benefit coverage, marketing, and outreach, among others. bWisconsin spent all of its operational grants on income-based subsidies.

Enclosure III
GAO-09-730R State High-Risk Health Insurance Pools 36
Table 25: Planned Use of Federal Operational and Bonus HRP Grants Awarded in 2008, by State HRP
Grant uses
HRP
Covering operational
losses Reducing premiums
Income-based premium subsidy
Reduction in cost sharing
Disease management Other
Alabama ● ● ●
Alaska ● ●
Arkansas ● ●
Colorado ● ●
Connecticut ● ●
Idaho ● ●
Illinois ● ●
Indianaa ● ●
Iowa ●
Kansas ● ● ●
Kentucky ● ●
Louisiana ● ● ● ●
Maryland ● ●
Minnesota ● ●
Mississippi ● ●
Missouri ● ●
Montana ● ● ●
Nebraska ● ●
New Hampshire ● ● ● ● ●
New Mexico ● ●
North Dakota ● ●
Oklahoma ● ●
Oregon ● ● ●
South Carolina ● ●
South Dakota ● ●
Texas ● ●
Utah ● ●
Washington ● ● ●
Wisconsinb ● ● ●
Wyoming ● ●
Total 29 10 10 1 13 7
Source: GAO analysis of Centers for Medicare & Medicaid Services (CMS) data.
Legend: ● = grant use aAccording to an Indiana HRP official, Indiana also used 2008 grant funds to reduce premiums and for disease management. bWisconsin planned to spend its operational grant on premium reduction.

Enclosure IV
37 GAO-09-730R State High-Risk Health Insurance Pools
Comments from the Department of Health and Human Services

Enclosure IV
GAO-09-730R State High-Risk Health Insurance Pools 38

Enclosure V
39 GAO-09-730R State High-Risk Health Insurance Pools
GAO Contact and Staff Acknowledgements
GAO Contact
John E. Dicken, Director, Health Care (202) 512-7114 or [email protected]
Acknowledgements
In addition to the contact named above, Randy Dirosa (Assistant Director), Nick Bartine, Laura Brogan, Jawaria Gilani, Shirin Hormozi, Martha Kelly, and Pauline Seretakis were major contributors to this report.
(290724)

This is a work of the U.S. government and is not subject to copyright protection in the United States. The published product may be reproduced and distributed in its entirety without further permission from GAO. However, because this work may contain copyrighted images or other material, permission from the copyright holder may be necessary if you wish to reproduce this material separately.

The Government Accountability Office, the audit, evaluation, and GAO’s Mission investigative arm of Congress, exists to support Congress in meeting its constitutional responsibilities and to help improve the performance and accountability of the federal government for the American people. GAO examines the use of public funds; evaluates federal programs and policies; and provides analyses, recommendations, and other assistance to help Congress make informed oversight, policy, and funding decisions. GAO’s commitment to good government is reflected in its core values of accountability, integrity, and reliability.
The fastest and easiest way to obtain copies of GAO documents at no cost Obtaining Copies of is through GAO’s Web site (www.gao.gov). Each weekday afternoon, GAO GAO Reports and posts on its Web site newly released reports, testimony, and
correspondence. To have GAO e-mail you a list of newly posted products, Testimony go to www.gao.gov and select “E-mail Updates.”
Order by Phone The price of each GAO publication reflects GAO’s actual cost of production and distribution and depends on the number of pages in the publication and whether the publication is printed in color or black and white. Pricing and ordering information is posted on GAO’s Web site, http://www.gao.gov/ordering.htm.
Place orders by calling (202) 512-6000, toll free (866) 801-7077, or TDD (202) 512-2537.
Orders may be paid for using American Express, Discover Card, MasterCard, Visa, check, or money order. Call for additional information.
Contact:To Report Fraud, Web site: www.gao.gov/fraudnet/fraudnet.htm Waste, and Abuse in E-mail: [email protected]
Federal Programs Automated answering system: (800) 424-5454 or (202) 512-7470
Ralph Dawn, Managing Director, [email protected], (202) 512-4400 Congressional U.S. Government Accountability Office, 441 G Street NW, Room 7125 Relations Washington, DC 20548
Chuck Young, Managing Director, [email protected], (202) 512-4800 Public Affairs U.S. Government Accountability Office, 441 G Street NW, Room 7149 Washington, DC 20548