voliume 7 public disclosure authorized 1 april...
TRANSCRIPT

VOLIUME 7
1 april 1999 20258
GLOBAL COMMODITY MARKETS
a comprehensive
review and price
forecast
THE WORLD BANK
Commodities Team
DLevelopment Prospects Group ISSN 1020-721X
Pub
lic D
iscl
osur
e A
utho
rized
Pub
lic D
iscl
osur
e A
utho
rized
Pub
lic D
iscl
osur
e A
utho
rized
Pub
lic D
iscl
osur
e A
utho
rized
Pub
lic D
iscl
osur
e A
utho
rized
Pub
lic D
iscl
osur
e A
utho
rized
Pub
lic D
iscl
osur
e A
utho
rized
Pub
lic D
iscl
osur
e A
utho
rized


VOLUME 7
1 E 3 4 ap r i 11999
GLOBAL COMMODITY MARKETS
a comprehensivereview andprice
forecast
THE WORLD BANK| Washington, D.C.

Copyright C) 1999 The International Bank for Reconstruction and Development/The World Bank
1818 H Street N.W., Washington, D.C. 20433, USA
All rights reserved.
Manufactured in the United States of America
You may not copy, reproduce, publish, distribute, transmit, create derivative works, or in anyway exploit any part of the contents of this publication without prior written permission fromthe Office of the Publisher at the address above. The contents of this publication may not beused to construct any kind of database.
The World Bank does not guarantee the accuracy of the data and forecasts presented in thisreport, and accepts no responsibility whatsoever for any consequence of their use.
ISSN 1020-721XISBN 0-8213-4516-8

Contents
Summary ......................... ............... 5
Regional Price Indices ................................ 7
Special Feature. . ............................... 8Currency Devaluations and Commodity Prices
Economic Outlook .......... 10
Ocean Freight .......... 11
EnergyC oal . . . . . . . . . . . . . . . . . . . . . . . . . . . . . . . . . . . . . .12Natural Gas . . . . . . . . . . . . . . . . . . . . . . . . . . . . . . . . . . .14Petroleum . . . . . . . . . . . . . . . . . . . . . . . . . . . . . . . . . .16
Non-Energy
Agriculture
BeveragesC ocoa . . . . . . . . . . . . . . . . . . . . . . . . . . . . . . . . . . . . .. 20Coffee ................... 22Tea .... 24
Fats, Oils, and OilseedsFats and Oils ........ . .... .. .... .. .... .. .... .. 26Coconut Oil ......... ... ..... ..... ............ 28Palm Oil .. 30Soybean Oil . ..................... .. ... . I . . .32Soybeans .. 34
GrainsGrains .. 36M aize . . . . . . . . . . . . . . . . . . . . . . . . . . . . . . . . . . . . . .38R ice . . . . . . . . . . . . . . . . . . . . . . . . . . . . . . . . . . . . . . .40Wheat . . . . . . . . . . . . . . . . . . . . . . . . . . . . . . . . . . . . . .42
april 1999

Contents (continued)
Agriculture (continued)
Other FoodBananas ...................... 44Shrimp ..................... ... ... ... . 46Sugar ..................... 48
Agricultural Raw MaterialsCotton ..................... 50Rubber ..................... 52Tropical Timber ..................... 54
FertilizersNitrogen ..................... 56Phosphates ..................... 58Potash ..................... 60
Metals and MineralsAluminum. . ................... 62Copper. ..................... 64Gold ..................... 66Iron Ore and Steel .................... . ...... .... 68
AppendixCommodity Price Data.. . . 70Commodity Prices and Price Projections in Current Dollars .... 72Confidence Intervals for Price Projections in Current Dollars .73Commodity Prices and Price Projections in Constant 1990 Dollars . . . . 74Confidence Intervals for Price Projections in Constant 1990 Dollars. . . . 75Weighted Indices of Commodity Prices and Inflation. . . . . . . . . . . . 76
Description of Price Series .... 77
Definitions and Notes .... 79
Acronyms and Abbreviations .... 80
4 GLOBAL COMMODITY MARKETS

SUMMARY
S ummary ogy could also mean that prices will remain low for anumber of years.
The sharp price declines in most commodities The global economy is expected to face a secondare probably over, but the recovery is expected year of slow growth in 1999, with an overall increaseto be slow andfaltering. of 1.8 percent. The developing countries are expected
to have even slower growth of 1.5 percent and they areCommodity prices were generally lower during unlikely to return to long-term trend growth before
the quarter, with non-energy prices down an additional 2001. The severity of the crisis in Brazil is worse than5.0 percent from the fourth quarter. However, toward anticipated, although its effects are likely to be con-the end of the quarter, prices began to show evidence tained. Economic growth in Europe is showing signsof a rebound. Petroleum prices rallied sharply in March of weakness and the Japanese economy remains miredfollowing an agreement by OPEC members to curtail in deep recession. Not all of the news is bad, however.production, and prices of other commodities also ral- The US economy continues to show surprising strengthlied, but by lesser amounts. and there are now clear signs that the Republic of Ko-
The sharp declines in most commodity prices are rea and Thailand will be the first to emerge from theprobably over, with the recent price reductions now slump in Asia. Over the longer-term, strong economiccomparable to previous declines. However, additional growth is expected to resume. During the 2002-07price declines cannot be ruled out, and in particular, period, global growth is expected to return to the 3.1lower metals prices are possible. The recovery of prices percent per year growth of the 1 980s, and developingis expected to be slow and faltering. The continued countries are expected to grow by more than 5 percentweakness expected for the global economy, and espe- per year.cially for developing countries where the demand for The slow growth of demand for commoditiescommodities has historically grown the most rapidly, combined with rapid increases in commodity suppliesshould keep commodity demand weak and prices from has led to a surge in commodity stocks. These stocksrising significantly. Large stocks of most commodi- will need to be reduced before a recovery of pricesties will also need to be reduced before prices can can be sustained. For example, grain stocks held byrise. The large production capacity which has devel- the major exporters have increased from 60 millionoped for many commodities and the lower produc- tons in the 1995/96 marketing year to an estimatedtion costs which have come with improved technol- 140 million tons in the current marketing year. This
Non-Energy Commodity Price Index(1990 = 100)
130
110 - - - -
90 - - - - - - -
70
50
301980 1982 1984 1986 1988 1990 1992 1994 1996 1998
Source: World Bank
april 1999 5

SUMMARY
increase amounts to 40 percent of annual global trade coordinated reduction in production and exports ofof 200-210 million tons. Other commodities also have urea fertilizer following the collapse of prices in re-large stocks which will not likely disappear soon. cent months. Natural rubber producers met in Janu-Sugar production has exceeded consumption for the ary to discuss plans to cut production by 10 percent.fourth consecutive year and stocks are near record Such supply control initiatives are often only partiallylevels which has caused raw sugar prices to fall to successful as producers have an incentive to exceedless than 5 cents per pound. Metals stocks are also agreed production levels.near record levels and production capacity exceeds The decline in non-energy commodity prices sinceexpected demand. Copper stocks on the London the peak in 1996 now exceed previous declines and isMetals Exchange are the highest ever recorded. Pro- of comparable length. The graph below shows the be-duction of copper exceeded consumption in 1998, and havior of commodity prices in the 5 years followingproduction at the world's largest copper mining com- the 1980 and 1988 price peaks and also the recent pricepany, Codelco, grew by 13 percent as new capacity declines (shaded in figure on previous page). Follow-was introduced. The world's largest copper mine, ing each of the previous price peaks, commodity pricesEscondida in Chile, is now estimated to have produc- declined for an average of 34 months and by an aver-tion costs of $0.45 per pound compared to current age of 25 percent before prices either stabilized or in-world prices of about $0.70 per pound. Large surplus creased. In the recent period, non-energy commoditycapacity could lead to additional price declines. prices have declined by 29 percent over 34 months.
Commodity producers have begun to curtail pro- The behavior of prices over the next several yearsduction. Most of the initial efforts have involved co- is expected to be closely tied to overall economicordinated reductions of supplies by major producers, growth - as was the case after the two previous pricesuch as the OPEC agreement in March to reduce pro- declines. Following the 1980-82 price decline, globalduction of petroleum by 1.7 million barrels per day. GDP grew by 2.7% in 1983 and 4.3% in 1984 and com-However, there are also several other efforts to re- modity prices rose sharply. However, following theduce commodity production and individual produc- 1988-90 commodity price decline, GDP grew by lessers are also responding to lower prices. US grain pro- than 2.0% per year in the 1991-93 period and com-ducers have reported intentions to plant 3.8% less modity prices were stagnant. Growth in GDP is ex-grain area in the coming year in response to low prices. pected to be slow in the next couple of years, suggest-Russia and Ukraine have reportedly met to discuss a ing commodity prices may rise slowly.
Current and Previous Declines of Non-Energy Commodity Price Index(Peak= 100)
105
t,^-s/^ V~May 1996-March 1999Juneury 1988-Manary 1985 \
7585 *_d .. ... ~ -~ ~~~~~~
SO0 -~
0 12 24 36 48 60Months from Peak
Source: World Bank
6 GLOBAL COMMODITY MARKETS

REGIONAL PRICE INDICES
Regional Price Indices 120 East Asia and Pacific
Prices of developing countries' commodityexports fell twice as fast as those of all 105 ..... ...... . ......... . ...
exporters during the first quarter. World
Prices of non-energy commodities exported by 90
developing countries fell 7.4% from December to East Asia and PacificMarch compared to a 3.6% decline for all exporters. 75 __The greater price declines were due largely to the de-
clines in beverages, oilseeds, and sugar which are 60
heavily concentrated in developing countries. Bever- Mar-95 Mar-96 Mar-97 Mar-98 Mar-99
age prices fell 10.9% from December to March, fats
and oils prices fell 18.6%, and sugar prices fell 25%. 120 Latin America and CaribbeanCountries which devalued their currencies such Latin America and
as Brazil saw higher domestic currency prices which Caribbean
partially offset the dollar price declines, while coun- 105tries which did not devalue their currencies relative to
the dollar saw sharp price declines in both local cur- 90 ---
rencies and dollar terms. WorlAmong developing countries, those in Latin 75.. .
America fared worst, with an average price decline of
nearly 10% for non-energy commodities which they 60
export. Developing countries in other regions fared Mar-95 Mar-96 Mar-97 Mar-98 Mar-99
better, but still saw prices of their non-energy com- South Asiamodities fall faster than those of all exporters. The 120
price index for Sub-Saharan Africa fell 7.5% due to Revisedlower cocoa (-13.8%), robusta coffee (-12.6%), and Worldsugar prices (-25%). Exporters in East Asia had an 40 -
overall 7.3% decline in their non-energy commodity
prices due to lower vegetable oil prices, with palm oil 90 South ----
down 25%. South Asian exporters fared relatively S A
betterthan other developing country exporters, but still 75 -------------------------
saw their prices fall 6% from December to March.
Tea prices in both Calcutta and Colombo were down 60
sharply, 13.6% and 16.0%, respectively, due to in- Mar-95 Mar-96 Mar-97 Mar-98 Mar-99
creased supplies and weak imports from Russia. Sub-Saharan AfricaThe total terms of trade for lower- and middle- 120
income developing countries fell by 5.7% in 1998. RevisedThe greatest declines were in those countries which
were heavily dependent on oil exports, since crude oil Worldprices fell 32%. The terms of trade for Sub-Saharan
Africa fell 9.9% in 1998, East Asia's terms of trade 90.
fell 1.5%, Latin America and Caribbean's terms of
trade fell 4.9%, and South Asia had a 5.6% improve- 75
ment in its total terms of trade. Sub-Saharan Afri
Note: The regional price indexes use the non-energy commodity 60export basket of each region to compute the price index. This Mar-95 Mar-96 Mar-97 Mar-98 Mar-99index is then compared with the index using global exports.
april 1999 7

SPECIAL FEATUREurrencv Devaluations largely domestic.
Currency Devaluations . If devaluation is accompanied by a recession anda reduction of disposable income (which has re-
and Com m odity Prices cently been the case), domestic demand will con-tract even more and hence the supply availability
In the last two years, currency devaluations in the world market will be even greater.have played an important role in shaping * The effects of reduced income and higher domes-commodity markets. Starting in East Asia, tic prices on the world price of a commodity arethen in Russia, and more recently in Brazil, negative if the country is a major importer. Aftercommodity prices have responded quickly to the devaluation of the ruble, tea prices declined
as Russia temporarily dropped out of the tea mar-ket (Russia is the dominant tea importer account-ing for 17% of world imports). Following theBrazilian devaluation, US cotton prices declined
The "Textbook" Effects (Brazil imports cotton from the US).The devaluation of a small country's currency of- * Markets can react through substitute products.
ten goes largely unnoticed in commodity markets since Following the EastAsian crisis, cotton prices wereit does not affect world markets in any significant way. not affected significantly since East Asian cottonHowever, devaluations in countries with large trade imports were partially supported by the US andshares of commodity markets, or when a group of small Australian export guarantee programs. However,countries devalues which, taken together have a large because ofthe devaluations, chemical fiber pricestrade share, then the devaluation can have significant (close cotton substitutes) collapsed, in turn de-effects.* In a "textbook"' setting these effects can be pressing cotton prices (with an 8-month lag).summarized as follows:
• Following a devaluation, prices received by ex- The cases of Thailand and Brazil give a sense ofporters (denominated in domestic currency) in- the quantitative effects of devaluation. Thailand accountscrease, and induce exporters to deplete stocks and for nearly one-third of world rice exports and is consid-direct domestic supplies to intemational markets. ered the world price leader for rice. The Thai currencyDepending on the export share, increased supplies has been devalued twice in the last two decades; it wasin the world market will depress the dollar prices devalued from 23.00 baht/US$ in October 1984 to 27.95accordingly. The opposite effects apply to im- baht/US$ in February 1985. The US$ price of Thai riceports. exports declined from $256/tonto $220/ton overthe same
* The cost of producing the commodity may in- period. The devaluation of the currency was 21.52%crease depending on the use of imported inputs. and the decline in the US$ rice price was 14.15%. AGenerally, for commodities, the value added is parallel situation existed in 1997. The baht was deval-
1997 Shares of Major Exporting Countries in Selected Commodity Markets(excluding US and EU)Country Commodity Share (%) Country Commodity Share (%)Argentna Soybean Oil 34 Ecuador Bananas 38Australia Coal 30 Indonesia Coconut Oil 46Australia Iron Ore 30 Indonesia Palm Oil 24Brazil Coffee 29 Indonesia Rubber 32Brazil Iron Ore 29 Malaysia Coconut Oil 45Brazil Soybeans 21 Malaysia Palm Oil 64Brazil Sugar 21 Thailand Rice 28Canada Potassium 41 Thailand Rubber 41Cote d'lvoire Cocoa 55 Sr Lanka Tea 22Source: World Bank
8 GLOBAL COMMODITY MARKETS

SPECIAL FEATURE
ued from 25.78 baht/US$ in June 1997 to 37.40 baht/ the inflationrate exceeding 20% inAugust 1998),US$ in October 1997 and the US$ price of rice exports one would expect that the demand for automo-decreased from $323/ton in June to $266/ton in Octo- biles - and the demand for rubber to produce tiresber. The decline in the baht was 45% and the decline in - would have plummeted. Reports indicate how-the US$ price of rice was 18%. ever, that automobile sales continued to expand.
In many ways, the situations in Thailand and Bra- In fact, the expansion was driven by Russian con-zil are quite comparable. Brazil accounts for one-third sumers purchasing vehicles as a hedge againstof arabica coffee exports. Both rice and coffee face inflation.inelastic world import demand schedules in the short-run. And in the case of Thailand, the US$ price de- Expectations and fears of a potential devaluationclined by 40% and 66% of the amount of the currency or economic turmoil may affect commodity markets asdevaluation. Following the devaluation of the real, well.which was on the order of 35%, the nearby arabica * Brazil. When reports of a potential devaluationcoffee contract in New York declined by 17%, i.e., about of the real and possible economic turmoil in thehalf of the devaluation was translated into a coffee price Brazilian economy first appeared shortly after thereduction. Russian crisis, coffee exporters vigorously started
converting coffee stocks to dollars, which may... beyond the "Textbook" Effects have contributed to the decline of arabica prices.
Large devaluations, like those in Brazil, East Asia, In anticipation of the devaluation and economicand Russia, which are followed by domestic economic instability agents (i.e., coffee exporters) acted ininstability, often induce trade policy changes, as the fol- a rational way (i.e., by converting stocks to dol-lowing two examples illustrate: lars).
* Indonesia. The Indonesian govemment imposed The behavior of Brazilian exporters may havean export ban on palm oil in early 1998, fearing pushed coffee prices down even before the real's de-increased civil unrest following the financial cri- valuation. On the other hand, Malaysia's andsis. Palm oil is an important component of the Indonesia's policy changes had a positive effect ondomestic diet. Indonesia's palm oil production prices but, if removed, the effect will be reversed.and export shares were 32% and 25%, respec- Therefore, the effects of the devaluation on prices maytively. The export ban was later replaced by a be "stretched out" in both directions far more than the60% export tax, effectively keeping Indonesia out fundamentals dictate.of the export market, which explains why theprices of palm oil and soybean oil (a close substi- Conclusiontute to palm oil) rose following the crisis. Ultimately, the response of commodity prices to
* Malaysia. Malaysia's imposition of capital con- devaluations depends mainly on the trade share. Expe-trols in September 1998 is another example ofhow rience has shown that in commodity markets where apolicy changes may affect commodity markets. particular country's share is about one-third of worldThe imposition of capital controls effectively nul- trade, half of the devaluation is translated into a pricelified many rubber export contracts and compli- decline. Often, however, devaluations induce policycated the process of negotiating new ones. Natu- changes, which in turn alter the expected behavior ofral rubber importers turned to Indonesian and Thai commodity prices. Eventually, policy distortions maysuppliers, thus putting upward pressure on rubber be removed and the full impact of devaluation take place.prices - Thailand, Indonesia, and Malaysia ac- If the new exchange rate is sustained, the country's po-count for 41%, 32%, and 13%, respectively of sition in the world market may be durably altered bynatural rubber exports. making its exports more competitive.
Changes in savings behavior can impact commod- *Even in cases where a country accounts for only a small shareity prices in unexpected ways. of world trade, a devaluation may affect commodity prices if the
itysprices In the aftermath oftheRussianecon country is a major producer and consumer. A devaluation will* Russia. In the aftermath of the Russian economIc divert the commodity from domestic consumption to the export
crisis (with GDP shrinking by more than 8% and market.
april 1999 9

ECONOMIC OUTLOOK* ] * of world trade has been cut from 5.7% to 4.2%. Ex-Economic Outlook ternal finance is likely to remain tight, with access
A more difficult international economic envi- largely restricted to the most creditworthy borrowers,ronmentfor developing countries and at much higher spreads.
In most developing countries, private investmentThere have been important favorable develop- plans are being scaled back and restrictive policies
ments in recent months. Interest rate cuts in the United are being adopted to adjust to the reduced ability toStates and Europe, and the adoption of enormous fis- import. Domestic weaknesses remain, includingcal stimulus and financial restructuring plans in Ja- chronic fiscal deficits in several large developing coun-pan are likely to provide considerable support to de- tries, the need to undertake corporate and financialmand in the industrial countries in 1999. The US restructuring in many countries in Asia, and civil oreconomy has continued to show surprising strength, international conflicts in Africa.and there are clear signs that Korea and Thailand will The developing countries as a group are expectedbe the first to emerge from the slump in Asia. to experience very low growth in 1999, and are un-
Unfortunately, a broad review of the data indi- likely to return to long-termn trend growth rates beforecates more weakness than previously anticipated. 2001. Domestic factors will play a critical role, e.g.World industrial production fell 1% year-on-year in the rate at which fiscal consolidation progresses inthe fourth quarter. The crisis in Brazil is severe, al- countries such as Brazil, India, Russia, and Turkey;though its spillover effects are likely to be contained. the extent of financial and corporate restructuring inThere are also signs of faltering growth in Europe, several Asian countries; and the resolution of civil andand the Japanese economy remains mired in deep re- intemational conflicts in a number of regions.cession. There remain substantial risks to the forecast,
On balance, the external environment facing although the likelihood of markedly worse outcomesmost developing economies has continued to deterio- has receded in recent months. Among the risks arerate, reflecting weaker commodity prices, world trade, worsening economic conditions in Japan, a protractedand capital flows. The year-over-year growth of world withdrawal of capital market financing to Latintrade volumes in the fourth quarter of 1998 is esti- America, and a large stock market correction in themated at near zero and the 1999 forecast for growth United States and Europe.
World Growth, 1981-2007(Change in real GDP)
ForecastsRegion 1981-90 1991-97 1998 1999 2000 2001 2002-07World total 3.1 2.3 1.9 1.8 2.4 2.8 3.1
High-income countries 3.1 2.1 1.9 1.8 2.1 2.3 2.6OECD countries 3.0 1.9 2.0 1.8 2.0 2.2 2.5Non-OECD countries 6.6 6.1 -1.7 1.6 3.8 4.7 5.2
Developing countries 3.0 3.1 1.9 1.5 3.7 4.6 5.1East Asia 7.7 9.4 1.8 4.0 5.5 6.3 6.8Europe and Central Asia 2.6 -4.0 -0.3 -1.5 2.3 3.6 4.7Latn America and the Caribbean 1.9 3.6 2.0 -0.8 2.5 3.9 4.3Middle East and North Africa 1.0 2.9 1.5 0.7 2.5 3.3 3.7South Asia 5.7 5.5 5.2 4.4 4.8 5.2 5.0Sub-Saharan Africa 1.9 2.2 2.1 2.5 4.0 4.0 4.1
Memorandum itemEast Asian crisis countries 6.9 6.9 -7.7 0.3 3.5 4.5 5.3
Indonesia, the Republic of Korea, Malaysia, Philippines, and Thailand.Note: GDP is measured at market prices and expressed in 1987 prices and exchange rates. Growth rates over historic intervalsare computed using the least squares method.Source: Global Development Finance, World Bank. Data and baseline projectons, March 1999.
10 GLOBAL COMMODITY MARKETS
OCEAN FREIGHT
O c e an F reight Pacific round voyage rates increased by 25% to $5,856/Ocean Freight ~~~~~~~~day.
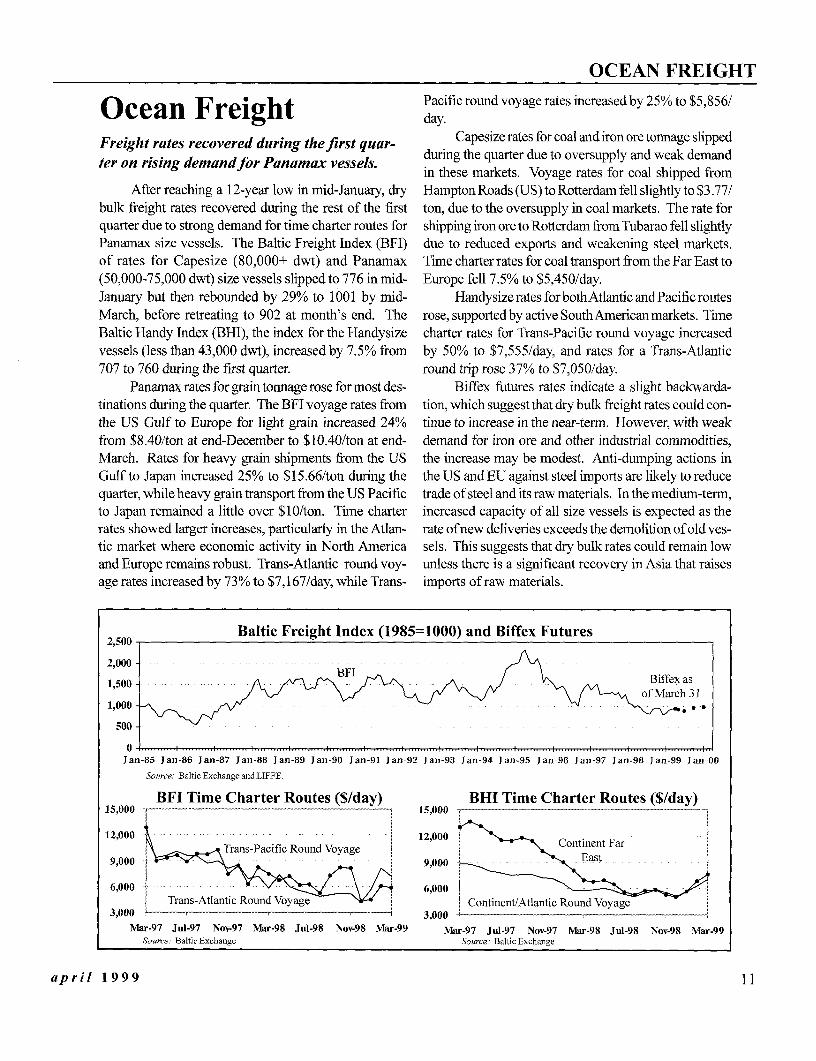
Freight rates recovered during thefirst quar- Capesize rates for coal and iron ore tonnage slipped.oridemandfor Panamax vessels, during the quarter due to oversupply and weak demand
in these markets. Voyage rates for coal shipped fromAfter reaching a 12-year low in mid-January, dry Hampton Roads (US) to Rotterdam fell slightly to $3.77/
bulk freight rates recovered during the rest of the first ton, due to the oversupply in coal markets. The rate forquarter due to strong demand for time charter routes for shipping iron ore to Rotterdam from Tubarao fell slightlyPanamax size vessels. The Baltic Freight Index (BFI) due to reduced exports and weakening steel markets.of rates for Capesize (80,000+ dwt) and Panamax Time charter rates for coal transport from the Far East to(50,000-75,000 dwt) size vessels slipped to 776 in mid- Europe fell 7.5% to $5,450/day.January but then rebounded by 29% to 1001 by mid- Handysize rates for bothAtlantic and Pacific routesMarch, before retreating to 902 at month's end. The rose, supported by active SouthAmericanmarkets. TimeBaltic Handy Index (BHI), the index for the Handysize charter rates for Trans-Pacific round voyage increasedvessels (less than 43,000 dwt), increased by 7.5% from by 50% to $7,555/day, and rates for a Trans-Atlantic707 to 760 during the first quarter. round trip rose 37% to $7,050/day.
Panamax rates for grain tonnage rose for most des- Biffex futures rates indicate a slight backwarda-tinations during the quarter. The BFI voyage rates from tion, which suggest that dry bulk freight rates could con-the US Gulf to Europe for light grain increased 24% tinue to increase in the near-term. However, with weakfrom $8.40/ton at end-December to $10.40/ton at end- demand for iron ore and other industrial commodities,March. Rates for heavy grain shipments from the US the increase may be modest. Anti-dumping actions inGulf to Japan increased 25% to $15.66/ton during the the US and EU against steel imports are likely to reducequarter, while heavy grain transport from the US Pacific trade of steel and its raw materials. In the medium-term,to Japan remained a little over $10/ton. Time charter increased capacity of all size vessels is expected as therates showed larger increases, particularly in the Atlan- rate of new deliveries exceeds the demolition of old ves-tic market where economic activity in North America sels. This suggests that dry bulk rates could remain lowand Europe remains robust. Trans-Atlantic round voy- unless there is a significant recovery in Asia that raisesage rates increased by 73% to $7,167/day, while Trans- imports of raw materials.
2,500 - Baltic Freight Index (1985=1000) and Biffex Futures
2,000-BF
1,500-Bifxa
1,000
500
Jan-85 Jan-86 Jan-87 Jan-88 Jan-89 Jan-90 Jan-91 Jan-92 Jan-93 Jan-94 Jan-95 Jan-96 Jan-97 Jan-98 Jan-99 Jan-00
Source: Baltic Exchange andLIFFE.
BFI Time Charter Routes ($/day) BHI Time Charter Routes ($/day)1 5,000 - -- _ ..... _.------.......... 1 5 000 ~~~~~ ~
12,000~~~~~~~~ 12,00012,000 \ Trans-Pacific Round Voyage Continent Far
9,000 9,000 East
6,000 - 6,000
3,000 Trans-Atlantic Round Voyage Continent/Atlantic Round Voyage
Mar-97 Jul-97 Nov-97 Mar-98 Jul-98 Nov-98 Mar-99 Mar-97 Jul-97 Nov-97 Mar-98 Jul-98 Nov-98 Mar-99Source: Baltic Exchange Source: Baltic Exchange
april 1999 11

ENERGY
Coal Monthly Prices ($/ton)
International coal prices remain depressedbecause of weak demand and oversupply. 41
Sharply lower contract prices for fiscal year 38
(FY) 1999 will likely result in the closure ofhigh-cost mines. 35
International coal prices fell slightly to $26.10 perton in the first quarter. Spot prices remain several dol- 32 . ..... ... IH..... H .,.
lars below the FY1998 contract price of $34.50/ton be- Mar-95 Mar-96 Mar-97 Mar-98 Mar-99Source: Coal Weeklnternational
cause of weak demand and excess supply.Australian thermal coal suppliers agreed to a bench- World Balance (million tons)
mark price of $29.95/ton for FY1999 deliveries begin- 4,000ning April 1, a decrease of 13% or $4.55/ton. This fol-lows an 18% or $9 decrease in coking coal contract priceS 3,500
in December. Production
Low prices will likely result in the closure of some 3,000
high-cost operations and reduce investment in new ca-pacity. Mergers and consolidations, which have already 2,500
begun in the US and Canada, are expected to continue.Coal prices are expected to remain flat next year, 2,000 I l
although declines are possible if global economic activ- 1970 1975 1980 1985 1990 1995
ity weakens further. In the medium-term, a recovery in Source: IEAandWorldBank
Asian demand will help reduce excess supply and, withsome reduction in capacity, allow prices to rise moder- 600 Exports (million tons)ately. However, continued advances in technology, fur-ther productivity gains, and development of new low- 450
cost mines are expected to result in continued declinesin real prices. Over the longer-term, the implementation 300
of policies to reduce greenhouse gas emissions couldaffect thermal coal demand significantly. 150
US coal prices remained flat in the first quarter asmild weather reduced electricity demand and resulted 0 -in a large build-up of stocks. In addition, low oil and gas Source: 1EA ad 80 1985 W990 99
prices encouraged the use of these fuels to meet incre-mental and, in some cases, base-load requirements. US Annual Prices ($Iton)While the recent sharp rise in oil prices will cause utili- 80ties to switch back to coal, large inventories are expected Constant Forecast
to dampen demand this year. 65 -
US coal exports are expected to continue to fall aslower-priced coals from Australia and South Africa, and so -
growing coal export industries in Indonesia, Colombia,and Venezuela, increase their market shares. Steam coal 35 Current
exports will suffer most, while coking coal exports will Current
be supported by the demand for higher quality US coals. 20
Over the longer-term real prices are expected to 1977 1982 1987 1992 1997 2002 2007decline due to continued productivity improvements and Source: Coal WeekInternational and World Bank forecasts.
a shift to lower-cost, low-sulfur western coal.
12 GLOBAL COMMODITY MARKETS

COAL
Other Developments* Shell Australia has settled on a coking coal price of * The Australian Bureau of Agriculture and Resource
$33.70/ton with Brazilian steel mills, about $4 be- Economics (ABARE) projects that world thermallow mid-1998 spot levels. Last year's contract coal trade will increase by 4.6% p.a. over the nextprices for most Australian hard coking brands were five years, primarily reflecting higher economicin the $42.00-$43.00 range. growth rates in Asia. World metallurgical coal trade
* Ingwe, reporting for the first time as a wholly is expected to increase by only 1% p.a., with littleowned subsidiary of parent Billiton Plc, cut its growth expected in the short-term until blast fur-unit cost of sales at its Australian operations by nace steel production recovers. Shifts toward amore than 15% in A$ terms for the six-months greater share of steel production coming from elec-prior to end-December 1998. Including depre- tric arc furnaces are expected to contribute to theciation of the A$, its equates to a cost reduction slow growth in metallurgical coal consumption. Inof more than 25%. the steam coal sector, strong competition for ex-
* Steam coal exports from the US (excluding Canada) port markets, further increases in mining produc-began 1999 at an even slower pace than last year. tivity, and the addition of new, low-cost mines, areJanuary's shipments were barely half of December's, expected to cause real prices to ease further overand were 4% lower than January 1998. the medium-term.
Production (million tons) Exports (million tons)1994 1995 1996 1997 1994 1995 1996 1997
China 1,239.9 1,360.7 1,396.7 1,348.0 Australia 128.8 136.4 138.6 146.4US 857.7 858.6 884.1 908.9 US 64.7 80.3 82.1 78.7India 257.8 273.4 285.6 310.2 S. Africa, Rep, 54.8 59.7 60.2 63.4S. Afrca, Rep. 195.8 206.2 206.4 220.1 China 24.2 28.6 36.5 30.7Australia 176.7 191.1 193.4 207.5 Indonesia 21.9 31.3 36.4 41.7Russian Fed. 176.8 176.9 166.5 156.6 Canada 31.6 34.0 34.4 36.5Poland 133.9 137.2 138.0 138.0 Poland 27.7 31.9 28.9 29.5Kazakhstan 99.6 79.5 73.0 n.a Russian Fed. 23.1 26.3 25.6 21.6Ukraine 91.3 81.3 70.5 n.a Colombia 18.4 18.3 24.8 25.7Germany 57.6 58.9 53.2 51.2 Kazakhstan 26.0 12.9 21.7 n.a.UK 49.3 54.6 51.9 48.5 Czech Rep. 6.2 7.0 6.7 6.6Indonesia 32.3 41.1 50.2 54.5 Venezuela 4.4 4.3 3.5 4.2Canada 36.6 38.6 40.0 41.3 Netherands 3.1 2.9 2.4 3.5Colombia 22.7 25.7 30.1 32.6 Vietnam 2.1 1.8 2.1 1.7Korea, D. R. 28.0 26.0 24.1 24.0 Ukraine 4.6 2.4 2.0 n.a.Czech Rep. 17.4 17.2 16.5 16.0 New Zealand 0.9 1.3 1.6 1.2Spain 14.1 13.7 13.7 13.9 Belgium 1.0 0.8 1.2 1.5Vietnam 6.2 6.6 11.2 10.9 UK 1.2 0.9 1.0 1.1France 8.1 8.5 7.8 6.3 Germany 2.0 1.9 1.0 0.5World 3,551.6 3,698.7 3,754.9 3,775.1 World 413.6 464.6 483.9 494.3
Source: lEA Source: IEA
Global SummaryActual -Annual Growth Rate (%l)-
World Balance (mil. tons) 1970 1980 1990 1995 1996 1997 1970-80 1980-90 1990-97Producton 2,185 2,807 3,561 3,699 3,755 3,775 2.8 2.8 1.1Consumption 2,175 2,783 3,516 3,698 3,744 3,777 2.8 2.9 1.3Exports 167 263 401 465 484 494 4.4 4.9 3.5
Actual ForecastPrices ($/ton) 1995 1996 1997 1998 1999 2000 2001 2005 2010
Current 39.19 37.21 36.39 34.38 33.50 33.50 34.00 36.00 38.50Constant 1990 32.88 32.58 33.58 33.00 31.96 31.46 31.16 29.86 28.23
Source: IEA and World Bank forecasts.
april 1999 13

ENERGY
Natural Gas - US Monthly Prices ($/mbbtu)4.25-
High inventories and mild weather keep US Spotgas prices low, but inventory rebuilding and 3.50 -
concerns about domestic supplies cause a 275 -
recentfirming ofprices. .75
US natural gas prices fell 5.2% in the first quar- 2.00 -ter to $1.81 per million btu (mmbtu) on continued highinventories and weak demand. However, spot prices 1.25 - ....... I ..... ...firmed toward the end of March as bargain purchases Mar-96 Mar-97 Mar-98 Mar-99 Mar-00
for inventory pulled up prices. *Futures are end-March.Source: WSJ and NYMEX.
Storage levels at the end of the first quarter are Production (Tcf)estimated to have fallen near 1400 billion cubic feet 23(Bcf), but were still 20% higher than at the same timelast year, and more than 40% above levels two years 21earlier. In order to reach relatively full storage at the Consumptionend of October (last year was 3176 Bcf), a lower rate 19of injections is required this year.
Demand is projected to rise only moderately, 1 / roduction
partly due to the decline in industrial production. How- 17ever, higher oil prices will allow gas to recapture aportion of the dual-fuel market on the Atlantic coast. 15
US gas production is poised to decline slightly 1970 1975 1980 1985 1990 1995this year because of low oil and gas prices that has Source: US DOE
reduced investment for development drilling. Higher 4 Poil prices will benefit associated gas production, butmay not be sufficient to achieve positive growth in 3total output this year. But rising oil and gas prices areexpected to raise domestic production next year. 2
Imports from Canada are on the rise followingcompletion of more than 1.2 Bcf per day of additional 1pipeline capacity. It will take time to fill the new ca-pacity, and surplus pipeline capacity is expected to 0 - .endure well into 2000. 1970 1975 1980 1985 1990 1995
Gas prices are expected to decline this year due to Source: US DOE
ample supply and reduced pressure on injections because Annual Prices ($/mmbtu)of current high levels of inventories. In 2000 and be- 4 -yond, nominal prices are expected to rise on relatively Con Forecaststrong demand growth in the power generation sector, 3but real prices are not expected to increase. Another 1.2Bcf of new pipeline capacity from Canada is expected 2to be completed by the end of 2000, and new capacity urrentand higher exports are expected over the forecast pe- 1riod. US production is projected to increase moderately,with much of the growth occurring from conventional 0 - .onshore areas. However, unconventional onshore and 1970 1975 1980 1985 1990 1995 2000 2005 2010offshore gains - particularly from the deepwater Gulf of Source: US DOE, WSJ, and World Bank forecasts.
Mexico - will contribute to rising production.
14 GLOBAL COMMODITY MARKETS

NATURAL GAS
Natural Gas - Europe 3.50 Monthly Prices ($/mmbtu)
European gas prices continue to fall because European
of the lagged effect of low oilprices, but the 3.00 -
rebound in petroleum prices will pull gas 2.50
prices higher.European gas prices fell 4% in the first quarter 2.00 -
due to the lagged effect of low oil prices, as long-termcontracts of imported gas are indexed to petroleum 1.50-prices. The decline brings European gas prices to their Mar-95 Mar-96 Mar-97 Mar-98 Mar-99lowest levels in more than 20 years, and also down to Source: World Gas Intelligence
North American levels where prices are largely deter- Production (BCM)mined by gas-on-gas competition. However, the re- 500surgence of oil prices will raise European prices, de-pending on how petroleum markets perform and the 400pace of energy market liberalization in Europe. Production
Demand rose 3% in 1998 and is projected to in- 300crease by 4% this year as the fast pace of new house-hold connections continues. The ongoing switch to 200gas in the Italian power sector and the steady increase Consumption
in southern and central Europe are also adding to gas 100 -demand. Liberalization of the electricity and gas sec- 1970 1975 1980 1985 1990 1995tors and increasing environmental concerns are ex- Source: BP and World Bank estimates.
pected to raise gas demand over the longer-term. FSU* Production (BCM)There is more than ample capacity to supply Eu- 800 -
ropean markets from domestic and foreign sources, Production
and no resource constraints are envisioned in the dis- 600
tant future. Norwegian gas supplies continue to risefrom the volume buildup under the Troll field con- 400 -snp.tracts, and Russia's capacity to deliver gas to Turkeythrough Romania and Bulgaria will expand next year. 200
UK exports to the continent began in the fourth o -quarter through the Interconnector Pipeline, but low 1970 1975 1980 1985 1990 1995gas prices on the continent prevented UK prices from *Countries of the former Soviet Union.
rising. The pipeline flow was reversed in December Source: BP
as low continental gas prices drew mainland gas into Annual Prices ($/mmbtu)the UK. In addition, relatively low storage capacity 8in the UK provides an opportunity for continental gas Cntt Forecast
to satisfy a portion of peak-season British demand if 6the economics so warrant.
New supply routes through France are adding tothe increasingly competitive environment in Europe. 2The NorFra Pipeline to Dunkirk commissioned in Oc- Currenttober is the fourth major gas export line from Norway oto the continent. Along with additional imports of 1973 1978 1983 1988 1993 1998 2003 2008Nigerian LNG, France is positioned to deliver gas to Source: World Gas Intelligence and World Bank forecasts.
other countries, either physically or through swaps ofRussian and Algerian gas.
april 1999 15

ENERGY
Petroleum Monthly Prices ($/bbl)24 -
Anticipation of OPEC production cuts led tosoaring futures prices in March. Inventories 20 - Spot IPE Brent
remain high but with reasonable quota com- \ Futures
pliance they will fall in the second-half of the 1
year, leading to higher prices. 12 -
Oil prices rose sharply in March as anticipated 8 - .. ,
production cuts by OPEC led to strong speculative de- Mar-96 Mar-97 Mar-98 Mar-99 Mar-00
mand on futures markets. From mid-February to end- *World Bank average. Futures prices are end-March.
March, oil prices shot up 50% to end the quarter at SoWrce:Bloombergand lPE.
$15.50 per barrel (bbl). 80 World Balance (mb/d)For the first quarter, average oil prices actually
fell slightly because weak demand, high inventories, 70
and the unwillingness of producers to reduce supplies Production Consumption
kept prices low in January and February. But the abrupt 60
action of producers to remove significant volumes ofoil from market - compared with a lack thereof last 50
fall - quickly reversed market sentiment. The new out-put cuts will help reduce the surplus and result in higher 40 I I
prices, but the magnitude will depend on the level of 1970 1975 1980 1985 1990 1995
compliance and the pace of oil demand. Source. BP, FEA, and Uorld Bank.
Ten OPEC producers (excluding Iraq) agreed on OECD Total Stocks (million bbl)March 23 to reduce production by 6.9% or 1.7 mb/d 2,900 -
for one year beginning April 1. All producers acceptedreductions of 7.3% except Venezuela which was per- 2,750
mitted a 4.4% cut of 0.125 mb/d (see table). Nearly End-month
half of the volume reductions are bome by Saudi Arabia 2,600
and Iran with cuts of 0.585 mb/d and 0.264 mb/d, re-spectively. 2,450
The agreement was preceded by a meeting inAmsterdam between non-OPEC Mexico, Saudi Arabia, 2,300- l I
and Venezuela. They decided that more than 2 mb/d Mar-94 Mar-95 Mar-96 Mar-97 Mar-98 Mar-99Source. lEA an d World Bank.should be removed from the market, of which non-
OPEC producers were expected to contribute around Annual Prices ($/bbl)0.4 mb/d. Mexico agreed to cut 0.125 mb/d, Norway 600.1 mb/d, and Oman 0.06 mb/d. Constant Forecast
This is the third time in the past year that OPEC 45
has agreed to reduce production - the previous accordswere inApril 1998 (1.2 mb/d) and July 1998 (1.1 mb/ 30
d). The earlier cuts were less than effective in support-ing prices because, in addition to weak demand, they 15 -were needed to undo the 10% rise of quotas in the fourth Currentquarter of 1997, leading to the price collapse last year. 0 _ I I
Moreover, Iraq's production has risen by more than 1 1970 1975 1980 1985 1990 1995 2000 2005 2010
mb/d, which has offset cuts by other members. The Source: API, Bloomberg, and World Bank forecasts.
net effect is that OPEC is still producing more oil than
16 GLOBAL COMMODITY MARKETS

PETROLEUM
Petroleum (continued) Crude Oil Production (mb/d)before it raised quotas in late 1997 - OPEC production Oth
in the first quarter of this year of 30.6 mb/d was 0.5 24
mb/d higher than in the 3Q97 (see table).OPEC continued to produce about 0.5 mb/d above 16 Spot
quota in the first quarter, putting their rate of compli- Spotance at about 80% of the 1998 cuts. The largest over- 8
producers were Iran, Saudi Arabia (including their share usof Neutral Zone output), and Venezuela. 1970 1975 1980 1985 1990 1995
Non-OPEC production has been seriously af- *ForrnerCentrallyPlannedEconormes.
fected by low prices, as its overall production failed to Source: API and IEA.
increase in the first quarter. This follows growth ofonly 0.2 mb/d last year. Low prices have substantially 24 OPEC Crude Oil Production (mb/d)reduced industry revenues and upstream capital expen- Other
ditures, which in turn has caused a sharp decline in 18
development drilling. Nevertheless, production con-tinued to increase in a number of countries as a result 12of new developments, e.g., Brazil, Canada, Colombia,Mexico, and the UK. 6 Saud/
Higher prices will benefit non-OPEC producers, krabia
but it will take time for production to recover follow- 0 -iing more than a year of low prices. The wave of con- 1970 1975 1980 1985 1990 1995
solidation and merger activity will result in fewer com- Source: IEA and World Bank.
panies which could result in reduced investment in the OPEC Oil Export Revenues ($ billions)near-term. It is possible that total non-OPEC produc- 200 - othertion could fall this year despite higher prices. Other
Demand continues to increase moderately in the 150 - OEdeveloped world, due to continued strong economicactivity. In addition, German heating oil demand has 100been particularly strong in advance of an April tax hike.In the developing countries demand remains weak as a 50s-/,
result of the financial crises in Asia, and more recently Middle East
in Russia and Brazil. Demand appears to be stabiliz- 0ing in Asia, and there are indications that a recovery is 1970 1975 1980 1985 1990 1995
taking place. Republic of Korea oil demand rose by Source: IEAandWorldBank.
11% in January, but this was compared to a very low World Oil Demand (mb/d)level last year when heavy destocking occurred. More- 48 -over, the January level was lower than in December.Demand rose by less than 3% in February, but it is too 36
soon to know the underlying trend in consumption.24
Inventories have started to decline, but remain oprecariously high (see graphs). In recent weeks US 12USUproduct stocks have declined sharply due to relativelystrong demand, refinery problems, and spring mainte- 0 I
nance. Crude oil stocks, however, continue to rise. 1970 1975 1980 1985 1990 1995*Countries ofthe formier Soviet Union.Stocks will have to be reduced for prices to re- Source: BP and LeEA.
cover on a sustained basis. OPEC's production cuts
april 1999 17

ENERGY
Petroleum (continued) Growth in Quarterly Demand (mb/d)
could cause stocks to fall fairly quickly depending on Other*
the level of compliance and the pace of demand.Should OPEC fully comply with its new quotas, 1.0 -
production would fall by 2.2 mb/d, which includes the0.5 mb/d currently over quota plus the new cut of 1.7mb/d. A reduction of this magnitude could more than 0.0 -remove last year's build-up of stocks and lead to a very Asia-Pacific
tight market this winter. -1.0 - . I ._I_._ I_._I_._I
It is unlikely that OPEC will fully comply, as was 1Q93 1Q94 1Q95 1Q96 1Q97 1Q98 1Q99the case last year. Assuming 70% compliance of the *Excludes countries ofthe former Soviet Union.
needed cuts (2.2 mb/d), production would fall by 1.5 Sourrce: IEA
mb/d for the remainder for the year. Given prospects 40for moderate growth in demand and little increase in Non-
OPEC*non-OPEC supplies, stocks would not begin to fall sig- 36
nificantly until the second-half of the year. The annualdecline in inventories would be only half of last year's 32
build-up, but the projected draw in the fourth quarter ECwould imply a fairly tight market. 28
The pace of oil demand could assist or impedeOPEC's ability to raise prices. Should a recovery in 24 I I I
the developing countries not materialize and the econo- 1Q93 1Q94 1Q95 1Q96 1Q97 1Q98 1Q99
mies in Europe and North America begin to slow, then *ExCludes countries ofthe former Soviet Union.Source: IEA
the pressure on stocks to fall would subside accord- Europe Crude Oil Stocks (million bbl)ingly. On the other hand, should the developing world 380
indeed recover and help sustain robust growth in NorthAmerica and Europe, tightness in markets later in the 355
year could be expected. Should OPEC also fully com- End-Month*
ply with its quotas, the market may require higher pro- 330 -
duction to prevent a price spike next winter.For non-OPEC production, the benefits of higher 305 -
prices will take several months, if not much longer, towork their way through the system. It will also take 280 -companies time to recover from the financial constraints Mar-94 Mar-95 Mar-96 Mar-97 Mar-98 Mar-99and consolidations this past year. *March 1993 to February 1999.
If OPEC maintains output at a level that keeps N. America Product Stock (million bbl)prices in the upper teens over the next couple of years, 750 -
market pressures of the past decade will return. Overtime, competing supplies will renew their upward trend 700 -and impinge on OPEC's ability to raise market share. End-Month*
As more countries attract foreign capital and technol- 650 -
ogy, it will lead to growing competition in supplyingoil. Demand is projected to grow moderately over the 600longer-term but could be restrained by environmentalconcerns and policies to implement the reduction of 550 I I I
greenhouse gas emissions. Thus real prices are ex- Mar-94 Mar-95 Mar-96 Mar-97 Mar-98 Mar-99
pected to continue their long-term decline over the next *March 1993 to February 1999.
decade. Source: IEA
18 GLOBAL COMMODITY MARKETS

PETROLEUM
OPEC Crude Oil Production and Quotas Non-OPEC Oil Supply(Millions of barrels per day) (Millions of barrels per day)
1099- Quota New Change3Q97 4098 1.99 Quota Apr-99 Cutbacks 1996 1997 4Q98 1Q99 4098-1099
Algeria 0.85 0.81 0.82 0.03 0.731 0.057 US 8.59 8.65 8.16 8.11 -0.05Indonesia 1.37 1.31 1.30 0.02 1.187 0.093 Mexico 3.28 3.41 3.45 3.52 0.07Iran, Islamic R. 3.58 3.60 3.76 0.14 3.359 0.264 Canada 2.46 2.57 2.68 2.59 -0.09Iraq 1.22 2.41 2.53 UK 2.81 2.74 2.98 3.01 0.03Kuwait* 1.83 1.71 1.72 0.02 1.836 0.144 Norway 3.23 3.28 3.10 3.06 -0.04Libya 1.43 1.35 1.36 0.04 1.227 0.096 Other OECD 1.35 1.42 1.26 1.33 0.07Neutral Zone 0.54 0.53 0.57 Afrca 2.64 2.73 2.74 2.71 -0.03Nigera 2.28 1.96 2.01 -0.02 1.885 0.148 China 3.12 3.19 3.19 3.20 0.01Qatar 0.65 0.62 0.67 0.03 0.593 0.047 OtherAsia 2.11 2.11 2.16 2.19 0.03Saudi Arabia* 8.08 7.96 7.87 0.13 7.438 0.585 FSU 7.07 7.20 7.35 7.27 -0.08UAE 2.25 2.17 2.19 0.03 2.000 0.157 Eastem Europe 0.21 0.20 0.19 0.19 0.00Venezuela 3.22 2.98 2.93 0.09 2.720 0.125 Lain Amerca 3.25 3.43 3.86 3.90 0.04Total Crude 27.28 27.40 27.73 0.51 22.976 1.716 Middle East 1.93 1.89 1.87 1.89 0.02Excluding Iraq 26.06 24.99 25.20 0.51 22.976 1.716 Processing gain 1.52 1.57 1.66 1.69 0.03NGLs 2.83 2.88 2.90 Total non-OPEC 43.57 44.39 44.64 44.64 0.00Total OPEC 30.12 30.29 30.63 Note: Includes natural gas liquids (NGLs), unconventonal,*Quota includes share of Neutral Zone producton. and other supply sources.Source: IEA and OPECNA. Source: IEA
Worldc Petroleum Demand and Supply(Millions of barrels per day)
1995 1996 1997 1098 2098 3098 4Q98 1998 1Q99 2Q99 3099 4Q99 1999Demand
OECD 44.9 46.0 46.7 47.2 45.3 46.6 47.9 46.8 48.0 46.0 47.1 48.6 47.4FSU 4.8 4.4 4.3 4.6 4.2 4.1 4.1 4.3 4.1 4.1 4.0 4.1 4.1Other 20.2 21.3 22.4 22.9 22.9 22.7 22.8 22.7 22.8 23.1 23.1 23.5 23.1Total 69.9 71.7 73.4 74.7 72.4 73.4 74.8 73.8 74.9 73.2 74.2 76.2 74.6
SupplyOECD 21.1 21.7 22.1 22.6 22.0 21.3 21.6 21.9 21.6 21.4 21.6 22.3 21.7FSU 7.1 7.1 7.2 7.3 7.2 7.2 7.3 7.3 7.3 7.2 7.1 7.0 7.1Other* 14.3 14.8 15.1 15.4 15.4 15.4 15.7 15.4 15.7 15.6 15.7 15.7 15.8OPEC** 27.7 28.5 30.0 31.3 31.0 30.2 30.3 30.7 30.6 29.0 29.0 29.0 29.4Total 70.1 72.0 74.3 76.5 75.6 74.1 74.9 75.3 75.3 73.2 73.4 74.0 74.0
Stock changeOECD -0.3 0.0 0.3 -0.2 1.7 0.5 -0.7 0.3Other/misc.** 0.5 0.2 0.6 2.1 1.5 0.2 0.8 1.1Total 0.2 0.3 0.9 1.8 3.2 0.6 0.1 1.4 0.4 0.0 -0.8 -2.2 -0.6
*Includes processing gains (1.6 mb/d in 1998 and 1.7 mb/d in 1999). **lncludes NGLs (2.8 mb/d in 1998 and 2.9 mb/d in 1999).***lncludes floafing storage, oil in transit, and miscellaneous to balance.Note: Includes natural gas liquids (NGLs), nonconventonal, and other supply sources.Source: ItA data and estimates, and World bank torecasts.
Global SummaryActual -Annual Growth Rate (%O)-
World Balance (mb/d) 1970 1980 1990 1996 1997 1998 1970-80 1980-90 1990-98Producton 48.5 63.9 66.9 72.0 74.3 75.3 2.9 1.0 1.6Consumpton 46.7 62.7 66.3 71.7 73.4 73.8 3.1 0.9 1.5Stock Change and Misc. 1.8 1.2 0.6 0.3 0.9 1.4
Actual ForecastPrices ($1bbl) 1995 1996 1997 1998 1999 2000 2001 2005 2010
Current 17.17 20.42 19.17 13.07 14.50 16.50 17.00 18.00 19.00Constant 1990 14.41 17.88 17.69 12.54 13.83 15.49 15.58 14.93 13.93
Source: BP and lEA, and World Bank forecasts.
april 1999 19

AGRICULTURE
Cocoa 180 Monthly Prices (,/kg)
Weakness continues in the cocoa market with Indicator
prices reaching a low of 131¢/kg in March. 165 -
Unless demand recovers, prices will remain 150 - LIFFE
weak for the rest of 1999 and possibly into Futures*
2000. Cote d'Ivoire's cocoa sector is expected 135 -
to be fully liberalized by the end of 1999.120 - .. ... . .... ....
Cocoa prices averaged 139¢/kg this quarter, Miar-96 Mar-97 Mar-98 Mar-99 MIar-00down more than 12% from last quarter's average of * Futures purces are end-March expressed in ¢/kg.
159¢/kg, and 17% lower than last year's first quarter World Balance (million tons)average. The bearish mood on prices was evident in 3 W0futures. In London, the second position fell to a lowof £821/ton on March 11, the lowest level since Sep- 2.5tember 1993. New York futures also reached a low of Production
$1,200/ton, the lowest level since May 1994. 2.0 -According to the most recent estimates by the Grindings
International Cocoa Organization (ICCO), the current 1.5
season's crop is expected to produce 2.71 million tons,up 1% from 2.68 million tons in 1997/98 (October to 1.0 - i
September). Following a late start, C6te d'Ivoire, the 1970 1975 1980 1985 1990 1995
world's dominant producer, is expected to produce Source: ICCO
1.10 million tons, slightly down from last season's 1.11 Ending Stocks (million tons)million tons. Ghana's output is also expected to be 40 2.0thousand tons less than last season's 409 million tons. WorldSubstantial recovery is anticipated in Ecuador, where 1.5 -
70 thousand tons (from last season's 3 5 thousand tons)is expected. Indonesia will reach 350 thousand tons 1.0(from 325 thousand tons last season), while Malaysiais expected to reach 85 thousand tons (up from 70 0.5thousand tons last season). ICCO
ICCO also estimates grindings in 1998/99 to be 0.0 -2.80 million tons. Substantial reductions are expected 1970 1975 1980 1985 1990 1995in Russia and Eastern Europe, down 27% and 17%, Source: ICCO
respectively. C6te d'Ivoire is expected to increase Annual Prices (OIkg)grindings (from 205,000 to 240,000). Western Euro- 800 -
pean grindings are expected to remain at their 1997/ 'Forecast98 levels. 600 Constant
Little growth in consumption is expected to take (1990)place in OECD countries where the most cocoa is con- 400
sumed. On the other hand, recent liberalization trends- which in most cases imply that producers will get a 200 -
much higher share ofthe f.o.b. price - may induce some Current
supply response. Thus, prices are not expected to re- 0oI - E
cover in the near-term. Instead, they are expected to 1970 1975 1980 1985 1990 1995 2000 2005 2010
fluctuate around 135¢/kg during 1999 while it will take Source: ICCO and World Bank forecasts.
at least two years before they return to 1998 levels.
20 GLOBAL COMMODITY MARKETS

BEVERAGES COCOA
Other Developments* Bloomberg reported that Sifca, C6te d'Ivoire's larg- Ghana Cocoa Board has expressed a commitment
est cocoa exporter, will merge with a local competi- that Ghanaian farmers will receive at least 60% oftor, Jean Abile Gal. The new company is expected to the world price by 2002. At that point, the market ishandle one-third of the country's cocoa exports and a expected to be liberalized.quarter of its coffee exports. Currently there are 62 * C6te d'Ivoire's liberalization process continues asregistered coffee and cocoa exporters in C6te d'Ivoire. planned. Caistab, the parastatal which handles mar-Sifca processes about 250,000 tons of cocoa per year. keting and trade of cocoa, has been liquidated and
* Cocoa growers of C6te d'Ivoire and Ghana are still its workforce has been reduced to 600 employeesreceiving the lowest share of f.o.b. prices compared (from 1,050), with a further reduction to 150.to their Brazilian and Malaysian counterparts. How- Caistab's debt is now about 21 billion CFA (aboutever, the gap has narrowed in recent months, and is 3 5 million dollars). The government of C6te d'Ivoireexpected to be eliminated for C6te d'Ivoire after lib- will allow donors to pay off all of this debt by Octo-eralization is complete. On the other hand, the ber 1, 1999.
Production and Grindings Trade1995196 1996/97 1997/98 1998/99 1995/96 1996/97 1997/98 1998/99
Gross Production (000 tons) Exports (000 tons)Cote d'lvoire 1,200 1,108 1,113 1,100 Cote d'lvoire 1,038 928 931 966Ghana 404 323 409 370 Ghana 331 267 336 311Indonesia 285 325 325 350 Indonesia 224 264 148 212Nigeria 158 160 165 180 Nigeria 147 137 141 142Brazil 231 185 170 160 Cameroon 93 95 86 91Cameroon 135 126 127 130 World 2,116 1,942 1,912 1,990Malaysia 115 100 70 85 Imports (000 tons)Ecuador 103 103 35 70 US 445 353 402 400Dominican R. 55 52 58 48 Netherlands 405 464 300 389Colombia 50 50 45 46 Germany 299 327 302 309World 2,916 2,711 2,683 2,707 UK 248 176 207 210
Grindings (000 tons) France 117 111 100 110Netherlands 385 402 425 435 Singapore 88 92 85 89US 342 394 399 395 Russian Fed. 75 85 83 81C6te dIlvoire 140 160 205 240 Italy 71 71 73 72Germany 266 240 226 205 Belgium 45 54 66 55Brazil 205 180 185 185 Spain 50 49 66 55UK 191 172 174 170 Estonia 5 65 81 50France 113 106 100 107 Japan 49 54 47 50Malaysia 95 95 100 100 Canada 39 34 45 39World 2,713 2,751 2,791 2,800 World 2,191 2,225 2,178 2,198
Source: ICCO Source: ICCO and World Bank.
Global SummaryActual - Est.- -Annual Growth Rate f%J -
World Balance (000 tons) 1970/71 1980/81 1990/91 1996/97 1997/98 1998/99 1970-80 1980-90 1990-97Production 1,554 1,695 2,506 2,711 2,683 2,707 0.9 3.9 0.6Grindings 1,418 1,556 2,335 2,751 2,791 2,800 0.9 4.1 1.5Exports 1,186 1,126 1,733 1,942 1,912 1,990 -0.5 4.3 1.1Ending Stocks 497 675 1,791 1,399 1,210 1,090 3.1 9.8 -4.0
Actual ForecastPrices (¢/kg) 1995 1996 1997 1998 1999 2000 2001 2005 2010
Current 143.2 145.6 161.9 167.6 135.0 145.0 160.0 200.0 210.0Constant 1990 120.2 127.7 149.4 160.9 128.8 136.2 146.6 165.9 154.0
Note: Production refers to gross crop. Quantities refer to cocoa beans. Crop year begins October 1, 2001.Source: ICCO and World Bank.
april 1999 21

AGRICULTURE
Coffee Monthly Prices (,/kg)
Arabica and robusta prices fell 5.7% and3.9%, respectively, this quarter mainly due to 450 -
the Brazilian real's 40% devaluation. Prelimi- CSCE
nary estimates put the global 1999/00 coffee 300 Futures*
crop at 102.5 million bags. Brazil's output is 150expected to be about 24 million bags. Robusta LIFFE
Futures*
The arabica indicator price for January-March Mar-96,Mar-97,Mar-98,Mar,99 ,Mar-00averaged 238¢/kg, down from 252¢/kg in the previ- * Futures prices are end-March expressed in i/kg.
ous quarter, and 37% lower than last year's first quar- Source: ICO, LIFFE, and CSCE.ter average. Robusta prices averaged 172.7¢/kg this 120 World Balance (million tons)quarter, down from 179.7¢/kg in the last quarter of Production
1998. This quarter's news was dominated by Brazil's 100
devaluation of the real in January. The currency wasfloated, resulting in a depreciation of 40% over the 80US dollar.
The depreciation prompted Brazilian exporters 60Eto vigorously increase coffee exports and reap the ben- V
efits of high domestic prices before any currency re-bound. In February, Brazil exported 1.85 million bags, 1970 1975 1980 1985 1990 1995almost twice as much as in the same month in 1998. Source: ICO and USDA.
The Brazilian Association of Coffee Exporters Arabica Annual Prices (p/kg)(Abecafe) said that exports in March are expected to 1,200 -be around 1.7 million bags, compared to 0.73 million Constant Forecast
bags in March 1998. 900 (
Global coffee production in 1998/99 is expectedto reach 106.8 million bags, second only to the 1986/ 60087 crop. Some preliminary estimates released by theAssociation of Coffee Producing Countries (ACPC) 300 -indicate that the 1999/00 crop is going to be around102.5 million bags, 4% lower than the 1998/99 crop. - Current
With global consumption estimated between 98 and 1970 1975 1980 1985 1990 1995 2000 2005 2010
99 million bags, the market is expected to register a Source: ICO and World Bask forecasts.
surplus of 3.5 million bags in the 1999/00 season. Robusta Annual Prices (,/kg)Brazil, the world's dominant producer, is expected to 1,200 -produce between 23.15 and 24.74 million bags next Forecast
season (down from 35.6 million bags in 1998/99). 900India's Coffee Board reported that next season's cropwill be about 4.8 million bags, up from 3.8 million 600 -bags in 1998/99.
With production expected to exceed consump- 300 -tion by an estimated 8 to 9 million bags, prices areunlikely to recover soon. Arabica and robusta prices 0 Iareexpectedto average231¢/kg and l63¢/kgfor 1999. 1970 1975 1980 1985 1990 1995 2000 2005 2010Depending on the actual size of next season's crop, Source: ICO and World Bask forecasts.
some recovery may take place in 2000.
22 GLOBAL COMMODITY MARKETS

BEVERAGES COFFEE
Other Developments* A two-week coffee festival (sponsored by the ICO) The London International Financial and Futures Ex-
took place in China (Beijing and Shanghai) in March change plans to upgrade its coffee contract on Feb-1999. Its purpose was to promote coffee consump- ruary 1, 2000. The new contract will make a dis-tion in China, which has traditionally been a tea tinction between coffee beans with the majority ofmarket. their surface covered in mould and those covered
* After establishing the Coffee Futures Exchange in only partially.Bangalore, India's Coffee Board unveiled plans to * C6te d'Ivoire's coffee sector has been liberalized.expand the domestic market base of coffee with as- Producers are expected to be the main beneficiariessistance from the private sector, according to The of liberalization as they will receive higher prices,Public Ledger. Indian coffee consumption has been from 50% of f.o.b. prior to liberalization to aroundstagnant at 840,000 bags during the last decade. 80% following liberalization.
Production (000 bags) Stocks and Consumption1995/96 1996/97 1997/98 1998199 1995/96 1996/97 1997/98 1998199
Brazil* 16,800 28,000 23,500 35,600 Ending Stocks (000 bags)Colombia* 12,939 10,779 11,932 12,500 Brazil 16,000 14,128 11,278 15,278Indonesia 5,800 7,900 7,200 6,800 Colombia 6,328 4,420 3,929 3,669Vietnam 3,917 5,500 6,667 6,333 Congo, D. R. 239 365 790 765Mexico* 5,400 5,300 4,950 4,950 Costa Rica 1,149 1,200 1,050 760India 3,717 3,417 3,833 3,835 Cote d'lvoire 1,499 2,915 1,885 653C6te d'lvoire 2,900 5,333 4,080 3,750 Cameroon 234 529 570 570Uganda 4,200 4,297 3,000 3,600 Kenya 638 367 592 519Ethiopia* 3,800 3,500 3,500 3,500 Indonesia 851 298 368 370Guatemala* 2,827 4,141 3,982 2,825 World 32,699 28,875 25,054 27,002Honduras* 2,254 2,279 2,980 2,260 Consumption (000 bags)Costa Rica* 2,595 2,376 2,400 2,165 US 17,600 18,490 18,130 18,290Peru* 1,811 1,583 1,780 1,900 Brazil 10,230 10,880 10,880 11,320El Salvador* 2,325 2,498 2,040 1,790 Germany 9,480 9,440 9,260 9,300Venezuela* 1,067 843 981 1,380 Japan 5,750 5,820 5,800 5,710Cameroon 581 1,432 1,417 1,200 France 5,230 5,350 5,290 5,300PNG 1,002 1,089 1,080 1,100 Italy 4,640 4,670 4,650 4,700Congo, D. R. 1,000 950 1,143 1,000 UK 2,380 2,440 2,380 2,419Thailand 1,317 1,403 1,383 1,000 Canada 2,800 2,960 2,920 2,291World 88,749 103,696 97,675 106,800 World 96,300 99,500 99,400 98,000
Source: ICO and USDA. Source: ICO and USDA.
Global SummaryActual -Est. - -Annual Growth Rate (%) -
World Balance (000 bags) 1970/71 1980/81 1990/91 1996/97 1997/98 1998199 1970-80 1980890 1990-98Producton 64,161 86,174 88,749 103,696 97,675 106,800 2.95 0.29 1.48Consumpbon 71,536 79,100 96,300 99,500 99,400 98,000 1.01 1.97 0.14Exports 54,186 60,995 76,163 84,248 77,264 79,771 1.18 2.22 0.37Ending Stocks n.a. 30,979 45,096 28,875 25,054 27,002 na 3.75 -4.10
Actual ForecastArabica Prices (¢/kg) 1995 1996 1997 1998 1999 2000 2001 2005 2010
Current 333.2 269.4 416.8 298.1 231.0 243.0 236.0 254.0 265.0Constant 1990 279.6 236.4 384.6 286.1 220.4 228.2 216.3 210.7 194.3
Robusta Prices (¢/kg)Current 277.1 180.6 173.6 182.3 163.0 172.0 176.0 186.0 192.0Constant 1990 232.4 158.4 160.2 174.9 155.5 161.5 161.3 154.3 140.8
*Indicates that the country is prmarily an arabica producer. One bag equals 60 kg. Quantites refer to country-specific crop years.Source: ICO, USDA, and Word Bank.
april 1999 23

AGRICULTURE
Tea 290 Monthly Prices (,/kg)
Russian imports declined again this quarter,adding further downward pressure on Co- 250 -
lombo and Calcutta auctions, which fell 12% Average
and 14%, respectively. 210 -
The three auction prices averaged 167.3¢/kg dur- 170 -
ing the first quarter, down 6.1% from the previous 1quarter. Colombo auction prices fell almost 12% from ,last quarter, mainly reflecting reduced exports to the Mar-95 Mar-96 Mar-97 Mar-98 Mar-99
FSU. The Calcutta auction price registered a quar- Source: ITC
terly decline of almost 14%. The Mombasa auction's World Balance (million tons)price, on the other hand, increased by 9%. 3.5 -
World tea production in 1998 reached a recordhigh of 2.89 million tons, up 5% from 1997. Produc- 2.8 -
tion in India, Kenya, and Sri Lanka totaled, 860, 280, Production
and 271 thousand tons, respectively, in 1998. These 2.0
figures are 7.3% (India), 33.3% (Kenya) and 3.7% (SriLanka) higher in 1997. 1.3 - - Net Imports
India's 1999 output may decline due to longerthan usual hot and dry weather in Assam and West 0.5 I IBengal. Production in Kenya for the first quarter was 1970 1975 1980 1985 1990 1995
also lower compared to last year following an extended Source: FAO and ITC.
period of dry weather which lasted until February. On UK Ending Stocks (thousand tons)the other hand, output in Sri Lanka for January reached 100 Ea record high of 24.6 thousand tons. I Warehouses
Sri Lanka maintained its position as the world's 75 -largest tea exporter in 1998 with exports totaling 271thousand tons. Kenya, the largest exporter in 1995 and 50
1996, was second, exporting 264 thousand tons. India, 50 salersthe largest producer with a significant domestic mar- 25s-
ket, followed with 205 thousand tons. India's domestic 25
consumption last year was about 650 thousand tons,whereas Sri Lanka's was around 30 thousand tons. 0 -
Demand for Indian tea slowed this quarter as 1970 1975 1980 1985 1990 1995Source: ITC
exports to Poland and the FSU dropped following a Annual Prices (¢/kg)large inventory build-up. Sri Lanka's tea exports in 450January of this year fell about 20% compared to Janu- Forecast
ary 1998 as exports to FSU declined by more than 350 -
20%. Demand for Kenyan tea firmed in March inanticipation of lower supplies. Demand from Paki- 250 -
stan was particularly strong. Demand from other ma-jor buyers of Kenyan tea, such as the UK, Sudan, 150 -Yemen, and Middle Eastern countries also firmed. urrent
We projectthe 3-auction average to fluctuate be- 50 I . Itween 170¢/kg and 180¢/kg forthe remainder of 1999 1970 1975 1980 1985 1990 1995 2000 2005 2010and possibly to drop below the 170-mark next year. Source: ITCandWorldBankforecasts.
Some recovery is expected to take place in 2001.
24 GLOBAL COMMODITY MARKETS

BEVERAGES TEA
Other Developments* The Indian government decided to abolish an 8% an agreement with the Russian Tea and Coffee As-
excise duty on packaged tea and impose an ex- sociation to assist Russian firms with importing In-cise duty of 2 rupees per kilogram on bulk tea in dian tea. Russia currently accounts for 44% or 90February. Following the announcement, shares thousand tons of India's tea exports.of Indian tea companies rose sharply. This deci- * Sri Lanka and India signed a free trade agreementsion, however, is unlikely to benefit tea produc- which promotes greater access to each other's mar-ers who only receive auction prices that are al- kets. The implementation, however, has been de-ready very low. layed due to the difference in views on which items
* The Sri Lankan govemment offered an insurance to exempt, one of which is tea. India, which cur-scheme to local exporters to alleviate cash short- rently imposes a 19% import duty on Sri Lankanages due to delays in payments from Russia, the larg- tea, opposed the tax exemption on tea fearing thatest importer of Sri Lankan tea. Sri Lankan tea, which is less expensive, may domi-
* In December 1998, the Tea Board of India signed nate the domestic tea industry.
Production and Crop Areas Trade1995 1996 1997 1998 1994 1995 1996 1997
Production (000 tons) Exports (000 tons)India 753.9 780.0 810.0 870.0 Sri Lanka 224.2 235.0 233.6 257.3China 609.4 616.5 636.1 648.1 China 179.7 166.6 169.7 202.5Kenya 244.5 257.2 220.7 294.0 India 149.3 163.7 160.0 200.7Sri Lanka 246.0 258.4 270.9 281.0 Kenya 183.1 237.5 244.2 194.0Indonesia 154.0 169.4 150.8 152.1 Indonesia 84.9 79.2 101.5 66.8Turkey 102.7 114.5 120.8 120.8 Argentina 43.2 41.1 41.3 56.4Japan 84.8 88.6 91.2 91.2 Malawi 38.7 32.6 36.7 49.2Iran, Is. Rep. 54.4 62.1 62.1 62.1 Bangladesh 23.6 25.4 26.2 25.2Bangladesh 52.0 47.7 53.3 57.0 Tanzania 18.6 20.5 18.4 19.0Argentina 47.1 47.1 48.5 48.5 World 1,032.6 1,080.1 1,155.3 1,155.9Malawi 34.2 37.2 43.9 45.0 Net Imports (000 tons)World 2,616.3 2,712.3 2,757.6 2,893.4 Russian Fed. 130.6 161.6 160.1 197.3
Crop Areas (000 hectares) UK 148.4 136.0 148.5 150.5China 888.1 880.0 900.0 900.0 Pakistan 106.5 115.7 110.7 86.9India 425.0 425.0 440.0 440.0 US 96.1 83.3 89.2 81.2Sri Lanka 189.0 187.6 187.6 187.6 Egypt 56.9 80.0 65.0 77.9Kenya 111.3 113.7 113.9 115.0 Japan 41.0 45.3 48.4 52.1Indonesia 113.4 108.5 108.1 109.7 Morroco 34.0 37.6 28.4 35.0World 2,306.3 2,291.6 2,332.4 2,338.6 World 1,042.9 1,077.1 1,121.8 1,152.4
Source: FAO and World Bank. Source: ITC and World Bank.
Global SummaryActual -Est.- -Annual Growth Rate (%)-
World Balance (000 tons) 1970 1980 1990 1996 1997 1998 1970-80 1980-90 1990-97Production 1.3 1.9 2.5 2.7 2.8 2.9 4.2 3.2 1.3Net Imports 0.6 0.9 1.1 1.1 1.1 1.1 3.0 2.9 -0.1Ending Stocks 113.9 91.3 48.4 39.2 37.2 38.1 -1.2 -4.1 -2.9
Crop Area (000 hectare) 1,668.3 2,368.5 2,263.0 2,291.6 2,332.4 2,338.6 4.0 -0.9 0.3Yields(hg/hectare) 7,713 7,995 11,161 11,836 11,823 12,146 0.2 4.3 1.0
Actual ForecastPrices (¢/kg) 1995 1996 1997 1998 1999 2000 2001 2005 2010
Current 148.9 166.1 206.0 204.6 177.0 168.0 171.4 179.0 198.0Constant 1990 124.9 145.7 190.1 196.4 168.9 157.8 157.1 148.5 145.2
Note: Ending stocks refer to stocks in the UK.Source: ITC, FAO, and World Bank forecasts.
april 1999 25

AGRICULTURE
Fats and Oils Monthly Prices ($/ton)
The World Bank's oils index declined by 5.1 We0ghted
9. 7%, and 9.6% in the first three months of 660 - iced
1999. With continuedproduction increases, itis doubtful whether the quarterly average of 590 -
$562/ton will be sustained throughout the 520 -
remainder of 1999.
4 50 . .. . ,.. .. . . |. . .. . . .... .,.. .. ,,.,. , .... .... ..The World Bank's oil weighted average price Mar-95 Mar-96 Mar-97 MNr-98 Mar-99
dropped 15% this quarter to $562/ton from $664/ton Source: World Bank
last quarter. This is 13% below last year's first quar- World Balance (million tons)ter average. The global output of 17 fats and oils is 120 -
expected to increase 2.61 million tons this season (Oc-tober to September), for a record of 104.49 million 90 -tons. The increase is slightly below the preceding three Production
seasons' average of 2.9 million tons. Most of the in- 60
crease is expected to come from rapeseed and sun-flower oils (6.6%), soybean oil (4.2%), and palm oil 30 -(2.1%). Lauric oils production will fall 10.8%. Exports
Exports are expected to be 33.0 million tons in 0 - i1998/99, down from 33.2 million tons in 1997/98. The 1970 1975 1980 1985 1990 1995
bulk of trade will be comprised of palm and soybean Source: Oil World
oils (35% and 23%) followed by sunflower and rape- Ending Stocks (million tons)seed oils (10% and 7%). Ending stocks are expected 13
to drop to 11.24 million tons this season from 11.61 Worldmillion tons in the last season, reducing the stock-to- 10use ratio from 11.3% to 10.7%, the second lowest inthe last three decades. 7
The first estimates for the 1999/00 season forsome oilseeds have already been reported in Oil World. 4
The first major oilseed crops to be harvested will be us and EU
rapeseed/canola. Current prospects indicate an in- 1 .crease of 3.5 million tons; the global 1998/99 esti- 1970 1975 1980 1985 1990 1995
Source: Oil Worldmate is expected to be 37.08 million tons. China,Canada, and India are the world's leading canola pro- Annual Prices ($/ton)ducers with shares of 22.3%, 20.5%, and 16.3%, re- 2,000 - Constant
spectively. On the other hand, the US Department of Cs(1990) ForecastAgriculture noted that American farmers are expected 1,500 -to plant an estimated 73.1 million acres of soybeansthis year, up from last year's 72.4 million acres. 1,000 -
Despite the low stock-to-use ratio, the expectedexpansion of palm oil production -along with goodpros- 500pects for other maj or oilseeds - will put some more pres- Curent
sure on prices. The final direction will depend on when 0 - land how much demand picks up. We expect the oil in- 1970 1975 1980 1985 1990 1995 2000 2005 2010
dex to be around of $520/ton, an average that is likely to Source: WorldBank
be maintained for the next two to three seasons.
26 GLOBAL COMMODITY MARKETS

FATS, OILS, AND OILSEEDS FATS AND OILS
Other Developments* Refined deodorized bleached (RDB) palm olein and 1998/99 production shares are: Argentina (25.1%),
palm oil are to be included in the list of goods im- Russia (11.5%), the US (9.1%), andUkraine (8.6%).ported by the private sector, following the new im- * Up to one million hectares of cropped area haveport policy change announced on March 31 by the been damaged in Argentina due to severe floods ingovernment of India, according to Oil World. How- recent weeks. While all oilseeds will be affected,ever, the government increased the import duty from sunflowerseeds may be the worst hit.16.5% to 38.5% for RDB palm oil. The 16.5% duty * It appears that a compromise forreforming the Com-is still valid for other vegetable oils. The higher mon Agricultural Policy (CAP) has been reachedimport tariff on RDB palm oil was introduced to following the EU's proposal, AGENDA 2000. Onprotect local manufacturers. Analysts believe, how- March 26, the Commission agreed to reduce areaever, that granting import licenses to the private payments for oilseeds from the present level of 94.24sector may not be of much benefit. euro/ton to 63 euro/ton within a 3-year period. The
* The government of Ukraine is considering impos- reduction, which is not crop-specific, will take placeing export restrictions on sunflowerseed. Ukraine in three steps: 12.5% in 2000/01, 9.37% in 2001/is the fourth largest sunflowerseed producer. The 02, and 9.37% in 2002/03.
Production, Exports, and Stocks of the 17 Major Fats and Oils- Production (million tons)- -Exports (million tons) - - Ending Stocks (million tons)-
Fats and Oils 1996197 1997/98 1998/99 1996/97 1997/98 1998199 1996/97 1997/98 1998/99Soybean 21.03 23.16 24.13 6.68 7.75 7.62 2.44 2.40 2.40Palm 17.49 16.96 17.32 11.87 11.66 11.54 3.01 2.43 2.41Rapeseed 11.48 12.21 13.08 1.79 2.08 2.25 1.08 1.13 1.22Sunflower 9.14 8.66 9.17 3.24 3.00 3.26 0.96 0.86 0.89Tallow 7.41 7.68 7.77 1.96 2.23 2.32 0.53 0.56 0.54Lard 5.97 6.20 6.37 0.15 0.17 0.18 0.39 0.42 0.43Butter 5.70 5.73 5.80 0.63 0.57 0.58 0.70 0.67 0.66Groundnut 4.51 4.38 4.81 0.25 0.26 0.28 0.47 0.41 0.41Cotton 4.03 4.05 3.80 0.22 0.23 0.21 0.31 0.29 0.27Coconut 3.15 3.45 2.81 1.75 2.12 1.39 0.38 0.60 0.37Olive 2.85 2.59 2.28 0.46 0.47 0.50 0.90 1.07 0.86Palm Kernel 2.18 2.18 2.22 1.04 1.05 1.16 0.26 0.29 0.25Com 1.88 1.96 2.01 0.65 0.78 0.81 0.13 0.14 0.14Fish 1.27 0.83 0.99 0.77 0.46 0.50 0.29 0.16 0.18Linseed 0.65 0.68 0.73 0.14 0.12 0.14 0.08 0.10 0.10Sesame 0.68 0.73 0.71 0.02 0.02 0.02 0.05 0.05 0.04Castor 0.45 0.46 0.50 0.23 0.26 0.27 0.06 0.05 0.07
Total 99.87 101.88 104.49 31.85 33.20 33.00 12.03 11.61 11.24Source: Oil World
Global SummaryActual -Est- -Annual Growth Rate (%o)-
World Balance (mil. tons) 1970/71 1980/81 1990/91 1996197 1997/98 1998/99 1970-80 1980-90 1990-98Producfion 39.78 58.09 80.84 99.87 101.88 104.49 3.8 3.3 2.1Consumphon 39.82 56.80 80.77 99.76 102.38 105.00 3.6 3.5 2.1Exports 8.83 17.76 26.89 31.85 33.20 33.00 7.0 4.1 1.6Ending Stocks 5.18 9.25 12.15 12.03 11.61 11.24 5.8 2.7 -0.6
Actual ForecastWeighted Price ($/ton) 1995 1996 1997 1998 1999 2000 2001 2005 2010
Current 638.8 569.7 574.0 658.8 521.0 519.0 522.0 502.4 520.2Constant 1990 535.9 498.9 529.6 632.3 497.0 487.3 478.3 416.6 381.5
Note: Crop year begins October 1. The price is a trade weighted average of soybean, palm, coconut, and groundnut oils.Source: Oil World and World Bank.
april 1999 27

AGRICULTURE
Coconut Oil Monthly Prices ($/ton)
Despite weather-related crop damage in the c.i.f
Philippines, the market showed signs of weak- R00 - otterdam
ness. Processors have increased use ofpalmkernel oil, which is an effective replacement for 700 -
soap and confection manufacturers. 600 -
Coconut oil prices averaged $736/ton in the first 500 -.. .... .. .. l ..quarter, a small reduction from last quarter's $740/ton, Mar-95 Mar-96 Mar-97 Mar-98 Mar-99
up 30% from the same quarter of last year. The respec- Source: WorldBank
tive monthly averages were: $763/ton for January, $745/ World Balance (million tons)ton for February, and $700/ton for March, suggesting 3.5 -that coconut oil prices have started to weaken. Pricesfor palm kernel oil, a close substitute for coconut oil, 2.8
averaged $705/ton this quarter, down 5% from last Productionquarter's $740/ton, but 17% higher than the fourth quar- 2.0
ter of last year. In 1998/99, coconut and palm kernel E/o\oils are expected to account for about 2.70% and 2.12% 1.3
of world production of the 17 major fats and oils, re-spectively. Half of global production of both oils is 0.5 I ,
expected to be internationally traded. 1970 1975 1980 1985 1990 1995
According to the most recent Oil World estimates, Source: Oil World
global production of coconut oil is expected to be about2.81 million tons in the 1998/99 season (October to 0.8 Endg Stocks (mllon tons)September), down from last season's 3.44 million tons. WorldDelayed El Nifno effects, which particularly affected 0.6the Philippines, are responsible for the shortfall in co-pra production. Global palm kernel oil production is 0.4
expected to register a small increase, from 2.18 million ustons in 1997/98 to 2.21 million tons in 1998/99. 0.2
The Philippines, the world's dominant coconutoil producer, is expected to produce 1.02 million tons, 0.0down from 1.63 million tons in 1997/98, a reduction 1970 1975 1980 1985 1990 1995
of almost 40%. Indonesia's output is expected to reg- Source: Ol Worldister a small decline (from 659 thousand tons last sea- Annual Prices ($/ton)son to 626 thousand tons in the current season). Out- 2,500 -put from India, Mexico, and Vietnam will remain close 'Forecastto the 1997/98 levels. Current season's exports are 1,900 - Constant
also set to decline to 1.39 million tons, from 2.13 mil-lion tons in 1997/98. 1,300 -
Malaysia, the world's dominant palm kernel oil pro-ducer, is expected to produce 1.13 million tons in 1998/ 700t-99 down from 1.23 million tons in 1997/98. Indonesia'soutput, the second largest, is expected to reach 582 thou- -_y_Currentsand tons this season, up from 552 thousand tons last 1970 1975 1980 1985 1990 1995 2000 2005 2010season. Exports are also expected to increase from 1.04 Source: World Bank
to 1.12 million tons.
28 GLOBAL COMMODITY MARKETS

FATS, OILS, AND OILSEEDS COCONUT OIL
Other Developments* Adverse weather conditions (lagged El Nino effects likely.
and the two typhoons that hit the Philippines last Oc- * The bullish mood on coconut prices appears to havetober) along with the economic crisis have forced two eased. Given the close substitutability between co-investors, Cargill and San Miguel, to shut down their conut oil and palm kernel oil and the projected in-coconut oil processing plants on Mindanao Island in crease in palm production, prices are expected tothe Philippines, according to The Public Ledger. Their maintain an average of $700/ton for the rest of calen-combined daily output was 1,200 tons. Many opera- dar 1999 and then return to the mid-$600s level bytors expect them to return soon, but that seems un- the year 2000, which is closer to the 1998 average.
Coconut Oil Palm Kernel Oil1995/96 1996/97 1997/98 1998/99 1995/96 1996/97 1997/98 1998/99
Production (000 tons) Production (000 tons)Philippines 1,772 1,257 1,628 1,019 Malaysia 1,088 1,157 1,127 1,126Indonesia 675 756 652 610 Indonesia 508 506 553 567India 380 419 434 431 Nigera 169 181 181 185Mexico 110 134 128 126 Thailand 34 36 35 36Vietnam 107 57 69 86 Colombia 39 33 33 34World 2,996 3,145 3,446 2,813 World 2,071 2,167 2,184 2,207
Ending Stocks (000 tons) Ending Stocks (000 tons)US 38 68 178 60 Malaysia 119 144 149 120Philippines 89 87 32 59 Indonesia 50 25 50 45Indonesia 50 35 48 48 US 9 23 29 25India 26 31 32 35 EU 21 15 17 15World 346 381 613 365 World 228 245 287 238
Exports (000 tons) Exports (000 tons)Philippines 899 950 1,386 704 Malaysia 437 483 476 560Indonesia 398 603 511 477 Indonesia 352 435 449 469World 1,358 1,753 2,113 1,387 World 862 1,035 1,036 1,132
Imports (000 tons) Imports (000 tons)EU 594 639 755 686 EU 362 356 346 381US 469 539 653 445 US 118 178 163 200China 37 42 31 45 Japan 55 54 53 54Korea, D.R. 42 44 40 32 Brazil 33 51 45 46World 1,409 1,712 2,123 1,423 World 855 1,055 1,030 1,103
Source: Oil World Source: Oil World
Global SummaryActual - Est- -Annual Growth Rate (%o)-
Coconut Oil (000 tons) 1970/71 1980/81 1990/91 1996197 1997/98 1998/99 1970-80 1980-90 1990-98Production 2,020 2,842 3,377 3,219 3,446 2,813 3.4 1.7 -1.5Consumpbon 2,021 2,688 3,169 3,088 3,223 3,098 2.9 1.6 -0.2Exports 608 1,215 1,701 1,753 2,113 1,387 6.9 3.4 -1.6Ending Stocks 292 509 641 381 613 365 5.6 2.3 -4.5
Palm Kernel Oil (000 tons)Producton 378 570 1,449 2,167 2,184 2,207 1.8 4.1 2.2Consumption 387 528 1,375 2,162 2,136 2,227 1.3 4.2 2.4Exports 160 402 907 1,035 1,036 1,132 4.0 3.5 0.7Ending Stocks 45 134 256 245 287 238 4.7 2.8 0.6
Actual ForecastPrices -Coconut ($/ton) 1995 1996 1997 1998 1999 2000 2001 2005 2010
Current 669.7 751.6 656.8 657.9 700.0 650.0 645.0 620.0 650.0Constant 1990 561.7 659.3 606.1 631.5 667.8 610.3 591.0 514.2 476.7
Note: Crop year begins October 1.Source: Oil World and Word Bank.
april 1999 29

AGRICULTURE
Palm Oil 750 Monthly Prices ($/ton)
Prices fell quickly, following Indonesia's N. Ere
decision to redutce its palm oil export tax from 650 -
60% to 40%. Goodproduction prospects are A -
likely to keep prices below their 1998 levels. 550 KLCE
450 Futures *Palm oil prices averaged $563.3/ton from Janu- 4
ary to March 1999, 17% lower than the October toDecember average, and more than 13% lower than Mar-96 Mar-97 Mar-98 Mar-99 Mar-00
the same quarter a year ago. Palm oil is expected to *Futures prices are end-March expressed in /ton.
account for 16.6% of global production and 35% of Source: World Bank and KLCE.
global trade of the 17 major fats and oils. Further- 20 World Balance (million tons)more, 70% will be internationally traded, making itthe most highly traded oil. Palm oil is a close substitute 15
to soybean oil, which accounts for 23% of global fats and Production
oils production. 10The most recent estimates by Oil World indicate E
that global palm oil production in 1998/99 (October- 5 Exports
September) will be 17.32 million tons, 363,000 higherthan last season. Production in Malaysia, the world's o .dominant producer, is expected to reach 8.52 million 1970 1975 1980 1985 1990 1995
tons, only 11,000 tons more than last season. Indone- Source: Oil World
sia, the world's second largest producer, is expected toproduce 5.35 million tons, up from 5.09 million tons in 3.0 E1997/98. Anumber of smaller producers (C6te d'Ivoire, World
Ecuador, Nigeria, PNCG and Thailand) are expected to 2.3
register small increases.Palm oil exports are expected to be 11.71 mil- 1.5
lion tons, down from last season's 11.66 million tons.Malaysia will export 7.53 million tons (equivalent to 0.8
65% of world trade) while Indonesia is expected to Indonesia
export 2.63 million tons (equivalent to 23% of world o.otrade). 1970 1975 1980 1985 1990 1995
The EU, the dominant palm oil importer, is ex- Source: Oil World
pected to import 2.04 million tons, up from last Annual Prices ($/ton)season's 2.02 million tons. China, the second largest 1,700 -
importer, is expected to import 1.45 million tons, fol- Forecast
lowed by India and Pakistan, which are expected to 1,300 - _ Constant
import 1.70 and 1.08 million tons, respectively. End- (1990)ing stocks are expected to remain at their 1997/98 lev- 900
els at around 2.41 million tons.Following Indonesia's reduction of its export tax
and the favorable production prospects, prices are un- 500
likely to reach the levels sustained throughout 1998. CurrentPrices are expected to average $500/ton for the rest of 100 - l 1999 and to remain at this level for the next two to 1970 1975 1980 1985 1990 1995 2000 2005 2010
Source: World Bankthree seasons.
30 GLOBAL COMMODITY MARKETS

FATS, OILS, AND OILSEEDS PALM OIL
Other Developments* Indonesia reduced its export tax on crude palm oil investor is the Netherlands' Rabobank.
from 60% to 40% and on refined deodorized * As part of a general program to coordinate activitiesbleached (RDB) palm oil and palm olein from 55% across agricultural commodity sub-sectors, Malay-to 32% in late January. The tax on crude palm ker- sia began merging its palm oil and rubber growernel oil was reduced from 50% to 30% and for RDB groups. In addition to efficiency gains, the inten-palm kernel oil from 45% to 20%. Analysts, how- tion is to curtail growth in palm oil production whileever, contended that the tax cut is not large enough at the same time increase rubber production andand they question whether the new tax structure will timver (from rubber trees).bring order to the Indonesian palm oil market. Since * In addition to the export tax on palm oil, which ef-the introduction of the tax, it has been reported that fectively priced Indonesia out of the world market,smuggling is pervasive. Palm oil prices did react to domestic violence appears to have taken a toll onnews of the reduction of export tax. the domestic trade. Numerous reports have indi-
* The Public Ledger reported that the Commonwealth cated that palm oil traders are caught between fightsDevelopment Corporation (CDC) has invested $14.4 among different groups. On several occasions trad-million in a new $24 million palm oil development ers have been subject to attacks. There is also con-plant in Eastern Indonesia. The other principal co- cem that the clashes will spread.
Production and Stocks Trade1995/96 1996197 1997/98 1998/99 1995/96 1996/97 1997/98 1998/99
Production (000 tons) Exports (000 tons)Malaysia 8,264 9,000 8,509 8,520 Malaysia 6,896 7,794 7,847 7,525Indonesia 4,405 5,078 5,085 5,351 Indonesia 1,972 2,419 2,416 2,630Nigera 622 678 688 705 PNG 229 281 228 237Colombia 391 440 437 430 Singapore 308 286 253 220Thailand 366 386 375 393 World 10,463 11,874 11,661 11,540C6te d' Ivoire 277 250 251 265 Imports (000 tons)PNG 228 276 232 247 EU 1,838 1,957 2,023 2,037Ecuador 182 201 203 215 India 1,213 1,395 1,684 1,700World 15,871 17,490 16,961 17,324 China 1,178 1,851 1,490 1,450
Ending Stocks (000 tons) Pakistan 1,166 1,020 1,210 1,075Malaysia 894 907 719 790 Singapore 456 402 351 365Indonesia 565 605 540 530 Japan 348 382 355 360India 190 285 200 165 Myanmar 235 290 244 270China 220 280 140 115 Egypt 387 374 374 250World 2,797 3,006 2,426 2,412 World 10,462 11,729 11,818 11,521
Source: Oil World Source: Oil World
Global SummaryActual -EsL- -Annual Growth Rate (lo) -
World Balance (000 tons) 1970/71 1980/81 1990/91 1996197 1997/98 1998/99 1970-80 1980-90 1990-97ProducUon 1,742 4,587 10,976 17,490 16,961 17,324 9.7 8.7 3.7Consumption 1,685 4,822 11,041 17,305 17,699 17,320 10.5 8.3 3.6Exports 920 3,793 8,639 11,874 11,661 11,540 14.2 8.2 2.3Ending Stocks 247 992 2,551 3,006 2,426 2,412 13.9 9.4 -0.4
Actual ForecastPrices ($/ton) 1995 1996 1997 1998 1999 2000 2001 2005 2010
Current 628.0 530.9 545.8 671.1 500.0 500.0 500.0 450.0 460.0Constant 1990 526.8 465.8 503.6 644.1 477.0 469.5 458.2 373.2 337.3
Note: Crop year begins October 1.Source: Oil World and Wodd Bank.
april 1999 31

AGRICULTURE
Soybean Oil Monthly Prices ($/ton)700 -
A large soybean crop, the Brazilian devaluation, f.b
andplentiful supplies of competing oils put 620 -pressure on soybean oilprices. Prices are notexpected to rise unless demand picks up. 540 -CBOT
Futures*
First quarter soybean prices averaged $492/ton,almost 18% lower than last quarter's average of $606/ton, and 22% lower than the same quarter of 1997/98. Mar- - . . Mar..0During the 1998/99 season, soybean oil is expected to *Futures prices are end-March expressed in $/ton.
account for more than 23% of global fats and oils out- Source: World Bank and CBOT.
put. Close to one-third is internationally traded, with World Balance (million tons)Argentina, Brazil, and the US accounting for 36%, 26
18%, and 16% of world exports, and China account- X
ing for more than 22% of world imports. 20Production
The latest Oil World estimates indicate that glo-bal soybean oil supplies for the 1998/99 season (Oc- 13 -tober to September) will be 24.3 million tons, up 4% Exportsfrom the 23.16 million tons in 1997/98. The US, the 7
world's dominant producer is expected to reach 8.15million tons, down from the 1997/98 record output of 0 .8.23 million tons. Because of improved weather con- 1970 1975 1980 1985 1990 1995
ditions in Brazil and Argentina, outputs from these Source: Oil World
countries are expected to be 5.6% and 27.5% higher Ending Stocks (million tons)than last season. Substantial increase is also expected 2.8
in India, from 787 thousand tons last season to 890 Worldthousand tons this season. 2.1
Exports are expected to reach 7.62 million tons,down from 7.75 million tons last season. Responding 1.4to a good soybean crop, Argentina, the world's domi- usnant soybean oil exporter is expected to increase its 0.7
exports by 29.6%. Brazil is also expected to increaseits exports by 14%, mainly as a response to higher do- 1970 1975 1980 1985 1990 1995
mestic prices received by exporters due to the devalu- Source: Oil World
ation. China, the world's dominant importer, is ex- Annual Prices ($/ton)pected to reduce its imports by almost 11% this sea- 2,100son. All other significant importers (Bangladesh, In- Forecastdia, the Islamic Republic of Iran, Pakistan, and Ven- 1,600 - ostn
ezuela) are expected to increase their imports. ConstantGiven plentiful supplies in both hemispheres, 1,100 - 1990
competitive Brazilian exports, good prospects for otheroilseed crops, and recovery in palm oil production, 600 -
prices are expected to come under more pressure. They Curent
are expected to average $480/ton during 1999 and, 100 - i l ldepending on demand, they may go up to $500/ton by 1970 1975 1980 1985 1990 1995 2000 2005 2010
year 2001, but they will not reach the highs experi- Source: World Bank
enced during 1998.
32 GLOBAL COMMODITY MARKETS

FATS, OILS, AND OILSEEDS SOYBEAN OIL
Other Developments* Following the real's devaluation in January, Brazil- March totaled 5.4 million tons, up from the 2.0 mil-
ian soybean and soybean products exports have lion tons of the same period of a year ago. Registra-surged. The Foreign Agricultural Service of the US tions of soybean meal and soybean oil were 19% andDepartment of Agriculture estimates that export reg- 31% higher for the period. The increased export ac-istrations for soybeans from February through mid- tivity is expected to last throughout the season.
Soybean Oil Soybean Meal1995196 1996/97 1997/98 1998/99 1995/96 1996/97 1997/98 1998/99
Production (000 tons) Production (000 tons)US 6,913 7,145 8,227 8,154 US 29,500 31,036 34,606 34,026Brazil 4,103 3,760 3,774 3,984 Brazil 16,976 15,640 15,582 16,472Argentna 1,828 1,966 2,281 2,909 Argentina 8,309 8,867 10,353 13,184EU 2,521 2,730 2,929 2,866 EU 11,075 11,998 12,795 12,569China 1,070 1,410 1,700 1,735 China 5,250 7,069 8,480 8,642India 661 607 787 890 India 3,030 2,787 3,611 4,085World 20,265 21,028 23,156 24,131 World 88,002 92,549 100,821 104,908
Ending Stocks (000 tons) Ending Stocks (000 tons)US 914 690 627 610 Brazil 1,220 759 1,083 900Brazil 410 311 330 310 Argentina 565 412 700 810China 430 455 310 300 China 480 700 830 710World 2,846 2,436 2,403 2,400 World 4,368 4,031 4,624 4,558
Exports (000 tons) Exports (000 tons)Argenfina 1,619 2,019 2,130 2,760 Argentina 8,198 8,684 9,705 12,700Brazil 1,639 1,297 1,228 1,400 Brazil 11,682 10,927 9,818 11,100US 450 924 1,487 1,220 US 5,446 6,345 8,472 7,120EU 494 867 1,042 966 India 2,504 2,156 2,771 2,970World 4,968 6,679 7,750 7,624 World 29,687 30,515 33,805 37,145
Imports (000 tons) Imports (000 tons)China 1,445 2,041 1,936 1,730 EU 12,461 11,040 12,963 15,050Iran, Islamic R. 500 408 699 715 China 1,644 3,750 3,609 3,950H.K., China 85 591 802 520 East Europe 2,343 2,080 2,369 2,274Bangladesh 187 279 235 390 Thailand 673 1,059 949 1,030India 73 84 254 370 Korea, Rep. 1,059 818 881 1,020World 5,123 6,509 7,625 7,737 World 29,700 30,610 33,728 37,201
Source: Oil World Source: Oil Wodd
Global SummaryActual - Est. - -Annual Growth Rate (%O) -
Soybean Oil (000 tons) 1970/71 1980/81 1990/91 1996/97 1997/98 1998199 1970-80 1980-90 1990-98Production 6,477 13,417 16,141 21,028 23,156 24,131 7.3 1.8 3.2Consumption 6,245 12,730 16,149 21,285 23,065 24,247 7.1 2.4 3.3Exports 1,140 3,303 3,800 6,679 7,750 7,624 10.6 1.4 5.6Ending Stocks 653 2,094 2,119 2,436 2,403 2,400 11.7 0.1 1.0
Soybean Meal (000 tons)Production 29,265 59,379 70,528 92,549 100,821 104,908 3.1 0.7 1.2Consumption 29,012 57,744 69,653 92,952 100,150 105,030 3.0 0.8 1.3Exports 5,636 18,201 26,649 30,515 33,805 37,145 5.1 1.7 0.8Ending Stocks 602 1,992 3,217 4,031 4,624 4,558 5.2 2.1 1.3
Actual ForecastSoybean Oil Prices ($/ton) 1995 1996 1997 1998 1999 2000 2001 2005 2010
Current 625.0 551.5 564.8 625.9 480.0 490.0 500.0 525.0 550.0Constant 1990 524.3 483.8 521.1 600.8 457.9 460.1 458.2 435.4 403.3
Note: Crop year begins October 1.Source: Oil World and World Bank.
april 1999 33

AGRICULTURE
Soybeans 350 Monthly Prices ($/ton)
The devaluation of the Brazilian real, com- Rotterdam
bined with a record global soybean crop, sent 300 -
prices sharply lower. Global stocks are at 12-year highs and prospects are for another large 250 - CBOT
crop in 1999/00. 200 - Futures*
Soybean prices fell to $203/ton in February (c.i.f. . A 'Rotterdam) compared to an average of $229/ton dur- 150 -....... . ,.,.l. i,l .. ..
ing the fourth quarter of 1998. The decline was led Mar-96 Mar-97 Mar-98 Mar-99 Mar-00by soyoil, which was down 24.9% in March relative *Futures prices are end-March expressed in $/ton.
to December 1998, while soymeal prices fell 15.5% Source: USDAhistoricalprices
during the same period. 200 World Balance (million tons)World soybean production in 1998/99 is a record
158.1 million tons, up 20% in the last two years and 150
up nearly 50% during the 1990s. Since our last quar-terly report, the crop estimates for Argentina and Bra- 100zil have increased by 12.9% and 6.9%, respectively. ConsumptionGlobal oilseed production is also at record levels, up 50
2.7% over last year. US plantings of soybeans areexpected to increase in 1999 from last year's record o - .level because the US government program favors soy- 1970 1975 1980 1985 1990 1995
beans over maize. This could lead to a double digit Source: USDA
increase in US soybean supplies according to the Ending Stocks (million tons)USDA. The USDA says "...soybean stocks and prices 20will deviate from past cycles and could continue at World
depressed levels for the foreseeable future." Oilseeds: 15
World Markets and Trade, March 1999.Demand has not increased in response to the 10
lower prices. Global soybean trade in the current mar-keting year is now estimated to be down 6% from last 5 - us
year, according to the USDA. This compares with the uestimate in our last report of a 3% decline. The larg- o - 1 . E
est soybean importer, the EU, is expected to reduce 1970 1975 1980 1985 1990 1995imports 6% due in part to increased domestic produc-tion. Japan, the second largest importer, is expected Annual Prices ($/ton)to reduce imports for the second consecutive year. The 1000third largest importer, Mexico, is expected to increase Forecast
imports but not enough to offset declines in other coun- 750 -
tries. Global consumption is expected to remain equal Constant(1990)
to last year's level despite the 22% decline in soybean 500
prices from March 1998 to March 1999.In response to these increasingly bearish devel- 250 -
opments, we have lowered our near-term price fore- . Roturrem)cast for soybeans. We now expect soybean prices to 0 (i IR r Ifall an additional 18% in 1999 and not recover sig- 1970 1975 1980 1985 1990 1995 2000 2005 2010nificantly until 2001. We have also lowered our long- Source: USDA historical data and World Bank forecasts.
term forecast.
34 GLOBAL COMMODITY MARKETS

FATS, OILS, AND OILSEEDS SOYBEANS
Other Developments* The USDA's planting intentions survey released on Brazilian soybean and soybean product exports have
March 31It reported that US soybean plantings are surged since the devaluation of the real in January.expected to rise 1% in 1999. If realized, this would Export registrations for soybeans from Februarybe the largest soybean plantings on record. through mid-March totaled 5.4 million tons, up
* US Secretary of Agriculture Dan Glickman reported 165% from the 2.0 million tons of the same periodthat the US is considering a significant new aid pack- of one year ago. Registrations of soybean meal andage to the Russian Federation which would include soybean oil were 19% and 31% higher for the pe-large purchases of soybeans, soybean meal, and soy- riod, respectively, over the same period of last year,bean oil. The US has already purchased about 3 according to the USDA's Foreign Agricultural Ser-million tons of soybeans for delivery to the Russian vice.Federation according to news reports.
Production and Crush Trade and Ending Stocks1995196 1996/97 1997/98 1998/99 1995/96 1996197 1997/98 1998/99
Production (000 tons) Exports (000 tons)US 59,174 64,780 73,176 75,028 US 23,165 23,999 23,690 21,230Brazil 24,150 27,300 31,500 31,000 Brazil 3,450 8,360 8,750 9,500ArgenUna 12,430 11,200 19,200 19,200 Argenlna 2,090 750 3,230 3,300China 13,500 13,220 14,728 13,800 Paraguay 1,600 2,150 2,390 2,400India 4,476 4,100 5,350 5,500 World 31,950 35,900 40,440 38,600Paraguay 2,400 2,771 2,990 3,100 Imports (000 tons)EU 940 1,140 1,570 1,740 EU 14,250 15,310 16,870 15,800Indonesia 1,517 1,460 1,400 1,500 Japan 4,780 5,040 4,870 4,600World 124,909 132,177 156,957 158,063 China 800 2,270 2,940 3,450
Crush (000 tons) Mexico 2,400 2,680 3,200 3,400US 37,273 39,080 43,462 42,460 Taiwan, China 2,650 2,630 2,390 2,000Brazil 21,570 19,900 19,900 21,300 Korea, Rep. 1,420 1,490 1,340 1,400Argentna 10,290 11,050 13,000 16,000 Brazil 1,050 900 1,350 1,000China 7,470 8,690 10,730 10,130 Indonesia 720 680 600 700India 4,046 3,650 4,770 4,870 World 32,400 36,390 40,300 38,590Mexico 2,440 2,690 3,330 3,480 Ending Stocks (000 tons)Japan 3,700 3,810 3,720 3,540 US 4,993 3,588 5,438 12,790Taiwan, China 2,356 2,362 2,070 1,700 Brazil 825 525 685 630Korea, Rep. 1,183 1,246 1,100 1,100 Argentna 276 266 307 304World 110,316 113,885 131,765 129,727 World 8,593 6,818 8,786 16,066
Source: USDA Source: USDA
Global SummaryActual -Est.- -Annual Growth Rate (%) -
World Balance (mil. tons) 1970/71 1980/81 1990/91 1996/97 1997/98 1998199 1970-80 1980-90 1990-98Production 44.3 81.0 104.2 132.2 157.0 158.1 7.1 2.5 5.3Consumpton 48.0 84.3 104.0 134.3 153.8 151.0 6.7 2.3 4.8Ending Stocks 3.6 11.5 13.0 6.8 8.8 16.1 14.3 1.6 -1.7
Crop Area (mil. hectares) 30.0 49.9 54.3 63.2 69.6 70.7 5.4 1.2 3.3Yields (tons/hectares) 1.48 1.63 1.92 2.09 2.24 2.17 1.6 1.3 1.7
Actual ForecastPrices ($/ton) 1995 1996 1997 1998 1999 2000 2001 2005 2010
Current 259.3 304.8 295.4 242.8 200.0 205.0 215.0 250.0 275.0Constant 1990 217.3 267.4 272.6 233.1 190.8 192.5 197.0 207.3 201.7
Note: All quanttes are in local marketing years. Prices are for US soybeans, c.i.f. Rotterdam in calendar years.Source: USDA historcal data and World Bank price forecasts.
april 1999 35

AGRICULTURE
Grains 260 Monthly Prices ($/ton)Trade Weighted
World grain prices remained weak during Export Price
most of the quarter. Global stocks are large, 220 -
demand is weak, and prices are not likely torise much further unless the 1999/00 crop is 180 -
well below normal.140-
The chances for a recovery in grain prices dimin-ished during the quarter as the USDA's estimate of glo- 100bal stocks was increased by about 2%, and estimates of Mar-95 Mar-96 Mar-97 Mar-98 Mar-99stocks held by the major exporters (Argentina, Austra- Source: USDA data and World Bank calculations.
lia, Canada, EU, and US) were increased by nearly 5%.The major exporters now hold 45% of world stocks - 2,000 World Balance (million tons)the highest level in ten years. These stocks represent asignificant constraint to higher prices since they are 1,750readily available for export. Since 1995/96, these stocks Production*
have increased from 60 to 140 million tons. -Global grain trade is expected to be down 3% 1,500 Consumption
this year at 207 million tons and it has remained be- 1tween 200 and 220 million tons for the last 12 years. 1,250Delayed food aid shipments from the EU and US to K
the Russian Federation have contributed to lower grain 1,00 195 - . E .trade and weakened prices. Imports by the European *Includesmilled98ce.Union are down nearly 10% over last year because of Source: USDA
a bumper 1998/99 crop. Brazil is expected to have 500 Ending Stocks (million tons)lower imports because of economic weakness and cur- Worldrency devaluation, which increases the cost of imports. 375
The long-term trends in global grain markets re-main weak. Consumption has grown by an average 250 -ar
0.8% per year during the 1990s compared to 1.7% per ExporteMa*year during the 1980s. The slower growth reflects fun- 125damental changes in food demand rather than the re-cent economic slowdown inAsia. Consumers are shift- -_ ._ _ _
ing away from staple grains such as wheat and rice to 1970 1975 1980 1985 1990 1995other foods such as fruits, meats, oilseeds, and veg- *Argentina, Australia, Canada, EU, and US.etables. Even the demand for grains as livestock and Annual Prices ($/ton)poultry feed, which is 37% of global grain demand, has 500only grown by 0.4% per year during the 1990s. Pro- Constant Forecastduction has generally increased to meet demand growth 375 - 1990)from yield increases alone, causing the global grain areaharvested to decline during the 1990s. For example, 250 -during the 1990s the European Union increased grainproduction 12.4% and yields 18.9% causing area to 125
decline 5%. The US increased production by 11.9% Current
and yields by 19.2% over this same period, causing area 0 - iharvested to fall 6%. Largely because of these trends, 1970 1975 1980 1985 1990 1995 2000 2005 2010
Source: USDA historical data and World Bank forecasts.the real prices of maize, rice, and wheat declined 44%,54%, and 45%, respectively, since 1978.
36 GLOBAL COMMODITY MARKETS

GRAINS
Other Developments* The US govemment passed legislation to increase * EU farm ministers reached an informal agreement
assistance to farrners by $6 billion to help maintain on the reform of the Common Agricultural Policyfarm incomes and temper financial hardship. Di- on March 1 Ith according to Fertilizer Week. Therect government payments to US farmers rose to agreement would keep the agricultural land set-asidenearly $13 billion in 1998. at 10% in 2000 and 2001, and then to zero in 2002.
* Agreement on the EU's Agenda 2000 budget pack- * Global cereals food aid has been declining from 14.7age calls for reductions in internal EU grain and million tons in 1993 to 5.5 million tons in 1997 ac-other commodity prices and replaces them with cording to the World Food Programme. However,direct payments to farmers. Under the proposal, food aid for 1999 should be higher following in-price supports for grain would be cut by 15%. creased food aid from the EU and the US.
Production and Stocks Trade1995/96 1996197 1997/98 1998/99 1995/96 1996/97 1997/98 1998/99
Production (000 tons) Exports (000 tons)China 356,369 388,458 378,443 378,650 US 99,469 81,275 76,352 82,423US 275,073 333,154 333,937 347,101 EU 52,459 62,378 55,357 59,726EU 175,874 203,870 205,303 209,437 Australia 18,008 24,304 19,118 17,925India 174,870 177,758 182,669 179,521 Canada 20,506 24,899 23,880 18,050Canada 49,159 57,995 49,395 50,896 Argentina 13,193 22,534 25,451 17,385Russian Fed. 61,100 66,799 85,265 46,065 China 959 5,896 11,075 6,600Brazil 41,580 46,188 39,865 42,955 Thailand 5,431 5,332 6,474 5,625Indonesia 39,215 38,034 37,200 39,300 World 206,800 214,300 214,800 207,400Australia 26,809 34,839 29,842 30,272 Imports (000 tons)Argentina 23,255 35,611 40,125 30,115 EU 43,159 41,378 43,695 39,388Turkey 25,085 26,090 26,255 28,660 Japan 26,874 27,423 27,685 27,340Mexico 27,566 29,865 26,973 28,320 Korea, Rep. 12,808 12,261 11,591 11,825Poland 25,910 25,296 25,401 26,675 Egypt 8,177 10,167 10,387 10,525
World 1,712,579 1,870,151 1,876,820 1,843,202 Mexico 10,342 7,592 10,405 10,165Ending Stocks (000 tons) Brazil 7,050 7,022 9,695 7,875
China 81,684 96,261 87,283 79,933 Saudi Arabia 5,235 7,601 5,240 7,175US 25,484 39,949 58,717 75,834 Iran, Isl. Rep. 5,739 10,077 7,307 4,250EU 21,314 27,220 39,072 44,688 Taiwan, China 7,132 7,045 5,771 5,753India 23,420 17,520 20,920 18,639 Algeria 4,296 4,859 6,263 5,340
World 254,262 290,218 325,048 311,463 World 206,800 214,300 214,800 207,400Source: USDA Source: USDA
Global SummaryActual - Est.- -Annual Growth Rate (%/))_
World Balance (mil. tons) 1970/71 1980/81 1990/91 1996/97 1997/98 1998/99 1970-80 1980-90 1990-97Production 1,078.7 1,429.6 1,768.7 1,870.2 1,876.9 1,843.2 2.8 1.6 0.9Consumption 1,130.8 1,475.5 1,743.2 1,834.2 1,842.0 1,856.8 2.6 1.7 0.9Exports 109.6 214.7 202.3 214.3 214.8 207.4 6.6 0.1 0.1Ending Stocks 192.8 287.9 339.0 290.3 325.1 311.5 6.0 1.0 -2.3
Crop Area (mil. hectares) 663.0 722.1 694.3 703.7 691.7 683.9 0.9 .0.5 *0.1Yields (tons/hectare) 1.8 2.2 2,8 2.9 3.0 3.0 1.9 2.3 1.0
Actual ForecastPrices ($/ton) 1995 1996 1997 1998 1999 2000 2001 2005 2010
Current 166.5 201.0 153.7 131.0 129.9 140.1 137.0 161.0 170.6Constant 1990 139.7 176.0 141.8 125.7 123.9 128.6 128.6 133.5 125.1
Note: Quantities are in local marketing years. Production and yields are based on milled rice. Prices are the trade weightedaverage of US maize, US HRW wheat, and Thai 5% broken white rice in calendar years.Source: USDA historical data and estimates and World Bank price forecasts.
april 1999 37

AGRICULTURE
M aize Monthly Prices ($/ton)210
Large supplies of maize and other coarsegrains combined with weak global import 170 US No. 2
demand will keep prices low in 1999. Stocks of f.o.b. CBOT
the major exporters are at 6-year highs. 130 Futures*
90
Maize prices averaged $96/ton (US fo.b.) duringthe first quarter after falling to $86/ton last September. 50 ..... ... .... l.. ..i.
However, the chances of significantly higher prices in Mar-96 Mar-97 Mar-98 Mar-99 Mar-00
1999 are small because of large ending stocks. World *Futures prices are end-March expressed in $/ton.
maize stocks are projected to increase about 9 million Source: USDA
tons (10.5%) this year compared to last year. This would 700 World Balance (million tons)raise the end-of-year stock-to-use percentage to 16.3, upfrom 14.9 last year. The increase in maize stocks is off- 57
set somewhat by a 4 million ton decline in world barley Production
stocks due largely to a sharp decline in Russian Federa- Ytion barley production. Nevertheless, the total stocks of 450coarse grains are more than adequate to meet demand.
Low maize prices have not led to significantly 325 C
increased global imports, which are projected to aboutequal last year's 63 million tons. The economic slow- 200 I I
down in East Asia may be partly to blame, with Japan 1970 1975 1980 1985 1990 1995
and the Republic of Korea projected to reduce imports Source: USDA
by 2.6% and 7.0%, respectively, compared to last year. 180 Ending Stocks (million tons)However, Malaysia is expected to increase imports backto the long-term trend, following reduced imports last 135
year. Imports by Latin American countries remain rela- World
tively strong, with Brazil expected to increase imports 90
by 21%, Mexico by 8%, and Venezuela by 3% com-pared to the previous year. Middle Eastern countries 4 -
are generally increasing imports over last year, with the 4region projected to increase total coarse grain imports Major Exporters*
by 25%. However, this still would not exceed the im- 1970 1975 1980 1985 1990 1995
ports of two years ago. Oil-exporting countries, such * Argentina, SouthAfrica, and US.
as Saudi Arabia, are expected to maintain imports at Source: USDA
historical or higher levels despite the earlier weakness 400Annt
in petroleum prices. ConstantForecastin ~~~~~~ ~ ~~~~~~~~~~~(1990) FrcsThe US is expected to supply 72% of total maize 300
imports. Argentina and China, the second and thirdlargest exporters, will provide 14% and 6% of total 200
exports, respectively. The increase in the US's marketshare, from 59% in the previous year, is due to a large too -US crop, reduced production in Argentina, and the re- Current
luctance of China to export at low world market prices. (us No. 2),Other coarse grain exports will be less concentrated in 1970 1975 1980 1985 1990 1995 2000 2005 2010
the US, with the EU expected to export more than 7 Source: USDA historical data and World Bank forecasts.
million tons of barley and 11% of total coarse grains.
38 GLOBAL COMMODITY MARKETS

GRAINS MAIZE
Other Developments* The USDA's planting intentions survey released * The EU is expected to export 7.3 million tons of
on March 31St reported that US maize plantings barley in 1998/99, with subsidies of as much as $85/are expected to fall 2.5% in 1999. Other coarse ton according to the USDA7s Grain: World Marketsgrains were also lower, with sorghum plantings and Trade, March 22.expected to fall 8.5%, barley down 16.8%, oats * US Department ofAgriculture Under-Secretary Gusdown 3.5%. Only rye plantings were expected to Schumacher said in a recent speech that US maizeincrease, by 1.2 %. exports are facing significant loss of market share
* US maize stocks are expected to account for 45% of in Europe because of delays in the EU approval ofthe world's total. genetically modified crops.
Production and Stocks Trade1995196 1996/97 1997198 1998/99 199Y96 1996197 1997198 1998/99
Production (000 tons) Exports (000 tons)US 187,970 234,518 233,864 247,943 US 52,681 46,579 37,697 46,000China 112,000 127,470 104,300 124,000 Argentna 6,952 10,203 12,756 9,000EU 29,224 34,794 38,602 34,151 China 168 3,892 6,173 4,000Brazil 32,480 35,700 30,860 32,500 Hungary 122 828 1,235 1,200Mexico 17,780 18,922 17,000 17,500 S. Africa, Rep. 1,541 2,200 1,041 750Argentna 11,100 15,500 19,360 14,500 World 64,906 66,747 63,378 63,960India 9,530 10,612 11,088 9,800 Imports (000 tons)Canada 7,271 7,380 7,180 8,900 Japan 15,976 15,963 16,422 16,000Romania 9,923 9,610 12,680 8,500 Korea, Rep. 8,963 8,336 7,528 7,000S. Africa, Rep. 10,200 10,136 7,544 7,000 Mexico 6,379 3,141 4,376 4,750World 516,637 591,161 573,990 593,732 Taiwan, China 5,733 5,741 4,472 4,500
Ending Stocks (000 tons) Egypt 2,225 3,179 3,141 3,250US 10,819 22,433 33,220 43,459 EU 2,966 2,595 2,065 2,500China 34,700 45,000 26,000 29,000 Malaysia 2,444 2,485 2,180 2,500EU 2,331 3,280 4,375 3,357 Brazil 160 383 1,324 1,600Argentina 400 750 1,612 1,113 Colombia 1,495 1,495 1,569 1,500S. Africa, Rep. 1,200 1,950 1,050 1,050 Saudi Arabia 923 1,272 1,230 1,300Brazil 3,222 2,072 1,267 917 Venezuela 1,205 1,234 1,161 1,200Thailand 297 222 123 273 Peru 822 820 1,227 1,150World 68,776 92,053 86,245 95,260 Wbrld 64,906 66,747 63,378 63,960
Source: USDA Source: USDA
Global SummaryActual - Est- -Annual Growth Rate (%/*)-
World Balance (mil. tons) 1970/71 1980/81 1990/91 1996/97 1997/98 1998/99 1970-80 1980-90 1990-98Producfon 268.1 408.5 482.3 591.2 574.0 593.7 4.2 1.2 2.6Consumption 273.0 421,9 474.9 567.9 579.8 584.7 4.1 1.6 2.7Exports* 32.2 84.9 64.5 73.3 73.5 70.8 9.5 -0.7 1.4Ending Stocks 36.1 85.5 80.9 92.1 86.2 95.3 10.8 -0.7 0.8
Crop Area (mil. hectares) 112.5 131.1 128.5 141.0 136.3 139.4 1.5 -0.1 0.9Yields (tons/hectare) 2.38 3.12 3.75 4.19 4.23 4.28 2.7 1.3 1.8
Actual ForecastPrices ($/ton) 1995 1996 1997 1998 1999 2000 2001 2005 2010
Current 123.5 165.8 117.1 102.0 102.0 108.0 117.0 125.0 130.0Constant 1990 103.6 145.5 108.0 97.9 97.3 101.4 107.2 103.7 95.3
*Includes intra-EU trade.Note: Quantities are in local marketng years. Prices are for US No. 2 maize, f.o.b. US Gulf in calendar years.Source: USDA historical data and esfmates and World Bank price forecasts.
april 1999 39

AGRICULTURE
Rice 400 - Monthly Prices ($/ton)
Despite dangerously low world rice stocks, Thai 5%
weaker import demand and large export 350
supplies from Thailand and Vietnam caused 300 CBOT
prices to fall to new lows in March. Futures*
Thailand's 5% broken white rice fell to $256/ 250 -
ton in March and 25% broken rice fell to $220/ton(f.o.b. Bangkok). This was down 9.2% and 14.8%, 200 -. I I.....
respectively, from the fourth quarter averages. Mar-96 Mar-97 Mar-98 Mar-99 Mar-00
World rice stocks are estimated to be the lowest *Futures prices are end-March expressed on amilledbasisin$/ton.
since 1972/73 when measured as a share of consump- World BAtion, and the lowest since 1987/88 when measured in 400 World Balance (million tons)absolute levels. The situation improved slightly, how-ever, compared to last quarter, as the USDA's esti- 350
mate of world stocks rose from 43.9 to 45.7 milliontons. China holds 48% of world stocks, India holds 300 Production
about 21%, and the next largest stock holder is Indo-nesia with about 4% of world stocks. If China's stocks 250
are excluded, the remaining stocks are at the lowestlevel since 1987/88. By any measure, rice stocks are 200 I I
extremely low and rice prices could increase sharply 1970 1975 1980 1985 1990 1995
if production is significantly below trend next year. Source: USDA
Low wheat prices provide some buffer against higher World Ending Stocks (million tons)prices since importers can easily switch some of their 80 -imports to wheat.
World import demand is expected to fall to about 60
22 million tons in calendar year 1999 from the record27.6 million tons in 1998. The decline, to more nor- 40
mal levels, is due to lower imports by Bangladesh,Indonesia, and Philippines following large imports in 20
1998 which were needed to offset poor crops causedby adverse weather. Exporters have been aggressive, o -with India, Thailand, and Vietnam all attempting to 1970 1975 1980 1985 1990 1995
capture a larger share of a smaller market. China is Source: USDA
also reported to be planning to expand exports, and Annual Prices ($/ton)this could keep prices low for several more months. 1,600 -
Next year's production could be very important Constant Forecast
for prices. If production is low in a major consuming 1,200 - (1990)or exporting country, it could lead to lower export sup-plies or expanded import demand. Current low stocks 800provide little cushion against such an outcome. Earlyreports suggest that Thailand is facing production prob- 400 -
lems due to drought in its central plains causing re- iCuent (TI 5%)
duced irrigation water. However, early season prob- olems do not always lead to lower production. Low 1970 1975 1980 1985 1990 1995 2000 2005 2010
nitrogen fertilizer prices should help yields to increase Source: USDA historical data and World Bank forecasts.
from the below trend levels in 1998/99.
40 GLOBAL COMMODITY MARKETS

GRAINS RICE
Other Developments* Record rice production in South America (+18% * Normal weather is expected to lead to lower rice
over last year), combined with weaker demand in imports in 1999. El Nifno disrupted weather pat-Brazil due to the economic situation, is leading to terns in 1998 and contributed to the need for largestrong export competition in the region. Argentina rice imports by Bangladesh, Brazil, Indonesia, andand Uruguay are both expected to have record ex- Philippines. In total, these countries imported 12.2ports, while Brazilian imports will decline. million tons of rice in 1998 compared to 2.5 million
* The USDA's planting intentions survey released on tons in 1997. A retuin to normal weather is expectedMarch 31st reported that US rice area is expected to to reduce 1999 imports to about one-half of the 1998increase 7% in 1999. levels according to the USDA.
Production and Stocks Trade1995/96 1996/97 1997/98 1998199 1996 1997 1998 1999 (Est.)
Production (000 tons of paddy) Exports (000 tons)China 185,214 195,100 200,700 190,000 Thailand 5,281 5,272 6,367 5,500India 119,442 121,980 123,191 121,512 Vietnam 3,040 3,268 3,776 3,500Indonesia 51,100 49,360 48,462 50,769 US 2,624 2,292 3,165 2,750Vietnam 26,792 27,277 28,592 28,030 India 3,556 1,959 4,800 2,500Bangladesh 26,533 28,326 28,296 26,703 Pakistan 1,677 1,982 1,800 2,000Thailand 21,800 20,700 22,803 21,667 China 265 938 3,732 1,500Myanmar 17,000 15,517 15,345 16,034 Uruguay 596 640 600 725Japan 13,435 12,930 12,532 11,201 World 19,655 19,027 27,647 21,685Brazil 10,026 9,504 8,529 10,956 Imports (000 tons)Philippines 11,174 11,177 9,982 10,231 Indonesia 1,233 808 6,081 2,500US 7,887 7,783 8,300 8,529 Bangladesh 655 45 2,489 1,300Pakistan 5,951 6,461 6,500 6,976 Philippines 687 816 2,187 1,200World 551,036 563,628 570,969 559,863 Brazil 786 845 1,457 850
Ending Stocks (000 tons) Nigeria 350 731 800 800China 21,732 25,556 26,719 21,769 Saudi Arabia 786 659 775 750India 11,000 9,500 10,500 9,500 Japan 445 546 468 725Indonesia 2,615 1,530 2,204 2,000 EU 895 839 800 700Philippines 1,670 1,590 1,273 1,678 Iraq 236 684 625 700Korea, Rep. 245 390 805 980 Iran, Islamic R. 1,294 973 500 650Thailand 852 708 789 889 Malaysia 573 645 593 650World 49,815 50,369 51,987 45,714 World 19,655 19,027 27,647 21,685
Source: USDA Source: USDA
Lilobal SummaryActual -Est. - -Annual Growth Rate (%) -
World Balance (mil. tons) 1970/71 1980/81 1990/91 1996/97 1997/98 1998/99 1970-80 1980-90 1990-98Producton (milled) 213.0 270.0 352.0 380.3 386.0 378.0 2.6 2.5 1.2Trade' 8.6 12.7 12.1 19.0 27.6 21.7 4.9 0.8 8.2Consumption 210.6 275.0 347.4 379.8 384.3 384.2 2.5 2.3 1.3Ending Stocks 28.8 48.5 59.1 50.4 52.0 45.7 8.4 1.8 -2.6
Crop Area (mil. hectares) 132.7 144.5 146.6 149.7 149.6 149.4 0.9 0.2 0.2Yields (tons/hectare) 2.35 2.75 3.55 3.76 3.84 3.74 1.7 2.3 0.9
Actual ForecastPrices ($/ton) 1995 1996 1997 1998 1999 2000 2001 2005 2010
Current 321.0 338.9 303.5 304.2 280.0 305.0 320.0 335.0 365.0Constant 1990 269.2 297.3 280.0 291.9 267.1 286.4 293.2 277.8 267.7
*Trade is on a milled basis in calendar years.Note: Production and yields are paddy in marketing years. Consumption and stocks are on a milled basis in marketing years.Prices are for Thai 5% broken WR, milled, f.o.b. Bangkok in calendar years.Source: USDA historical data and estimates and World Bank price forecasts.
april 1999 41

AGRICULTURE
Wheat Monthly Prices ($/ton)US HRW
Wheat prices are up from their lows of last f.o.b.August, but appear unlikely to rally much 240 -further. World stock estimates have increased, 180imports have been weaker than expected, and CBOT
food aid shipments were delayed. 120 - Futures*
US wheat export prices fell to $108/ton last fall 60 ,,1,,,,l. , I,
(HRW #2), and then rallied to $130 in November. Mar-96 Mar-97 Mar-98 Mar-99 Mar-00
Since then, prices have weakened to average $119.8 *Futures prices are end-March expressed in $/ton.for the first quarter and March prices averaged $117.2/ Source: USDA
ton. Until the new crop estimates become available, World Balance (million tons)prices will likely remain near $120/ton.
The USDA's world ending stocks estimate was 540
raised by 3.5% and major exporter's stocks were in- Productioncreased by 16% since our last report. This weakens 460the case for higher prices. The major exporters (Ar- Consurption
gentina, Australia, Canada, EU, and US) are now ex- 380
pected to hold 45% of world stocks - the highest sharein ten years. Stock estimates for Canada, the EU, and 300 I I
the US were all raised, and combined stocks of the 1970 1975 1980 1985 1990 1995major exporters were increased from 48 million tons Source: USDA
to 56 million tons. The global stock-to-use percent- Ending Stocks (million tons)age is expected to be 21 at the end of the current mar- 200keting year, which is lower than last year, but still ad- Worldequate. World stocks are expected to fall about 10 150million tons (-7.6%) from last year.
Import estimates for the 1998/99 marketing year 100have been reduced from 97.8 million tons last quarter Majorto 95.6 million this quarter due largely to lower im- 50Eoresports by the Russian Federation (-1.0 million tons),Algeria (-0.6 million tons), China (-0.5 million tons), 0 -and the Islamic Republic of Iran (-0.5 million tons). 1970 1975 1980 1985 1990 1995If imports are about 95.6 million tons, as currently *Argentina,Australia,Canada,EU,andUS.
Source. USDAestimated by the USDA, they would be the lowest since Annual Prices ($/ton)1986 and down 5% from last year. 500 Constant
Early estimates of the 1999 wheat crop suggest (1n9n *Forecast
lower production than last year due to unfavorable 375
weather in major producing regions and the responseto lower prices. The International Grains Council ex- 250
pects wheat production to fall about 14 million tons(2.4%) from 1998 levels. The most significant decline 125 -is expected in China due to extensive drought condi- (Currenttions in the major wheat growing northern provinces. o- (us HRW)
Wheat prices are expected to increase margin- 1970 1975 1980 1985 1990 1995 2000 2005 2010ally in 1999 from 1998 levels and then continue to Source: USDA historical data and World Bank forecasts.
increase in 2000 and 2001.
42 GLOBAL COMMODITY MARKETS

GRAINS WHEAT
Other Developments* The USDA's planting intentions survey released ment on distribution procedures. The distribution
on March 3 1st reported that US wheat plantings of 1.5 million tons of US wheat is scheduled toare expected to fall 4% in 1999. This would be the begin in mid-April. The US announced furtherlowest in 26 years. Durum wheat plantings are wheat donations of 0.2 million tons to Pakistan,expected to increase 12%, spring wheat plantings 0.1 million tons to Jordan, and 0.3 million tons toare expected to fall 2%, and winter wheat plantings Bangladesh.are expected to be down 6.6%. * The Russian Federation missed a fifth payment on
* Food aid shipments to the Russian Federation from its $1.5 billion line-of-credit for the purchase ofthe EU and US were delayed pending an agree- grain from the Canadian Wheat Board according
to The Public Ledger.
Production and Stocks Trade1995/96 1996/97 1997/98 1998/99 1995196 1996/97 1997198 1998/99
Production (000 tons) Exports (000 tons)China 102,215 110,570 123,300 110,000 US 33,681 27,039 28,090 29,000EU 86,161 98,506 94,213 103,482 EU 13,250 17,834 14,196 16,000US 59,404 61,980 67,534 69,410 Australia 12,131 18,223 15,398 14,500India 65,470 62,097 69,275 66,047 Canada 17,066 18,167 21,283 14,500Russian Fed. 30,100 34,900 44,200 26,900 Argenbna 4,442 10,073 9,566 7,500Canada 25,037 29,801 24,280 24,400 Turkey 1,178 967 1,306 3,000Australia 16,504 23,702 19,417 21,000 Kazakhstan 4,422 2,250 1,889 1,800Pakistan 17,002 16,907 16,650 18,700 World 98,762 101,318 100,571 95,583Turkey 15,500 16,000 16,000 18,000 Imports (000 tons)Ukraine 16,273 13,550 18,400 14,900 Egypt 5,932 6,897 7,156 7,200Argentna 8,600 15,900 14,800 10,750 Japan 6,101 6,264 6,200 6,200Kazakhstan 6,490 7,700 8,950 5,000 Brazil 5,530 5,573 5,682 6,100Morocco 1,100 5,916 2,317 4,400 Korea, Rep. 2,554 3,465 3,917 4,400World 538,647 582,774 609,988 586,585 Algeria 3,780 3,628 5,191 4,000
Ending Stocks (000 tons) Russian Fed. 5,242 2,548 2,631 3,700China 24,252 24,166 33,366 27,860 Iran, Islamic R. 2,793 7,048 3,572 3,000US 10,234 12,073 19,663 25,987 Yemen, Rep. 2,026 2,292 2,366 2,400EU 11,120 14,758 16,082 19,085 Indonesia 3,613 4,200 3,665 2,200India 12,000 7,000 9,600 8,300 China 12,531 2,692 1,914 1,500Canada 6,728 9,047 5,989 7,889 Peru 956 1,290 1,259 1,300Australia 1,475 2,395 1,348 3,078 Venezuela 1,022 1,185 1,224 1,100VWorld 106,702 112,783 137,875 127,379 World 98,762 101,318 100,571 95,583
Source: USDA Source: USDA
Global SummaryActual -Est.- - Annual Growth Rate -
World Balance (mil. tons) 1970/71 1980/81 1990/91 1996/97 1997/98 1998/99 1970-80 1980-90 1990-98Producton 306.5 436.3 588.0 582.8 610.0 586.6 3.3 2.2 0.6Consumption 329.5 444.0 561.9 576.7 584.9 597.1 3.0 2.4 0.8Exports 55.0 94.1 101.1 101.3 100.6 95.6 4.7 0.6 -1.1Ending Stocks 80.5 113.9 145.1 112.8 137.9 127.4 5.3 1.1 -1.9
Crop Areas (mil. hectares) 207.0 237.1 231.4 231.0 229.6 226.4 1.2 -0.7 0.1Yields (tons/hectare) 1.48 1.84 2.54 2.52 2.66 2.59 2.0 2.9 0.5
Actual ForecastPrices ($/ton) 1995 1996 1997 1998 1999 2000 2001 2005 2010
Current 177.0 207.6 159.5 126.1 128.0 133.0 145.0 162.0 172.0Constant 1990 148.5 182.1 147.2 121.1 122.1 124.9 132.9 134.4 126.1
Note: Quanttes are in local marketing years. Prices are for US HRW No. 2 wheat, f.o.b. US Gulf in calendar years.Source: USDA historical data and estimates and World Bank price forecasts.
april 1999 43

AGRICULTURE
Bananas 750 Monthly Prices ($/ton)
The WTO determined that the recently re-formed EU banana regime discriminated 650 -f.o.b. US
against bananas exported by US companies. ports
In the aftermath of Hurricane Mitch and the 550 -
domestic financial crisis, exports from Ecua- 4 -
dorplummeted. 450
Banana prices (f.o.b. US ports) averaged $478/ 350Mar-95 Mar-96 Mar-97 Mar-98 Mar-99
ton during the first quarter, down from last quarter's Source: WorldBank
average of $520/ton, but $54/ton higher than the firstquarter of 1998. Ecuador exported 3.86 million tons in 15 Imports (million tons)1998, down from 4.55 million tons in 1997. Accordingto Sopisco News, in the first two months of 1999, Ecua- 12
dor exported 570 thousand tons, down from 714 thou- World
sand tons in the first two months of 1998. The reduc- 8tion in exports is mainly due to Hurricane Mitch whichhit Central America last October and the financial tur-moil that Ecuador entered last month. Exports from u sCosta Rica, the second largest exporter, increased 12%
in 1998 (from 1.94 million tons in 1997). 1970 1975 1980 1985 1990 1995Demand for bananas, while strong in OECD coun- Source: FAO
tries where most importation occurs, has weakened in Exports (million tons)countries hit by crisis. For example, bananas imports 14in Russia have dropped 60% following the crisis. Priorto August 1998, when the crisis started, Russia was im- 12
porting an average of 35,000 tons per month. Follow- World
ing the crisis, the average dropped to 12,000. 9
OnApril 6, the World Trade Organization (WTO)determined that the EU's reformed banana regime, 7 Latin
which went into effect this year, still violates WTO rules. AmericaThe EU licensing scheme was found to incorporate a 4"drag-on" from the previous, discriminatory system 1970 1975 1980 1985 1990 1995(although the present system was not found to be "de Source: FAO
jure" incompatible with WTO rules). The panel also Annual Prices ($/ton)found that the level of damage to US companies ex- 900 -
porting bananas was $191.4 million in lost annual US Forecast
sales. Initially, the US claimed damages of $520 mil- 700 Constant
lion. The dispute was brought to WTO by the US along (1990)with five Latin American banana producing nations 500(Ecuador, Guatemala, Honduras, Mexico, and Panama).The WTO decision gives the green light to the US to 300impose countervailing duties on several items importedfrom EU countries. The US is soon expected to publish l_
100- the list ofproducts affected by the sanctions. The sanc- 1970 1975 1980 1985 1990 1995 2000 2005 2010
tions will remain in effect until the EU ensures that its Source: World Bank
banana regime is WTO-compatible.
44 GLOBAL COMMODITY MARKETS

OTHER FOOD BANANAS
Other Developments* Ecuador is the latest country to become engulfed in For example, worldwide retail sales of organic prod-
financial turnoil. Confidence in the government's ucts were estimated at $10 billion in 1997. How-ability to keep control of the crisis has been low. ever, organically grown bananas are vulnerable toIts currency, the sucre, declined almost 80% against diseases, in particular Black Sigatoga.the US dollar within a month. To prevent deposi- * Although the US-EU banana dispute appears to betors from draining the banks, the government kept resolved - at least on paper - several analysts con-banks closed during the first week of March. tend that the issue is far from over. The WTO deci-
* In a recent report regarding the long-term outlook for sion has effectively nullified the 1994 Lome conven-bananas, FAO concluded that world net imports and tion agreement which gave preferential treatment toexports of bananas are projected to balance by the bananas exported to the EU by African and Carib-year 2005 at 13.7 million tons. That level, however, bean banana producing countries. All three sugges-would be attained only by a decline in real prices. In tions of the panel for a revision of the EU systemanother report, FAO examined the feasibility of grow- seem to imply a renegotiation by the EU with all in-ing organic bananas. The growth in the organic food terested parties on the manner by which the Lomeindustry has been phenomenal in the last few years. waiver provision could be applied in practice.
Exports (000 tons) Imports (000 tons)1994 1995 1996 1997 1994 1995 1996 1997
Ecuador 3,308 3,737 3,842 4,550 EU 3,184 3,107 3,158 3,412Costa Rica 1,875 2,033 1,933 1,940 US 3,199 3,266 3,368 3,300Colombia 1,572 1,335 1,407 1,491 Japan 873 874 819 880Philippines 1,155 1,213 1,253 1,255 Russian Fed. 264 730 431 660Guatamela 540 646 611 630 China 48 160 513 610Panama 712 705 643 580 Canada 382 400 408 415Honduras 494 522 574 570 Poland 166 227 238 260C6te d'Ivoire 157 173 196 230 Argentina 202 201 248 255Cameroon 175 171 166 175 Czech, Rep. 111 159 149 155FWI* 232 193 194 137 Chile 124 145 151 155Mexico 52 110 132 132 Korea, Rep. 138 122 124 124Jamaica 79 85 89 95 Turkey 66 88 97 97Nicaragua 27 54 78 88 Slovakia 53 62 81 90Dominican R. 95 94 80 69 Switzerland 76 75 74 75World 10,200 11,318 11,478 12,027 World 9,870 10,766 10,869 11,637
Source: FAO Source: FAO
Global SummaryActual - Est.- -Annual Growth Rate (JO)-
Exports (000 tons) 1970 1980 1990 1995 1996 1997 1970-80 1980-90 1990-97Latin Amerca 4,676 5,288 7,630 9,646 9,738 9,900 1.2 3.7 1.8Asia 406 1,049 960 1,306 1,347 1,440 9.5 -0.9 2.8World 5,731 6,886 9,335 11,318 11,423 12,027 1.8 3.0 1.8
Imports (000 tons)EU 2,108 2,224 3,653 3,107 3,158 3,412 0.5 5.0 -0.5North America 2,045 2,669 3,440 3,666 3,776 3,715 2.7 2.5 0.5World 5,585 6,680 8,887 10,766 10,869 11,637 1.8 2.9 1.9
Actual ForecastPrices ($/ton) 1995 1996 1997 1998 1999 2000 2001 2005 2010
Current 445.1 469.6 502.7 491.6 474.0 480.0 485.0 540.0 579.0Constant 1990 373.4 412.0 463.8 471.8 452.2 450.7 444.4 447.8 424.6
*FWI refers to the Former Windward Islands (Dominica, Grenada, St. Lucia, and St. Vincent & Grenadines).Source: FAO and World Bank.
april 1999 45

AGRICULTURE
Shrimp 1,800 Monthly Prices (¢/kg)
Tight global supplies and improved demand in Black Tiger
Europe have kept larger shrimp prices firm, 1,600 - MGE
while prices of medium to small sizes re- Futures
mained weak due to large stocks. 1,400 - Mexican
Seasonally low supplies combined with improved 1,200 - No. I
demand in the European market strengthened prices forlarger count shrimp. Prices for Thai black tiger 16/20 1,000_- .,,,,,,, ,, .,,.,,,, ,,.,,.count rose 13%-from $15.4/kg in December to $17.4/ Mar-96 Mar-97 Mar-98 Mar-99 Mar-0
kg in March. Prices for peeled shrimp also improved Source: NMFS and MGE.
due to low output from major producing countries and Production (thousand tons)strong demand in the European market. Medium to 1,200 -
small count shrimp prices remained low because of highstocks, with Mexican No.1, 26/30 count averaging 900$14.1/kg during the quarter, down slightly from last Prawns World,
quarter. 600Japanese household consumption reached a 5-year
low in January due to the continuing recession. The 300normal demand increase during the year-end holiday us ..
season was less than usual and left importers with large 0 Thailand
stocks. Imports by Japan in 1998 totaled 239,000 tons, 1976 1981 1986 1991 1996
10.5% below 1997 levels. Exports fell significantly Source: FAO
from China (-19.8%), India (-12.1%), Indonesia(-9.2%), Imports (thousand tons)Thailand (-26.2%), and Vietnam (-14.2%). 1,200 -
US shrimp production increased in 1998 with theexception of cold water shrimp which suffered from 900 -warmer than usual water temperatures. Output of tropi- Frozen Shrimp,
cal shrimp in the US Gulf areas totaled 154 million 600 - Prawns: Wtpounds for the first 11 months of 1998, up 19% overthe corresponding period of 1997. December outputs 300 - Japan
from Louisiana reached a 12-year high. Imports to theUS also increased in 1998 (up 7.3% from 1997) as de- omand remained strong due to the continued strength of 1976 1981 1986 1991 1996
the US economy. Exports from Thailand and Indone- Source: FAO
sia to the US increased by 25.7% and 19.2% respec- Annual Prices (0Ikg)tively, as some packers in these countries started tar- 2,300geting the strong US market instead of the Japanese Constant Forecast
market. Exports from Ecuador and Mexico in 1998 1,900 -remained about the same as for 1997, whereas exportsfrom Bangladesh, China and Venezuela declined sharply 1,500 -by 3 5.3%, 45.7% and 33.9%, respectively.
High prices for larger shrimp should continue un- 1,100 -til late April when the season for black-tiger shrimp e . 1)begins in Asia. The long-term outlook for prices largely 700depends on Japan's economic situation. If Japan con- 1975 1980 1985 1990 1995 2000 2005 2010
tinues to face slow or negative growth, then the global Source. NMSF historical data and World Bank forecasts.
demand for shrimp will remain weak and prices low.
46 GLOBAL COMMODITY MARKETS

OTHER FOOD SHRIMP
Other Developments* The European Union increased import tariffs on fish- * The Agriculture Sanitary National Service of Hon-
ery products from Thailand from 5.1-13.5% to 6- duras is establishing a training program which plans20%. This increase has not affected shrimp import to start exporting Honduran shrimp to the EU mar-volumes from Thailand substantially, because of ket. The program is designed to assist shrimp pro-the devaluation of Thai currency and low world ducers to learn about the technologies and skills re-shrimp prices. quired to produce shrimp which meet EU standards.
* The Vietnamese government, in collaboration with * Shrimp produced in shrimp cultures in Sri Lankaa Norwegian development agency, plans a two-year have suffered from a disease called yellowhead syn-project to develop technologies to prevent environ- drome since the end of last year. At least 8,000 hect-mental damage from production of shrimp. Viet- ares of shrimp cultures have reportedly been affectednam produces about 18,000 MT of shrimp in cul- by the disease.tures using about 50,000 hectares of land.
Production Trade1993 1994 1995 1996 1994 1995 1996 1997
Production ExportsThailand 141.7 191.0 165.7 152.0 Ecuador 72.0 86.4 85.7 109.0US 165.7 153.0 148.8 143.5 India 110.5 101.8 95.7 105.4India 116.1 107.9 101.8 95.7 Thailand 178.5 165.7 152.0 79.4Ecuador 72.5 72.7 84.9 85.7 Indonesia 83.8 76.6 79.6 77.6Indonesia 87.0 88.7 78.2 79.6 Denmark 40.6 34.0 46.7 47.0China 65.0 61.0 48.0 56.9 China 60.9 47.1 35.1 43.1Mexico 42.4 45.9 51.6 44.1 Mexico 31.1 36.5 35.8 35.7Vietnam 55.5 63.1 38.7 38.8 Vietnam 63.1 38.8 38.8 n.a.Iceland 21.4 31.2 35.1 38.7 World 1,050.4 978.0 1,013.2 n.a.Greenland 17.1 35.0 33.0 34.7 ImportsBangladesh 19.2 22.1 26.3 26.5 Japan 303.5 293.1 289.0 267.6Spain 37.3 19.4 19.0 21.9 US 263.1 245.2 230.3 259.5Philippines 22.2 21.7 17.8 21.8 Spain 108.3 80.6 82.9 77.2Norway 23.0 25.0 16.1 17.8 France 48.4 53.1 55.1 51.7Pakistan 16.9 13.8 14.8 16.8 Denmark 49.9 40.4 53.1 51.7Canada 11.9 16.9 15.5 15.0 Canada 16.4 22.6 50.8 34.8Australia 7.9 11.1 14.9 10.8 UK 27.9 26.8 25.1 25.9World 1,076.6 1,143.3 1,060.7 1,063.7 World 1,068.9 1,003.3 1,033.5 n.a.
Source: FAO Source: FAO
ilobal SummaryActual -Annual Growth Rate (0%o)-
World Balance (000 tons) 1980 1985 1990 1994 1995 1996 1976-80 1980-90 1990-96ProducUon 451.4 593.2 838.9 1143.3 1,060.7 1,063.7 2.2 7.6 3.3Imports 361.9 524.1 905.5 1068.9 1,003.3 1,033.5 5.1 10.6 2.4
Actual ForecastPrices (¢/kg) 1995 1996 1997 1998 1999 2000 2001 2005 2010
Current 1,509.2 1,351.6 1,611.6 1,578.9 1,390.0 1,450.0 1,465.0 1,525.0 1,590.0Constant 1990 1,266.1 1,185.7 1,489.6 1,518.0 1,318.9 1,341.6 1,320.1 1,243.7 1,146.6
Note: Produclon, trade, exports and imports are for the calendar year for frozen shrimp and prawns.Source: FAO, NMFS historcal data, and Word Bank forecasts.
april 1999 47

AGRICULTURE
Sugar 30 Monthly Prices (,/kg)
Sugar prices collapsed in January due to the Free Market
Brazilian currency devaluation, the large 25 -
Brazilian sugar crop, and the increasing 20 -
surplus of world sugar stocks. CSCEFutures*
15-Brazil, the world's largest sugar exporter with a
24% market share in 1997/98, allowed its currency to 10 - . Ifloat on January 1 3 th and stopped supporting it on Janu- Mar-96 Mar-97 Mar-98 Mar-99 Mar-00
ary 15th This led to a rapid decline of nearly 40% in *Futures prices are end-March expressed in ¢/kg.ary 15 'h* This led to a rapid decline of nearly 40% inSource: InternationalsugarOrganization
the real relative to the US dollar and largely accountedfor the drop in the New York #11 raw sugar futures 150 World Balance (million tons)from 8.00/pound in mid-January to 5.5¢/pound byearly March. The price has stabilized at about 5.5¢/ 125
pound. In addition to the devaluation of the real, the Production
Brazilian sugar crop is near record levels and larger 100than previously estimated. This adds to an already Consmptionoversupplied world market which is estimated to be 75in surplus by about 1.6 million tons (raw equivalent)according to the ISO and by an even greater amount 50 I Iby other forecasters. This represents the fourth con- 1970 1975 1980 1985 1990 1995secutive year in which production has exceeded con- Source: IntemationalSugarOrganization
sumption and stock have accumulated. Ending Stocks (million tons)The current situation was caused by the combi- 60 -
nation of several years when production increased more Worldrapidly than consumption, and by the recent slowdown 50of demand growth in major importers in Asia and theRussian Federation. Production has increased 3.8% in 40the last two years while consumption has increased3.4%. At the same time, world imports fell 7.2% and 30this caused prices to steadily decline from 27.2¢/kg inDecember 1997 to 13.3¢/kg in March (12.4 to 6.0¢/ 20 . .pound). Such price declines are a familiar story in the 1970 1975 1980 1985 1990 1995world sugar market, with short periods of sharp price Source Intemational SugarOrganizationincreases followed by long periods of price declines Annual Prices (p/kg)and then sustained low prices. If the pattern of past 180 Aprice cycles is repeated, we could expect prices to re- Constant Forecastprice cycles ~~~~~~~~~~~~~~~~(1 990)main low for several years before beginning to recover. 135
World imports in the current (October/Septem-ber) marketing year are projected to fall 4.8% from 90the previous year according to the ISO's latest esti- Currentmates. The largest decline is in the imports of the 45 .(Free MarketRussian Federation, which is expected to import 3.65million tons of sugar (raw equivalents) compared to 04.85 million tons in the year-ago marketing year. Asian 1970 1975 1980 1985 1990 1995 2000 2005 2010Source: International sugar Organizationtotal imports are expected to fall from 13.9 milliontons in 1997/98 to 13.4 million tons in 1998/99.
48 GLOBAL COMMODITY MARKETS

OTHER FOOD SUGAR
Other Developments* The USDA's planting intentions survey released on Ledger.
March 31st reported that US sugarbeet plantings are Brazilian sugar exports have surged since the de-expected to rise 3.3% in 1999. valuation of the real. According to The Public Led-
* A somewhat optimistic view of the outlook for the ger, sugar exports in March totaled 307,292 tons -world sugar industry was given by Dr. Helmut more than 15 times the amount during March ofAhifeld, managing director of Commodity Informa- 1998. This signals a change from past practices oftion Services FO Licht. Dr. Ahfeld is quoted as say- diverting initial production to the domestic market,ing that "today's sugar stockpile should clear up in and could indicate an increase in total exports de-a year's time as market forces will ultimately de- spite the low world market prices.cide how things pan out," according to The Public
Production and Consumption Trade
1995/96 1996/97 1997/98 1998/99 1995/96 1996/97 1997/98 1998/99Production (000 tons) Exports (000 tons)
EU 16,950 18,756 19,275 17,800 Brazil 5,435 5,995 8,483 8,300Brazil 14,625 15,269 18,134 17,900 EU 4,305 5,064 5,450 4,855India 17,665 14,030 13,900 16,550 Australia 4,365 4,415 4,222 4,307China 6,790 7,323 8,747 8,750 Cuba 3,810 3,597 2,500 2,790US 6,685 6,537 7,274 7,400 Thailand 4,758 4,129 2,570 2,545Australia 5,350 5,793 5,480 5,300 Guatemala 920 1,047 1,250 1,310Mexico 4,750 4,822 5,675 5,025 S. Africa, Rep. 674 939 1,078 1,070Thailand 6,379 6,099 4,325 4,500 Colombia 900 808 945 950Pakistan 2,675 2,460 3,800 3,900 Mexico 425 742 775 825Cuba 4,635 4,316 3,200 3,500 Pakistan 25 0 500 675World 123,949 123,832 127,485 128,573 World 34,755 35,581 34,917 34,638
Consumption (000 tons) Imports (000 tons)India 14,325 15,625 15,975 16,250 Russian Fed. 3,200 3,060 4,850 3,650EU 13,950 14,605 14,895 15,120 US 2,525 2,620 2,106 2,000Brazil 8,475 8,800 9,200 9,300 EU 4,305 1,902 1,825 1,825US 8,685 8,838 8,923 9,140 Japan 1,790 1,726 1,605 1,565China 8,100 8,050 8,555 8,625 Korea, Rep. 1,210 1,446 1,380 1,445Russian Fed. 5,300 5,325 5,350 5,250 Indonesia 735 1,690 1,100 1,150Mexico 4,375 4,140 4,200 4,200 Iran, Islamic R. 890 1,390 1,150 1,170Indonesia 3,010 3,280 3,300 3,300 Canada 1,105 1,064 1,068 1,000Pakistan 3,020 2,910 3,050 3,095 Malaysia 1,050 1,122 1,010 1,000Japan 2,600 2,478 2,425 2,385 Egypt 690 1,295 945 985World 118,003 122,831 125,351 126,951 World 34,024 35,573 34,686 33,021
Source: Internatonal Sugar Organization Source: Intemational Sugar Organizaton
.ilobal summaryActual -Est.- -Annual Growth Rate=
World Balance (mil. tons) 1970/71 1980/81 1990191 1996/97 1997/98 1998/99 1970-80 1980-90 1990-98Production 72.9 83.9 110.7 123.8 127.5 128.6 2.2 2.0 1.9Consumption 71.9 88.6 107.9 122.8 125.4 127.0 2.2 2.1 2.2Ending Stocks 30.0 37.7 47.3 52.6 53.4 53.0 4.4 1.2 0.5
Actual ForecastPrices (¢/kg) 1995 1996 1997 1998 1999 2000 2001 2005 2010
Current 29.3 26.4 25.1 19.7 14.3 15.4 16.5 23.0 25.0Constant 1990 24.6 23.1 23.1 18.9 13.7 14.5 15.2 19.1 18.3
Note: Quantities are in marketing years (October/September), measured in raw value, except world ending stocks, which arein calendar years. Prices are in calendar years.Source: Historical data from the International Sugar Organization and World Bank price forecasts.
april 1999 49

AGRICULTURE
Cotton 190 Monthly Prices (,/kg)
Despite low production and some recovery ofcotton imports in East Asia, prices are still 170-
weak. While some recovery is expected to take 150 Cotlook A Index NYCE
place next season, prices are unlikely to reach \0 Futures*
the 1997 levels in the near future. 130 -
The medium staple indicator cotton price (Cotlook 110 - ........... I,, . ........A Index) declined another 3% in January-March 1999 Mar-96 Mar-97 Mar-98 Mar-99 Mar-00
*Futures are end-March expressed in 1/kg.to an average of 124 p/kg, down from 127.5 ¢/kg dur- Source CottonOutlookandNYCE.
ing last quarter and 153.9 ¢/kg during the first quarter World Balance (million tons)of 1998. The second position of the New York futures 22 -
contract reached a low of 57¢/lb. in mid-February. Production
According to the most recent estimates by the In- 19
temational Cotton Advisory Committee (ICAC), glo-
bal production in the 1998/99 season (August to July) 16
is expected to be 18.55 million tons, down from 20.02 Consumption
million tons last season, while consumption is expected 13 1 -to be 18.86 million tons. Ending stocks are projected ._ _ _E
at 9.49 million tons, down from 9.83 million tons. 10
Recent estimates by the US Department of Agri- Source1 ICAC
culture put the US crop slightly larger than 3 million
tons this season, a reduction of more than 25% from Ending Stocks (million tons)last season's 4 million ton crop. India is expected to 12 -
produce 2.73 million tons in 1998/99, up from 2.45 mil- Worldlion tons last season. Argentina, Australia, Brazil, and 9
Turkey are expected to register substantial increases
this season while production in Pakistan and Uzbekistan 6
will decline by an estimated 15% and 6%, respectively.
Production in Greece and West Africa is expected to 3 - China
remain at the 1997/98 levels. Production for the 1999/ China
00 season is projected to recover to 19.16 million tons, 0 -according to some early estimates by ICAC. Source: ICAC
Consumption this season declined by almost 2%
since 1997/98. Some recovery is expected to take place Annual Prices (,/kg)
next season by an estimated 1.6%. Cotton exports are 450 -expected to recover to 5.52 million tons in 1999/00. Constant 1990 Forecast
Imports in East Asia are recovering, with Indonesia, 350 -
Republic of Korea, and Thailand increasing their im-
ports by 7%, 9%, and 6% respectively over last season. 250 -
Despite some recovery in East Asia cotton im-
ports, global demand appears to be weak. Recovery 150 --
crucially depends on whether and by how much China Current
reduces its stocks. Assuming a 15% reduction in Chi- 50 ,1970 1975 1980 1985 1990 1995 2000 2005 2010
nese stocks, the current estimates of the global supply/ Source: Cotton Outlook and World Bank forecasts.
demand balance would indicate a 1999 average of 128¢/
kg and an increase to 132¢/kg in the year 2000.
50 GLOBAL COMMODITY MARKETS

AGRICULTURAL RAW MATERIALS COTTON
Other Developments* Cargill shut down its two cotton ginning operations will be possible only if comparable reductions from
in Tanzania for a second year in a row as a result of existing programs can be found.an expected poor crop, The Public Ledger reported * Cheap imported yarn to the EU has forced the Euro-in March. Cargill will maintain its two other ginning pean spinning industry into depression. Cotton Out-operations in Malawi and Zimbabwe, where produc- look reported that, in some instances, mills have beention prospects fare much better than in Tanzania. closed temporarily. In addition to cheap supplies
* Despite pressures from the US cotton industry, the from East Asia (a result of currency devaluations),US Congress decided to omit an amendment to an the diversion of trade from Russia has added to thisappropriations bill that would authorize new Step 2 depression. Although it is unlikely that the EU willfunds. The US Senate made it clear that any further resort to any antidumping initiative, a Voluntary Re-spending on agriculture must remain within budget straint Agreement may be negotiated between EUrestrictions. New funding for the Step 2 mechanism spinners and external suppliers.
Production and Stocks Trade1996/97 1997/98 1998/99 1999/00 1996197 1997/98 1998/99 1999/00
Production (000 tons) Exports (000 tons)China 4,100 4,600 4,400 4,100 US 1,550 1,695 860 1,238US 4,803 4,092 3,048 3,700 Uzbekistan 1,050 950 900 947India 2,351 2,450 2,730 2,700 West Africa 690 815 850 883Pakistan 1,800 1,530 1,450 1,615 Australia 467 625 655 626Uzbekistan 1,198 1,150 1,000 1,100 Greece 251 200 220 206West Africa 716 956 954 1,001 Argentna 324 189 235 199Turkey 792 795 858 865 World 6,076 5,982 5,243 5,515Australia 552 681 728 690 Imports (000 tons)Greece 400 348 350 375 Indonesia 475 425 456 470Brazil 368 370 400 336 Mexico 161 330 303 453Argentina 230 275 320 315 Brazil 493 380 301 425Syrian Arab R. 223 355 303 280 Italy 356 350 343 348World 19,622 20,015 18,554 19,161 Thailand 298 285 303 310
Ending Stocks (000 tons) Japan 270 285 290 266China 4,438 4,198 4,057 3,582 Taiwan, China 300 275 275 264US 829 844 859 1,026 Korea, Rep. 284 265 290 260India 760 811 1,008 1,008 Russia 406 223 174 227West Afrca 242 255 295 350 Turkey 243 280 198 220Brazil 213 330 323 323 India 8 116 144 167Pakistan 312 323 292 317 Portugal 164 172 160 156World 9,419 9,825 9,486 9,348 World 6,160 5,725 5,243 5,515
Source: ICAC Source: ICAC
Global SummaryActual -Estimated- -Annual Growth Rate (%)-
World Balance (000 tons) 1970/71 1980/81 1990/91 1997/98 1998/99 1999/00 1970-80 1980-90 1990-99Production 11,740 13,832 18,970 20,015 18,554 19,161 1.6 3.2 0.1Consumpton 12,173 14,215 18,576 19,302 18,858 19,266 1.6 2.7 0.3Exports 3,875 4,414 5,081 5,982 5,243 5,515 1.3 1.4 0.7Ending Stocks 4,605 4,895 6,645 9,825 9,486 9,348 0.6 3.1 3.1
Yields (tons/ha) 369 411 574 590 558 576 1.1 3.3 0.0Actual Forecast
Prices (#kg) 1995 1996 1997 1998 1999 2000 2001 2005 2010Current 212.8 177.3 174.8 144.5 128.0 132.0 139.0 192.0 205.0Constant 1990 178.5 155.6 161.3 138.7 122.1 123.9 127.4 159.2 150.3
Note: Crop year begins August 1; the 1999/00 figures are forecasts.Source: ICAC and World Bank.
april 1999 51

AGRICULTURE
Rubber 170 Monthly Prices (,/kg)f.o.b.
Thailand withdrew from INRO, and thus Malaysia
accelerated INRA III's possible collapse. 140 Mlyi
Following a short-lived recovery, prices 110dropped to a new low of 63. 7¢/kg in March. SICOM
Futures*80-
Following a brief increase in January to 71.5¢/ ........ ,kg (from 67.1 ¢/kg in December), the Kuala Lumpur 50 I ...........rubber price fell back to 68.7¢/kg in February and Mar-96 Mar-97 Mar-98 Mar-99 Mar-0063.7¢/kg in March, pushing the first quarter average *Furesprices aredend-MarchexpressedinO kg.
back to 68¢/kg (down from 70.6¢/kg in the previousquarter and 74.8¢/kg the same quarter last year). 6.5 World Balance (million tons)
Global natural rubber production in 1998 reachedabout 6.47 million tons, slightly up from 6.44 million 5.5 - -
tons in 1997, according to the International Rubber ProductionStudy Group. Production in Thailand remained virtu- 4.5ally unchanged. Production in Indonesia, the world'ssecond largest producer, increased from 1,582 to 1,656 3.5 -thousand tons, in response to high domestic prices re-ceived by producers. Malaysia, the world's third larg- 2.5 - 1 1 199
est producer, experienced a decline from 971 to 876 Source: IRSG
thousand tons, apparently a result of switching fromrubber to palm oil production. Ending Stocks (million tons)
Total natural rubber imports increased to 4.72 2.0 -
million tons in 1998 (from 4.43 million tons in 1997), Worldmainly in response to strong economies in most OECD 1.5
countries. Imports in the US increased by 11 % (from1.04 million tons in 1997 to 1.16 million tons in 1998). 1.0Imports in most Western European countries increased Exportingby similar amounts. Japanese imports dropped from 0.5 -730 thousand tons in 1997 to 687 tons in 1998.
This quarter's news was dominated by Thailand's 0.0 - .decision to withdraw from the International Natural 1975 1980 1985 1990 1995Rubber Organization (INRO), the third United Na- Source: IRSG
tions-backed International Rubber Agreement (INRA Annual Prices (¢/kg)III). INRO, which represents 18 natural rubber pro- 220
ducing and consuming countries, manages a price sta- Forecastbilization fund. LMC's Rubber Bulletin reported that 170 - -
the early termination of INRA III may be put to a Spe- 120 -cial Council vote as early as April. 120
The possible collapse of INRO III, Thailand's 70
domestic natural rubber policy, and the bearish de- Currentmand fundamentals, are the key factors affecting the 20 I Ishort- to medium-term price prospects. We estimate 1970 1975 1980 1985 1990 1995 2000 2005 2010that for the remainder of 1999, prices will average 66¢/ Source: World Bank
kg while it may take as long as three years before pricesreturn to the 1997 average.
52 GLOBAL COMMODITY MARKETS

AGRICULTURAL RAW MATERIALS RUBBER
Other Developments' Following its withdrawal notice from INRO, Thai- * The Association of Natural Rubber Producing Coun-
land announced plans to create a Rubber Exchange. tries (ANRPC), a group of the seven largest naturalThis may become the dominant rubber exchange, rubber producing countries (India, Indonesia, Ma-considering Thailand's dominant position in the laysia, PapuaNew Guinea, Sri Lanka, Thailand, andworld market of natural rubber. Currently Malay- Vietnam) met in Ho Chi Minh City on January 28sia, Singapore, and Japan operate Rubber Exchanges and proposed to cut natural rubber production bywith liquid futures contracts. The Thai government 10% in order to help boost prices. Followingalso announced a plan to restructure the domestic Thailand's withdrawal from INRO, ANRPC is ex-rubber industry. It has already bought and stock- pected to play a more important role in the rubberpiled 4 billion baht ($110 million) worth of natural market, similar to OPEC's role in the crude oil mar-rubber at 21 baht/kg. ket - if indeed the production cuts materialize.
Production and Stocks Trade1995 1996 1997 1998 1995 1996 1997 1998
Production (000 tons) Exports (000 tons)Thailand 1,805 1,970 2,033 2,039 Thailand 1,636 1,763 1,837 1,839Indonesia 1,467 1,527 1,505 1,656 Indonesia 1,324 1,434 1,404 1,582Malaysia 1,089 1,082 971 876 Malaysia 778 710 587 441India 500 540 580 585 Vietnam 117 141 151 162China 424 430 444 455 World 4,290 4,500 4,480 4,584Vietnam 159 189 201 214 Imports (000 tons)Cote d'lvoire 75 91 108 113 US 1,026 1,014 1,044 1,162Sr Lanka 106 113 106 98 Japan 696 724 730 687Nigera 121 71 90 86 China 297 490 362 397World 6,050 6,370 6,410 6,468 Korea, Rep. 289 299 299 278
Ending Stocks (000 tons) Germany 212 193 212 238Malaysia 176 190 210 218 France 176 182 192 227Thailand 113 148 161 161 Spain 130 130 146 157India 127 123 157 143 Canada 121 118 133 147US 196 204 128 129 Italy 121 119 132 147Japan 77 87 87 72 UK 120 111 120 142World 1,690 1,920 1,830 1,700 World 4,216 4,389 4,432 4,724
Source: IRSG Source: IRSG
Global SummaryActual -Annual Growth Rate (%/o)-
Natural Rubber (000 tons) 1975 1980 1990 1996 1997 1998 1975-80 1980-90 1990-98Production 3,350 3,820 5,080 6,370 6,410 6,468 2.6 2.9 3.0Consumption 3,430 3,770 5,190 6,140 6,500 6,624 1.9 3.2 3.0Exports 2,920 3,280 3,950 4,500 4,480 4,584 2.3 1.9 1.9Ending Stocks 1,440 1,480 1,500 1,920 1,830 1,700 0.5 0.1 1.6
Synthetic Rubber (000 tons)Production 6,860 8,640 9,840 9,790 10,090 10,080 4.6 1.3 0.3Consumption 7,070 8,830 9,620 9,600 10,030 9,984 4.4 0.9 0.5Exports 1,640 2,320 3,370 4,540 4,980 5,100 6.9 3.7 5.2Ending Stocks 1,690 1,740 1,890 2,360 2,420 2,500 0.6 0.8 3.5
Actual ForecastPrices-Natural (¢/kg) 1995 1996 1997 1998 1999 2000 2001 2005 2010
Current 158.0 139.4 101.8 72.2 66.0 71.0 82.0 110.0 121.0Constant l990 132.5 122.3 93.9 69.3 63.0 66.7 75.1 91.2 88.7
Source: IRSG and World Bank.
april 1999 53

AGRICULTURE
Tropical Timber 1 000 Monthly Prices ($/cum)
Southeast Asian timber export prices show Sawnwood
signs of recovery as reduced logging and mill 775 - (
processing have reduced supplies. However, .weak demand continues as Japan's housing 550 -industry remains depressed. aLs
325-…(Malaysia)
Heavy rains, which have lasted longer than nor-mal, continue to hamper logging operations in the 100Southeast Asia region and also in northern Brazil. Mar-95 Mar-96 Mar-97 Mar-98 Mar-99Source: JapanLumber Journal, NIKKEI, andTropicalPrices of Asian logs rose 8% in the first quarter com- Timbers.
pared to last quarter due primarily to shortages of logs. World Balance (million cum)Asian sawnwood prices rose 4.7%. African log and 360 Production (Hardwoodsawnwood prices fell, as old contracts expired and new Sawlogs)contracts were negotiated at lower prices. However, 270 Sawlogs)
African log prices have still not fallen as far as Asian
prices due to the stronger European compared to Asian 180
demand. For example, Cameroon logs were nearly (Hardwood Hardwood
unchanged during the first quarter from their 1997 lev- 9o Sawlogs) Sawlogs)
els compared to Malaysian logs which were down 26%
from their 1997 average. Cameroon and Malaysian 0 -sawnwood prices were both down 18% compared to 1970 1975 1980 1985 1990 1995
their 1997 levels. Source: FAO
Overall demand remains weak, but there are a World Production (million cum)
few signs of improvement. Chinese importers have 160 Sawnbeen actively buying, and Brazil's recent currency de- Hardwood
valuation has attracted Asian buyers for sawnwood 120
and value added products. This has helped prices to ,
stabilize. Demand in Japan, however, remains weak 80Plywood
despite the government's programs to stimulate con-
sumer housing demand. In February, Japan's housing 40
starts fell 9.4 percent from the year earlier to 86,581 0
units. This marked the 2 6th consecutive month of de- o - . i1970 1975 1980 1985 1990 1995cline, and follows an 11.2% decline. Source: FAO
The extremely low prices of tropical timber are
causing countries to adjust their policies in an effort 400 Annual Prices (¢/cum)to cope with the changes. Some of these changes are Constantdesigned to reduce logging and others are attempts to 300 - (I990)
boost government revenues.
Log prices in SoutheastAsia are expected to firm, 200 -
as log supply remains low and inventories are reduce.
In Japan, pent-up demand from plywood mills are 100
likely to raise log prices moderately. Domestic hard- (Logs, Malaysia)wood plywood production in Japan will remain flat in i i i
1999, while softwood log use for plywood is expected 1970 1975 1980 1985 1990 1995 2000 2005 20101999, whileaseby softwood reflocting a rse f w oo is exp Source: NIKKEI historical data and World Bank forecasts.to increase by 40%, reflecting an increase Of 25% in softwood imports, according to ITTO.
54 GLOBAL COMMODITY MARKETS

AGRICULTURAL RAW MATERIALS TROPICAL TIMBER
Other Developments* Indonesia and China have reportedly agreed to a bar- * Ghana's Forestry Department passed the Timber Re-
ter deal whereby Indonesia will exchange timber and source Management Act introducing new stumpageother products for Chinese products, including ma- fees starting February 1 with increases between 30chinery for processing logs, sawntimber, and ply- and 600%, depending on species scarcity.wood, according to INNOPRISE MarketNews Scan. * The Indonesian government imposed progressive
* Cameroon announced a ban on log exports effec- levies on forest concessions to discourage domina-tive July 1, 1999 to promote value-added process- tion of large forest areas by a single owner. In Feb-ing and to reduce impact logging. ruary, the government held first-ever auction of for-
est concessions to competitive tenders.
Hardwood Logs (000 cum) Sawn Hardwood (000 cum) Plywood (000 cum)1996 1997 1996 1997 1996 1997
Prod. of Sawlogs & Veneer Production ProductionUS 70,116 70,721 US 29,650 29,972 US 16,975 15,897Malaysia 33,980 33,980 India 14,960 14,960 Indonesia 9,575 9,600Indonesia 32,250 32,250 Brazil 10,500 10,500 China, PR 4,900 7,580Brazil 26,000 26,000 China, PR 10,211 10,211 Malaysia 4,100 4,100China, PR 22,000 22,000 Malaysia 8,232 8,232 Japan 4,311 3,830India 15,812 15,812 Indonesia 7,200 7,100 Brazil 1,900 1,900World 314,658 305,000 World 123,174 120,000 World 52,870 53,500
Exports of Tropical Hardwood Exports ExportsMalaysia 6,987 6,593 Malaysia 3,660 3,007 Indonesia 8,564 8,500PNG 2,962 2,165 US 2,692 2,890 Malaysia 4,068 3,825Gabon 2,231 2,082 Brazil 906 885 US 1,384 1,624Cameroon 1,307 1,373 Canada 850 1,022 Canada 872 859Solomon Isl. 765 755 France 844 684 Russian Fed. 612 615World 17,324 15,930 World 16,713 16,525 World 20,375 20,715
Imports of Tropical Hardwood Imports ImportsJapan 6,185 5,795 Thailand 2,200 1,360 Japan 5,381 5,422Taiwan, China 1,600 1,600 Japan 1,954 1,789 US 1,866 1,868Korea, Rep. 1,211 1,181 Taiwan, China 1,098 1,098 China, PR 1,775 1,607Thailand 883 816 Canada 930 1,024 Germany 975 1,083Philippines 776 680 China, PR 870 1,050 HK, China 962 1,074World 16,701 16,900 World 19,054 20,273 World 19,145 19,000
Source: FAO and World Bank estimates.
Global SummaryActual -Est.- -Annual Growth Rate (%O) -
World Balance (mil. cum) 1970 1980 1990 1995 1996 1997 1970-80 1980-90 1990-97Hardwood logs prod.* 210 262 300 308 315 305 2.1 1.8 0.6Hardwood logs imports* 36.1 42.2 25.1 17.4 16.7 16.9 1.7 -2.0 -6.0Sawn hardwood prod. 98.5 115.8 131.7 120.8 123.2 120.0 1.5 1.7 -1.2Sawn hardwood imports 7.1 13.2 16.1 19.5 19.1 20.3 6.7 3.9 3.6Plywood producton 33.4 39.4 48.2 55.5 52.9 53.5 1.4 2.9 2.2Plywood imports 4.9 6.0 14.9 19.0 19.1 19.0 2.2 10.1 4.1
Actual ForecastPrices ($/cum) 1995 1996 1997 1998 1999 2000 2001 2005 2010
Logs, current 255.6 252.1 238.3 162.4 177.0 180.0 190.0 230.0 290.0Logs constant 1990 214.4 220.8 219.8 155.9 168.9 169.0 174.1 190.7 212.7Sawn hardwood, current 740.0 741.4 664.5 484.1 560.0 575.0 600.0 720.0 910.0Sawn hardwood constant 620.8 649.2 613.1 464.7 534.3 539.9 549.8 597.1 667.4
*Imports for 1970-89 and producton for all years refer to hardwood sawlogs and veneer logs. Imports from 1990 onwards aretropical hardwood sawlogs and veneer logs.Source: FAO, NIKKEI historcal data, and Word Bank estimates and forecasts.
april 1999 55

FERTILIZERS
Nitrogen 240 Monthly Prices ($/ton)
A possible agreement between the Russian Urea
Federation and Ukraine to limit production 195 - (bagged)
and exports led to an 11% rise in urea prices inMarch. But, large supplies and weak demand 150 -
still plague the market.105 -
Urea prices finally showed some strength thispast quarter after falling from over $200/ton in early 601996 to 12-year lows. The lows were followed by Mar-95 Mar-96 Mar-97 Mar-98 Mar-99
higher prices in February and March in hopes of lower World Week
exports from the Russian Federation and Ukraine, 100 Bwhich together account for about 20% of world ex- Production
ports. According to Fertilizer Week, nitrogen fertil- 80
izer producers in these countries have agreed to bilat- Cs v
eral action to limit production for export by as much 60
as half. The move was prompted by the continuingdecline in export prices in recent months and building 40stocks of urea at Baltic and Black Sea ports. Bothcountries had been producing near capacity. Stronger 20 I I
demand from Asian buyers also contributed to the price 1970 1975 1980 1985 1990 1995
increase. Source: FAO
The decline in urea prices began in 1996, but the Trade (million tons)critical factor which accelerated the decline was the 30.0 -
decision by the Chinese government to ban nitrogenfertilizer imports in early 1997. China was the world's 22.5
largest importer, with about an 18% share, prior to thedecision to ban imports and rely on domestic produc- 15.0
tion. Following the ban, prices tumbled due to thelower imports and the reluctance of major producers to 7.5
cut production and exports. Not all of the price de-clines can be attributed to the Chinese policy change. o.o l l
The rapid decline in grain prices was also an im- 1970 1975 1980 1985 1990 1995portant contributor to the fall in urea prices. How- Source: FAO
ever, the urea price declines have exceeded what could Annual Prices ($/ton)be expected based on the decline in grain prices. The 800 -
econometrically estimated relationship between urea Constant(1990) Forecast
prices and grain prices over the past 20 years explains 600
about three-quarters of the movement in urea prices.And, based on this relationship, the urea price should 400
have been about 16% higher in 1998. The baggedurea price (f.o.b. E. Europe) averaged $103.1/ton in 200 -
calendar year 1998, and according to the historical Current (Ure
relationship with grain prices, it should have been 0about $120/ton. Since markets tend to return to his- 1970 1975 1980 1985 1990 1995 2000 2005 2010
torical norms, we would expect prices to increase from Source: Historical data from various industry sources and WorldBank forecasts.
current levels - but not necessarily quickly.
56 GLOBAL COMMODITY MARKETS

NITROGEN
Other Developments* Indian imports for the kharif season are delayed amid requirement is 2.53 million tons according to Fer-
reports that India's urea stocks are adequate for the tilizer Week.start of the planting season. Tender authorizations * Mexico has begun an investigation into allegationsmay not begin until May, according to industry re- of urea dumping by the Russian Federation and theports, and that contributed to weaker prices in March. United States during the year ending April 30, 1998,
* Indonesia's urea exports fell 34% in 1998 accord- according to Fertilizer Week. The investigation be-ing to ASIAFAB. gan on December 13th, 1998 in response to a com-
* Vietnam's import quotas for 1999 are reported at plaint filed byAgromex, the country's sole urea pro-1.65 million tons of urea, 270,000 tons of ammo- ducer. Under Mexican regulations, the dumping en-nium sulphate and 300,000 tons of DAP. Potash quiry must be completed in four months and anyimport quotas will be raised from 240,000 tons in duties imposed could be implemented retroactively1998 to 310,000 tons in 1999. The total fertilizer to the date when the investigation began.
Production and Consumption Trade1993/94 1994/95 1995/96 1996/97 1993/94 1994/95 1995/96 1996/97
Production (000 tons) Exports (000 tons)China 15,571 16,997 19,035 21,542 Russian Fed. 2,589 2,702 3,715 3,646US 14,415 14,017 14,244 15,243 US 2,504 2,902 2,997 2,989India 7,231 7,944 8,769 8,593 Canada 1,947 1,955 2,179 2,190Russian Fed. 4,477 4,129 4,856 4,900 Ukraine 1,211 1,218 1,227 1,293Canada 3,851 3,801 4,019 4,025 Netherands 1,546 1,480 1,364 1,234Indonesia 2,357 2,542 2,849 2,986 Indonesia 675 740 914 1,007Ukraine 2,215 1,854 1,810 1,904 Saudi Arabia 581 871 788 845Pakistan 1,566 1,478 1,693 1,682 Romania 576 722 890 833Netherlands 1,756 1,785 1,650 1,600 Bel-Lux 827 809 831 781Poland 1,143 1,269 1,469 1,535 Germany 640 548 740 712World 79,492 80,490 86,961 91,085 World 20,397 21,741 24,853 24,206
Consumption (000 tons) Imports (000 tons)China 18,003 19,801 23,784 25,779 China 2,519 2,868 4,866 4,421US 11,469 10,631 11,161 11,184 US 4,437 4,702 4,569 4,132India 8,789 9,507 9,823 10,302 France 1,185 1,282 1,306 1,348France 2,222 2,308 2,392 2,525 Genmany 1,070 1,226 1,218 1,165Pakistan 1,659 1,668 1,984 1,985 India 1,589 1,473 2,008 1,156Indonesia 1,662 1,642 1,844 1,926 Vietnam 622 847 875 900Germany 1,612 1,787 1,769 1,758 Thailand 646 687 780 811Canada 1,406 1,396 1,507 1,671 UK 592 736 658 805UK 1,268 1,340 1,331 1,346 Italy 590 679 600 736Brazil 1,015 1,177 1,135 1,197 Australia 383 428 493 636World 72,513 73,410 78,830 82,906 World 21,584 22,311 25,531 24,918
Source: FAO Source: FAO
Global SummaryActual -Annual Growth Rate
World Balance (mil. tons) 1970/71 1980/81 1990/91 1994/95 1995/96 1996/97 1970-80 1980-90 1990-96Production 33.3 62.8 81.9 80.5 87.0 91.1 6.5 3.6 1.7Consumption 31.8 60.8 77.2 73.4 78.8 82.9 6.8 3.0 1.0Imports 6.8 13.2 20.0 22.3 25.5 24.9 6.5 5.7 4.6
Actual ForecastUrea Prices ($/ton) 1995 1996 1997 1998 1999 2000 2001 2005 2010
Current 193.9 187.5 127.9 103.1 85.0 95.0 105.0 135.0 160.0Constant 1990 162.7 164.5 118.0 98.9 81.1 89.2 96.2 112.0 117.3
Note: Quantities are for total nitrogen fertilizer in marketing years and prices are for urea, bagged, spot, f.o.b. Eastern Europein calendar years.Source: FAO historical data and World Bank forecasts.
april 1999 57

FERTILIZERS
Phosphates 255 Monthly Prices ($/ton)
Phosphate fertilizer prices are expected to DAP
weaken in 1999 due to lower grain prices and 225 -
increasedproduction capacity.Phosphate fertilizer prices weakened during the 195
quarter. Diammonium phosphate (DAP) prices fell to /$ 196.5/ton in March from $202/ton in December (f.o.b. 165 TSP
US Gulf). Triple super phosphate (TSP) prices fell to$163.0/ton in March compared to $167.5/ton in De- 135 .......... I Icember (f.o.b. US Gulf). Phosphate rock prices in- Mar-95 Mar-96 Mar-97 Mar-98 Mar-99
creased to $44/ton, fa.s. Casablanca from $43/ton in Source: Fertilier Week
1998. 50 World Balance (million tons)Phosphate demand has been weak in the US mar-
ket ahead of the major planting season. Chinese and 40 Production
Indian buying has also been weak as government policyremains unsettled and fertilizer stocks are adequate in 30
both countries. Brazil, Pakistan, and Vietnam are all expected to increase imports in coming weeks. How- 20 Consumptionever, China is the key to the phosphate market in 1999according to industry sources. Total fertilizer demand 10 - i
in China in 1999 is expected to be about 36 million 1970 1975 1980 1985 1990 1995
tons according to Fertilizer Week. Nitrogen fertilizer Source: FAO
is expected to be 23 million tons of this total, and the Trade (million tons)government hopes to supply the entire amount from 20 -
domestic production. The balance will be phosphateand potash fertilizer, and about 6 million tons will be 15
imported. Some industry experts think phosphate im- Exports
ports could rise to near 5 million tons as the govern- 10ment tries to boost agricultural production following Imports
last year's severe flooding that damaged crops. China 5
has not yet announced import quotas for 1999.The Indian government has not yet agreed to sub- 0 - .
sidies and pricing on DAP. However, the government 1970 1975 1980 1985 1990 1995
imposed a 5% customs duty on fertilizer imports, ex- Source: FAO
cept NPK, to take effect from the end of February. Until Annual Prices ($/ton)the pricing and subsidies are announced, importers do 800
not know if the higher duties can be offset by higher Forecast
domestic prices. There is some speculation that the 600
government may decontrol phosphate and potash fer-tilizers, a policy which was tried last year but revoked 400
after farmers protested.Prices are expected to fall in 1999 and 2000 due 200 -
to lower grain prices and reduced area planted to grains.New production capacity is expected to keep prices Current (TSP)
from rising over the next decade. TSP prices averaged 1970 1975 1980 1985 1990 1995 2000 2005 2010
$173.1/ton in 1998 and are projected to fall to $160/ Souce: Historical data from various industry sources, and World
ton in 1999 and $150 in 2000. Bank forecasts.
58 GLOBAL COMMODITY MARKETS

PHOSPHATES
Other Developments* India's Oswal Chemicals and Fertilizers Ltd. is com- New production capacity of up to 1 million tons per
pleting construction of its 1.92 million ton/year DAP/ year of DAP and MAP fertilizers will come on-streamNPK complex in eastern India. The complex is the by year-end in Australia at WMC's Phosphate Hillworld's largest, and production is scheduled to begin fertilizer project. The US$437 million project willin July. be Australia's sole provider of high-analysis phos-
* Phosphate fertilizer producers will face increased phate fertilizers.supplies of sulphur, which are required to produce * Approval has been granted by Chinese authorities tophosphoric acid, as new treatment capacity at gas develop the Yichang phosphate deposit in Hubei prov-processing plants in Mexico and at oil refineries in ince. The project has already been confirmed capableMexico and Venezuela. This will lead to a 60-70% of mining 2.5 million tons of phosphate rock withincrease in sulphur recovery over the next 5 years. facilities to produce 1 million tons/year of DAP. This
would be the largest phosphate complex in China.
Production and Consumption Trade1993/94 1994/95 1995/96 1996/97 1993/94 1994/95 1995/96 1996/97
Production (000 tons) Exports (000 tons)US 10,233 11,055 10,500 10,900 US 5,200 6,335 5,838 5,679China 4,237 5,041 6,091 5,822 Russian Fed. 1,294 1,262 1,328 1,130India 1,906 2,587 2,626 2,596 Morocco 1,112 767 811 858Russian Fed. 2,512 1,718 1,933 1,571 Tunisia 616 674 686 705Brazil 1,231 1,393 1,242 1,269 Netherlands 356 364 439 443Morocco 1,175 894 926 990 Bel-Lux 309 312 311 362Tunisia 653 736 755 807 Jordan 235 318 318 320France 697 667 668 682 Ukraine 84 180 219 232Korea, Rep. 447 463 485 460 Norway 202 181 207 214Indonesia 543 496 325 350 S. Africa, Rep. 59 68 150 200World 31,797 32,837 33,808 34,131 World 11,069 12,323 12,563 12,447
Consumption (000 tons) Imports (000 tons)China 5,699 7,428 8,912 8,176 China 1,567 2,501 2,952 2,540US 4,102 4,014 4,770 4,145 Australia 452 515 611 651India 2,669 2,932 2,898 2,977 France 496 600 568 561Brazil 1,546 1,744 1,495 1,708 Italy 481 500 538 524France 1,014 1,030 1,032 1,052 Thailand 306 381 453 456Australia 770 865 957 976 Brazil 418 517 341 446Canada 637 582 622 704 Argentina 107 161 225 386Japan 728 703 631 610 Pakistan 541 338 272 342Turkey 787 444 580 578 Germany 310 325 303 314Spain 496 521 510 560 India 722 370 686 219World 28,960 29,460 31,741 31,106 World 10,812 11,128 12,050 11,639
Source: FAO Source: FAO
Global SummaryActual -Annual Growth Rate (%1o)-
World Balance (mil. tons) 1970/71 1980/81 1990/91 1994/95 1995/96 1996/97 1970-80 1980-90 1990-96Production 22.0 34.5 39.0 32.8 33.8 34.1 4.1 2.3 -2.5Consumption 21.1 31.7 36.3 29.5 31.7 31.1 4.0 2.1 -2.5Exports 2.9 7.5 10.7 12.3 12.6 12.4 9.1 5.0 2.8
Actual ForecastTSP Prices ($/ton) 1995 1996 1997 1998 1999 2000 2001 2005 2010
Current 149.6 175.8 171.9 173.1 160.0 150.0 140.0 150.0 155.0Constant 1990 125.5 154.3 158.6 166.1 152.6 140.9 128.3 124.4 113.7
Note: Quantities are tor total phosphate tertilizer in marKeting years and prices are tor iSP, bulk, spot, t.o.b. Us (iuif incalendar years.Source: FAO and World Bank.
april 1999 59

FERTILIZERS
Potash 140 Monthly Prices ($/ton)
Prices remain firm despite weaker demand.Contract negotiations for the first half of 1999 130
liftedprices about $3/ton. Chloride120
Potassium chloride prices rose, despite weak- 110ness in other fertilizer prices, to finish the quarter at$120.2/ton f.o.b. Vancouver. Contract negotiations ____...._._....__ ...........for the first-half of 1999 have been settled between
Mar-95 Mar-96 Mar-97 Mar-98 Mar-99Canpotex, the Canadian potash exporters associa- Source: Fertilizer Week
tion, and Japanese buyers at a $3/ton increase onnew deliveries. Other contract increases of $4-5/ 40 - World Balance (million tons)ton are being reported.
Global supplies of potash are abundant, but ex- 30 -ociporters appear to have been able to keep prices from Production
falling by cutting production and allowing invento- 20ries to increase. Canadian producers, which account Conumption
for about 40% of world exports, had about 10% lower 10output in the second-half of 1998, but inventoriesstill increased. By the end of February, Canadian o - .potash producers had 41% higher inventories than 1970 1975 1980 1985 1990 1995
Source: FAOat the end of February 1998 according to FertilizerWeek. Potash shipments from Canadian producers Trade (million tons)were down 11% in February from the same month 25 -of 1998. US potash producers also reduced outputby about 1 0% compared with the year-earlier period 20 -as demand for potash remained low. Imports
Industry hopes for higher sales in 1999 rest with 15
a few large developing countries, especially Brazil, ExportsChina, and India. Brazil had record fertilizer demand 10in 1998, with total deliveries up about 5.9% over1997, and potash imports of nearly 2.1 million tons. 5 -Demand is expected to increase again in 1999, as 1970 1975 1980 1985 1990 1995producers of export crops such as coffee, oranges, Source: FAO
and soybeans see higher domestic prices following Annual Prices ($fton)the devaluation of the real. China is expected to 200 - Constanthave strong fertilizer demand in 1999 because of the 'ForecastChinese government's supportive agricultural poli- 150 -cies following last year's flood damaged crops. In1998, China is estimated by industry sources to have 100imported 2.5-3 million tons ofpotash. The situationin India is uncertain, with the government policy on 50 -fertilizer pricing and subsidies still unsettled. The nt5% import duty imposed at the end of February has 0 -idelayed imports until it is determined whether the 1970 1975 1980 1985 1990 1995 2000 2005 2010domestic price can be increased to accommodate the SoSurce: HEistorical data from various sources and World Bank
import duty.
60 GLOBAL COMMODITY MARKETS
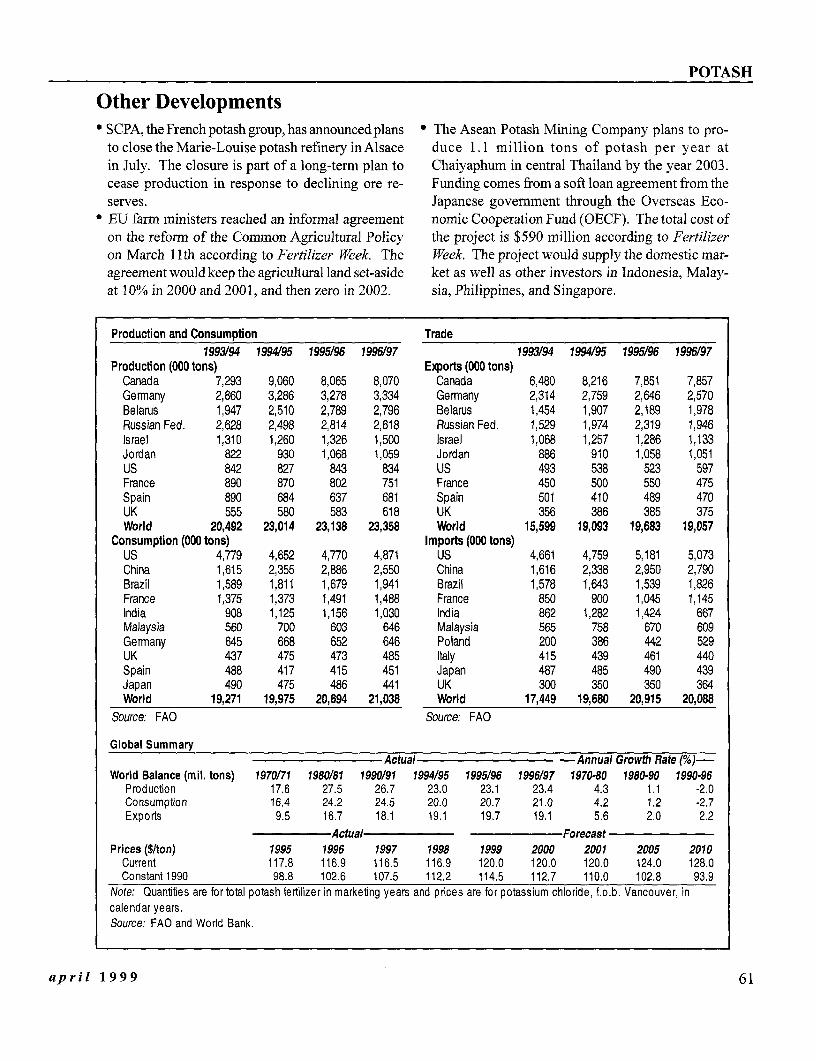
POTASH
Other Developments* SCPA, the French potash group, has announced plans * The Asean Potash Mining Company plans to pro-
to close the Marie-Louise potash refinery inAlsace duce 1.1 million tons of potash per year atin July. The closure is part of a long-term plan to Chaiyaphum in central Thailand by the year 2003.cease production in response to declining ore re- Funding comes from a soft loan agreement from theserves. Japanese government through the Overseas Eco-
* EU farm ministers reached an informal agreement nomic Cooperation Fund (OECF). The total cost ofon the reform of the Common Agricultural Policy the project is $590 million according to Fertilizeron March 11th according to Fertilizer Week. The Week. The project would supply the domestic mar-agreement would keep the agricultural land set-aside ket as well as other investors in Indonesia, Malay-at 10% in 2000 and 2001, and then zero in 2002. sia, Philippines, and Singapore.
Production and Consumption Trade1993194 1994/95 1995/96 1996/97 1993/94 1994/95 1995/96 1996/97
Production (000 tons) Exports (000 tons)Canada 7,293 9,060 8,065 8,070 Canada 6,480 8,216 7,851 7,857Germany 2,860 3,286 3,278 3,334 Germany 2,314 2,759 2,646 2,570Belarus 1,947 2,510 2,789 2,796 Belarus 1,454 1,907 2,189 1,978Russian Fed. 2,628 2,498 2,814 2,618 Russian Fed. 1,529 1,974 2,319 1,946Israel 1,310 1,260 1,326 1,500 Israel 1,068 1,257 1,286 1,133Jordan 822 930 1,068 1,059 Jordan 886 910 1,058 1,051US 842 827 843 834 US 493 538 523 597France 890 870 802 751 France 450 500 550 475Spain 890 684 637 681 Spain 501 410 489 470UK 555 580 583 618 UK 356 386 385 375World 20,492 23,014 23,138 23,358 World 15,599 19,093 19,683 19,057
Consumption (000 tons) Imports (000 tons)US 4,779 4,652 4,770 4,871 US 4,661 4,759 5,181 5,073China 1,615 2,355 2,886 2,550 China 1,616 2,338 2,950 2,790Brazil 1,589 1,811 1,679 1,941 Brazil 1,578 1,643 1,539 1,826France 1,375 1,373 1,491 1,488 France 850 900 1,045 1,145India 908 1,125 1,156 1,030 India 862 1,282 1,424 667Malaysia 560 700 603 646 Malaysia 565 758 670 609Germany 645 668 652 646 Poland 200 386 442 529UK 437 475 473 485 Italy 415 439 461 440Spain 488 417 415 451 Japan 487 485 490 439Japan 490 475 486 441 UK 300 350 350 364World 19,271 19,975 20,694 21,038 World 17,449 19,680 20,915 20,088
Source: FAO Source: FAO
Global SummaryActual -Annual Growth Rate (%1)-
World Balance (mil. tons) 1970/71 1980/81 1990/91 1994/95 1995/96 1996/97 1970-80 1980-90 1990-96Production 17.6 27.5 26.7 23.0 23.1 23.4 4.3 1.1 -2.0Consumption 16.4 24.2 24.5 20.0 20.7 21.0 4.2 1.2 -2.7Exports 9.5 16.7 18.1 19.1 19.7 19.1 5.6 2.0 2.2
Actual ForecastPrices ($/ton) 1995 1996 1997 1998 1999 2000 2001 2005 2010
Current 117.8 116.9 116.5 116.9 120.0 120.0 120.0 124.0 128.0Constant 1990 98.8 102.6 107.5 112.2 114.5 112.7 110.0 102.8 93.9
Note: Quantities are for total potash fertilizer in marketing years and prices are for potassium chloride, f.o.b. Vancouver, incalendar years.Source: FAO and World Bank.
april 1999 61

METALS AND MINERALS
Aluminum 1,750 Monthly Prices ($/ton)
Prices continue to decline on weak demand and LME Cash
rising stocks. fith new capacity coming on- 1,600 -
stream this year and next, production will have V -
to be cut to keep prices from falling further. 1,450 LME
Aluminum prices fell 7% in the first quarter, a 1,300 -result of weak demand and rising stocks and supply. Abrief rally in March took prices above $1,250/ton, but 1,150 .I . ........ .quickly receded to end the quarter near $1,200/ton. Mar-96 Mar-97 Mar-98 Mar-99 Mar-00
LME stocks rose by 29% to 818 thousand tons, *Futuresareend-March.
with most of the increase coming in January as futures Prce: LME
backwardation attracted metal into LME warehouses. 24 Production (million tons)With the re-emergence of contango, stock financing deals Refined Aluminumbecome attractive and off-warrant stocks may increase. 20 --
The market is on-course to record another large Production Consumptionsurplus this year. Output will increase from new smelt- 16 - -ing capacity and recovery at smelters which experiencedproblems last year. Unlike in 1998, no significant re- 12starts of idle capacity are anticipated. Exports from the 4
fonner Soviet Union are expected to continue as smelt- 8 I
ers significantly improved their domestic profitability 1970 1975 1980 1985 1990 1995following the devaluation of the ruble. Source: WBMS and World Bank estimates.
Buyers are showing little interest in purchasing Ending Stocks (thousand tons)significant quantities, preferring to wait for a further 3,000erosion of prices. Some regional tightness could occurdepending on restocking or strength of demand, but 2,250price rallies above $1,200/ton are expected to be metwith heavy producer selling. 1,500 / -
Significant production cuts will be needed to lQ99stimulate a sustained recovery of prices. Although a 750 - -good portion of capacity failed to cover cash costs atrecent lows, prices may have to fall to $1,050/ton or 0less for an extended period before any large reductions 1970 1975 1980 1985 1990 1995take place. The fixed-costs portion of operating costs Source: LME
are not trivial and would still have to be paid, e.g., take- Annual Prices ($/ton)or-pay power and alumina contracts, some labor, and 3,000 - .overhead costs. There are additional costs of closing, (I A9: Forecastmaintaining, and re-starting capacity, and producers may 2,250
have value-added downstream products that offset pro-duction losses. Producers will need to believe that prices 1,500
will remain depressed for a lengthy period, and willresist taking a knee-jerk reaction to any "temporary" 750 Current
price drop. In the meantime companies are continuing ._ l_ I_ ._I
to reduce costs where possible.oShoeul little podci. c. 1970 1975 1980 1985 1990 1995 2000 2005 2010Should little production come Off the market, Source: LME and World Bank forecasts.
prices could remain low through next year, and not stageany meaningful recovery until 2001.
62 GLOBAL COMMODITY MARKETS

ALUMINUM
Other Developments* Aican Aluminum will bring forward by nine months the start of its new aluminum futures contract until
the permanent closure of its Isle-Maligne plant to May 14. The contract will be traded on theDecember 1999, and will remove 90 kt from the exchange's COMEX division, and aluminum optionsmarket over the next 18 months. The company said will begin trading in July. The contract is for 44,000that this will allow the more efficient start-up of its pounds of aluminum, and will have 25 consecutivenew Alma plant with annual capacity of 375 thou- trading months. Four warehouse locations for de-sand tons. livery have been approved, two in Kentucky, one in
* Aluminum Company of America, the world's larg- Indiana, and one in Tennessee.est aluminum producer, will close its 30 kt smelter * General Motors agreed to buy more than $1 billionin Surinam indefinitely because of high operating in recycled aluminum over 13 years from Imco Re-costs and low rainfall, which has affected the sup- cycling to make lighter cars that meet new pollu-ply of hydroelctric power to the plant. The shut- tion standards. It follows a multibillion dollar ac-down will be completed over the next few weeks. cord with Alcan Aluminum last fall to lock in long-
* The New York Mercantile Exchange has delayed tern aluminum supplies.
Production of Refined Aluminum (000 tons) Consumption of Refined Aluminum (000 tons)1995 1996 1997 1998 1995 1996 1997 1998
US 3,375 3,577 3,603 3,713 US 5,055 5,348 5,390 5,814Russian Fed. 2,724 2,874 2,906 3,005 China 1,875 2,028 2,013 2,473China 1,676 1,771 2,035 2,384 Japan 2,336 2,393 2,434 2,040Canada 2,172 2,283 2,327 2,374 Germany 1,504 1,355 1,567 1,767Australia 1,293 1,370 1,490 1,626 France 744 672 724 689Brazil 1,188 1,197 1,189 1,208 UK 620 600 619 679Norway 847 862 919 996 India 581 585 585 555S. Africa, Rep. 233 617 683 693 Canada 612 620 642 550Germany 575 577 572 612 Brazil 501 497 479 521Venezuela 627 635 641 584 Korea, Rep. 675 674 666 462India 537 531 547 542 Spain 350 360 410 420Bahrain 454 461 493 501 Belgium 336 331 345 403Spain 362 362 360 359 Russian Fed. 476 444 470 400UAE 247 259 381 352 Australia 352 321 362 336New Zealand 273 285 310 318 Taiwan, China 363 310 374 301Netherlands 216 227 232 263 Italy 665 585 653 209UK 238 240 248 258 Greece 163 156 204 209Taiikistan 230 198 189 196 Norway 157 169 200 203Indonesia 228 223 221 133 Thailand 253 220 233 129Other 2,177 2,301 2,454 2,463 Other 2,874 3,035 3,407 3,551World 19,671 20,850 21,799 22,579 World 20,490 20,703 21,778 21,712
Source: WBMS Source: WBMS
Global SummaryActual -Annual Growth Rate (%1o)-
World Balance (000 tons) 1970 1980 1990 1996 1997 1998 1970-80 1980-90 1990-98Production 10,257 16,027 19,362 20,850 21,799 22,579 4.1 2.6 1.8Consumpton 9,996 14,771 19,244 20,703 21,778 21,712 4.1 3.3 2.2LME Ending Stocks n.a. 68 311 951 622 636 n.a. -0.3 -1.5
Actual ForecastPrices ($/ton) 1995 1996 1997 1998 1999 2000 2001 2005 2010
Current 1,806 1,506 1,599 1,357 1,200 1,250 1,450 1,700 1,900Constant 1990 1,515 1,318 1,476 1,303 1,145 1,174 1,329 1,410 1,393
Source: WBMS and LME data, and World Bank forecasts.
april 1999 63

METALS AND MINERALS
Copper 2,800 Monthly Prices ($/ton)
Copper prices fall as stocks soar to record LME C h
levels. New capacity will result in another 2,400 -
surplus this year, andfurtherpressure on 2,000 -
prices is expected. LME
Copper prices fell 9% in the first quarter amid 1,600 - Futures*
rising stocks and weak demand. A brief rally in March ...was short-lived and prices ended the month below 1,200$1,400/ton, little more than half the June 1997 level. Mar-96 Mar-97 Mar-98 Mar-99 Mar-00
*Futures are eDd-March.LME stocks ended the quarter at a record 722 Source: LME
thousand tons, following nine consecutive monthly in-creases. Much of the material entered warehouses in Production (million tons)Hamburg and New Orleans from Chile. Refined
Demand remains strong in the US, particularly 13 Copper
in the construction and auto sectors. Consumption in Production
Europe is slowing, while Japanese demand continues 11to fall. There are signs of recovery elsewhere in Asiabut much of the growth will be for export, which may 9only displace shipments from other producers.
Despite low prices, no major production cutbacks 7have been announced. Financial difficulties have led to 1970 1975 1980 1985 1990 1995
a few announced cuts in Africa, Australia, and Canada, Source: WBMS and World Bank estimates.
but these operations are small and will have little impact Ending Stocks (thousand tons)on the market. Companies continue to reduce costs to 800 -avoid closure, and currency devaluations have helped IQ99sustain domestic profitability and output. 600
Production is expected to outstrip supply by at least300,000 tons this year, following a much larger surplus 400
last year. With significant new capacity coming on streamthis year and next, large reductions in output are needed 200
to bring the market into balance. But prices may have to 'fall further to force production off the market. 1970 1975 1980 1985 1990 1995
It is estimated that about 25% of mine produc- Source: LME
tion is unprofitable at about $1,325/ton ($0.60/lb.)based on direct cash costs. However, closing opera- Annual Prices ($/ton)tions is expensive because of shut-down costs and en- 6,000 vironmental clean-up. Temporary suspensions have Forecastre-start and maintenance costs, which may prompt 4,500- 19lcompanies to continue operations even if prices driftdown to $1,200/ton. 3,000
Demand is not expected to recover until next 1,500year, and there is a risk of significant slowdown in the ,urrent
US and Europe. In the longer-term, a global economic o _-_. ___.___.__
recovery will raise demand and pull up prices. How- 1970 1975 1980 1985 1990 1995 2000 2005 2010
ever, given the advances in technology and reductions Source: LME and World Bank forecasts.
in costs, prices are not expected to rebound to previ-ously high levels.
64 GLOBAL COMMODITY MARKETS

COPPER
Other Developments* Chile produced 3.69 million tons of copper last year, * Peru's copper production rose 14% in January from a
8.8% higher than in 1997. Exports increased 8.6% year earlier, led by higher production at Southen Peruto 3.58 million tons. The value of exports, however, Copper Ltd. Output at Southern Peru increased byfell 22.9% to $5.28 billion. Westemn Europe over- 28% from expansion of its Cuajone open pit, and ac-took Asia as the leading destination, receiving 40% counted for 63% of Peru's total copper production.of Chile's copper exports. Japan continued to be the Other large producers also increased output, offset-single largest buyer with 17% of total exports. ting declines at smaller mining operations.
* Codelco, the world's largest copper mining company, * India raised the refined copper import tariff by 5% toproduced 13% more copper in 1998, boosted by 35%, to which a new 10% surcharge must be added.higher output from its new Radomiro Tomic mine. The Special Customs Duty of 5% has been abolished
* Broken Hill Proprietary Co. has reduced the cost of but the Special Additional Duty has been retained.producing a pound of copper at Chile's Escondida This takes the total tariff to 38.5%. The tariff on con-copper mine, the world's largest, to $0.45/lb ($990/ centrates rose marginally from 5% to 5.5%.ton).
Production of Refined Copper (000 tons) Consumption of Refined Copper (000 tons)1995 1996 1997 1998 1995 1996 1997 1998
US 2,280 2,347 2,450 2,456 US 2,534 2,621 2,790 2,949Chile 1,492 1,748 2,117 2,335 China 1,143 1,193 1,270 1,356Japan 1,188 1,251 1,279 1,277 Japan 1,415 1,480 1,441 1,255China 1,080 1,119 1,179 1,110 Germany 1,066 960 1,040 1,161Germany 616 671 674 696 Italy 498 504 521 599Russian Fed. 560 599 640 640 Taiwan, China 563 544 588 584Canada 573 559 560 563 France 540 518 558 583Poland 407 425 441 447 Korea, Rep. 540 588 618 554Peru 282 342 384 401 UK 398 396 409 402Korea, Rep. 233 244 263 369 Belgium 362 332 329 324Belgium 376 386 373 368 Brazil 198 233 258 303Mexico 208 246 297 345 Mexico 172 192 230 280Kazakhstan 256 267 298 325 Poland 213 226 230 271Spain 164 264 292 304 Canada 190 218 225 245Australia 266 311 271 285 Spain 175 191 203 237Zambia 314 317 328 242 Turkey 139 160 188 212Brazil 165 172 177 168 Russian Fed. 187 165 165 165Philippines 158 156 147 152 India 116 140 160 160Sweden 111 126 128 128 Australia 160 180 182 143Other 1,091 1,177 1,289 1,269 Other 1,539 1,570 1,613 1,535World 11,818 12,729 13,586 13,880 World 12,147 12,411 13,016 13,315
Source: WBMS Source: WBMS
Global SummaryActual -Annual Growth Rate (%o) -
World Balance (000 tons) 1970 1980 1990 1996 1997 1998 1970-80 1980-90 1990-98Production 7,583 9,242 10,809 12,729 13,586 13,880 2.1 1.6 3.4Consumption 7,294 9,400 10,780 12,411 13,016 13,315 2.9 1.8 3.1LME Ending Stocks 72 123 179 125 338 511 11.3 -6.3 2.7
Actual ForecastPrices ($1ton) 1995 1996 1997 1998 1999 2000 2001 2005 2010
Current 2,936 2,295 2,277 1,654 1,400 1,475 1,700 2,000 2,200Constant 1990 2,463 2,010 2,101 1,588 1,336 1,385 1,558 1,659 1,613
Source: WBMS and LME data, and World Bank forecasts.
april 1999 65

METALS AND MINERALS
Gold 420 Monthly Prices ($/toz)
Gold prices slid to $287 and continued to trade Spot
in a relatively narrow range. Prices are 380
1!dlikely to break to the up side because of 340
fears offurther government reserve sales and COMEX
heavy producer selling when rallies occur. 300 Futures*
Gold prices averaged $287 per troy ounce (toz)in the first quarter, a decline of 2.5% from 4Q98. For 260 ......... . I ........
the most part, prices traded in a narrow range bounded Mar-96 Mar-97 Mar-98 Mar-99 Mar-00*Futures are end-March.
by an increasingly common trading pattern. 'When Source: Platts Metals Week and LME.
prices dip below $280/toz, physical demand picks up,and prices above $290/toz cause heavy producer and 2,400 - Production (tons)speculative selling.
Possible sales from central banks and the IMF are 1,800
also preventing prices from rising. Switzerland's ref- rerendum April 18, 1999 to permit its central bank to 1,200
sell gold could result in the sale of half of its 2,590 tons South
of reserves, beginning as early as next spring. 600 -
A number of governments are in favor of sellingIMF gold reserves to fund the Highly Indebted PoorCountries (HIPC). The proposed sale of between 5 and 1970 1975 1980 1985 1990 1995
10 million ounces (156 to 311 tons) will likely be dis- Source: WBMS and World Bank estimates.
cussed at the G7 summit in June. A number of political Demand in Main Countries (tons)obstacles remain, including approval by the US Con- 700
gress and the German Bundesbank, and a number of Developing
gold producing countries may oppose the initiative be- 550
cause of its impact on prices.Demand in the main consuming markets reached a 400
record 806.8 tons in the fourth quarter. In the developedcountries, demand rose 16% from a year earlier, while in 250
the developing countries it was only marginally higher.For 1998, total demand fell 11% because of dishoarding 100 . I . i iin Asia at the outbreak of the financial crisis. 1Q96 1Q97 1Q98
Demand in India rose 11% in 1998 boosted by Source: World Gold Council
the liberalization of imports. Depreciation of the rupee Annual Prices ($/toz)and a rise in import tariffs restrained demand in the 10Q0 -second half of the year. In South East Asia, although Forecastdemand recovered from the first quarter, levels were 750 - Awell below year-earlier periods, and for 1998 there wasa net dishoarding of 111 tons. Chinese demand fell 500
10% due to slower economic growth, while demand inSaudi Arabia increased 5% despite lower oil prices. 250
Gold prices are unlikely to rise because of ample _ _ __Current
supply and fears of further government sales. Produc- 1tion costs continue to fall, aided by currency devalua-tions, thus prices could test new lows. Over the longer- Source: Platts Metals Week and World Bank forecasts.
term, real prices are expected to decline.
66 GLOBAL COMMODITY MARKETS

GOLD
Other Developments* Switzerland's central bank almost doubled its gold * Gold imports into Dubai totaled 23.1 tons during
lending in 1998 to 187 tons. The average maturity January, down sharply from 61.9 tons in Januarywas about 4.5 months, and produced a yield of 1.0%. 1998. The decline reflects the decreasing impor-Switzerland began lending its gold in 1997. tance of Dubai as an entrepot for India gold trade,
as India eased import regulations in 1998.
Mine Production (tons) Consumption in Main Markets (tons)1995 1996 1997 1998 1994 1995 1996 1997
S. Africa, Rep. 522.4 494.6 492.5 473.8 India 415.0 477.2 507.8 736.7US 313.0 312.0 338.0 359.4 US 300.6 314.7 331.9 362.0Australia 253.5 289.5 311.0 310.9 China 224.3 223.9 210.7 213.8Canada 150.9 166.4 171.4 165.8 Turkey 80.8 139.4 153.0 202.0China 136.4 120.6 149.6 158.2 Saudi Arabia 174.0 193.1 184.9 199.0Indonesia 63.3 83.6 90.0 108.6 Taiwan, China 162.0 160.2 123.3 142.1Peru 56.5 65.1 74.3 93.8 Korea, Rep. 106.0 121.0 125.5 114.4Russian Fed. 131.9 123.4 123.0 85.8 Italy 103.0 108.0 102.2 107.7Uzbekistan 63.6 71.0 82.0 82.0 Japan 212.1 272.1 152.2 107.1Brazil 76.8 76.8 76.8 76.8 Indonesia 97.0 119.0 129.0 92.5Ghana 53.9 48.1 52.5 68.4 UAE 33.2 39.2 52.6 71.5PNG 51.7 51.6 48.5 62.9 Germany 58.9 73.4 57.7 59.1Chile 44.2 51.8 47.8 43.8 Brazil 50.0 54.0 59.0 58.0Mexico 19.9 23.1 26.4 25.4 France 50.5 52.0 52.5 53.0Zimbabwe 24.0 24.7 24.3 25.1 H.K., China 47.5 43.2 40.4 51.0Kyrgyz Republic 4.0 4.1 16.1 21.3 UK 34.8 39.3 40.0 50.0Kazakhstan 10.9 10.2 9.7 18.0 Mexico 47.0 31.0 41.0 49.0Bolivia 14.4 12.6 13.3 14.4 Vietnam 35.0 36.0 41.0 45.0NewZealand 12.1 11.5 11.4 11.3 Kuwait 25.0 35.1 34.7 35.4Japan 9.2 8.6 8.4 8.6 Malaysia 24.8 29.6 33.6 30.1Philippines 12.8 8.1 11.2 8.4 Singapore 23.9 24.1 20.0 22.4Mongolia 4.5 4.9 8.5 7.1 Oman 16.5 16.5 16.5 17.8Venezuela 10.0 11.7 22.3 6.8 Thailand 124.0 116.0 106.0 14.0Sweden 6.5 6.1 7.0 6.0 Bahrain 7.4 7.8 8.0 10.6Ecuador 7.4 7.2 7.2 n.a. Qatar 6.0 6.1 6.2 6.8World 2,105.5 2,142.4 2,282.1 2,299.8 World 2,459.1 2,731.8 2,629.8 2,851.1Source: WBMS Source: World Gold Council
Global SummaryActual - % p.-
World Balance (tons) 1990 1991 1992 1993 1994 1995 1996 1997 1990-97Jewelry 2,145 2,306 2,693 2,501 2,610 2,767 2,807 3,328 6.5Other Fabrication 494 511 450 487 464 500 483 562 1.9Bar Hoarding 224 252 273 137 231 306 182 337 6.0Other 218 45 154 413 52 61 5 28 n.a.Total Demand 3,080 3,114 3,570 3,538 3,357 3,634 3,477 4,254 4.7Mine Producton 2,133 2,161 2,237 2,281 2,278 2,269 2,347 2,464 2.1NetOfficial Sales 187 119 602 522 94 182 239 406 11.7Old Gold Scrap 524 461 463 535 615 625 644 611 2.2Forward Sales 224 96 165 198 158 466 10 329 5.6Other 12 278 103 2 212 92 237 444 n.a.Total Supply 3,080 3,114 3,570 3,538 3,357 3,634 3,477 4,254 4.7
Actual ForecastPrices ($/toz) 1995 1996 1997 1998 1999 2000 2001 2005 2010
Current 384 388 331 294 290 295 300 320 345Constant 1990 322 339 305 282 277 277 275 265 253
Source: Gold Fields Minerals Services and LME data, and World Bank forecasts.
april 1999 67

METALS AND MINERALS
Iron Ore and Steel 30 Monthly Prices (0/dmtu)
Iron Ore contract prices fall 9-11% for 1999, Iron Ore Contract
largely due to slumping steel markets. Steel 29 -
prices fell 7% in the first quarter despite adrop in production and exports. 28 -
Iron ore contract prices for 1999 were settled be- 27
tween Brazil's Companhia Vale do Rio Doce and German 26 __ --_ ,.,.C.....l....___I____
steel makers in February. The price referenced in this re- 6port - Itabira fines f.o.b. Tubarao - is set at 29.96¢/dmtu, Mar-95 Mar-96 Mar-97 Mar-98 Mar-99down 9.2% from last year. Iron Ore (million tons)
Itabira fines ceased tobe the official benchmark grade 1,200
in Europe last year, because CVRD sells far more Carajasfines into Germany. The price for the new benchmark, 900Carajas fines f.o.b. PontadaMadeira, was settled at 27.590/ Productiondmtu, a drop of 11% from 1998. We will continue to 600report the price of Itabira fines until an appropriate data Exportsseries for Carajas is obtained.
Lower iron ore prices are due to the slump in steel 300demand in Asia, and further declines in consumption and _
exports are expected this year. Iron ore demand will not 0 - 1I . Irecover until there is a recovery in steel production in Asia, Source1 195 1
but moderate growth in world ore exports is expected over Steel (million tons)the medium- to longer-term. Most of the increased ship- Ste -ments are expected from Australia and Brazil, which to- Crude Steel
gether account for 60% of the world's iron ore exports. 750 ProductionReal prices are expected to continue to decline due to theapplication of new technologies. 500
Steel prices fell 7% in the first quarter due to the Semi andcontinued slump in Asian demand and global over-pro- 250 Finished Exports
duction. Imports into the strong US market have started 2
to fall partly because of actual or threatened anti-dumping I Iaction. In February US steel imports fell 19% from Janu-
1975 1980 1985 1990 1995ary, and it was the fourth consecutive month of decline. Source: IISI
The sharpest drops were from China and Japan. The US Annual Prices (o/dmtu)has set preliminary duties on hot-rolled coil from Japan 60 -and Brazil, and Russia has agreed to reduce shipments to Constant Forecast
(1990)the US. Other countries have also filed trade complaints. 45 -
World steel production has been reduced 7.5% inthe first two months of 1999, following a decline of 2.5% 30-for 1998. This year, production is more than 10% loweryear-on-year in the European Union, Japan, and the US, 15 Current
and down 7% in the Republic of Korea. Iron Ore
Steel prices may firn in the US due to lower im- I Iports and domestic production, but markets remain in sur-plus in the Pacific basin and could worsen with the with- 1970 1975 1980 1985 1990 1995 2000 2005 2010
Source: CVRD an d World Banlk forecasts.drawal of Asian and CIS exports to the US and Europe.
68 GLOBAL COMMODITY MARKETS

IRON ORE AND STEEL
Iron Ore Production (000 tons) Crude Steel Production (000 tons)1994 1995 1996 1997 1994 1995 1996 1997
China 250,695 261,919 252,283 268,612 China 92,613 95,360 101,237 108,911Brazil 167,810 178,380 179,870 187,950 Japan 98,295 101,640 98,801 104,545Australia 128,662 139,067 147,200 160,889 US 91,244 95,191 95,535 98,485Russian Fed. 73,259 78,348 72,136 69,906 Russian Fed. 48,812 51,589 49,253 48,442India 58,390 62,000 67,264 69,400 Germany 40,837 42,051 39,793 45,007US 58,382 62,645 62,132 63,000 Korea, Rep. 33,745 36,772 38,903 42,554Ukraine 51,464 50,741 47,745 52,541 Brazil 25,747 25,076 25,237 26,153Canada 37,710 37,629 37,042 37,313 Italy 26,151 27,767 24,285 25,770S. Africa, Rep. 32,321 32,650 30,830 33,230 Ukraine 24,081 22,309 22,332 25,627Sweden 19,909 21,663 21,288 21,893 India 19,282 22,003 23,753 24,579Venezuela 18,216 19,452 18,720 18,660 France 18,031 18,100 17,633 19,767Mexico 13,521 12,910 14,202 14,500 UK 17,286 17,604 17,992 18,489Iran, Islamic R. 4,600 9,080 9,850 12,750 Taiwan, China 11,594 11,605 12,350 15,994Kazakhstan 24,915 36,512 25,000 12,627 Canada 13,897 14,415 14,735 15,554Mauritania 10,443 11,330 11,400 11,700 Turkey 12,624 13,183 13,552 14,491Chile 7,600 7,950 8,480 8,090 Mexico 10,260 12,147 13,172 14,254Peru 6,943 5,975 4,740 5,030 Spain 13,445 13,802 12,154 13,683Turkey 5,079 5,510 5,150 4,800 Poland 11,113 11,890 10,432 11,591Egypt 2,460 2,099 2,700 3,000 Belgium 11,331 11,606 10,818 10,784New Zealand 2,480 2,570 2,600 2,500 Australia 8,424 8,460 8,415 8,831Other 11,792 21,695 13,726 10,418 Other 96,395 99,787 100,118 105,459World 986,651 1,060,125 1,034,358 1,068,809 World 725,207 752,357 750,500 798,970
Source: IISI Source: IISI
Exports of Iron Ore (000 tons) Exports of Semi-finished and Finished Steel (000 tons)1994 1995 1996 1997 1994 1995 1996 1997
Australia 119,285 130,223 128,606 144,914 Russian Fed. 25,645 27,371 26,994 26,120Brazil 125,000 131,358 129,740 140,419 Germany 19,785 20,324 20,437 23,663Canada 29,993 28,833 27,920 32,340 Japan 22,407 22,129 19,262 22,892India 30,638 32,332 31,700 31,900 Bel-Lux 14,926 14,190 14,673 16,459S. Africa, Rep. 19,605 21,847 19,300 20,700 France 12,826 12,796 13,124 14,884Ukraine 21,135 21,015 20,570 20,000 Ukraine 11,638 11,653 11,780 14,406Sweden 15,386 17,083 16,071 18,282 Korea, D.R. 10,029 9,795 10,438 11,739Russian Fed. 18,846 20,218 17,126 17,000 Italy 10,722 10,173 10,922 10,695Mauritania 10,342 11,514 11,158 11,700 UK 8,829 8,896 9,336 9,371Venezuela 10,691 10,609 9,580 9,322 Brazil 11,078 9,655 10,257 9,163Kazakhstan 1,180 3,747 9,270 China 2,566 10,745 7,131 8,765Chile 6,631 6,114 6,911 7,052 Turkey 8,340 6,211 6,697 7,227US 4,972 5,270 6,256 6,336 Netherlands 6,609 6,317 6,481 6,819Philippines 4,329 4,744 4,546 4,500 US 3,656 6,623 4,641 5,568Peru 6,547 6,008 4,029 3,712 Spain 5,994 4,947 5,486 5,556Bahrain 3,000 3,200 2,800 3,000 Mexico 2,246 5,930 5,352 5,452New Zealand 1,279 1,316 1,382 1,300 Taiwan, China 2,817 3,027 3,765 5,119France 2,443 2,185 1,297 580 Canada 4,445 4,716 4,929 4,787Norway 2,064 1,018 611 271 Poland 4,119 3,622 3,709 4,176Korea, D.R. 300 300 200 200 Czech Rep. 4,298 3,703 3,808 4,000Other 2,056 2,388 1,766 209 Other 45,982 45,654 47,039 48,796World 434,542 458,755 445,316 483,007 World 238,957 248,477 246,261 265,657
Source: IISI Source: IISI
april 1999 69

APPENDIX
- Annual Averages- Quarterly Averages -Monthly Averages-Jan-Dec Jan-Dec Jan-Mar Jan-Mar Apr-Jun Jul-Sept Oct-Dec Jan-Mar Jan Feb Mar
Commodity Unit 1997 1998 1999 1998 1998 1998 1998 1999 1999 1999 1999
Coal, Australia $/mt 35.10 29.23 26.10 32.24 30.49 27.76 26.43 26.10 26.10 26.10 26.10Coal, US $/mt 36.39 34.38 33.50 35.24 34.76 34.04 33.50 33.50 33.50 33.50 33.50Crude oil, avg. spot' $1bbl 19.17 13.07 11.79 14.07 13.36 13.01 11.85 11.79 11.45 10.75 13.16Crude oil, Brent* $/bbl 19.09 12.72 11.24 14.08 13.29 12.42 11.09 11.24 11.06 10.20 12.47Crude oil, Dubai' $/bbl 18.10 12.12 11.07 12.44 12.08 12.41 11.56 11.07 10.78 10.05 12.37Crude oil, W. TX Int'l' $/bbl 20.33 14.35 13.05 15.69 14.64 14.16 12.90 13.05 12.49 12.01 14.66Natural gas, Europe $/mmbtu 2.74 2.42 2.00 2.63 2.52 2.37 2.15 2.00 2,02 2.01 1.98Natural gas, US $/mmbtu 2.48 2.09 1.81 2.18 2.24 2.01 1.91 1.81 1.86 1.77 1.79
Agriculture
Cocoa" ¢Ikg 161.9 167.6 139.4 167.8 174.2 169.5 159.1 139.4 145.6 141.1 131.4Coffee, arabica** ¢/kg 416.8 298.1 238.0 377.5 303.5 259.2 252.4 238.0 249.0 232.5 232.3Coffee, robusta-t 0/kg 173.6 182.3 172.7 183.0 192.9 173.5 179.7 172.7 181.4 174.7 161.9Tea, Calcutta auctions't ¢/kg 214.5 216.5 164.2 231.8 229.5 214.5 190.0 164.2 173.5 166.2 152.9Tea, Colombo auctions't oIkg 202.0 207.5 159.6 236.0 215.3 197.3 181.4 159.6 179.9 153.9 145.0Tea, Mombasa auctions" c/kg 201.5 189,9 179.4 254.8 169.0 171.2 164.6 179.4 175.0 177.0 186.3Food
Coconut oil** $/mt 656.8 657.9 736.0 565.0 664.3 662.0 740.3 736.0 763.0 745.0 700.0Copra $/mt 433.8 411.1 457.7 375.7 404.7 404.7 459.3 457.7 471.0 451.0 451.0Groundnut meal $/mt 221.0 116.2 102.3 137.3 114.3 108.0 105.0 102.3 104.0 103.0 100.0Groundnut oil** $/mt 1010.4 909.4 808.0 1011.0 906.3 862.7 857.7 808.0 835.0 813.0 776.0Palm oil"' $/mt 545.8 671.1 563.3 650.3 675.3 679.3 679.3 563.3 632.0 561.0 497.0Palmkernel oil $/mt 651.8 686.7 704.7 605.0 706.3 694.3 741.0 704.7 744.0 709.0 661.0Soybean meal** $Smt 275.8 170.3 145.7 209.7 162.0 149.0 160.7 145.7 152.0 143.0 142.0Soybean oil"* $/ml 564.8 625.9 492.3 637.0 654.0 606.3 606.3 492.3 546.0 487.0 444.0Soybeans"* $/mt 295.4 242.8 210.3 270.3 247.7 224.3 229.0 210.3 221.0 205.0 205.0
Maize" $/mt 117.1 102.0 95.9 114.1 105.8 91.6 96.5 95.9 97.4 94.2 96.2Rice, Thai, 5%"* $/mt 303.5 304.2 278.7 293.8 318.4 322.3 282.2 278.7 299.8 280.0 256.2Rice, Thai, 25% $/mt 257.1 259.9 239.6 246.0 262.0 273.7 257.7 239.6 258.8 239.5 220.6Rice, Thai, 35% $/mt 246.8 249.7 232.9 235.3 249.7 262.1 251.6 232.9 251.8 233.5 213.4Rice,Thai, Al.Special $/mt 210.4 213.0 214.2 188.2 199.8 225.6 238.5 214.2 233.5 212.0 197.2Sorghum*' $/mt 109.6 98.0 90.9 111.2 100.4 90.5 90.0 90.9 91.1 90.1 91.4Wheat, Canada $/mt 181.4 162.9 160.7 168.7 165.3 153.0 164.7 160.7 167.2 159.3 155.4Wheat, US, HRW* $/mt 159.5 126.1 119.9 138.7 126.6 111.6 127.7 119.9 125.3 117.0 117.3Wheat, US, SRW $/mt 143.7 111.5 99.5 129.1 112.6 95.3 109.0 99.5 103.2 95.0 100.2
Other Food,Bananas" $/mt 502.7 491.6 478.4 422.2 567.5 456.5 520.1 478.4 471.2 514.2 449.7Beeftt ¢/kg 185.5 172.6 177.1 181.3 176.1 166.7 166.2 177.1 171.1 180.4 179.9Fishmeal $/mt 606.3 661.9 453.3 694.7 681.3 670.3 601.3 453.3 500.0 454.0 406.0Lamb 0/kg 339.3 275.0 246.7 312.5 272.3 251.1 264.2 246.7 249.6 245.9 244.7Oranges- $/mt 459.0 442.4 420.3 388.2 450.1 516.3 415.1 420.3 417.4 404.0 439.6Shrmp 0/kg 1611.6 1578.9 1413.4 1653.5 1660.8 1574.1 1427.1 1413.4 1418.3 1411.0 1411.0Sugar, EU, domestic" c/kg 62.72 59.75 59.72 59.94 59.59 58.59 60.88 59.72 60.36 59.55 59.24Sugar, US, domestic" 0/kg 48.36 48.64 49.45 48.05 49.15 49.10 48.27 49.45 49.41 49.25 49.69Sugar, wodd"* c/kg 25.06 19.67 15.40 23.57 19.85 17.92 17.34 15.40 17.88 15.04 13.29Raw Materials
Logs, Cameroon $/cum 284.8 286.4 282.3 287.7 282.7 279.4 295.9 282.3 291.2 281.8 273.7Logs, Malaysia" $1cum 238.3 162.4 175.3 196.9 150.2 140.7 162.0 175.3 176.2 177.1 172.5Plywood ¢/sheet 485.0 376.1 427.8 403.6 361.1 344.3 395.2 427.8 441.8 420.0 421.6Sawnwood, Cameroon $/cum 563.6 526.3 461.5 530.5 523.6 519.2 532.0 461.5 508.9 444.1 431.3Sawnwood, Malyasia- $1cum 664.5 484.2 544.3 474.6 476.7 465.5 519.8 544.3 538.5 538.5 555.9Woodpulp $/mt 556.5 508.4 449.7 527.5 540.5 507.5 458.3 449.7 450.7 449.2 449.2
70 GLOBAL COMMODITY MARKETS

APPENDIX
- Annual Averages- Quarterly Averages - Monthly Averages-Jan-Dec Jan-Dec Jan-Mar Jan-Mar Apr-Jun Jul-Sept Oct-Dec Jan-Mar Jan Feb Mar
Commoditv Unit 1997 1998 1999 1998 1998 1998 1998 1999 1999 1999 1999
Other Raw MaerialsCotton** 0/kg 174.8 144.5 123.9 153.9 146.2 150.2 127.5 123.9 123.0 123.9 124.8Jute $/mt 304.6 258.0 250.0 243.3 258.8 260.0 270.0 250.0 250.0 250.0 250.0Rubber, Malaysia* c/kg 101.8 72.2 68.0 74.8 75.3 68.0 70.6 68.0 71.5 68.7 63.7Rubber, US o/kg 121.6 89.5 83.7 92.8 92.0 86.1 87.0 83.7 86.0 85.1 80.1Rubber, Singapore ¢/kg 101.0 70.9 65.5 73.1 73.4 68.3 69.0 65.5 68.1 67.0 61.6Sisal $/mt 776.6 820.8 779.2 778.3 805.0 850.0 850.0 779.2 800.0 787.5 750.0Wool ¢/kg 430.3 336.3 302.9 374.3 350.8 313.0 307.2 302.9 312.6 296.0 295.7FertilizersDAP $/mt 199.9 203.4 199.3 194.6 205.3 209.5 204.4 199.3 201.8 199.5 196.5Phosphate rock" $/mt 41.0 43.0 44.0 43.0 43.0 43.0 43.0 44.0 44.0 44.0 44.0Potassium chloride $/mt 116.5 116.9 119.1 116.5 116.5 116.5 118.1 119.1 118.5 118.5 120.2TSP** $/mt 171.9 173.1 164.1 172.5 175.9 175.0 168.9 164.1 166.4 163.0 163.0Urea, E. Europe, bagged $/mt 127.9 103.1 79.5 110.3 111.7 102.3 88.0 79.5 75.5 77.4 85.8Urea, E. Europe, bulk $/mt 114.0 83.1 67.6 89.7 89.5 84.8 68.3 67.6 63.0 65.6 74.1M4etals and MineralsAluminum- $/mt 1599.3 1357.5 1195.6 1463.0 1363.4 1320.8 1282.7 1195.6 1218.5 1186.9 1181.6Copper-* $/mt 2276.8 1654.1 1406.8 1700.4 1731.3 1639.9 1544.6 1406.8 1431.2 1410.8 1378.4Gold $1toz 331.1 294.2 286.8 294.2 299.9 288.7 293.9 286.8 287.1 287.3 286.0Iron ore** ¢/dmtu 28.88 29.69 26.96 29.69 29.69 29.69 29.69 26.96 26.96 26.96 26.96Lead ¢/kg 62.4 52.9 50.5 53.6 54.8 53.4 49.6 50.5 49.2 51.4 50.8Nicker* $/mt 6927.4 4629.5 4635.5 5424.8 4963.2 4169.4 3960.7 4635.5 4268.8 4626.4 5011.3Silver 0/toz 489.2 553.4 530.2 624.8 571.2 522.0 495.8 530.2 516.2 554.6 519.9Steel products (8) index*** 1990=100 89.1 74.9 64.1 80.4 76.7 73.4 69.0 64.1 65.3 63.1 64.0Steel, cold rolled coilsheet $/mt 448.2 370.8 306.7 416.7 386.7 360.0 320.0 306.7 310.0 300.0 310.0Steel, hot rolled coilsheet $/mt 337.3 279.2 206.7 316.7 293.3 270.0 236.7 206.7 210.0 200.0 210.0Steel, rebar $/mt 325.2 257.5 230.0 296.7 260.0 233.3 240.0 230.0 240.0 230.0 220.0Steel, wire rod $/mt 382.7 332.1 293.3 328.3 336.7 336.7 326.7 293.3 300.0 290.0 290.0Tin** 0/kg 564.7 554.0 524.6 530.9 585.3 561.0 538.9 524.6 511.0 526.9 536.0Zinc** 0/kg 131.6 102.5 99.3 106.3 105.6 102.3 95.6 99.3 93.3 101.7 103.0
Petroleum 83.8 57.1 51.5 61.5 58.4 56.9 51.8 51.5 50.1 47.0 57.5Non-Energy Commodfties 117,6 99.2 89.8 10.9 t01.0 95.2 94.5 9.8 9.3 89.5 87.5Agricufture 128.6 107.8 97.6 116.4 109.7 102.6 102.7 97.6 101.3 97.2 94.4Beverages 170.7 140.6 116.0 164.3 144.2 129.0 124.9 116.0 121.5 114.9 111.7Food 116.1 105.0 95.3 109.1 106.9 101.1 1026 -95.3 100.5 9S.1 90.4Fats and Oils 147.7 132.8 115.6 140.0 132.5 127.2 131.5 115.6 124.7 114.5 107.6Grains 112.1 101.3 94.3 105.7 104.5 98.3 96.5 94.3 99.0 93.5 90.4Other Food 92.4 84.2 79.3 85.8 87.3 81.4 82.4 79.3 81.6 80.0 76.3Raw Materias 113.7 87.3 86.9 90.3 87.7 84:9 86.4 86.9 87.3 86. 6.7Timber 125.8 90.9 101.7 91.9 88.8 86.3 96.7 101.7 100.8 100.9 103.4
Other Raw Materials 105.5 84.9 76.8 89.2 87.0: 83.9 79.4 76.8 78.1 77,1 75.3Fertilizers 119.7 122.1 118.7 121.8 123.4 123.0 120.1 118.7 119.8 118.2 118.2Metals and Minerals 90.2 75.7 67.7 78.7 77.4 74.5 72.0 67.7 67.8 67.7 67.7
included in the Petroleum Index*Ilncluded in the Non-Energy Index***Steel not included in the Non-Energy Index$ = U.S. dollar 0 = U.S. cent bbl = barrel cum = cubic meter dmtu = Dry Metnc Ton Unit kg = kilogram mmbtu = million British thermal units
a,pril 1999 71

APPENDIX
Actual ProjectionsCommodity Unit 1970 1980 1990 1997 1998 1999 2000 2001 2005 2010
Coal, US $/mt n.a. 43.10 41.67 36.39 34.38 33.50 33.50 34.00 36.00 38.50Crude oil, avg. spot $/bbl 1.21 36.87 22.88 19.17 13.07 14.50 16.50 17.00 18.00 19.00Natural gas, Europe $/mmbtu n.a. 3.40 2.55 2.74 2.42 2.10 2.40 2.45 2.50 2.70Natural gas, US $/mmbtu 0.17 1.55 1.70 2.48 2.09 2.00 2.10 2.15 2.35 2.60
AgricultureBeverz20-jpi 0 ''- .... §''' ''''l"'.............. g' e . ; j me= 01 0 0
Cocoa ¢kg 67.5 260.4 126.7 161.9 167.6 135.0 145.0 160.0 200.0 210.0Coffee, other milds 0/kg 114.7 346.6 197.2 416.8 298.1 231.0 243.0 236.0 254.0 265.0Coffee, robusta 0/kg 91.0 324.3 118.2 173.6 182.3 163.0 172.0 176.0 186.0 192.0Tea, 3-auction average ¢/kg 83.5 165.9 205.8 206.0 204.6 177.0 168.0 171.4 179.0 198.0FoodFatsandQils20i<2i g j 2 . 0 . < .;Coconut oil $/mt 397.2 673.8 336.5 656.8 657.9 700.0 650.0 645.0 620.0 650.0Copra $/mt 224.8 452.7 230.7 433.8 411.1 430.0 415.0 425.0 460.0 483.0Groundnut meal $/mt 102.2 240.3 184.8 221.0 116.2 205.0 213.0 215.0 230.0 258.0Groundnut oil $/mt 378.6 858.8 963.7 1010.4 909.4 800.0 800.0 800.0 820.0 850.0Palm oil $/mt 260.1 583.7 289.8 545.8 671.1 500.0 500.0 500.0 450.0 460.0Soybean meal $/mt 102.6 262.4 200.2 275.8 170.3 142.0 146.0 155.0 205.0 226.0Soybean oil $/mt 286.3 597.6 447.3 564.8 625.9 480.0 490.0 500.0 525.0 550.0Soybeans $/mt 116.9 296.2 246.8 295.4 242.8 200.0 205.0 215.0 250.0 275.0
Maize $/mt 58.4 125.3 109.3 117.1 102.0 102.0 108.0 117.0 125.0 130.0Rice, Thai, 5% $/mt 126.3 410.7 270.9 303.5 304.2 280.0 305.0 320.0 335.0 365.0Sorghum $/mt 51.8 128.9 103.9 109.6 98.0 97.0 104.8 113.5 121.3 126.1Wheat, US, HRW $/mt 54.9 172.7 135.5 159.5 126.1 128.0 133.0 145.0 162.0 172.0
Bananas $/mt 166.1 377.3 540.9 502.7 491.6 474.0 480.0 485.0 540.0 579.0Beef 0/kg 130.4 276.0 256.3 185.5 172.6 176.4 180.8 185.2 200.0 220.0Oranges $/mt 168.0 400.2 531.1 459.0 442.4 420.0 525.0 535.0 566.1 605.9Shnmp, Mexican 0/kg n.a. 1,152 1,069 1,612 1,579 1,500 1,450 1,465 1,525 1,590Sugar, world 0/kg 8.22 63.16 27.67 25.06 19.67 14.33 15.43 16.53 23.00 25.00Raw Materials
Logs, Cameroon $/cum 43.0 251.7 343.5 284.8 286.4 275.0 280.0 290.0 350.0 440.0Logs, Malaysia** $/cum 43.1 195.5 177.2 238.3 162.4 177.0 180.0 190.0 230.0 290.0Sawnwood, Malyasia** $/cum 175.0 396.0 533.0 664.5 484.2 560.0 575.0 600.0 720.0 910.0
Cotton 0Ikg 67.6 206.2 181.9 174.8 144.5 128.0 132.0 139.0 192.0 205.0Rubber, RSS1, Malaysia 0/kg 40.7 142.5 86.5 101.8 72.2 66.0 71.0 82.0 110.0 121.0Tobacco $1mt 1,076 2,276 3,392 3,529 3,342 3,000 3,000 3,000 3,250 3,300
DAP $/mt 54.0 222.2 171.4 199.9 203.4 200.0 198.0 200.0 205.0 210.0Phosphate rock S/mt 11.00 46.71 40.50 41.00 43.00 44.00 44.00 44.00 44.00 46.00Potassium chloride $/mt 32.0 115.7 98.1 116.5 116.9 120.0 120.0 120.0 124.0 128.0TSP $/mt 43.0 180.3 131.8 171.9 173.1 160.0 150.0 140.0 150.0 155.0Urea, E. Europe, bagged $/mt 48.0 222.1 130.7 127.9 103.1 85.0 95.0 105.0 135.0 160.0
Aluminum $1mt 556 1,456 1,639 1,599 1,357 1,200 1,250 1,450 1,700 1,900Copper $/mt 1,416 2,182 2,661 2,277 1,654 1,400 1,475 1,700 2,000 2,200Gold $/toz 36.0 608.0 383.5 331.1 294.2 290.0 295.0 300.0 320.0 345.0Iron ore o/dmtu 9.84 28.09 30.80 28.88 29.69 26.96 27.00 28.00 31.00 32.00Lead 0/kg 30.3 90.6 81.1 62.4 52.9 50.0 51.0 54.0 60.0 64.0Nickel $/mt 2,846 6,519 8,864 6,927 4,630 4,400 4,500 4,800 6,000 6,640Silver 0/toz 177.0 2063.6 482.0 489.2 553.4 505.0 500.0 505.0 525.0 550.0Tin ¢/kg 367 1,677 608.5 564.7 554.0 505.0 520.0 550.0 590.0 610.0Zinc a/kg 29.6 76.1 151.4 131.6 102.5 97.5 100.0 105.0 115.0 120.0
n.a. = not availableNote: Projections as of April 25, 1999.Source: World Bank, Development Economics, Development Prospects Group
72 GLOBAL COMMODITY MARKETS

APPENDIX
Commodity Unit 1999 2000 2001 2005
Coal, US $/mt 29.00 - 38.00 26.50 - 40.50 26.00 - 42.00 25.00 - 47.00Crude oil, avg. spot $/bbl 12.00 - 17.00 12.00 - 21.00 11.75 - 22.25 10.75 - 25.25Natural gas, Europe $/mmbtu 1.85 - 2.55 1.80 - 3.00 1.75 - 3.15 1.65 - 3.35Natural gas, US $/mmbtu 1.70 - 2.30 1.60 - 2.60 1.55 - 2.75 1.40 - 3.30
AgricultureBeverages.:;.;.-.5......Cocoa ¢/kg 116 - 155 115- 176 109 - 212 109 - 292Coffee, other milds ¢/kg 193 - 270 186 - 300 154 - 319 134 - 373Coffee, robusta a/kg 137 - 192 134 - 212 119 - 236 113 - 261Tea, 3-auction average ¢/kg 135 - 223 124 - 215 123 - 223 127 - 236FoodFats and OilsCoconut oil $/mt 595 - 821 540 - 829 490 - 871 452 - 930Copra $/mt 369 - 492 341 - 490 318 - 535 296 - 613Groundnut meal $/mt 185 - 226 185 - 242 172 - 259 165 - 296Groundnut oil $/mt 704 - 897 677 - 937 621 - 1009 583 - 1138Palm oil $/mt 440 - 576 430 - 625 393 - 685 326 - 630Soybean meal $/mt 121 - 176 110 - 183 112 - 205 133 - 291Soybean oil $/mt 423 - 548 425 - 610 401 - 684 396 - 735Soybeans $/mt 170 - 248 154 - 256 155 - 284 163 - 355GrainsMaize $/mt 88 - 120 84 - 136 87 - 152 81 - 179Rice, Thai, 5% $/mt 235 - 336 232 - 397 230 - 432 201 - 503Sorghum $/mt 83 - 115 82 - 132 84 - 148 79 - 173Wheat, US, HRW $/mt 110 - 151 104 - 168 107 - 189 105 - 232Other FoodBananas $/mt 417 - 540 408 - 576 378 - 606 378 - 729Beef ¢/kg 138 - 215 136 - 226 133 - 237 130 - 280Oranges $/mt 357 - 487 431 - 641 401 - 669 379 - 753Shrimp, Mexican ¢/kg 1275 - 1740 1189 - 1797 1099 - 1835 1099 - 2044Sugar, world ¢/kg 12 - 18 12 - 19 12 - 22 15 - 35Rlaw MaterialsTimberLogs, Cameroon $/cum 223 - 327 207 - 358 203 - 380 203 - 497Logs, Malaysia** $/cum 145 - 209 133 - 227 137 - 245 138 - 322Sawnwood, Malyasia** $/cum 459 - 661 426 - 736 420 - 780 432 - 1008Other Raw MaterialsCotton a/kg 111 - 145 112 - 153 103 - 174 124 - 259Rubber, RSS1, Malaysia a/kg 59 - 73 61 - 80 65 - 99 77 - 145Tobacco $/mt 2550 - 3450 2340 - 3660 2220 - 3780 2178 - 4323FertlizersDAP $/mt 170 - 236 154 - 250 148 - 260 133 - 277Phosphate rock $/mt 40 - 48 37 - 51 35 - 53 33 - 55Potassium chloride $/mt 102 - 142 94 - 151 89 - 156 81 - 167TSP $/mt 136 - 189 114 - 189 101 - 182 98 - 210Urea, E. Europe, bagged $/mt 72 - 102 72 - 124 76 - 140 95 - 196Metals and Mktls.i-Aluminum $/mt 1020 - 1380 940 - 1500 975 - 1930 1020 - 2380Copper $/mt 1190 - 1610 1105 - 1845 1125 - 2275 1200 - 2800Gold $/toz 250 - 330 225 - 365 200 - 400 200 - 440Iron ore ¢/dmtu 23 - 31 22 - 32 21 - 35 21 - 41Lead a/kg 43- 58 38- 64 36- 72 36 -84Nickel $/mt 3500 - 5300 3375 - 5625 3200 - 6400 3600 - 8400Silver ¢/toz 430 - 580 375 - 625 335 - 675 315 - 735Tin a/kg 430 - 580 390 - 650 365 - 735 355 - 825Zinc a/kg 83- 112 75- 125 70- 140 69 -161
Note: Projections as of April 25, 1999.Source: World Bank, Development Economics, Development Prospects Group
april 1999 73

APPENDIX
Actual ProjectionsCommodity Unit 1970 1980 1990 1997 1998 1999 2000 2001 2005 2010
Coal, US $/mt n.a. 59.88 41.67 33.58 33.00 31.96 31.46 31.16 29.86 28.23Crude oil, avg. spot $/bbl 4.82 51.22 22.88 17.69 12.54 13.83 15.49 15.58 14.93 13.93Natural gas, Europe $/mmbtu n.a. 4.72 2.55 2.53 2.32 2.10 2.25 2.25 2.07 1.98Natural gas, US $/mmbtu 0.68 2.15 1.70 2.29 2.00 1.91 1.97 1.97 1.95 1.91
Agriculture
Cocoa ¢/kg 269.1 361.7 126.7 149.4 160.9 128.8 136.2 146.6 165.9 154.0Coffee, other milds ¢/kg 457.2 481.6 197.2 384.6 286.1 220.4 228.2 216.3 210.7 194.3Coffee, robusta 0/kg 362.8 450.6 118.2 160.2 174.9 155.5 161.5 161.3 154.3 140.8Tea, 3-auction average ¢/kg 332.9 230.5 205.8 190.1 196.4 168.9 157.8 157.1 148.5 145.2Food
Coconut oil $/mt 1583.7 936.1 336.5 606.1 631.5 667.8 610.3 591.0 514.2 476.7Copra $/mt 896.5 629.0 230.7 400.2 394.6 410.2 389.7 389.4 381.5 354.2Groundnut meal $/mt 407.4 333.9 184.8 203.9 111.5 195.6 200.0 197.0 190.7 189.2Groundnut oil $/mt 1509.4 1193.0 963.7 932.3 872.8 763.2 751.2 733.1 680.1 623.4Palm oil $/mt 1036.9 810.9 289.8 503.6 644.1 477.0 469.5 458.2 373.2 337.3Soybean meal $/mt 409.0 364.6 200.2 254.4 163.5 135.5 137.1 142.0 170.0 165.7Soybean oil $/mt 1141.7 830.2 447.3 521.1 600.8 457.9 460.1 458.2 435.4 403.3Soybeans $/mt 466.2 411.5 246.8 272.6 233.07 190.8 192.5 197.0 207.3 201.7
Maize $/mt 232.9 174.0 109.3 108.0 97.9 97.3 101.4 107.2 103.7 95.3Rice, Thai, 5% $/mt 503.6 570.6 270.9 280.0 291.9 267.1 286.4 293.2 277.8 267.7Sorghum $/mt 206.5 179.0 103.9 101.2 94.1 92.5 98.4 104.0 100.6 92.5Wheat, US, HRW $/mt 218.9 240.0 135.5 147.2 121.1 122.1 124.9 132.9 134.4 126.1
Ote Food. . ..Bananas $/mt 662.2 524.1 540.9 463.8 471.8 452.2 450.7 444.4 447.8 424.6Beef ¢/kg 520.1 383.4 256.3 171.2 165.6 168.3 169.8 169.7 165.9 161.3Oranges $/mt 670.0 556.0 531.1 423.5 424.6 400.7 493.0 490.2 469.5 444.4Shnmp, Mexican ¢/kg n.a. 1.600 1,069 1,487 1,515 1,431 1,362 1,342 1,265 1,166Sugar, wold ¢/kg 32.8 87.75 27.67 23.13 18.88 13.67 14.49 15.15 19.07 18.33Raw Materials
Logs, Cameroon $/cum 171.5 349.7 343.5 262.7 274.9 262.4 262.9 265.7 290.3 322.7Logs, Malaysia** $/cum 172.0 271.6 177.2 219.8 155.9 168.9 169.0 174.1 190.7 212.7Sawnwood, Malyasia- $/cum 697.8 550.2 533.0 613.1 464.7 534.3 539.9 549.8 597.1 667.4
Cotton c/kg 269.7 286.5 181.9 161.3 138.7 122.1 123.9 127.4 159.2 150.3Rubber, RSS1, Malaysia 0/kg 162.4 197.9 86.5 93.9 69.3 63.0 66.7 75.1 91.2 88.7Tobacco $/mt 4,290 3,162 3,392 3,256 3,207 2,862 2,817 2,749 2,695 2,420
DAP $/mt 215.3 308.7 171.4 184.5 195.2 190.8 185.9 183.3 170.0 154.0Phosphate rock $/mt 43.86 64.89 40.50 37.83 41.27 41.98 41.31 40.32 36.49 33.73Potassium chlodde $/mt 127.6 160.8 98.1 107.5 112.2 114.5 112.7 110.0 102.8 93.9TSP $/mt 171.5 250.4 131.8 158.6 166.1 152.6 140.9 128.3 124.4 113.7Urea, E. Europe, bagged $/mt 191.4 308.6 130.7 118.0 98.9 81.1 89.2 96.2 112.0 117.3Ms dari Mirierals .
Aluminum S/mt 2,217 2,023 1,639 1,476 1,303 1,145 l,l74 1,329 1,410 1,393Copper $/mt 5,645 3,032 2,661 2,101 1,588 1,336 1,385 1,558 1,659 1,613Gold $/toz 143.5 844.7 383.5 305.5 282.3 276.7 277.0 274.9 265.4 253.0Iron ore ¢/dmtu 39.23 39.02 30.80 26.65 28.50 25.72 25.35 25.66 25.71 23.47Lead c/kg 120.8 125.8 81.1 57.6 50.7 47.7 47.9 49.5 49.8 46.9Nickel $/mt 11,348 9,056 8,864 6,392 4,443 4,198 4,225 4,398 4,976 4,869Silver 0/toz 705.7 2866.9 482.0 451.4 531.2 481.8 469.5 462.8 435.4 403.3Tin 0/kg 1,465 2,330 608.5 521.0 531.8 481.8 488.3 504.0 489.3 447.4Zinc !/kg 118.0 105.8 151.4 121.4 98.3 93.0 93.9 96.2 95.4 88.0
n.a. = not availableNote: Projections as of April 25, 1999.Source: Wodd Bank, Development Economics, Development Prospects Group
74 GLOBAL COMMODITY MARKETS

APPENDIX
Commodity Unit 1999 2000 2001 2005
Coal, US $/mt 27.67 - 36.25 24.88 - 38.03 23.82 - 38.49 20.73 - 38.98Crude oil, avg. spot $/bbl 11.45 - 16.22 11.27 - 19.72 10.77 - 20.39 8.92 - 20.94Natural gas, Europe $/mmbtu 1.76 - 2.43 1.69 - 2.82 1.60 - 2.89 1.37 - 2.78Natural gas, US $/mmbtu 1.62 - 2.19 1.50 - 2.44 1.42 - 2.52 1.16 - 2.74
AgricultureBeverages E -- ::-i Cocoa 0/kg 111 - 148 108 - 165 100 - 194 90 - 242Coffee, other milds 0/kg 184 - 258 175 - 282 141 - 292 111 - 309Coffee, robusta 0/kg 131 - 183 126 - 199 109 - 216 94 - 216Tea, 3-auction average 0/kg 129 - 213 116 - 202 113 - 204 105 - 196FoodFats and OilsCoconut oil $/mt 568 - 783 507 - 778 449 - 798 375 - 771Copra $/mt 352 - 469 320 - 460 291 - 490 245 - 508Groundnut meal $/mt 176 - 216 174 - 227 158 - 237 137 - 245Groundnut oil $/mt 672 - 856 636 - 880 569 - 925 483 - 944Palm oil $/mt 420 - 550 404 - 587 360 - 628 270 - 522Soybean meal $/mt 115 - 168 103 - 171 102 - 187 111 - 241Soybean oil $/mt 404 - 523 399 - 573 367 - 627 328 - 610Soybeans $/mt 162 - 237 144 - 241 142 - 260 135 - 294GrainsMaize $/mt 84 - 115 79 - 128 79 - 139 67 - 148Rice, Thai, 5% $/mt 224 - 321 218 - 372 211 - 396 167 - 417Sorghum $/mt 79 - 109 77 - 124 77 - 135 65 - 144Wheat, US, HRW $/mt 105 - 144 97 - 157 98 - 173 87 - 192Other FoodBananas $/mt 398 - 516 383 - 541 347 - 556 313 - 605Beef o/kg 131 - 205 127 - 212 122 - 217 108 - 232Oranges $/mt 341 - 465 404 - 601 368 - 613 315 - 624Shrmp, Mexican c/kg 1,216 - 1,660 1,116 - 1,687 1,007 - 1,682 911 - 1,695Sugar, world 0/kg 11.6 - 17.0 10.9 - 18.1 10.6 - 20.4 12.8 - 28.6Raw MaterialsTimberLogs, Cameroon $/cum 213 - 312 195 - 337 186 - 348 168 - 412Logs, Malaysia* $/cum 138 - 199 125 - 213 125 - 225 114 - 267Sawnwood, Malyasia** $/cum 438 - 630 400 - 691 385 - 715 358 - 836Other Raw MaterialsCotton 0/kg 106 - 138 105 - 144 94 - 159 103 - 215Rubber, RSS1, Malaysia ¢/kg 56 - 70 57 - 75 60 - 91 64 - 120Tobacco $/mt 2,433 - 3,291 2,197 - 3,437 2,034 - 3,464 1,806 - 3,585Fertilizers :.: ::::: --.. ::.: DAP $/mt 162 - 225 145 - 234 136 - 238 111 - 230Phosphate rock $/mt 38 - 46 35 - 48 32 - 48 27 - 46Potassium chlodde $/mt 97 - 135 88 - 142 81 - 143 67 - 139TSP $/mt 130 - 180 107 - 177 92 - 167 81 - 174Urea, E. Europe, bagged $/mt 69 - 97 68 - 116 69 - 128 78 - 162Metals and MineralsAluminum $/mt 973 - 1,317 883 - 1,408 893 - 1,769 846 - 1,974Copper S/mt 1,135 - 1,536 1,038 - 1,732 1,031 - 2,085 995 - 2,322Gold $/toz 239 - 315 211 - 343 183 - 367 166 - 365Iron ore ¢/dmtu 22 - 29 20 - 30 19 - 32 17 - 34Lead ¢/kg 41- 55 36- 60 33- 66 30 -70Nickel $/mt 3,339 - 5,056 3,169 - 5,282 2,932 - 5,865 2,986 - 6,966Silver ¢/toz 410 - 553 352 - 587 307 - 619 261 - 610Tin 0/kg 410 - 553 366 - 610 334 - 674 294 - 684Zinc ¢/kg 79 - 107 70 - 117 64 - 128 57 134
Note: Projections as of Apdl 25, 1999.Source: World Bank, Development Economics, Development Prospects Group
april 1999 75

APPENDIX_ _i_ _ _ _ *i_~~~momamm
Actual Projections*
1970 1980 1990 1997 1998 1999 2000 2001 2005 2010
Non-Energy Commodiies- 43.9 125.8 100.0 117.6 99.2 88.7 91.4 96.3 110.4 119.6
Ariuu la MM 49,8 .1381 1000 126 1 3 9.6 1 O 119.1 ., 1 Beverages 56.9 181.4 100.0 170.7 140.6 113.0 118.4 119.8 133.4 139.9
Food 46.7 139.3 100.0 116.1 104.9 93.9 97.0 100.4 109.7 115.1
Fats and oils 64.4 148.7 100.0 147.7 132.8 108.1 108.5 111.3 120.4 128.6
Grains 46.7 134.3 100.0 112.1 101.3 97.9 104.5 111.8 119.9 128.0
Other food 32.2 134.3 100.0 92.4 84.2 80.0 83.4 85.2 95.3 96.8
fi;;wna;t rf.K< < .<< 3 5.4 104 ;.8 100.. 13. 8,870 886 62 120.6 139.7Timber 31.8 79.0 100.0 125.8 90.9 102.7 103.0 111.9 134.4 169.8
Other Raw Materials 39.6 122.0 100.0 105.5 84.9 76.3 79.3 85.5 111.2 119.2
W ilges220~~21~ i223. 10g50 77 .4K 05 6iZE 68 >tH1 5.E. .. 2 80gj.9go2
Non-Energy Commodities** 175.2 174.7 100.0 108.5 95.2 84.6 85.8 88.3 91.5 87.7
grculure> 00>K. '8a 191.9 gon j1. f j j j j jj o03 91 93.5 .< 9 98.8*j j j jj't 0 9480
Beverages 226.8 252.1 100.0 157.5 134.9 107.8 111.1 109.8 110.6 102.6
Food 186.2 193.5 100.0 107.1 100.7 89.6 91.1 92.0 91.0 84.4
Fats and oils 256.6 206.6 100.0 136.3 127.5 103.1 101.9 102.0 99.8 94.3
Grains 186.3 186.6 100.0 103.4 97.2 93.4 98.1 102.5 99.4 93.8
Other food 128.5 186.6 100.0 85.2 80.8 76.4 78.3 78.0 79.0 71.0
i <awn Daferi::t 445.2:, '146.3) : i2Q.0 104.0 ... , ~3.8 , . , 83.100.0 102.5
Timber 126.7 109.8 100.0 116.1 87.3 98.0 96.7 102.5 111.4 124.5
Other Raw Matenals 157.8 169.5 100.0 97.3 81.5 72.8 74.5 78.4 92.3 87.4
F.j ttS erfjili.. . j ,2 1791 ii0 0,0 , 1105.2 1172 X 1 105. 98.1 928 8Me4a r3nr 16.2: 13ZtSt ' j < d 0,PU jj,3 722,6S 942 651 70. 736. 7.
MUV index*'**' 25.08 71.98 100.00 108.38 104.19 104.82 106.50 109.13 120.58 136.36
US GDP deflator 32.69 64.53 100.00 119.20 120.41 122.45 124.66 127.40 138.71 153.75o ct *gS'<< r- S0 , A 4 . 704i : 4. e .2 ,64j 2 1.7- 1, f f2ljMI 2.1 M5 2.I08t
*Commodfty price projectbns as of April 25, 1999.
**The World Bank primary commodity price indices are computed based on 1987-89 export values in US dollars for low- and
middle-income economies, rebased to 1990. Weights for the sub-group indices expressed as ratios to the non-energy index
are as follows in percent: agriculture 69.1, fertilizers 2.7, metals and minerals 28.2; beverages 16.9, food 29.4, raw materials 22.8;
fats and oils 10.1, grains 6.9, other food 12.4; timber 9.3 and other raw mterials 13.6.
-**Computed from unrounded data and deflated by the MUV index.
*-Ilnflation indices for 1998-2010 are projections as of September 30, 1998. Data for 1997, US GDP deflator is actual; MUV is a preliminary
estimate. Growth rates for years 1980, 1990, 1997, 2005 and 2010 refer to compound annual rate of change between adjacent
end-point years; all others are annual growth rates from the previous year.
*****Unit value index in US dollar terms of manufactures exported from the G-5 countries (France, Germany, Japan, UK, and US) weightedproportionally to the countries' exports to the developing countries.
Source: Word Bank, Development Prospects Group; Historcal US GDP deflato; US Department of Commerce.
76 GLOBAL COMMODITY MARKETS

DESCRIPTION OF PRICE SERIES
Description of Price Series Soybean oil (Dutch), crude, f.o.b. ex-millSoybeans (US), c.i.f Rotterdam
Coal (Australian), thermal, 12,000 btu/lb, less than 1.0%sulfur, 14% ash, f.o.b. piers, Newcastle/Port Kembla Maize (US), no. 2, yellow, f.o.b. US Gulf ports
Coal (US), thermal, 12,000 btu/lb, less than 1.0% sulfur, Rice (Thai), 5% broken, WR, milled, indicative price based12% ash, f.o.b. piers, Hampton Road/Norfolk on weekly surveys of export transactions (indicative sur-
vey price), government standard, f.o.b. BangkokCrude oil (spot), average spot price of Brent, Dubai andWest Texas Intermediate, equally weighed Rice (Thai), 25% broken, WR, milled indicative survey
price, government standard, f.o.b. BangkokCrude oil (spot), U.K. Brent 38' API, f.o.b. U.K ports
Rice (Thai), 35% broken, WR, milled, indicative surveyCrude oil (spot), Dubai Fateh 32' API, f.o.b. Dubai price, government standard, f.o.b. Bangkok
Crude oil (spot), West Texas Intermediate (WTI) 40' API, Rice (Thai), 100% broken, A. 1 Special, broken kernel ob-f.o.b. Midland Texas tained from the milling of WR 15%, 20%, and 25%, indica-
Natural Gas (Europe), average import border price tive price, goverment standard, fo.b. Bangkok
Natural Gas (U.S.), spot price at Henry Hub, Louisiana Sorghum (US), no. 2 milo yellow, f.o.b. Gulf ports
Cz daily Wheat (Canadian), no. 1, Western Red Spring (CWRS), inCzocoa (ICCO), International Cocoa Organization store,t St. Larne exot piceprice, average of the first three positions on the terminalmarkets ofNew York and London, nearest three future trad- Wheat (US), no. 1, hard red winter, ordinary protein, ex-ing months. port price delivered at the Gulf port for prompt or 30 days
Coffee (ICO), International Coffee Organization indicator shipmentprice, other mild Arabicas, average New York and Bremen/ Wheat (US), no. 2, soft red winter, export price deliveredHamburg markets, ex-dock at the Gulf port for prompt or 30 days shipment
Coffee (ICO), International Coffee Organization indicator Bananas (Central & South American), first-class qualityprice, Robustas, average New York and Le Havre/Marseilles tropical pack, importer's price to jobber or processor, f.o.r.markets, ex-dock US ports
Tea (Calcutta auctions), leaf, include excise duty, arithmetic Beef (Australian/New Zealand), cow forequarters, frozenaverages of weekly quotes. boneless, 85% chemical lean, c.i.f. U.S. port (East Coast),
Tea (Colombo auctions), Sri Lankan origin, all tea, arith- ex-dockmetic averages of weekly quotes. Fishmeal (any origin), 64-65%, c&f Hamburg, nfs
Tea (Mombasa/Nairobi auctions), African origin, all tea, Lamb (New Zealand), frozen whole carcasses, wholesalearithmetic averages of weekly quotes. price, Smithfield market, London
Coconut oil (Philippines/Indonesian), bulk, c.i.f. Rotterdam Oranges (Mediterranean exporters) navel, EEC indicative
Copra (Philippines/Indonesian), bulk, c.i.f. N.W. Europe import price, c.i.f. Paris
Shrimp, (Mexican), frozen, white, No. 1, shell-on, head-Groundnut meal (Argentine), 48/50%, c.i.f. Rotterdam less, 26 to 30 count per pound, wholesale price at New York
Groundnut oil (any origin), c.i.f. Rotterdam Sugar (EU), European Union negotiated import price for
Palm oil (Malaysian), 5% bulk, c.i.f. N. W. Europe raw unpackaged sugar from African, Caribbean and Pacific(ACP) under Lome Conventions, c.I.f. European ports
Palmkernel Oil (Malaysian), c.I.f. RotterdarnSugar (US), import price, nearest future, c.i.f. New York
Soybean meal (any origin), Argentine 45/46% extraction,c.i.f. Rotterdam; prior to 1990, US 44%
april 1999 77

DESCRIPTION OF PRICE SERIES
Sugar (world), International Sugar Agreement (ISA) daily Urea, (varying origins), bagged, spot, fo.b. Eastern Europe
price, raw, f.o.b. and stowed at greater Caribbean pors Urea, (varying origins), bulk, spot, f.o.b. Eastern Europe
Logs (West African), sapele, high quality (loyal andmarchand LM), f.o.b. Cameroon; beginning January 1996, Aluminum (LME) London Metal Exchange, unalloyed pri-LM 80 centimeter or more mary ingots, high grade, minimum 99.7% purity, cash price
Logs (Malaysian), meranti, Sarawak, sale price charged by Copper (LME), grade A, minimum 99.9935% purity, cath-importers, Tokyo; prior to February 1993, average of Sabah odes and wire bar shapes, settlement price
and Sarawak weighted by Japanese import volumes Gold (UK), 99.5% fine, London afternoon fixing, average
Plywood (African and Southeast Asian), Lauan, 3-ply, ex- of daily ratestra, 91 cum x 182 cum x 4 mm, wholesale price, spot To- Iron ore (Brazilian), CVRD Souther System standard sin-kyo ter fines (SSF), 64.2% Fe (iron) content (dry weight) ores,
Sawnwood (Cameroonian), sapele, width 6 inches or more, moisture content 6.5%, contract price to Europe, f.o.b.length 6 feet or more, fa.s. Cameroonian ports Tubarao. Unit dry metric ton unit (dmtu) stands for mt 1%
Fe-unit. To convert price in cents/dmtu to $/dmt SSF (drySawnwood (Malaysian), dark red seraya/meranti, select and ore), multiply by percent Fe content. For example, 28.88better quality, General Market Specification (GMS), width cents/dmtu is $18.54 /dmt SSF. To convert to wet mt SSF6 inches or more, average 7 to 8 inches; length 8 inches or (natural or wet ore), multiply by percent Fe content by (Imore, average 12 to 14 inches; thickness I to 2 inch(es); minus percent moisture content). 28.88 cents /dmtu is $17.34kiln dry, c. & f. UK ports /Wet mt SSF. Iron ore in most countries is traded in terms
of dry mt, and shipped in wet mt. For 1989-96, Fe contentWoodpulp (Swedish), softwood, sulphate, bleached, air-dry was 64.3% and moisture content 6.9%weight, c.i.f. North Seaports
L,ead (LME), refined, 99.97% purity, settlement priceCotton ("cotton outlook", "A" index), middling 1-3/32 inch,c.i.f. Europe Nickel (LME), cathodes, minimum 99.8% purity, official
morning session, weekly average bid/asked priceJute (Bangladesh), raw, white D, f.o.b. Chittagong/Chalna
Silver (Handy & Harman), 99.9% grade refined, New YorkRubber (Malaysian), RSS no. 1, in bales, Malaysian Rub-ber Exchange & Licensing Board, midday buyers' asking Steel products price index, 1990=100, (Japanese), compositeprice for prompt or 30 days delivery, fo.b. Kuala Lumpur price index for eight selected steel products based on quo-
tations fo.b. Japan excluding shipments to the United StatesRubber (any origin), RSS no. 1, in bales, Rubber Traders and China, weighted by product shares of apparent corn-Association (RTA), spot, New York bined consumption (volume of deliveries) at Germany, Ja-
Rubber (Asian), RSS no. 1, in bales, Rubber Association pan and the United States. The eight products are as fol-of Singapore Commodity Exchange (RASCE)/ Singapore low: rebar (concrete reinforcing bars), merch bar (merchantCommodity Exchange, midday buyers' asking price for bars) wire rod, section (H-shape), plate (medium), hot rolledprompt or 30 days delivery; prior to June 1992, spot, coil/sheet, cold rolled coil/sheet, and galvanized iron sheetSingapore Tin (LME), refined, 99.85% purity, settlement price
Sisal (East African), UG (rejects), c.i.f. UK Zinc (LME), special high grade, minimum 99.995% purity,
Wool (Dominion), crossbred, 56's, clean, c.i.f. UK weekly average bid/asked price, official morning session;Wool(Doinin),rosb 5's cn cprior to April 1990, high grade, minimum 99.95% purity,
DAP (diammonium phosphate), bulk, spot, fo.b. US Gulf settlement price
Phosphate rock (Moroccan), 70% BPL, contract, f.a.s.Casablanca
Potassium chloride (muriate of potash), standard grade,spot, f.o.b. Vancouver
TSP (triple superphosphate), bulk, spot, f.o.b. US Gulf
78 GLOBAL COMMODITY MARKETS

DEFINITIONS AND NOTES
Definitions and Notes
Constant prices are prices which are deflated by the Manufactures Unit Value Index (MUV), with a base of1990=100. The MUV is the unit value index in US dollar terms of manufactures exported from the G-5countries (France, Germnany, Japan, UK, and US), weighted proportionally to the countries' exports to thedeveloping countries.
Current prices are actual market prices which are not adjusted for inflation or exchange rate changes.
Dollars are US dollars unless otherwise specified.
Futures prices shown in this report are closing prices as of the date noted. The prices are converted to the sameunits as the monthly data for comparison purposes, however they are not adjusted for quality or transportation.Thus, the futures prices will often have a significant margin from the actual monthly prices, but this marginshould not be interpreted as the expected direction of future price movements. Rather, it is the path of futuresprices which is considered to have economic meaning by many commodity analysts.
Growth rates, except where noted, are computed by least squares regression.
Price indexes were computed by the Laspeyres formula. The Non-Energy Price Index is comprised of 33commodities. U.S. dollar prices of each commodity are weighted by 1987-89 average export values. Baseyear reference for all indexes is 1990. Countries comprised of all low and middle income economies accord-ing to World Bank income classification. Details are shown in Table Al Commodity Price Data.
Regions are classified according to World Bank analytical groupings.
Reporting period. Calendar vs. crop or marketing year refers to the span of the year. It is common in manyagricultural commodities to refer to production and other variables over the twelve month period which beginswith harvest. A crop or marketing year will often differ by commodity and also by country. Other commodi-ties such as metals use a calendar year.
Tons refer to metric tons (1,000 kilograms) unless otherwise noted.
april 1999 79

ACRONYMS AND ABBREVIATIONS
API American Petroleum Institute kt thousand tonbbl barrel lb poundBP British Petroleum LIBOR London Interbank Offer RateBel-Lux Belgium/Luxemburg LIFFE London International Financial and Fu-c.i.f. cost, insurance, and freight tures and Options ExchangeCBOT Chicago Board of Trade LME London Metal ExchangeCSCE Coffee, Sugar, and Cocoa Exchange mb/d million barrels per daycum cubic meter MGE Minneapolis Grain ExchangeCVRD Companhia Vale do Rio Doce mmbtu millions of British thermal unitsdmtu dry metric ton unit mt metric tondwt dead weight ton mtoe million tons of oil equivalentf.o.b. free on board MUV Manufactures unit valuef.o.r. free on rail n.a. data not availableFAO Food and Agriculture Organization of the NIKKEI Nihon Keizai Shimbun, Inc.
United Nations nil. data less than half the unit shownFSU Former Soviet Union NMFS The National Marine Fisheries ServiceG-5 France, Germany, Japan, United Kingdom, NYCE New York Cotton Exchange
and United States NYMEX New York Mercantile ExchangeG-7 G-5 plus Canada and Italy OECD Organization for Economic CooperationGATT General Agreement on Tariffs and Trade and DevelopmentGDP Gross domestic product OPEC Organization of Petroleum ExportingGNP Gross national product Countriesha hectare PNG Papua New GuineaICAC International Cotton Advisory Committee SDR Special drawing rightICCO International Cocoa Organization SICOM Singapore Commodity ExchangeICO International Coffee Organization ton metric tonIEA International Energy Agency UAE United Arab EmiratesIGC International Grains Council UN United NationsIISI International Iron and Steel Institute UJNCTAD United Nations Conference on Trade andIMF International Monetary Fund DevelopmentINRO International Natural Rubber Organization US DOE US Department of EnergyIRSG International Rubber Study Group USDA US Department of AgricultureISO International Sugar Organization WBMS World Bureau of Metal StatisticsITC International Tea Committee WFP World Food ProgrammeITTO International Tropical Timber Organization WHO World Health Organizationkg kilogram WSJ The Wall Street JournalKLCE Kuala Lumpur Commodity Exchange WTO World Trade Organization
80 GLOBAL COMMODITY MARKETS

Subscription Information
Global Commodity Markets is published by the World Bank's Development ProspectsGroup. Each quarterly issue provides authoritative market reviews for 25 to 30 impor-tant commodities, price forecasts for more than 40 commodities, a feature article on
the major issues affecting commodity markets, and current and recent prices for morethan 80 primary commodities.
Full-service subscribers receive a monthly electronic update and have access to theelectronic edition, posted 10 to 15 days in advance of the mailing of the print copy.
YES! Sign me up for Global Commodity Markets (Check boxes below) Payment: Note that orders from indi-
3 1999 quarterly at $495 a year (print only)* viduals must be accompanied bypayment or credit card information.
l: 1999 full-service subscription at $645 a year* Credit cards accepted only for orders(includes 4 quarterlies, 12 electronic monthly updates, and electronic access to the quarterly) addressed to the World Bank. Check
with your local distributor about*1999 subscriptions are for a calendar year and will be pro-rated on a quarterly basis acceptable credit cards. Please do not
send cash.Name
Title O Bill meInstitutional customers in the US only.(Please include purchase order)
Address
City State ZipPhone _________________Fax________ ____________________________________ IMPORTANT: To receive notifica-Phone Fax tion of your FREE Monthly
E-mail Updates, please include yourE-mail address and Fax number!
O Check No. in the amount of $ is enclosed. When ordering directly fromthe World Bank, make check payable in U.S. funds only drawn on a U.S. bank to: The World Bank.Please send your check with your order.
O Charge $ to my: OJ American Express O MasterCard O VISA
Card number Expiration Date
Name(As it appears on the card. Required on all credit card charges.)
Signature
Mail or tax order to: The World Bank P.O. Box 7247-7956. Philadelphia, PA 19170-7956, USA.Phone: 201-476-2192. Fax: 201-476-2197. E-mail: [email protected];
Order online: http://www.worldbank.org/html/extdr/pubs.htmGloOl


THE WORLD BANK
18 i 8 H Street, N.W.
Washington, D.C. 20433 USA
Telephone: 202-477-1234
Facsimile: 202-477-6391
Telex: MCI 64145 WORLDBANK
MCI 248423 WORLDBANK
World Wide Web: http://www.worldbank.org/
E-mail: [email protected]
Global Commodity Markets is published by the Commodities Team of the World Bank'sDevelopment Prospects Group. Each quarterly issue provides authoritative marketreviews of 25 to 30 important commodities, price forecasts for more than 40commodities, a feature article on the major issues affecting commodity markets,and current and recent prices for more than 80 primary commodities.
Full-service subscribers receive a monthly electronic update and have access to theelectronic edition, posted 10 to 15 days in advance of the mailing of the print copy.
(01999 The International Bank for Reconstruction
anid Development/The World Bank li i11HilHll All righs lreserved.l.. ..l l. . 1 1 XNlanufactured in the LUnited States of AmericaVol. 7, No. 2ISSN 1020-7/21X ISBN 0-8213-4516-8