43 hendrik...
TRANSCRIPT
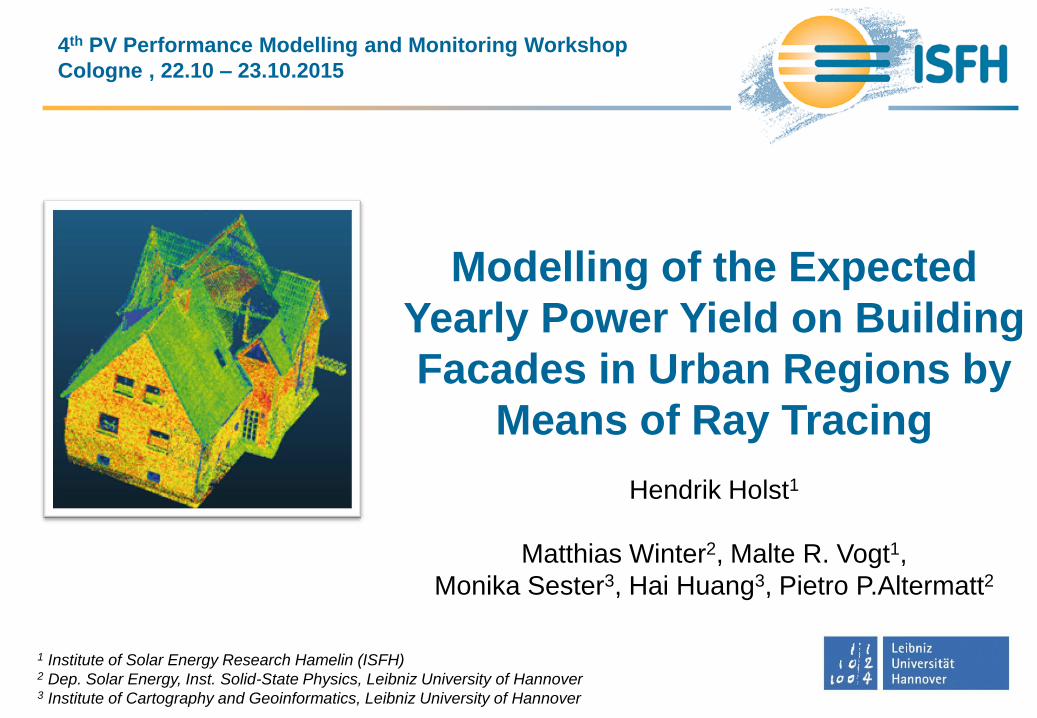
Modelling of the Expected
Yearly Power Yield on Building
Facades in Urban Regions by
Means of Ray Tracing
Hendrik Holst1
Matthias Winter2, Malte R. Vogt1,
Monika Sester3, Hai Huang3, Pietro P.Altermatt2
4th PV Performance Modelling and Monitoring Workshop
Cologne , 22.10 – 23.10.2015
1 Institute of Solar Energy Research Hamelin (ISFH) 2 Dep. Solar Energy, Inst. Solid-State Physics, Leibniz University of Hannover 3 Institute of Cartography and Geoinformatics, Leibniz University of Hannover
Overview
• Advantages of facades
• The ray tracing framework DAIDALOS
• Modelling daylight, including its spectral
and angular distribution
• Simulation of buildings in the urban hinterland
and in the city
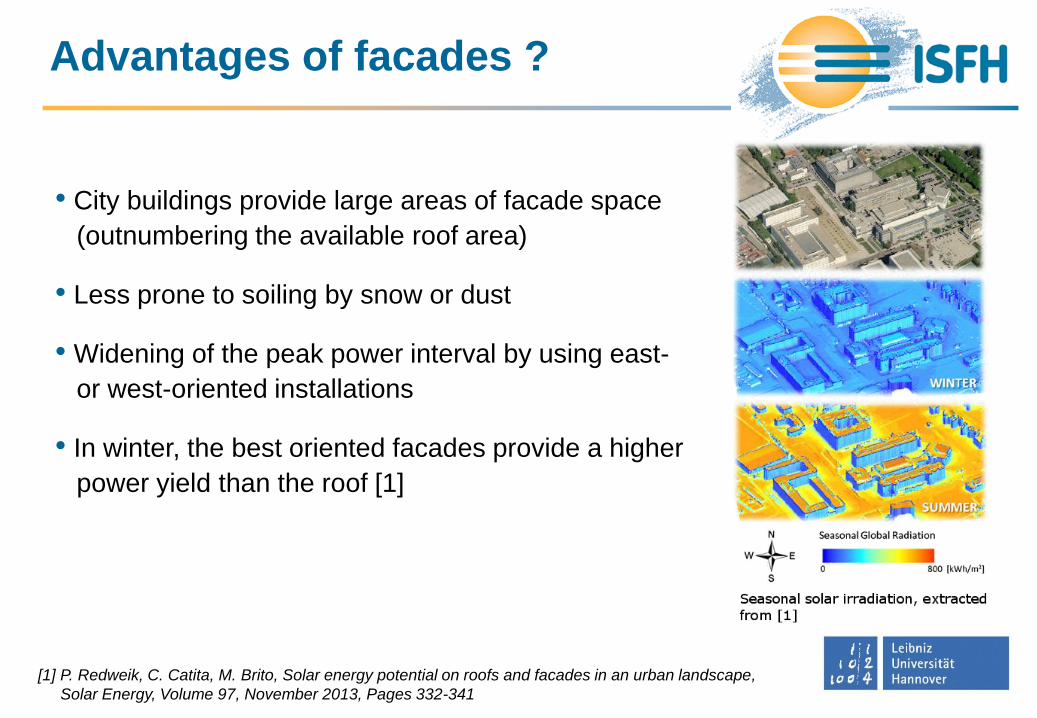
[1] P. Redweik, C. Catita, M. Brito, Solar energy potential on roofs and facades in an urban landscape,
Solar Energy, Volume 97, November 2013, Pages 332-341
Advantages of facades ?
• City buildings provide large areas of facade space
(outnumbering the available roof area)
• Less prone to soiling by snow or dust
• Widening of the peak power interval by using east-
or west-oriented installations
• In winter, the best oriented facades provide a higher
power yield than the roof [1]
Daidalos
–
A modular ray tracer
Daidalos – A modular ray tracer
[1] Brendel, R., Sunrays: a versatile ray tracing program for the photovoltaic community, EUPVSEC 1994
[2] Cotter, J.E., RaySim 6.0: a free geometrical ray tracing program for silicon solar cells, PVSC 2005
[3] Holst, H et al., Application of a New Ray Tracing Framework to the Analysis of Extended Regions in Si Solar
Cell Modules, Energy Procedia, 2013
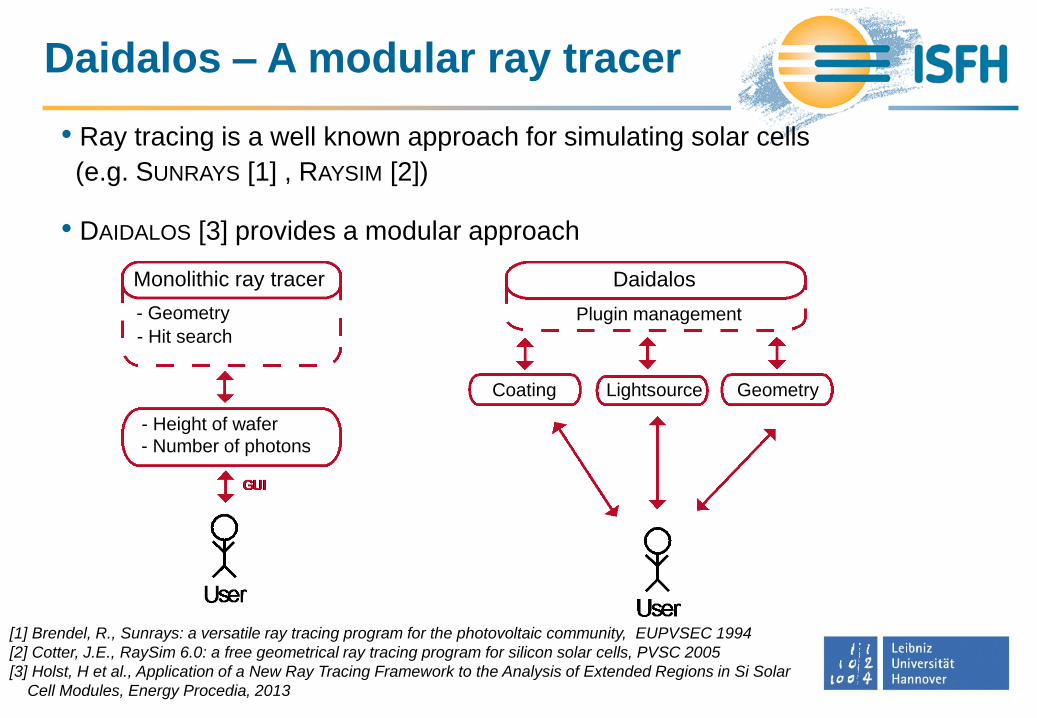
• Ray tracing is a well known approach for simulating solar cells
(e.g. SUNRAYS [1] , RAYSIM [2])
• DAIDALOS [3] provides a modular approach

[1] Brendel, R., Sunrays: a versatile ray tracing program for the photovoltaic community, EUPVSEC 1994
[2] Cotter, J.E., RaySim 6.0: a free geometrical ray tracing program for silicon solar cells, PVSC 2005
[3] Holst, H et al., Application of a New Ray Tracing Framework to the Analysis of Extended Regions in Si Solar
Cell Modules, Energy Procedia, 2013
Monolithic ray tracer
- Height of wafer
- Number of photons
- Geometry
- Hit search
• Ray tracing is a well known approach for simulating solar cells
(e.g. SUNRAYS [1] , RAYSIM [2])
• DAIDALOS [3] provides a modular approach
Daidalos – A modular ray tracer
• Ray tracing is a well known approach for simulating solar cells
(e.g. SUNRAYS [1] , RAYSIM [2])
• DAIDALOS [3] provides a modular approach
[1] Brendel, R., Sunrays: a versatile ray tracing program for the photovoltaic community, EUPVSEC 1994
[2] Cotter, J.E., RaySim 6.0: a free geometrical ray tracing program for silicon solar cells, PVSC 2005
[3] Holst, H et al., Application of a New Ray Tracing Framework to the Analysis of Extended Regions in Si Solar
Cell Modules, Energy Procedia, 2013
Monolithic ray tracer
- Height of wafer
- Number of photons
- Geometry
- Hit search
Daidalos
Lightsource Coating Geometry
Plugin management
Daidalos – A modular ray tracer
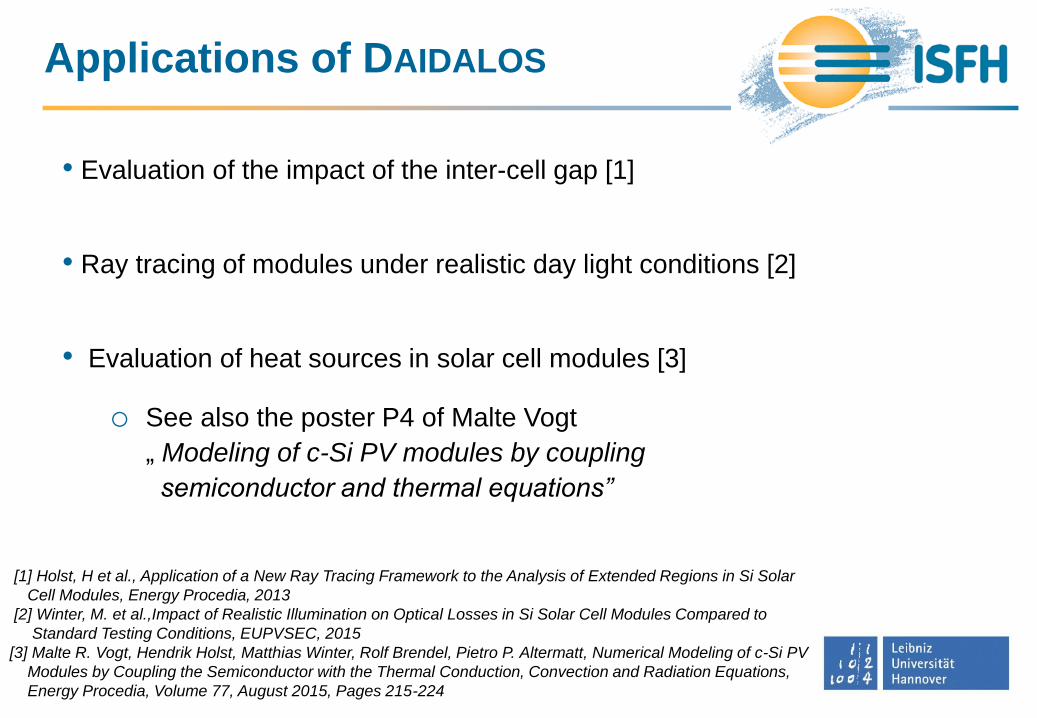
• Evaluation of the impact of the inter-cell gap [1]
• Ray tracing of modules under realistic day light conditions [2]
• Evaluation of heat sources in solar cell modules [3]
o See also the poster P4 of Malte Vogt
„ Modeling of c-Si PV modules by coupling
semiconductor and thermal equations”
[1] Holst, H et al., Application of a New Ray Tracing Framework to the Analysis of Extended Regions in Si Solar
Cell Modules, Energy Procedia, 2013
[2] Winter, M. et al.,Impact of Realistic Illumination on Optical Losses in Si Solar Cell Modules Compared to
Standard Testing Conditions, EUPVSEC, 2015
[3] Malte R. Vogt, Hendrik Holst, Matthias Winter, Rolf Brendel, Pietro P. Altermatt, Numerical Modeling of c-Si PV
Modules by Coupling the Semiconductor with the Thermal Conduction, Convection and Radiation Equations,
Energy Procedia, Volume 77, August 2015, Pages 215-224
Applications of DAIDALOS
Modelling of
daylight
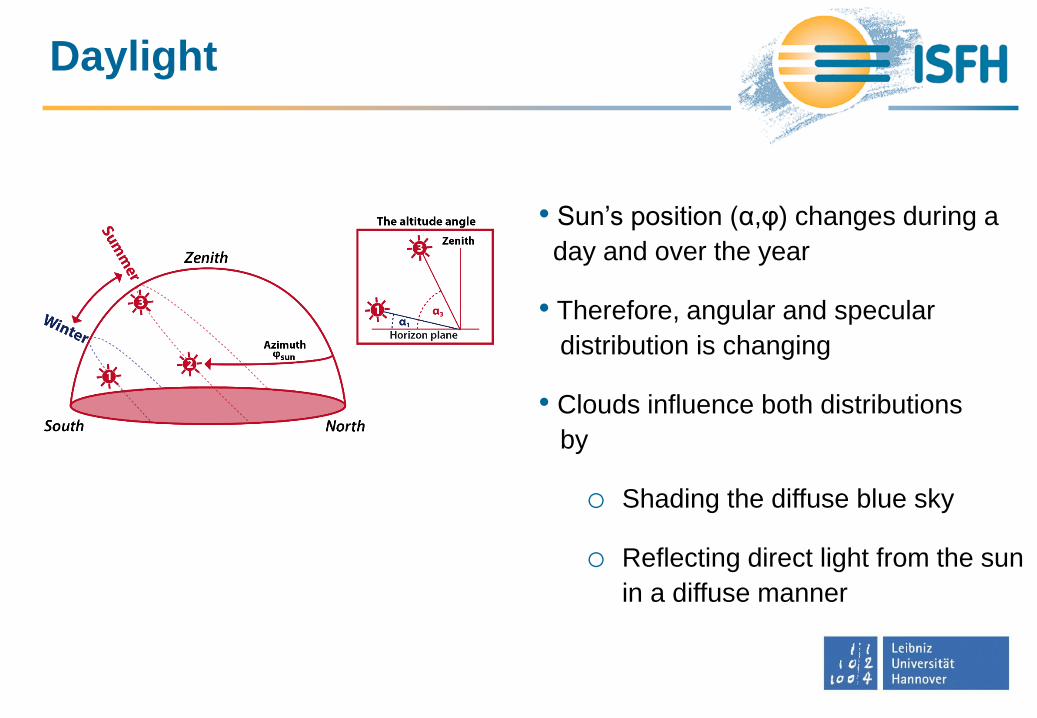
Daylight
• Sun’s position (α,φ) changes during a
day and over the year
• Therefore, angular and specular
distribution is changing
• Clouds influence both distributions
by
o Shading the diffuse blue sky
o Reflecting direct light from the sun
in a diffuse manner
Irradiance measurements
• Global and diffuse irradiance are
measured at many locations
(e.g. see the National Solar Radiation
Database [1])
[1] http://rredc.nrel.gov/solar/old_data/nsrdb/
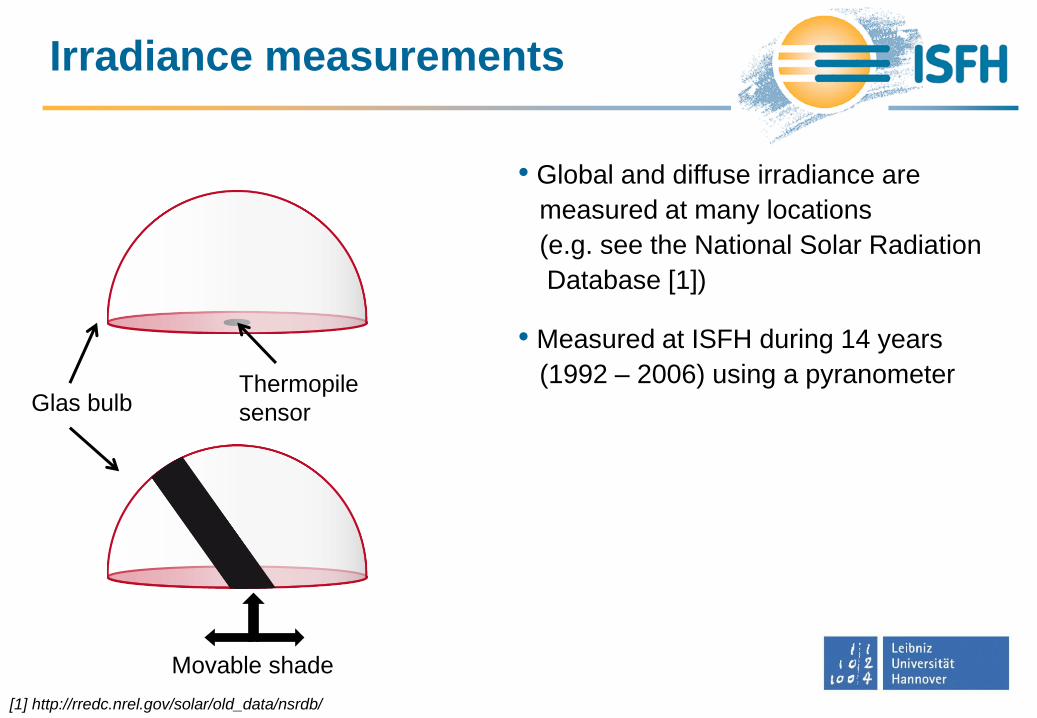
Irradiance measurements
Movable shade
Thermopile
sensor Glas bulb
• Global and diffuse irradiance are
measured at many locations
(e.g. see the National Solar Radiation
Database [1])
• Measured at ISFH during 14 years
(1992 – 2006) using a pyranometer
[1] http://rredc.nrel.gov/solar/old_data/nsrdb/
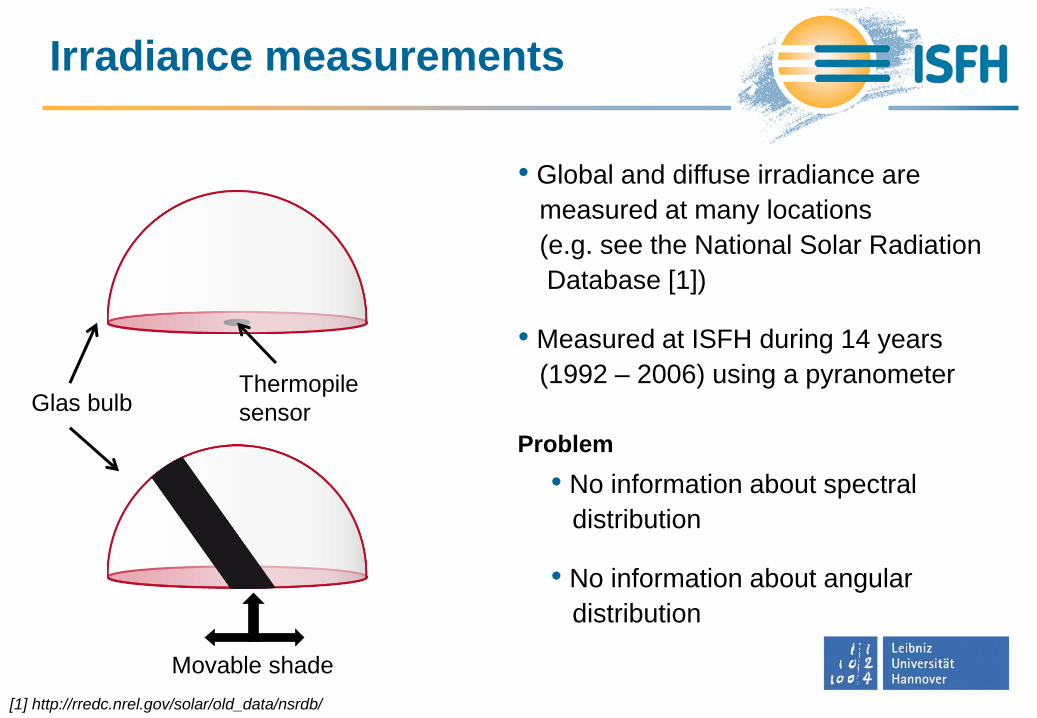
Irradiance measurements
• Global and diffuse irradiance are
measured at many locations
(e.g. see the National Solar Radiation
Database [1])
• Measured at ISFH during 14 years
(1992 – 2006) using a pyranometer
Movable shade
Thermopile
sensor Glas bulb
Problem
• No information about spectral
distribution
• No information about angular
distribution
[1] http://rredc.nrel.gov/solar/old_data/nsrdb/
Calculating spectral distribution
[1] Gueymard,C., SMARTS2, A Simple Model of the Atmospheric Radiative Transfer of Sunshine: Algorithms and
performance assessment, Techreport, Florida Solar Energy Center 1995
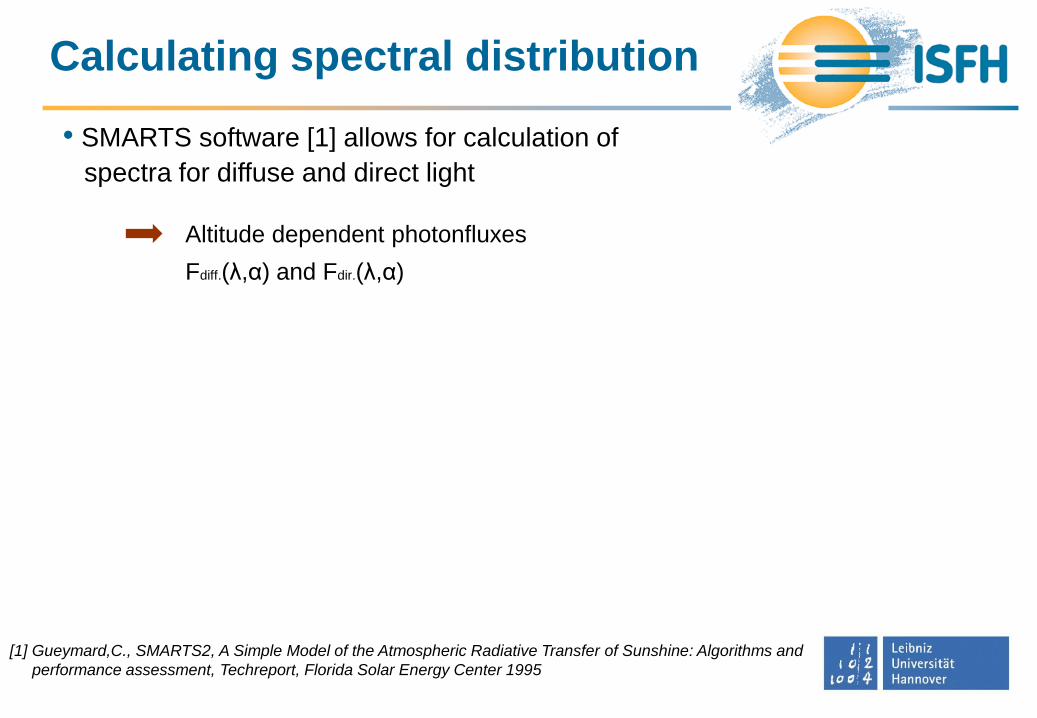
• SMARTS software [1] allows for calculation of
spectra for diffuse and direct light
Fdiff.(λ,α) and Fdir.(λ,α)
Altitude dependent photonfluxes
Calculating angular distribution
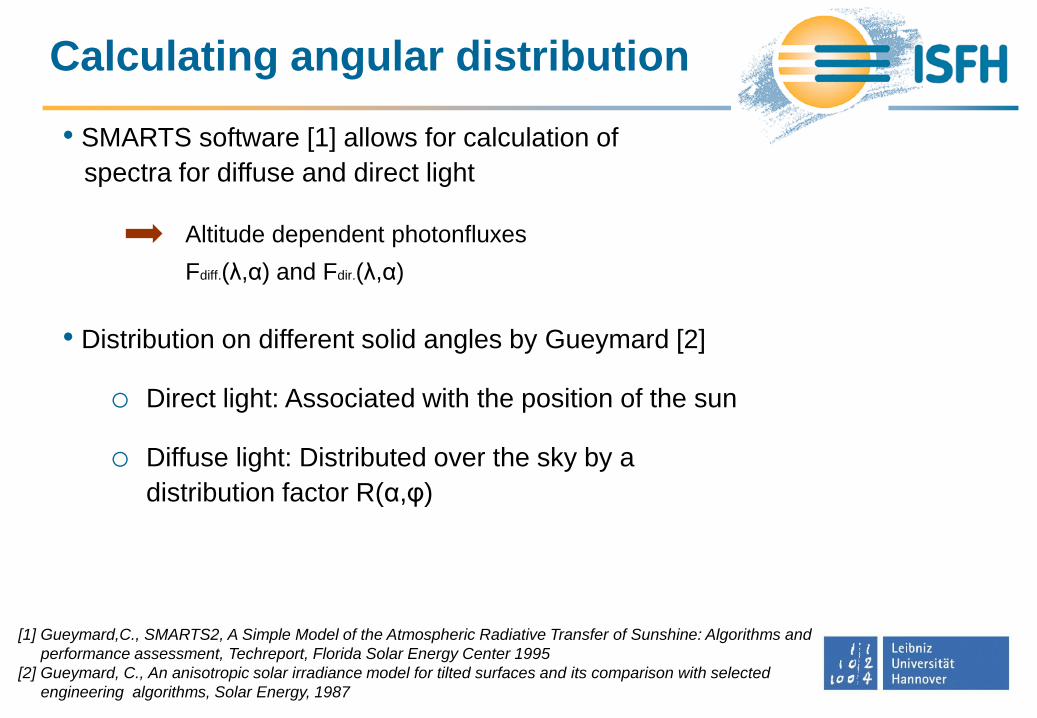
• SMARTS software [1] allows for calculation of
spectra for diffuse and direct light
[1] Gueymard,C., SMARTS2, A Simple Model of the Atmospheric Radiative Transfer of Sunshine: Algorithms and
performance assessment, Techreport, Florida Solar Energy Center 1995
[2] Gueymard, C., An anisotropic solar irradiance model for tilted surfaces and its comparison with selected
engineering algorithms, Solar Energy, 1987
Fdiff.(λ,α) and Fdir.(λ,α)
Altitude dependent photonfluxes
• Distribution on different solid angles by Gueymard [2]
o Direct light: Associated with the position of the sun
o Diffuse light: Distributed over the sky by a
distribution factor R(α,φ)
Calculating angular distribution
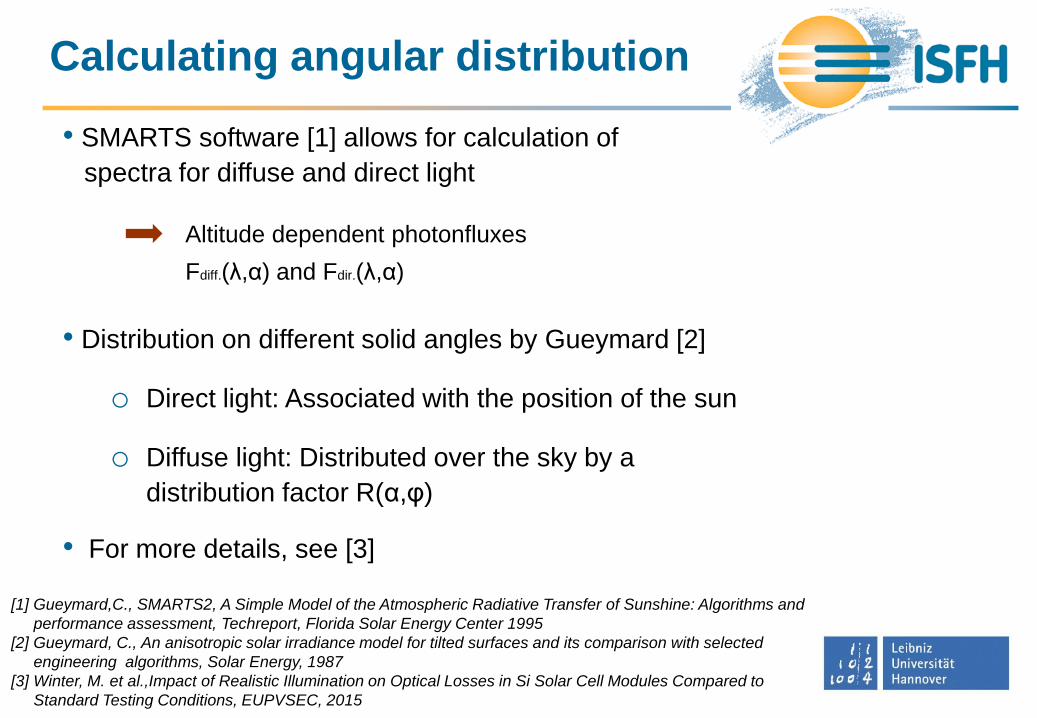
• SMARTS software [1] allows for calculation of
spectra for diffuse and direct light
[1] Gueymard,C., SMARTS2, A Simple Model of the Atmospheric Radiative Transfer of Sunshine: Algorithms and
performance assessment, Techreport, Florida Solar Energy Center 1995
[2] Gueymard, C., An anisotropic solar irradiance model for tilted surfaces and its comparison with selected
engineering algorithms, Solar Energy, 1987
[3] Winter, M. et al.,Impact of Realistic Illumination on Optical Losses in Si Solar Cell Modules Compared to
Standard Testing Conditions, EUPVSEC, 2015
Fdiff.(λ,α) and Fdir.(λ,α)
Altitude dependent photonfluxes
• Distribution on different solid angles by Gueymard [2]
o Direct light: Associated with the position of the sun
o Diffuse light: Distributed over the sky by a
distribution factor R(α,φ)
• For more details, see [3]
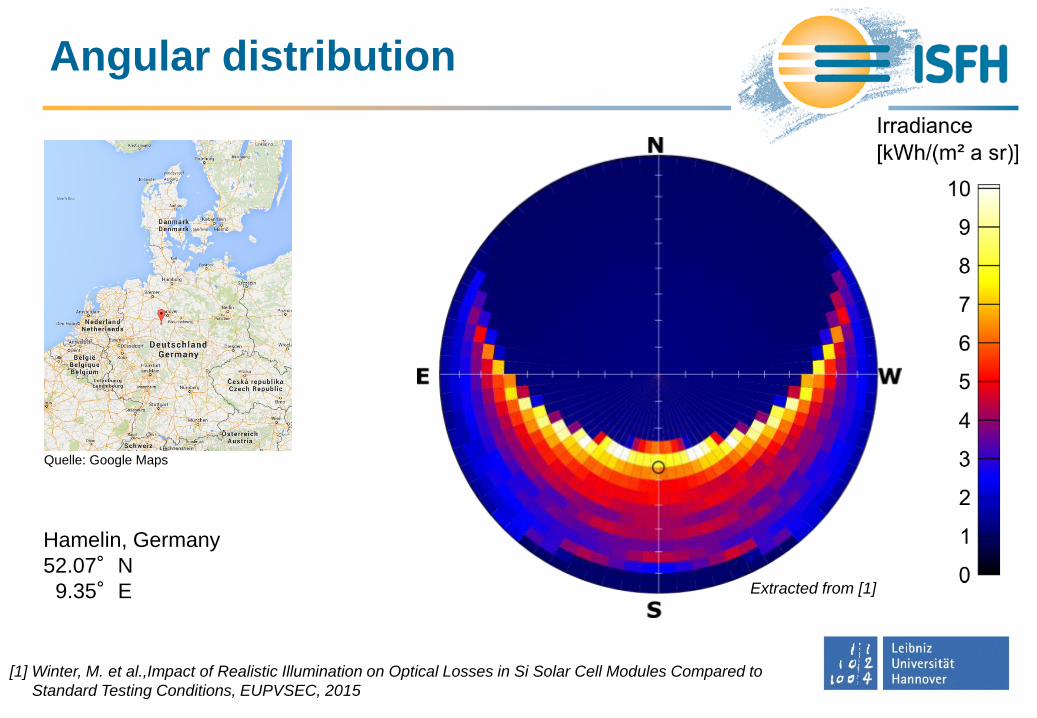
Angular distribution
Hamelin, Germany
52.07°N
9.35°E
Quelle: Google Maps
[1] Winter, M. et al.,Impact of Realistic Illumination on Optical Losses in Si Solar Cell Modules Compared to
Standard Testing Conditions, EUPVSEC, 2015
Extracted from [1]
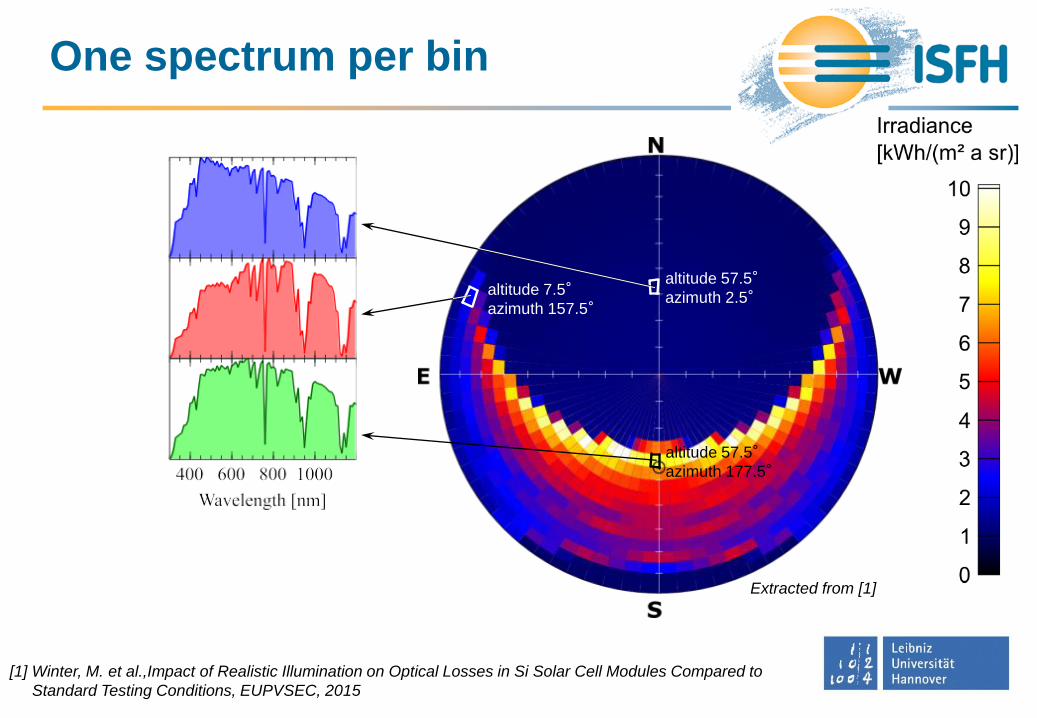
altitude 57.5°
azimuth 177.5°
altitude 7.5°
azimuth 157.5°
altitude 57.5°
azimuth 2.5°
One spectrum per bin
Extracted from [1]
[1] Winter, M. et al.,Impact of Realistic Illumination on Optical Losses in Si Solar Cell Modules Compared to
Standard Testing Conditions, EUPVSEC, 2015
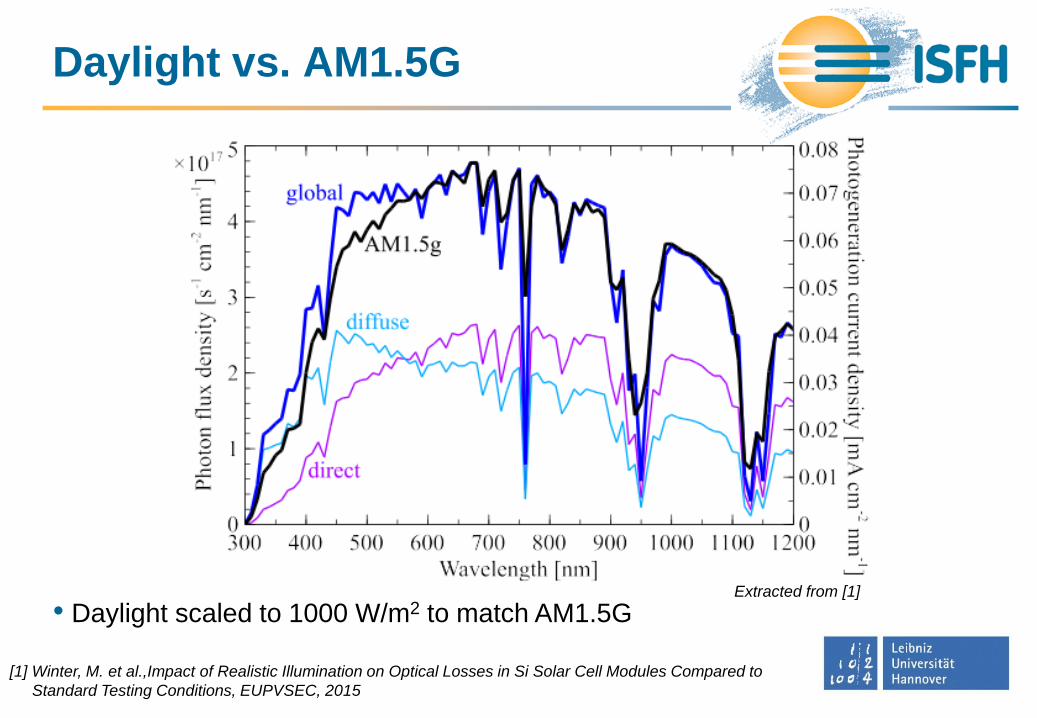
Daylight vs. AM1.5G
• Daylight scaled to 1000 W/m2 to match AM1.5G
[1] Winter, M. et al.,Impact of Realistic Illumination on Optical Losses in Si Solar Cell Modules Compared to
Standard Testing Conditions, EUPVSEC, 2015
Extracted from [1]
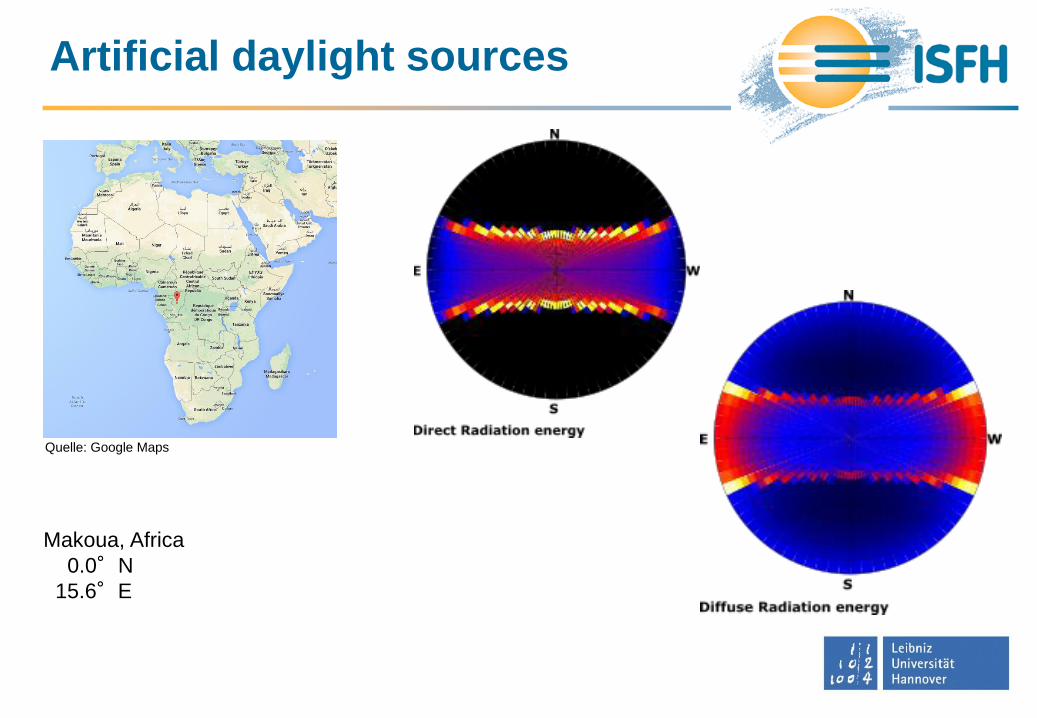
Artificial daylight sources
Quelle: Google Maps
Makoua, Africa
0.0°N
15.6°E
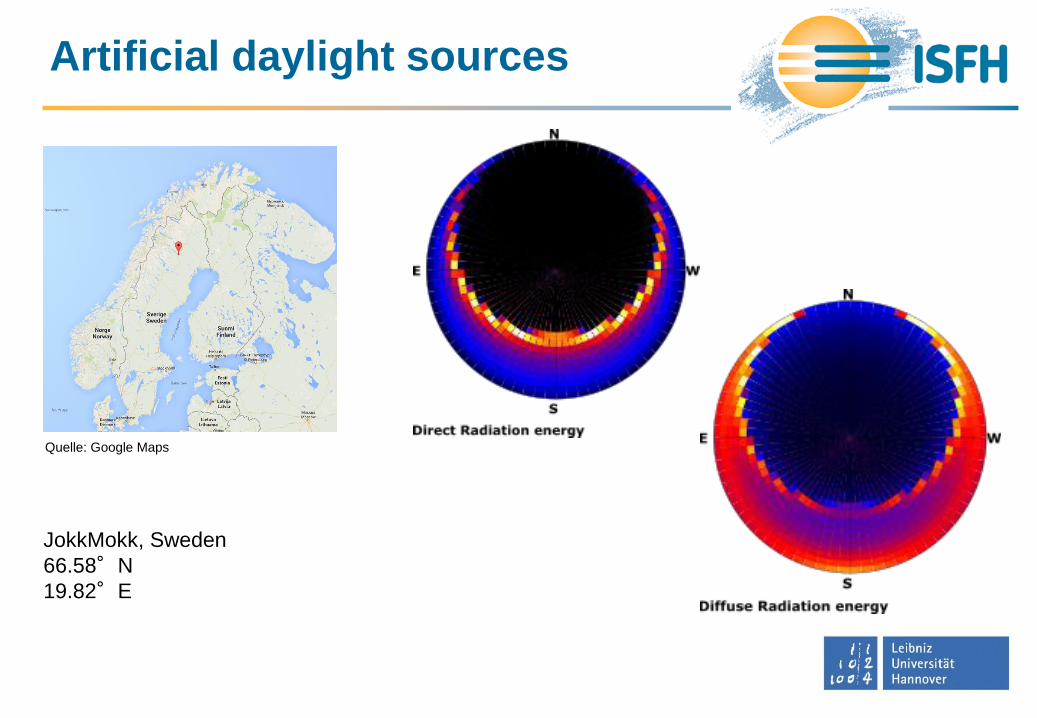
Artificial daylight sources
Quelle: Google Maps
JokkMokk, Sweden
66.58°N
19.82°E
Simulation of buildings
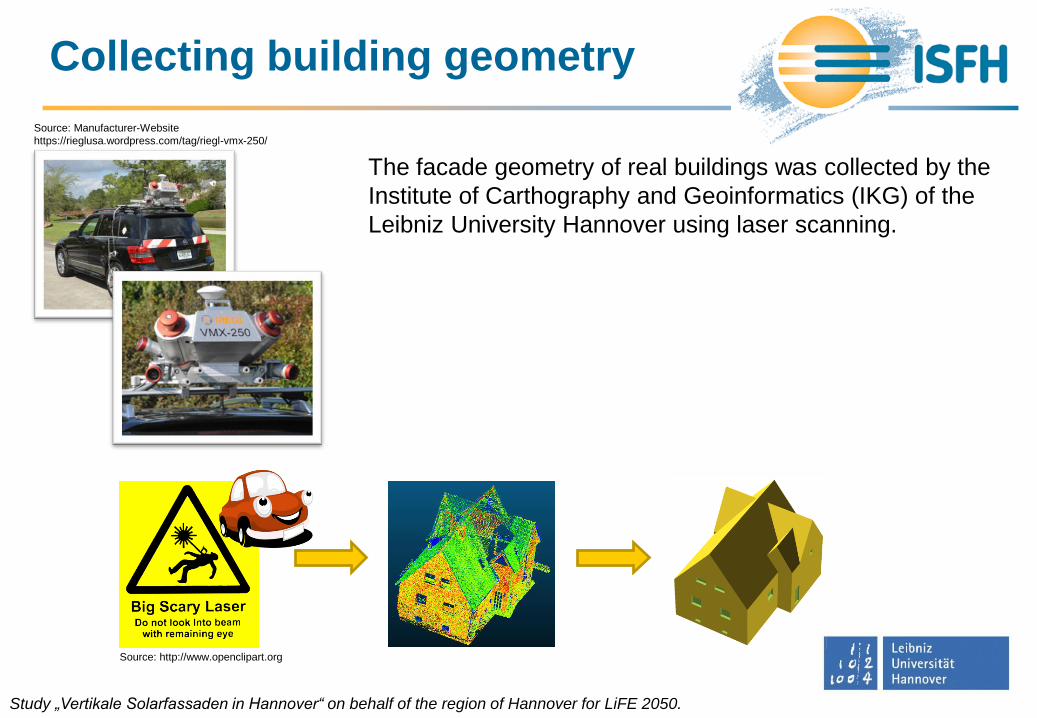
Collecting building geometry
Source: http://www.openclipart.org
Source: Manufacturer-Website
https://rieglusa.wordpress.com/tag/riegl-vmx-250/
Study „Vertikale Solarfassaden in Hannover“ on behalf of the region of Hannover for LiFE 2050.
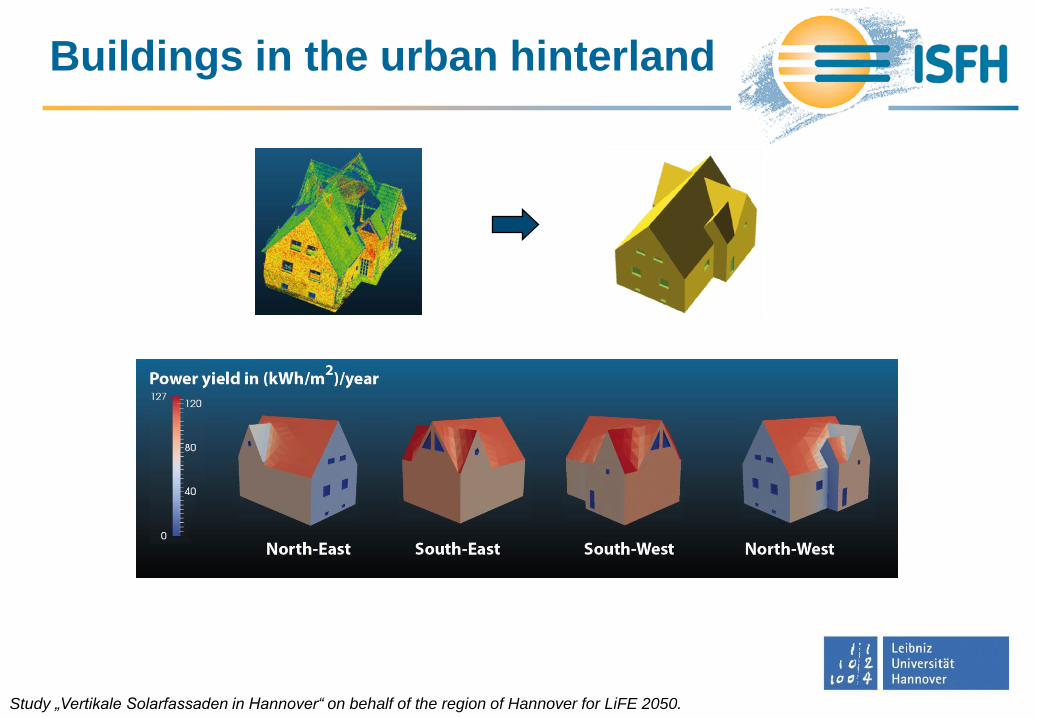
The facade geometry of real buildings was collected by the
Institute of Carthography and Geoinformatics (IKG) of the
Leibniz University Hannover using laser scanning.
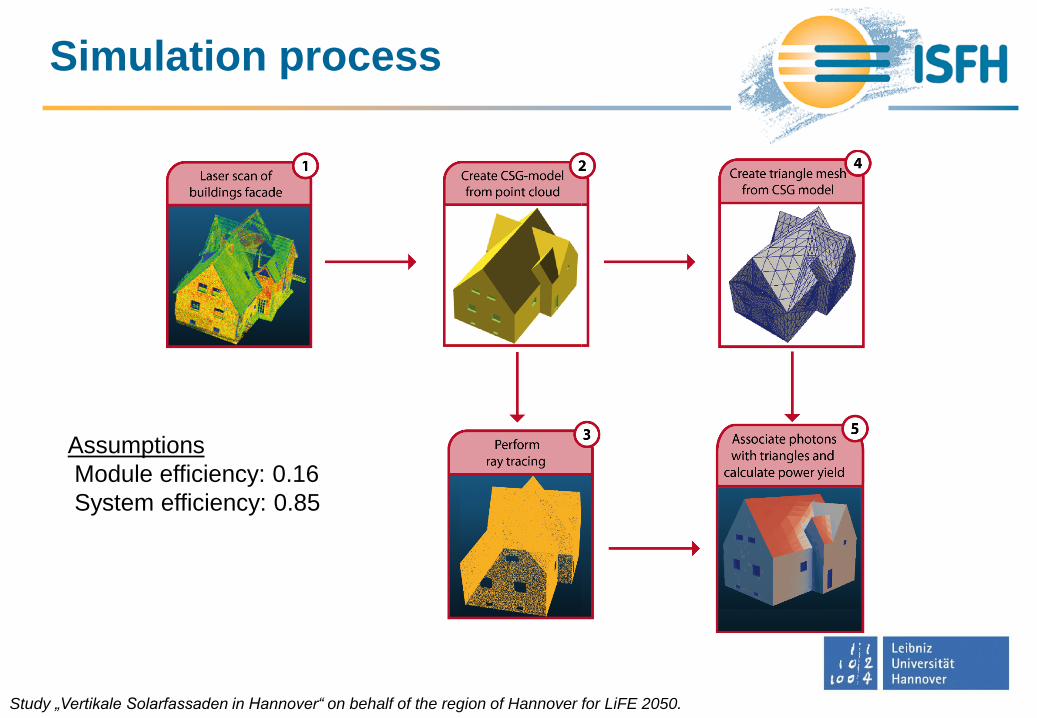
Assumptions
Module efficiency: 0.16
System efficiency: 0.85
Simulation process
Study „Vertikale Solarfassaden in Hannover“ on behalf of the region of Hannover for LiFE 2050.
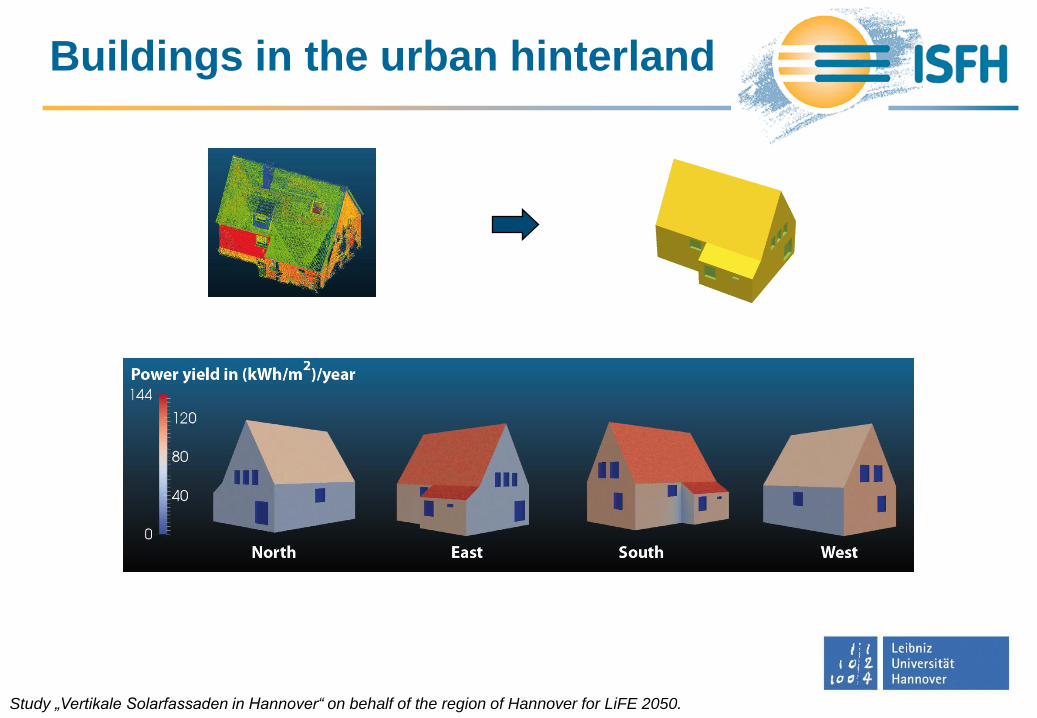
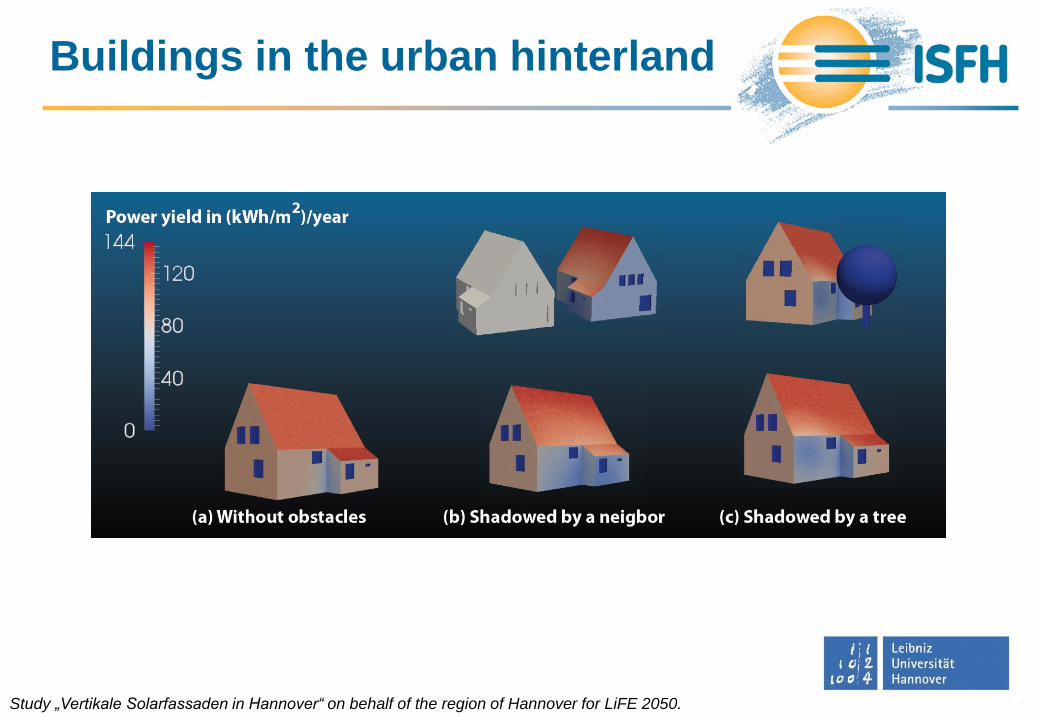
Buildings in the urban hinterland
Study „Vertikale Solarfassaden in Hannover“ on behalf of the region of Hannover for LiFE 2050.
Buildings in the urban hinterland
Study „Vertikale Solarfassaden in Hannover“ on behalf of the region of Hannover for LiFE 2050.
Buildings in the urban hinterland
Study „Vertikale Solarfassaden in Hannover“ on behalf of the region of Hannover for LiFE 2050.
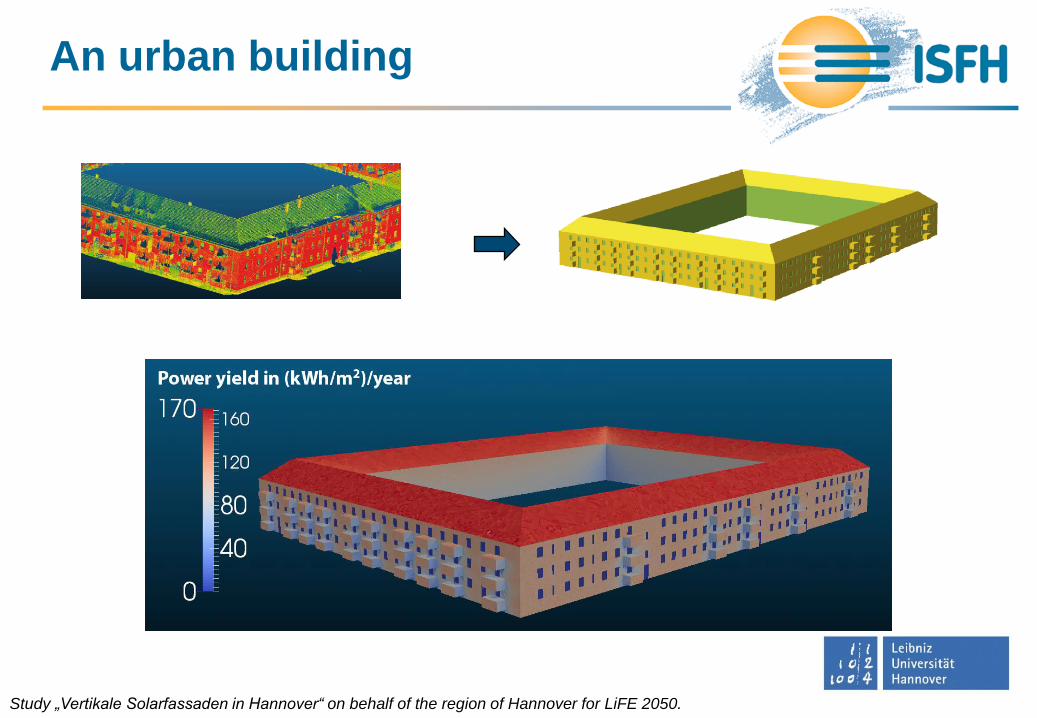
An urban building
Study „Vertikale Solarfassaden in Hannover“ on behalf of the region of Hannover for LiFE 2050.
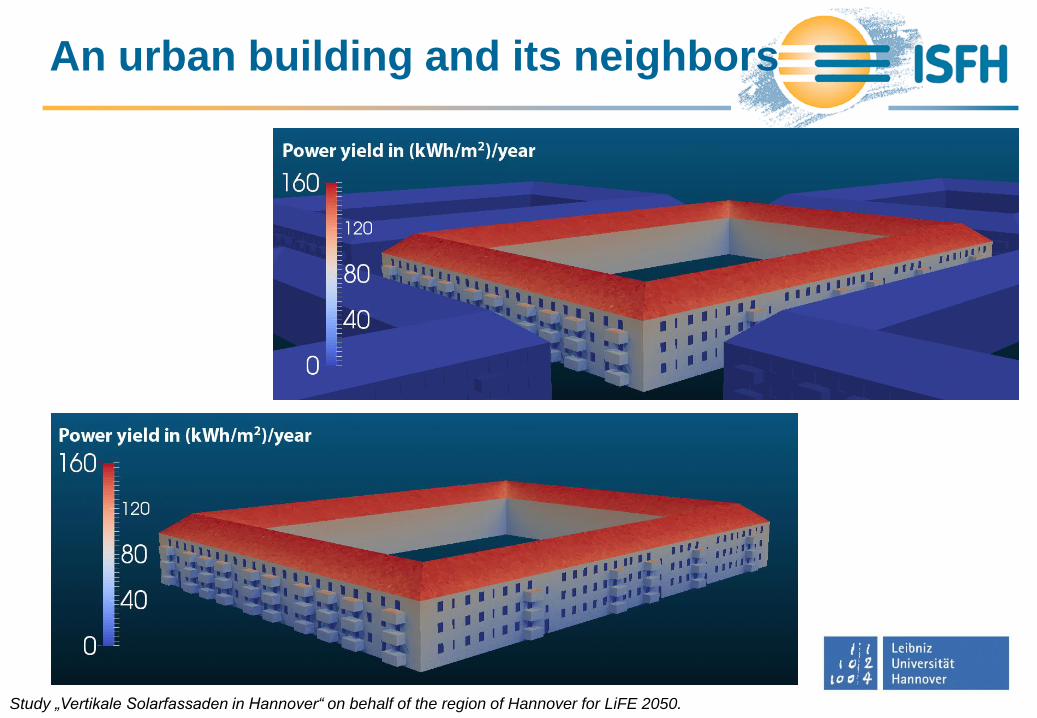
An urban building and its neighbors
Study „Vertikale Solarfassaden in Hannover“ on behalf of the region of Hannover for LiFE 2050.
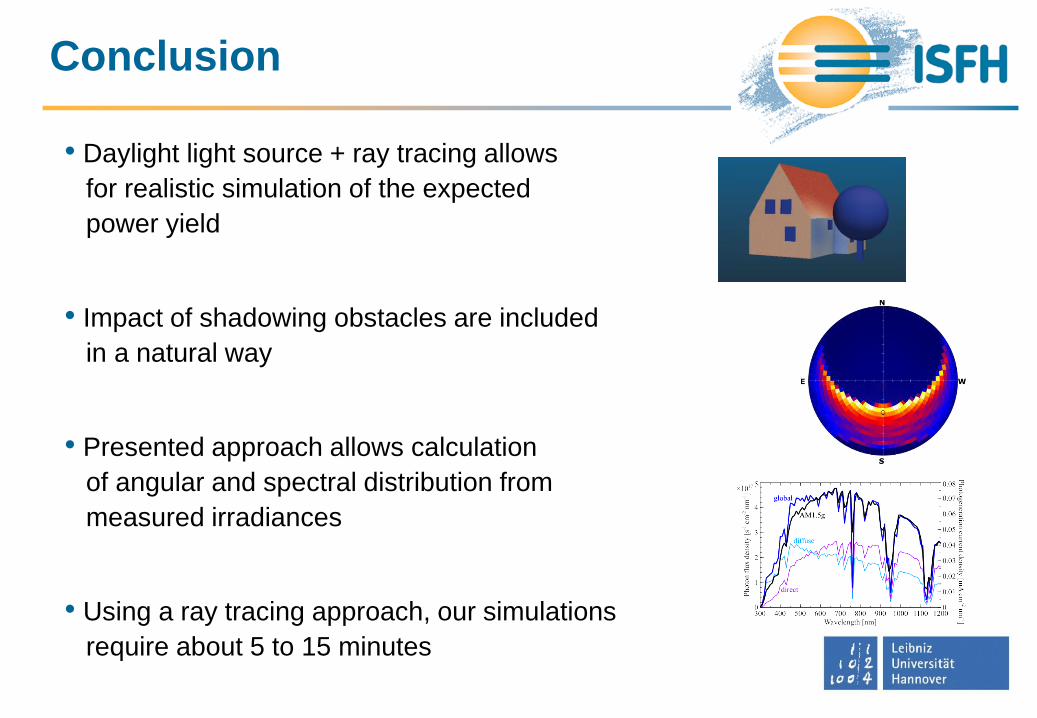
Conclusion
• Daylight light source + ray tracing allows
for realistic simulation of the expected
power yield
• Impact of shadowing obstacles are included
in a natural way
• Presented approach allows calculation
of angular and spectral distribution from
measured irradiances
• Using a ray tracing approach, our simulations
require about 5 to 15 minutes
Thank you for
your attention !
Hendrik Holst
Institute of Solar Energy Research Hamelin (ISFH)
E-Mail: [email protected]
Tel.: +49-5151-999644