artificial inteligence based power quality disturbance
TRANSCRIPT

International Research Journal of Engineering and Technology (IRJET) e-ISSN: 2395 -0056
Volume: 03 Issue: 09 | Sep-2016 www.irjet.net p-ISSN: 2395-0072
© 2016, IRJET | Impact Factor value: 4.45 | ISO 9001:2008 Certified Journal | Page 1300
ARTIFICIAL INTELIGENCE BASED POWER QUALITY DISTURBANCE ANALYSIS FOR POWER QUALITY IMPROVEMENT
Miss.Trupti .V. Isasare1,Mr.D.D.Majumdar2 1Electrical Power System
Shri Sai College Of Engineering & Technology,Bhadrawati Chandrapur,Maharashtra,India
[email protected] 2(Assistant Professor in Electrical Dept)
Shri Sai Polytechnic,Chandrapur,Maharashtra,India [email protected]
---------------------------------------------------------------------***---------------------------------------------------------------------
Abstract - With an increasing usage of sensitive electronic
equipment, power quality studies had grown to perform power
quality data analysis. Wavelet transformation technique was
founded to be more appropriate to analyze the various types
of power quality events. This project compares the use of
various types of wavelets at different scales and levels of
decomposition on analyzing real recorded Power quality (PQ)
events from transmission line model or signal generated using
MATLAB background. Voltage sag, voltage swell and transient
event have been tested.
This method used to detect and classify power quality
disturbance in the power system using Artificial Neural
Network (ANN) and Wavelet transform. The proposed method
requires less number of features as compared to conventional
approach for the identification. The feature extracted through
the wavelet is trained by Artificial Neural Network for the
classification of events. After training the neural network, the
weight obtained is used to classify the Power Quality (PQ)
problems.
Key Words: Wavelet transform, Power quality, Neural Network
1.INTRODUCTION Transmission lines are among the power system components with the highest fault incidence rate, since they are exposed to the environment. Line faults due to lightning, storms, vegetation fall, fog and salt spray on dirty insulators are beyond the control of man. The balanced faults in a transmission line are three phase shunt and three phases to ground circuits while Single line-to-ground, line-to-line and double line-to-ground faults are unbalanced in nature.
In an electric power system, a fault is any abnormal flow of electric current. Example, the fault in which current flow bypasses the normal load we called it as a short circuit. Open-circuit fault occurs if the circuit is interrupted by some
failure. In three phase (3Ø) systems, a fault occurs between one or more phases and a ground, or also may arise only between phases. In "Ground Fault", the current follows the earth path. In power systems, the protective devices will detect fault conditions and operate circuit breakers and other devices to limit the loss of service due to a failure. In a polyphase system, a fault may influence all phases equally which is a "symmetrical fault". When only some phases are affected, the resulting "asymmetrical fault" becomes more complicated to analyze due to the simplifying assumption of equal current magnitude in all phases has being no longer applicable. Analysis of such type of fault is more often simplified by using methods such as symmetrical components. A symmetric or balanced fault affects each of the three phases equally. In the transmission line faults, roughly 5% are symmetric. Which upon comparison with asymmetric fault, three phases are not affected equally. In practical, mostly unbalance faults occur in power systems. An asymmetric or unbalanced fault does not affect each of the three phases equally. In this paper, various techniques for protection of transmission line based on wavelet transform are discussed mainly focuses on the various methods to achieve fault detection, classification and isolation in transmission line. Those techniques include Wavelet transform. In a modern power system, high speed fault clearance is very critical and to achieve this objective different techniques have been developed. The system proposed [1] of power-quality detection for power system disturbances using adaptive wavelet networks (AWNs). An AWN is two-sub network architecture, consisting of the wavelet layer and adaptive probabilistic network. Morlet wavelets are used to extract the features from various disturbances, and an adaptive probabilistic network analyzes the meaningful features and performs discrimination tasks. AWN models are suitable for application in a dynamic environment, with add-in and delete-off features using automatic target adjustment and parameter tuning. The proposed AWN has been tested for the power-quality problems, including those caused by

International Research Journal of Engineering and Technology (IRJET) e-ISSN: 2395 -0056
Volume: 03 Issue: 09 | Sep-2016 www.irjet.net p-ISSN: 2395-0072
© 2016, IRJET | Impact Factor value: 4.45 | ISO 9001:2008 Certified Journal | Page 1301
harmonics, voltage sag, voltage swell, and voltage interruption. The detection of the disturbance and its duration are attained by a proper application, on the sampled signal, of the Continuous Wavelet Transform (CWT) [2]. Disturbance amplitude is estimated by decomposing, in an optimized way, the signal in frequency sub bands by means of the Discrete Time Wavelet Transform (DTWT). The proposed method is characterized by high rejection to noise, introduced by both measurement chain and system under test, and it is designed for an agile disturbance classification. Moreover, it is also conceived for future implementation both in real-time measurement equipment and in an off-line analysis tool.)
2. PROPOSED METHODOLOGY
Fig1 . Flowchart of proposed approach
2.1 Wavelet Transform
Wavelet transforms have become one of the most important and powerful tool of signal representation. Nowadays, it has been used in image processing, data compression, and signal processing. Wavelet analysis is a relatively new signal processing tool and is applied recently by many researchers in power systems due to its strong capability of time and frequency domain analysis [3], [4]. The two areas with most applications are power quality analysis and power system protection [5]–[8]. The definition of continuous wavelet transform (CWT) for a given signal x(t) with respect to a mother wavelet ѱ(t) is
CWT (a, b) = (1)
where is the scale factor and is the translation factor. For CWT, t, a, and b are all continuous. Unlike the Fourier transform, the wavelet transform requires the selection of a mother wavelet for different applications The application of wavelet transform in engineering areas usually requires a discrete wavelet transform (DWT), which implies the discrete form of t, a, and b in (1). The representation of DWT can be written as
where the original and parameters in (1) are changed to be the functions of integers n, m. k is an integer variable and it refers to a sample number in an input signal. A very useful implementation of DWT, called multiresolution analysis, is demonstrated in Fig. 2. The original sampled signal x(n) is passed through a highpass filter h(n) and a lowpass filter l(n). Then the outputs from both filters are decimated by 2 to obtain the detail coefficients and the approximation coefficients at level 1 (D1 and A1). The approximation coefficients are then sent to the second stage to repeat the procedure. Finally, the signal is decomposed at the expected level. In the case shown in Fig. 2, if the original sampling frequency is F, the signal information captured by D1 is between F/4 and F/2 of the frequency band.D2 captures the information between F/8 and F/4, D3 captures the
Fig 2.Wavelet multiresolution analysis
information between F/16 and F/8, and A3 retains the rest of the information of original signal between 0 and F/16 . By such means, we can easily extract useful information from the original signal into different frequency bands and at the same time the information is matched to the related time period.
The larger the wavelet energy, the more the information is preserved after decomposition. The definition of total energy and average power for a signal x[n] being expressed as follows in Eqs. (3) & (4).
(3)
(4)
After successful decomposition process we got energy coefficient of individual signals that transfer to the neural
International Research Journal of Engineering and Technology (IRJET) e-ISSN: 2395 -0056
Volume: 03 Issue: 09 | Sep-2016 www.irjet.net p-ISSN: 2395-0072
© 2016, IRJET | Impact Factor value: 4.45 | ISO 9001:2008 Certified Journal | Page 1302
network for classification of internal and external fault. The wavelet transform is comparison analysis which determines the amount of similarity of given signal to a shifted and scaled version of predefined basic function. The data window length of wavelet transform can vary through variation of scale factor. After successful decomposition process we got energy coefficient of individual signals that transfer to the neural network for classification of internal and external fault. Based on best result occurs in proposed work ,we are select number of decomposition level of Multiresolution analysis and type of Mother wavelet. This selection is totally based on MATLAB simulation study.
2.2 Artificial Neural Network
My thesis Roughly speaking, a neural network is a collection of artificial neurons. An artificial neuron is a mathematical model of a biological neuron in its simplest form. From our understanding, biological neurons are viewed as elementary units for information processing in any nervous system. Without claiming its neurobiological validity, the mathematical model of an artificial neuron is based on the following theses:
1. Neurons are the elementary units in a nervous system at which information processing occurs.
2. Incoming information is in the form of signals that are passed between neurons through connection links.
3. Each connection link has a proper weight that multiplies the signal trans- mitted.
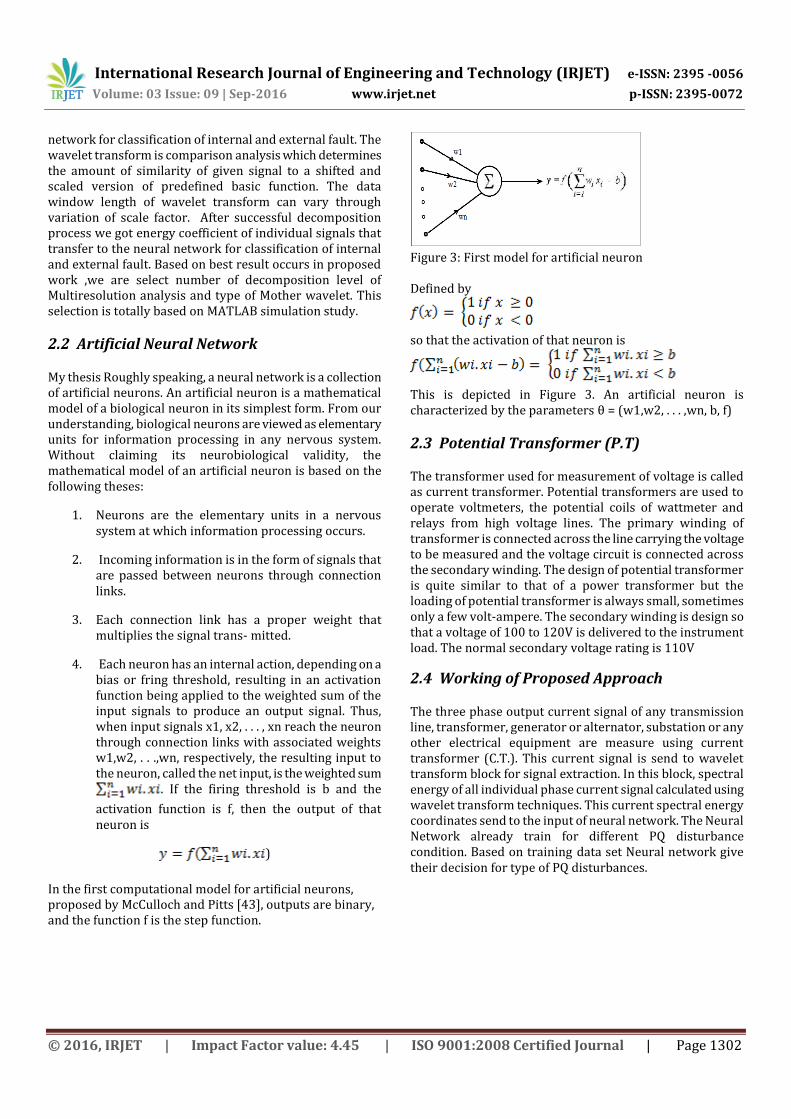
4. Each neuron has an internal action, depending on a bias or fring threshold, resulting in an activation function being applied to the weighted sum of the input signals to produce an output signal. Thus, when input signals x1, x2, . . . , xn reach the neuron through connection links with associated weights w1,w2, . . .,wn, respectively, the resulting input to the neuron, called the net input, is the weighted sum
. If the firing threshold is b and the
activation function is f, then the output of that neuron is
)
In the first computational model for artificial neurons, proposed by McCulloch and Pitts [43], outputs are binary, and the function f is the step function.
Figure 3: First model for artificial neuron Defined by
so that the activation of that neuron is
This is depicted in Figure 3. An artificial neuron is characterized by the parameters θ = (w1,w2, . . . ,wn, b, f)
2.3 Potential Transformer (P.T)
The transformer used for measurement of voltage is called as current transformer. Potential transformers are used to operate voltmeters, the potential coils of wattmeter and relays from high voltage lines. The primary winding of transformer is connected across the line carrying the voltage to be measured and the voltage circuit is connected across the secondary winding. The design of potential transformer is quite similar to that of a power transformer but the loading of potential transformer is always small, sometimes only a few volt-ampere. The secondary winding is design so that a voltage of 100 to 120V is delivered to the instrument load. The normal secondary voltage rating is 110V
2.4 Working of Proposed Approach
The three phase output current signal of any transmission line, transformer, generator or alternator, substation or any other electrical equipment are measure using current transformer (C.T.). This current signal is send to wavelet transform block for signal extraction. In this block, spectral energy of all individual phase current signal calculated using wavelet transform techniques. This current spectral energy coordinates send to the input of neural network. The Neural Network already train for different PQ disturbance condition. Based on training data set Neural network give their decision for type of PQ disturbances.

International Research Journal of Engineering and Technology (IRJET) e-ISSN: 2395 -0056
Volume: 03 Issue: 09 | Sep-2016 www.irjet.net p-ISSN: 2395-0072
© 2016, IRJET | Impact Factor value: 4.45 | ISO 9001:2008 Certified Journal | Page 1303
Fig 4: Working of proposed approach
3. SIMULATION MODEL AND RESULTS
3.1 Power Quality Disturbance Dataset using Wavelet Transform
Power quality disturbance signals are generated in MATLAB simulink. A 34.5 KV Distribution network consist of three phase loads and one nonlinear load, various power quality disturbances like voltage sag, swell, transients, harmonics, momentary interruption, fault signals and normal voltage signals have been simulated. Simulation particulars: Total simulation time=1sec, Time for observe PQ disturbance between 0.2 to 0.4 second.
3.1.1 Normal Voltage
Fig 5. Simulation model for generation of power quality
disturbance voltage signals.
Fig 6. Generated normal voltage signal
Wavelet transform analysis has been carried out on normal voltage waveform by considering debachies-1 mother wavelet up to five level decomposition. The five level decomposition gives five detail coefficients. The standard deviations of detail coefficients are different for each and every power quality disturbance are shown in figure 7.
Fig 7. Wavelet multiresolution analysis using Wavelet toolbox for normal voltage signal and energy calculation.
3.1.2 Voltage Sag For generation of sag voltage in matlab simulation model, we consider 34.5 KV transmission model with 440 Volt, 50Hz inductive load of 30 KVAR and active load of 10W. Sag generated in between 0.1 to 0.4 second. Total simulation time is 1 second.
Fig 8. Generated voltage sag signal Wavelet transform analysis has been carried out on sag waveform by considering debachies-1 mother wavelet up to five level decomposition. The five level decomposition gives five detail coefficients. The standard deviations of detail coefficients are different for each and every power quality disturbance. is for remaining disturbances are shown in figure 9 below.

International Research Journal of Engineering and Technology (IRJET) e-ISSN: 2395 -0056
Volume: 03 Issue: 09 | Sep-2016 www.irjet.net p-ISSN: 2395-0072
© 2016, IRJET | Impact Factor value: 4.45 | ISO 9001:2008 Certified Journal | Page 1304
Fig 9. Wavelet multiresolution analysis using Wavelet
toolbox for sag voltage signal and energy calculation.
3.1.3 Voltage Swell
For generation of swell voltage in matlab simulation model, we consider 34.5 KV transmission model with 440 Volt, 50Hz capacitive load of 30 KVAR and active load of 10W. Swell generated in between 0.1 to 0.4 second. Total simulation time is 1 second.
Fig 10. Generated voltage swell signal
Fig 11. Wavelet multiresolution analysis using Wavelet toolbox for swell voltage signal and energy calculation.
3.1.4 Momentary Interruption Voltage
For generation of momentary irruption of voltage in matlab
simulation model, we consider 34.5 KV transmission model
with 440 Volt, 50Hz inductive load of 30 KVAR and active
load of 30W. Interruption generated in between 0.1 to 0.4
second. Total simulation time is 1 second.
Fig 12. Generated momentary interruption of voltage signal
Fig 13. Wavelet multiresolution analysis using Wavelet toolbox for momentary interruption of voltage signal and
energy calculation.
3.1.5 Voltage with Harmonics
For generation of harmonics of voltage in matlab simulation model, we consider 34.5 KV transmission model with series RL load branch of inductance 22mH and resistance 5 KΩ, Universal bridge consists of diode have diode resistance 100MΩ, Snubber resistance 1Ω, Forward voltage 50V. Total
simulation time is 1 second.
Fig 14. Generated Harmonics using Matlab simulation model

International Research Journal of Engineering and Technology (IRJET) e-ISSN: 2395 -0056
Volume: 03 Issue: 09 | Sep-2016 www.irjet.net p-ISSN: 2395-0072
© 2016, IRJET | Impact Factor value: 4.45 | ISO 9001:2008 Certified Journal | Page 1305
Fig 15. Wavelet multiresolution analysis using Wavelet toolbox for Harmonics of voltage signal and energy
calculation.
3.1.6 Transient Voltage
For generation of transient of voltage in matlab simulation model, we consider 34.5 KV transmission model with starting of transformer having rating 50MVA. During starting of transformer high transients are generated. Starting is
done at 0.4 second. Total simulation time is 1 second.
Fig 16. Generated voltage transients using Matlab simulation model
Fig 17. Wavelet multiresolution analysis using Wavelet toolbox for Transient of voltage signal and energy calculation.
3.1.7 Fault Voltage For generation of faulted signal of voltage in matlab simulation model, we consider 34.5 KV transmission model with all transmission line three phase fault. In this case we consider Line to Ground fault between Phase A to Ground. Fault occurs between o.1 to 0.4 second. Total simulation time is 1 second. Transmission line length is 10 km fault occurs at 5 km in between line.
Fig 18. Generated fault voltage signals using Matlab simulation mode
Fig 19. Wavelet multiresolution analysis using Wavelet toolbox for faulted voltage signal and energy calculation.
3.2 Power Quality Disturbance Classification Using Neural Network 3.2.1 Training Dataset for Neural Network
We can train the neural network by using spectral energy coordinates which calibrated by wavelet multiresolution analysis. For training neural network we apply energy coefficient from level 5 of multiresolution analysis (MRA). Apply input to Neural network as energy of A5, D5, D4, D3, D2 and D1. Input dataset and target dataset generated using above
power quality disturbance cases. Training dataset for
different power quality disturbance signal for train neural
network are shown in table 1.

International Research Journal of Engineering and Technology (IRJET) e-ISSN: 2395 -0056
Volume: 03 Issue: 09 | Sep-2016 www.irjet.net p-ISSN: 2395-0072
© 2016, IRJET | Impact Factor value: 4.45 | ISO 9001:2008 Certified Journal | Page 1306
Table 1: Input training data for neural network
PQ
Disturbance
A5E D5E D4E D3E D2E D1E
Normal
Voltage
97.91 1.56 0.39 0.10 0.02 0.01
Momentary
interruption
97.91 1.56 0.39 0.10 0.02 0.01
Voltage sag 97.86 1.58 0.40 0.11 0.04 0.02
Voltage
swell
97.56 1.62 0.43 0.15 0.18 0.06
Harmonics 97.20 1.55 0.66 0.35 0.17 0.07
Transient 97.94 1.54 0.39 0.10 0.02 0.01
LG Fault
(AG)
97.93 1.55 0.39 0.10 0.02 0.01
LLG Fault
(ABG)
98.04 1.47 0.37 0.09 0.02 0.01
LLLG Fault
(ABCG)
98.12 1.41 0.35 0.09 0.02 0.01
LL Fault
(AC)
98.03 1.48 0.37 0.09 0.02 0.01
Where, A5E = Spectral energy of Approximate coordinate
at level 5
D5E = Spectral energy of Detail coordinate at level 5
D4E = Spectral energy of Detail coordinate at level 4
D3E = Spectral energy of Detail coordinate at level 3
D2E = Spectral energy of Detail coordinate at level 2
D1E = Spectral energy of Detail coordinate at level 1
3.2.2 Training performance of Neural Network For training neural network for 105 power quality disturbance event we generates data set for each type of power quality disturbances. For each power quality disturbance 15 condition was created and for that condition neural network get trained using energy of voltage signal during that power quality disturbance. During training of neural network, neural network hidden neurons was 10. For this neural network training requires
27 epoch with0.05992 Mean square error (MSE) from target to actual output. The training performance of neural network on 5% testing data, 5% validation data and 95% training data shown in figure 20.
Fig 20. Training performance of neural network during training using MATALB.
4. Results from Neural Network
After training neural network, out of 90 power quality disturbance event 71 PQ disturbance event classifying with 67% accuracy. For remaining 19 PQ disturbance event neural network in confusion state not classify that PQ disturbance event successfully. For improve the ANN accuracy or efficiency new neural network model with different number of transfer function and different number of hidden neurons design essential. This work extended for future work.
Figure 21: Actual output from neural network after training (Confusion matrix)

International Research Journal of Engineering and Technology (IRJET) e-ISSN: 2395 -0056
Volume: 03 Issue: 09 | Sep-2016 www.irjet.net p-ISSN: 2395-0072
© 2016, IRJET | Impact Factor value: 4.45 | ISO 9001:2008 Certified Journal | Page 1307
Figure 22: Reason of conversion (ROC) FOR ANN
Figure 22 shows that all types of fault class classification done by neural network. This ROC figure shows the how much classes classify successfully using ANN.
5.CONCLUSION This method used to detect and classify power quality disturbance in the power system using Artificial Neural Network (ANN) and Wavelet transform. The proposed method requires less number of features as compared to conventional approach for the identification. The feature extracted through the wavelet is trained by Artificial Neural Network for the classification of events. After training the neural network, the weight obtained is used to classify the Power Quality (PQ) problems. The overall efficiency of neural network for Power Quality disturbance analysis is 67 %.
REFERENCES [1] Lin, Chia-Hung, and Chia-Hao Wang. "Adaptive wavelet
networks for power-quality detection and
discrimination in a power system." Power Delivery, IEEE
Transactions on 21.3 (2006): 1106-1113.
[2] Angrisani, L., et al. "A measurement method based on
the wavelet transform for power quality
analysis." Power Delivery, IEEE Transactions on 13.4
(1998): 990-998.
[3] C. H. Kim and R. Aggarwal, “Wavelet transforms in
power systems part 1: General introduction to the
wavelet transforms,”Power Eng. J., vol. 14, no. 2, pp. 81–
88, Apr. 2000.
[4] ——, “Wavelet transforms in power systems part 2: Examples of application to actual power system transients,”Power Eng. J., vol. 15, no. 4, pp. 193–202, Aug. 2001.
[5] S. Santoso, E. J. Powers, W. M. Grady, and P. Hofmann, “Power quality assessment via wavelet transform analysis,” IEEE Trans. Power Del., vol. 11, no. 2, pp. 924–930, Apr. 1996.
[6] A. H. Osman and O. P. Malik,“Transmission line distance protection based on wavelet transform,”IEEE Trans. Power Del., vol. 19, no. 2, pp. 515–523, Apr. 2004.
[7] Youssef,“New algorithm to phase selection based on wavelet transforms,”IEEE Trans. Power Del., vol. 17, no. 4, pp. 908–914, Oct. 2002.
[8] Wavelet Toolbox User’s Guide The MathWorks Inc., Natick, MA, 2005 [Online]. Available: http://www.mathworks.com/.
[9] Mollanezhad Heydar-Abadi, M., and A. Akbari Foroud. "Accurate Fault Classification of Transmission Line Using Wavelet Transform and Probabilistic Neural Network." Iranian Journal of Electrical and Electronic Engineering 9.3 (2013): 177-188.
[10] Abdel-Galil, T. K., et al. "Power quality disturbance classification using the inductive inference approach." IEEE Transactions on Power Delivery 19.4 (2004): 1812-1818.
[11] Biswal, Birendra, Pradipta K. Dash, and Bijaya K. Panigrahi. "Power quality disturbance classification using fuzzy C-means algorithm and adaptive particle swarm optimization." IEEE Transactions on Industrial Electronics56.1 (2009): 212-220.
[12] Santoso, Surya, et al. "Power quality assessment via wavelet transform analysis." IEEE transactions on Power Delivery 11.2 (1996): 924-930.
[13] Santoso, Surya, et al. "Power quality assessment via wavelet transform analysis." IEEE transactions on Power Delivery 11.2 (1996): 924-930.
[14] Perunicic, B., et al. "Power quality disturbance detection and classification using wavelets and artificial neural networks." Harmonics and Quality of Power Proceedings, 1998. Proceedings. 8th International Conference On. Vol. 1. IEEE, 1998.
[15] Dash, P. K., et al. "Power quality disturbance data compression, detection, and classification using integrated spline wavelet and S-transform." IEEE Transactions on Power Delivery 18.2 (2003): 595-600.
[16] Wijayakulasooriya, J. V., G. A. Putrus, and P. D. Minns. "Electric power quality disturbance classification using self-adapting artificial neural networks." IEE Proceedings-Generation, Transmission and Distribution 149.1 (2002): 98-101.
[17] He, Haibo, and Janusz A. Starzyk. "A self-organizing learning array system for power quality classification

International Research Journal of Engineering and Technology (IRJET) e-ISSN: 2395 -0056
Volume: 03 Issue: 09 | Sep-2016 www.irjet.net p-ISSN: 2395-0072
© 2016, IRJET | Impact Factor value: 4.45 | ISO 9001:2008 Certified Journal | Page 1308
based on wavelet transform." IEEE Transactions on Power Delivery 21.1 (2006): 286-295.
[18] Zhu, T. X., S. K. Tso, and K. L. Lo. "Wavelet-based fuzzy reasoning approach to power-quality disturbance recognition." IEEE Transactions on Power Delivery 19.4 (2004): 1928-1935.
[19] Reaz, Mamun Bin Ibne, et al. "Expert system for power quality disturbance classifier." IEEE Transactions on Power Delivery 22.3 (2007): 1979-1988.
[20] Santoso, Surya, et al. "Power quality disturbance waveform recognition using wavelet-based neural classifier. II. Application." IEEE Transactions on Power Delivery 15.1 (2000): 229-235.
[21] Uyar, Murat, Selcuk Yildirim, and Muhsin Tunay Gencoglu. "An expert system based on S-transform and neural network for automatic classification of power quality disturbances." Expert Systems with Applications 36.3 (2009): 5962-5975.