aspen/snowmass inside the numbers market report summer 2016
DESCRIPTION
ÂTRANSCRIPT

ASPEN/ SNOWMASS
INSIDE THE NUMBERS
J A M E S B E N V E N U T O
Market ReportSummer 2016

2 jamesbenvenuto.com
Benvenuto, or welcome, as it means in Italian, to the Summer Edition of my Aspen/Snowmass “Inside The Numbers” Market Report. The char ts throughout give you the full breakdown of closed transactions from January through May 2013 to 2016.
As evidenced by the year-over-year comparisons, we are seeing a signif icant slowdown in the Aspen real estate market. Simultaneously, Snowmass Village single-family home sales are on the
rise. The biggest hit to the Aspen/Snowmass market to date, is in the $10,000,000 + ultra-luxury market. 2015 was a massive year for ultra-luxury purchases, with 11 recorded sales in the f irst f ive months alone. However, this year there have only been f ive such sales. Of those f ive, one was a condo in Aspen’s core, at Monarch on the Park, that sold for $15,000,000 or $4,275.94 a square foot. The price per square foot continues to rise dramatically in Aspen while only modestly in Snowmass. It is noteworthy that the ask price per square foot is up 15 percent in Aspen, while it has only risen by 6 percent in Snowmass Village.
Many macroeconomic forces inf luenced the Aspen real estate market in the f irst few months of the year. Fears of China’s economic collapse jolted the US stock market in the f irst quar ter. Factors such as unpredictable presidential elections, as well as the low price of oil also played a role in the Aspen real estate market slowdown. Some price exhaustion may also be inf luencing the Aspen market. With the summer selling season right around the corner, it will be interesting to see if buyers move back in as they did last summer.
So what will happen? Should sellers hold tight to their price per square foot, or should they reduce prices? Time will tell, and when you subscribe to my monthly email market repor t, I’ll provide you with insights and projections to help you answer these and other questions. Sign up at jamesbenvenuto.com.
There is just so much to do in Aspen/Snowmass. Summer is in full swing as I write this, with Aspen Food and Wine kicking off the festivities. Occupancy rates are high, with the Ideas Festival and Aspen Music Festival to keep us enter tained all summer long. There are gorgeous hikes, golf at our numerous courses, and f ly f ishing in our gold-medal waters. I can even tell you how you can surf here—just ask me!
As a designated Master Cer tif ied Negotiation Exper t, I am here to help you buy or sell your Aspen or Snowmass proper ty. I have lived in the Roaring Fork Valley for 23 years. My wife Jenny and I are so grateful that we are able to raise our 10-year-old daughter, Fiona, and our 8-year-old son, Houston, in what has become our deeply loved hometown. I am 100 percent dedicated to selling real estate—this is not a hobby for me. I am full time and all in.
A por tion of each of my commissions is donated to Challenge Aspen Military Opportunities (CAMO). CAMO provides adaptive and therapeutic recreation and wellness experiences for military personnel diagnosed with cognitive and/or physical disabilities. As the son of a retired army colonel, I have firsthand knowledge of how important it is to readjust to life after military service, and I am honored to share my understanding and love of skiing and fly fishing with our disabled veterans.
I hope that you will f ind the information in this repor t useful. Please call me if you would like to discuss a cer tain neighborhood. I live and breathe Aspen real estate, and I am excited to share my knowledge of the market with you.
Yours truly,
James Benvenuto
A M E S S A G E F R O M T H E A U T H O R
CONTACT JAMES BENVENUTO
970.948.3264
jamesbenvenuto.com

3jamesbenvenuto.com
C O N T E N T SMARKET HIGHLIGHTS 4
ASPEN – ALL MLS 6
EAST ASPEN 8
SMUGGLER 10
CENTRAL CORE 12
RED MOUNTAIN 14
WEST END 15
WEST ASPEN 16
MCCLAIN FLATS / STARWOOD 18
SNOWMASS VILLAGE – ALL MLS 20
HORSE RANCH 22
MELTON RANCH /WILDRIDGE 23
THE PINES 24
RIDGE RUN 25
WOOD RUN /TWO CREEKS 26
THE DIVIDE 27
$10 MILLION + 28
PRIVATE RESIDENCE CLUBS 30
567N ORT H S TA RWOOD.COM | L I S T ED FOR $ 5 ,995 , 0 0 0

4 jamesbenvenuto.com
M A R K E T H I G H L I G H T S
ASPENALL DATA IS FOR SINGLE FAMILY HOMES (SFH) IN ALL OF ASPEN
M AY – J U N E 2 0 15 M AY – J U N E 2 0 16
$12,140,000 HIGHEST PRICE SINGLE FAMILY HOME
$6,009,549 SINGLE FAMILY HOME AVERAGE SOLD PRICE
13 $1,423.99 $1,314.8335Aspen SFH units sold Aspen SFH units sold SFH average price per sq ft SFH average price per sq ft
283 .86278 .90SFH average days on market SFH average days on market SFH average sold/list price % SFH average sold/list price %

5jamesbenvenuto.com
SNOWMASS VILLAGE ALL DATA IS FOR SINGLE FAMILY HOMES (SFH) IN ALL OF SNOWMASS VILLAGE (SMV)
$10,595,000 HIGHEST PRICE SINGLE FAMILY HOME
$4,453,133 SINGLE FAMILY HOME AVERAGE SOLD PRICE
15 $954.91 $924.7612SMV SFH units sold SMV SFH units sold SFH average price per sq ft SFH average price per sq ft
378 .89245 .90SFH average days on market SFH average days on market SFH average sold/list price % SFH average sold/list price %

6 jamesbenvenuto.com
A S P E N – A L L M L S
Average sales price/sq ftAverage sold price per square foot is up 15% for a SFH so far this year.
$12,140,000
$15,000,000
Most expensive single-family home sale, YTD 2016
($4,275.94 per square foot) Most expensive condo sale, YTD 2016
2013 2014 2015 2016
Single Family Homes
1500
1000
500

7jamesbenvenuto.com
SINGLE FAMILY HOMES 2013 2014 2015 2016 2016 vs 2015
Number of Properties Sold 33 40 35 13 -63%
Sold Dollar Volume 147,113,531 228,446,117 241,145,000 79,255,143 -67%
Avg Days on Market 405 353 278 283 2%
Avg List Price 5,046,288 6,480,514 7,762,971 7,296,169 -6%
Avg Sale Price 4,457,986 5,711,153 6,889,871 6,096,549 -12%
Median Sale Price 3,025,000 4,100,000 4,400,000 5,065,000 15%
Avg List Price/Sq. Ft. 1315.07 1,190 1450.21 1,664.33 15%
Avg Sell Price/Sq. Ft. 1143.93 1,046.86 1,314.83 1,423.99 8%
Average Sold/List Price % .90 .89 .90 .86 -4%
Highest Sold Price 17,500,000 26,000,000 19,300,000 12,140,000 -37%
Lowest Sold Price 656,000 540,000 507,500 740,000 46%
CONDOS/TH/HALF DUPLEX 2013 2014 2015 2016 2016 vs 2015
Number of Properties Sold 53 64 75 48 -36%
Sold Dollar Volume 76,265,550 144,348,475 153,196,500 105,110,152 -31%
Avg Days on Market 310 250 286 194 -32%
Avg List Price 1,545,942 2,462,108 2,172,265 2,284,795 5%
Avg Sale Price 1,483,973 2,225,445 2,042,620 2,189,795 7%
Median Sale Price 949,900 1,387,500 1,137,500 1,284,000 13%
Avg List Price/Sq. Ft. 987.50 1,245.72 1,206.69 1420.28 18%
Avg Sell Price/Sq. Ft. 910.06 1,168.26 1,143.83 1,342.55 17%
Average Sold/List Price % .92 .94 .95 .94 -1%
Highest Sold Price 7,500,000 17,000,000 13,200,000 15,000,000 14%
Lowest Sold Price 108,000 300,000 100,000 95,152 -5%
VACANT LAND 2013 2014 2015 2016 2016 vs 2015
Units Sold 12 8 15 5 -67%
Sold Dollar Volume 18,960,000 17,000,000 60,962,500 20,742,500 -66%
Avg Days on Market 323 235 663 474 -29%
Avg List Price 1,832,958 2,293,000 4,502,000 4,414,000 -2%
Avg Sale Price 1,580,000 2,125,000 4,064,167 4,148,500 2%
Median Sale Price 1,650,000 1,535,000 3,900,000 4,050,000 4%
Avg. Sale/List Price .89 .93 .91 1.12 23%
Highest Sold Price 3,350,000 4,600,000 10,100,000 10,000,000 -1%
Lowest Sold Price 175,000 200,000 950,000 400,000 -58%
The statistics above compare Jan-May months 2013 to 2016 for the entire Aspen. MLS with a year-over-year percentage comparing 2016 to 2016. All of the numbers in these charts are Closed Transactions.
Source Aspen/Glenwood Springs MLS. The information provided is deemed reliable but has been provided by third par ties. There is no guarantee that the information is accurate and this may not reflect all of the real estate activity in the area. Square footage is an estimate only.
number of salesaverage sell price/sq. ft.
average sold/ list price %
48 .94$1,342.55
C O N D O S

8 jamesbenvenuto.com
E A S T A S P E N
average sale price
average sell price/sq. ft.
average days on market
$4.9 million 278$1,193.96
546M C SK I M M I N G .COM | L I S T ED FOR $3 , 595 , 0 0 0
S I N G L E F A M I L Y H O M E S

9jamesbenvenuto.com
SINGLE FAMILY HOMES 2013 2014 2015 2016 2016 vs 2015
Number of Properties Sold 5 4 7 1 -86%
Sold Dollar Volume 19,862,632 14,782,000 33,395,000 4,900,000 -85%
Avg Days on Market 374 292 348 278 -20%
Avg List Price 4,556,800 4,048,750 5,091,429 5,375,000 6%
Avg Sale Price 3,972,526 3,695,000 4,770,714 4,900,000 3%
Median Sale Price 3,025,000 2,541,000 4,300,000 4,900,000 14%
Avg List Price/Sq. Ft. 1040.70 1019.35 1094.96 1,310.00 20%
Avg Sell Price/Sq. Ft. 899.46 934.97 1017.57 1,193.96 17%
Average Sold/List Price % .87 .92 .92 .91 -1%
Highest Sold Price 6,500,000 8,000,000, 8,600,000 4,900,000 -43%
Lowest Sold Price 1,275,000 1,700,000 1,850,000 4,900,000 165%
CONDOS/TH/HALF DUPLEX 2013 2014 2015 2016 2016 vs 2015
Number of Properties Sold 3 1 2 1 -50%
Sold Dollar Volume 5,791,150 612,500 3,295,000 450,000 -86%
Avg Days on Market 317 340 30 35 17%
Avg List Price 2,085,050 624,900 1,637,500 450,000 -73%
Avg Sale Price 1,930,383 612,500 1,647,500 450,000 -73%
Median Sale Price 1,480,150 612,500 1,647,000 450,000 -73%
Avg List Price/Sq. Ft. 805.66 731.73 979 721.15 -26%
Avg Sell Price/Sq. Ft. 751.81 717.21 965.54 721.15 -25%
Average Sold/List Price % .94 .98 .98 1 2%
Highest Sold Price 3,586,000 612,500 2,750,000 450,000 -84%
Lowest Sold Price 725,000 612,500 545,000 450,000 -17%
VACANT LAND 2013 2014 2015 2016 2016 vs 2015
Units Sold 1 0 2 0 -100%
Sold Dollar Volume 2,700,000 0 6,800,000 0 -100%
Avg Days on Market 2,350,000 0 2,072 0 -100%
Avg List Price 2,700,000 0 3,900,000 0 -100%
Avg Sale Price 2,350,000 0 3,400,000 0 -100%
Median Sale Price 2,350,000 0 3,400,000 0 -100%
Average Sold/List Price % .87 0 .89 0 -100%
Highest Sold Price 2,350000 0 5,850,000 0 -100%
Lowest Sold Price 2,350,000 0 9,50,000 0 -100%
The statistics above compare Jan-May months 2013 to 2016 for East Aspen. All of the numbers in these charts are Closed Transactions.
Source Aspen/Glenwood Springs MLS. The information provided is deemed reliable but has been provided by third par ties. There is no guarantee that the information is accurate and this may not reflect all of the real estate activity in the area. Square footage is an estimate only.

10 jamesbenvenuto.com
S M U G G L E R
average sale price
average sell price/sq. ft.
average days on market
$2.17 million 182$1,102.39
S I N G L E F A M I L Y H O M E S

11jamesbenvenuto.com
SINGLE FAMILY HOMES 2013 2014 2015 2016 2016 vs 2015
Number of Properties Sold 3 3 3 2 -33%
Sold Dollar Volume 5,282,599 8,627,500 5,427,500 4,388,200 -19%
Avg Days on Market 653 638 334 182 -46%
Avg List Price 1,896,667 3,008,333 1,898,000 2,198,000 16%
Avg Sale Price 1,760,866 2,875,833 1,809,167 2,169,000 20%
Median Sale Price 1,100,000 3,700,000 520,000 2,169,000 317%
Avg List Price/Sq. Ft. 538.32 826.81 740.98 1,123.78 52%
Avg Sell Price/Sq. Ft. 501.25 789.35 676.01 1,102.39 63%
Average Sold/List Price % .95 .95 .90 .96 7%
Highest Sold Price 3,500,000 4,387,500 4,400,000 3,398,200 -23%
Lowest Sold Price 682,599 540,000 507,500 740,000 46%
CONDOS/TH/HALF DUPLEX 2013 2014 2015 2016 2016 vs 2015
Number of Properties Sold 7 8 6 2 -67%
Sold Dollar Volume 3,755,000 4,295,000 4,381,000 1,063,500 -76%
Avg Days on Market 259 148 270 90 -67%
Avg List Price 582,429 565,625 800,500 553,500 -31%
Avg Sale Price 536,429 536,938 730,167 531,750 -27%
Median Sale Price 460,000 530,000 642,250 531,750 -17%
Avg List Price/Sq. Ft. 773.18 714.83 962.00 910.00 -5%
Avg Sell Price/Sq. Ft. 711.59 677.83 857.67 872.79 2%
Average Sold/List Price % .92 .95 .92 .96 4%
Highest Sold Price 800,000 750,000 1,035,000 580,000 -44%
Lowest Sold Price 425,000 368,000 475,000 483,500 2%
VACANT LAND 2013 2014 2015 2016 2016 vs 2015
Units Sold 0 0 1 1 0%
Sold Dollar Volume 0 0 2,500,000 1,900,000 -24%
Avg Days on Market 0 0 213 303 42%
Avg List Price 0 0 2,595,000 1,900,000 -27%
Avg Sale Price 0 0 2,500,000 1,900,000 -24%
Median Sale Price 0 0 2,500,000 1,900,000 -24%
Average Sold/List Price % 0 0 .96 1 4%
Highest Sold Price 0 0 2,500,000 1,900,000 -24%
Lowest Sold Price 0 0 2,500,000 1,900,000 -24%
The statistics above compare Jan-May months 2013 to 2016 for Smuggler. Over-year percentage comparing 2016 to 2015. All of the numbers in these charts are Closed Transactions.
Source Aspen/Glenwood Springs MLS. The information provided is deemed reliable but has been provided by third par ties. There is no guarantee that the information is accurate and this may not reflect all of the real estate activity in the area. Square footage is an estimate only.

12 jamesbenvenuto.com
C E N T R A L C O R E
76
$1,477.06
Average days on the market for a single-family home
Average condo sales price/sq ft
The hottest segment of the market is Aspen’s Core.
Condo values continue to rise toward $2000 per square foot.

13jamesbenvenuto.com
SINGLE FAMILY HOMES 2013 2014 2015 2016 2016 vs 2015
Number of Properties Sold 2 2 3 2 -33%
Sold Dollar Volume 8,850,000 7,100,000 30,750,000 16,275,000 -47%
Avg Days on Market 184 350 162 76 -53%
Avg List Price 5,125,000 3,877,500 11,083,333 9,250,000 -17%
Avg Sale Price 4,425,000 3,550,000 10,250,000 8,137,000 -21%
Median Sale Price 4,425,000 3,550,000 11,750,000 8,137,000 -31%
Avg List Price/Sq. Ft. 1774.64 1047.43 2366.51 2,252.93 -5%
Avg Sell Price/Sq. Ft. 1,494.66 945.61 2167.88 1,885.48 -13%
Average Sold/List Price % .86 .91 .92 .85 -8%
Highest Sold Price 4,500,000 5,100,000 15,100,000 12,140,000 -20%
Lowest Sold Price 4,350,000 2,000,000 3,900,000 4,135,000 6%
CONDOS/TH/HALF DUPLEX 2013 2014 2015 2016 2016 vs 2015
Number of Properties Sold 29 41 44 35 -20%
Sold Dollar Volume 49,887,400 100,590,475 92,140,500 85,017,500 -8%
Avg Days on Market 337 271 254 209 -18%
Avg List Price 1,850,100 2,710,488 2,215,682 2,529,171 14%
Avg Sale Price 1,720,255 2,453,426 2,094,102 2,429,071 16%
Median Sale Price .91 1,375,000 1,175,000 1,325,000 13%
Avg List Price/Sq. Ft. 1,209.39 1,425.76 1435.72 1,540.35 7%
Avg Sell Price/Sq. Ft. 1,109.59 1,328.21 1,371.45 1,477.06 8%
Average Sold/List Price % .91 .93 .96 .95 -1%
Highest Sold Price 7,500,000 17,000,000 13,200,000 15,000,000 14%
Lowest Sold Price 289,000 300,000 405,000 425,000 5%
VACANT LAND 2013 2014 2015 2016 2016 vs 2015
Units Sold 1 4 4 0 -100%
Sold Dollar Volume 175,000 19,050,000 14,500,000 0 -100%
Avg Days on Market 0 354 357 0 -100%
Avg List Price 175,000 5,405,000 8,472,500 0 -100%
Avg Sale Price 175,000 4,762,500 7,250,000 0 -100%
Median Sale Price 175,000 3,675,000 7,250,000 0 -100%
Average Sold/List Price % 1.0 .91 .87 0 -100%
Highest Sold Price 175,000 10,100,000 7,250,000 0 -100%
Lowest Sold Price 175,000 1,600,000 4,400,000 0 -100%
The statistics above compare Jan-May months 2013 to 2016 for the Central Core with a year-over-year percentage comparing 2016 to 2015. All of the numbers in these charts are Closed Transactions.
Source Aspen/Glenwood Springs MLS. The information provided is deemed reliable but has been provided by third par ties. There is no guarantee that the information is accurate and this may not reflect all of the real estate activity in the area. Square footage is an estimate only.
average sale price
average sell price/sq. ft.
average days on market
$2.43 million 209$1,477.06
C O N D O S / T H / D U P L E X

14 jamesbenvenuto.com
SINGLE FAMILY HOMES 2013 2014 2015 2016 2016 vs 2015
Number of Properties Sold 7 6 6 4 -33%
Sold Dollar Volume 55,280,000 35,090,000 53,625,000 30,025,455 -44%
Avg Days on Market 493 429 317 374 18%
Avg List Price 7,897,413 7,232,500 10,257,000 9,497,250 -7%
Avg Sale Price 5,300,000 5,848,333 8,937,500 7,506,364 -16%
Median Sale Price 5,300,000 3,670,000 7,875,000 8,080,000 3%
Avg List Price/Sq. Ft. 1679.95 1270.55 1511.10 2029.77 34%
Avg Sell Price/Sq. Ft. 1468.22 1037.20 1336.15 1,666.92 25%
Average Sold/List Price % .90 .83 .89 .81 -9%
Highest Sold Price 17,500,000 14,500,000 17,250,000 9,365,455 -46%
Lowest Sold Price 2,800,000 2,650,000 3,450,000 4,500,000 30%
VACANT LAND 2013 2014 2015 2016 2016 vs 2015
Units Sold 0 0 1 1 0%
Sold Dollar Volume 0 0 4,500,000 10,000,000 122%
Avg Days on Market 0 0 1041 46 -96%
Avg List Price 0 0 5,000,000 11,000,000 120%
Avg Sale Price 0 0 4,500,000 10,000,000 122%
Median Sale Price 0 0 4,500,000 10,000,000 122%
Average Sold/List Price % 0 0 .89 .91 2%
Highest Sold Price 0 0 4,500,000 10,000,000 122%
Lowest Sold Price 0 0 4,500,000 10,000,000 122%
The statistics above compare Jan-May months 2013 to 2016 for Red Mountain with a year-over-year percentage comparing 2016 to 2015. All of the numbers in these charts are Closed Transactions.
Source Aspen/Glenwood Springs MLS. The information provided is deemed reliable but has been provided by third par ties. There is no guarantee that the information is accurate and this may not reflect all of the real estate activity in the area. Square footage is an estimate only.
R E D M O U N T A I N
LIST PRICE VS.
SALES PRICERed mountain is the place to list high and negotiate down.
average sale price
average sell price/sq. ft.
average days on market
$7.5 million 374$1,666.92
S I N G L E F A M I L Y H O M E S
2013 2014 2015 2016
List price Sales price
2200
1500
800

15jamesbenvenuto.com
SINGLE FAMILY HOMES 2013 2014 2015 2016 2016 vs 2015
Number of Properties Sold 4 8 9 1 -89%
Sold Dollar Volume 25,900,000 37,806,617 39,580,000 5,065,000 -87%
Avg Days on Market 182 236 192 381 98%
Avg List Price 7,680,000 4,860,321 4,695,000 5,995,000 28%
Avg Sale Price 6,475,000 4,725,827 4,397,778 5,065,000 15%
Median Sale Price 5,062,500 3,804,500 3,900,000 5,065,000 30%
Avg List Price/Sq. Ft. 2000.04 1,467,10 1,634.23 1,388.05 -15%
Avg Sell Price/Sq. Ft. 1,756.93 1,409.08 1,532.38 1,172.73 -23%
Average Sold/List Price % .89 .95 .94 .84 -11%
Highest Sold Price 11,000,000 13,022,617 6,550,000 5,065,000 -23%
Lowest Sold Price 4,775,000 1,425,000 3,650,000 5,065,000 39%
CONDOS/TH/HALF DUPLEX 2013 2014 2015 2016 2016 vs 2015
Units Sold 0 0 1 1 0%
Sold Dollar Volume 0 0 4,500,000 10,000,000 122%
Avg Days on Market 0 0 1041 46 -96%
Avg List Price 0 0 5,000,000 11,000,000 120%
Avg Sale Price 0 0 4,500,000 10,000,000 122%
Median Sale Price 0 0 4,500,000 10,000,000 122%
Average Sold/List Price % 0 0 .89 .91 2%
Highest Sold Price 0 0 4,500,000 10,000,000 122%
Lowest Sold Price 0 0 4,500,000 10,000,000 122%
VACANT LAND 2013 2014 2015 2016 2016 vs 2015
Units Sold 2 1 2 0 -100%
Sold Dollar Volume 4,480,000 3,880,000 9,862,500 0 -100%
Avg Days on Market 786 133 414 0 -100%
Avg List Price 2,522,750 3,900,000 5,022,500 0 -100%
Avg Sale Price 4,480,000 3,880,000 4,931,250 0 -100%
Median Sale Price 2,240,000 3,880,000 4,931,250 0 -100%
Average Sold/List Price % .89 .99 .98 0 -100%
Highest Sold Price 2,300,000 3,880,000 6,150,000 0 -100%
Lowest Sold Price 2,180,000 3,880,000 3,712,5000 0 -100%
The statistics above compare Jan-May months 2013 to 2016 for the West End with a over-year percentage comparing 2016 to 2015.
Source Aspen/Glenwood Springs MLS. The information provided is deemed reliable but has been provided by third par ties. There is no guarantee that the information is accurate and this may not reflect all of the real estate activity in the area. Square footage is an estimate only.
W E S T E N D
average sale price
average sell price/sq. ft.
average sold/ list pirce %
$5.07 million .81$1,172.73
S I N G L E F A M I L Y H O M E S

SPEND LESS IN ASPEN
PRICE PER SQUARE FOOT COMPARISON
16 jamesbenvenuto.com
W E S T A S P E N
567N ORT H S TA RWOOD.COM | L I S T ED FOR $ 5 ,995 , 0 0 0
2013 2014 2015 2016
East Aspen Aspen Core West Aspen

17jamesbenvenuto.com
SINGLE FAMILY HOMES 2013 2014 2015 2016 2016 vs 2015
Number of Properties Sold 10 15 6 3 -50%
Sold Dollar Volume 26,338,300 93,040,000 59,068,000 18,651,488 -68%
Avg Days on Market 502 342 311 336 8%
Avg List Price 2,940,950 7,104,533 11,720,000 7,531,333 -36%
Avg Sale Price 2,633,830 6,202,667 9,844,667 6,217,163 -37%
Median Sale Price 2,350,000 5,200,000 9,250,000 5,500,000 -41%
Avg List Price/Sq. Ft. 801.65 1052.08 1,424.64 1,355.34 -5%
Avg Sell Price/Sq. Ft. 715.78 926.91 1,223.56 1,158.60 -5%
Average Sold/List Price % .91 .88 .86 .86 0%
Highest Sold Price 9,000,000 13,500,000 17,250,000 10,401,488 -40%
Lowest Sold Price 656,500 1,050,000 3,850,000 2,750,000 -29%
CONDOS/TH/HALF DUPLEX 2013 2014 2015 2016 2016 vs 2015
Number of Properties Sold 7 6 15 4 -73%
Sold Dollar Volume 8,003,000 20,690,000 42,490,000 3,669,000 -91%
Avg Days on Market 342 321 477 133 -72%
Avg List Price 1,244,700 3,783,333 3,046,600 959,750 -68%
Avg Sale Price 1,143,286 3,448,333 2,832,667 917,250 -68%
Median Sale Price 675,000 3,775,000 3,700,000 692,500 -81%
Avg List Price/Sq. Ft. 545.61 859.08 806.49 715.74 -11%
Avg Sell Price/Sq. Ft. 499.31 778.70 749.61 685.58 -9%
Average Sold/List Price % .92 .91 .93 .97 4%
Highest Sold Price 2,850,000 4,800,000 4,897,500 2,125,000 -57%
Lowest Sold Price 108,000 1,400,000 1000,000 159,000 -84%
VACANT LAND 2013 2014 2015 2016 2016 vs 2015
Units Sold 1 2 5 2 -60%
Sold Dollar Volume 3,250,000 6,000,000 18,900,000 8,442,500 -55%
Avg Days on Market 670 498 498 248 -50%
Avg List Price 3,980,000 3,450,000 4,029,000 4,475,500 11%
Avg Sale Price 3,250,000 3,000,000 3,780,000 4,221,250 12%
Median Sale Price 3,250,000 3,000,000 3,900,000 4,221,250 8%
Average Sold/List Price % .82 .85 .94 .94 0%
Highest Sold Price 3,250,000 4,000,000 5,750,000 4,392,500 -24%
Lowest Sold Price 3,250,000 2,000,000 1,800,000 4,050,000 125%
The statistics above compare Jan-May months 2013 to 2016 for the West Aspen with a year-over-year percentage comparing 2016 to 2015.
Source Aspen/Glenwood Springs MLS. The information provided is deemed reliable but has been provided by third par ties. There is no guarantee that the information is accurate and this may not reflect all of the real estate activity in the area. Square footage is an estimate only.
average sale price
average sell price/sq. ft.
average days on market
$5.5 million 336$1,158.60
S I N G L E F A M I L Y H O M E S

18 jamesbenvenuto.com
MCCLAIN FLATS/STARWOOD
SINGLE FAMILY HOMES 2013 2014 2015 2016 2016 vs 2015
Number of Properties Sold 2 2 1 0 -100%
Sold Dollar Volume 5,600,000 32,000,000 19,300,000 0 -100%
Avg Days on Market 776 366 330 0 -100%
Avg List Price 3,450,000 18,700,000 23,000,000 0 -100%
Avg Sale Price 3,000,000 16,000,000 19,300,000 0 -100%
Median Sale Price 2,800,000 16,000,000 19,300,000 0 -100%
Avg List Price/Sq. Ft. 2,656.65 1,897.78 1,447.54 0 -100%
Avg Sell Price/Sq. Ft. 2,148.08 1,597.81 1,214.68 0 -100%
Average Sold/List Price % .85 .83 .84 0 -100%
Highest Sold Price 2,850,000 26,000,000 19,300,000 0 -100%
Lowest Sold Price 2,750,000 6,000,000 19,300,000 0 -100%
VACANT LAND 2013 2014 2015 2016 2016 vs 2015
Units Sold 4 2 2 2 0%
Sold Dollar Volume 8,150,000 5,670,000 3,900,000 4,221,250 8%
Avg Days on Market 194 276 802 248 -69%
Avg List Price 2,373,750 3,050,000 2,500,000 4,475,000 79%
Avg Sale Price 2,037,500 2,835,000 1,950,000 4,221,250 116%
Median Sale Price 1,650,000 2,835,000 1,950,000 4,221,250 116%
Average Sold/List Price % .86 .86 .79 .94 19%
Highest Sold 3,350,000 4,600,000 2,700,000 4,392,500 63%
The statistics below compare Jan-May months 2013 to 2016 for McClain Flats with a year-over-year percentage comparing 2016 to 2015. All of the numbers in these charts are Closed Transactions.
Source Aspen/Glenwood Springs MLS. The information provided is deemed reliable but has been provided by third par ties. There is no guarantee that the information is accurate and this may not reflect all of the real estate activity in the area. Square footage is an estimate only.
average sold/ list price %units sold
.942V A C A N T L A N D

19jamesbenvenuto.com
I can’t say enough about James’s professionalism and his extensive knowledge of the real estate market. During the time our home was on the market the experience at each phase of the sale effort was superior. He always showed a high level of commitment to the service of selling our home.
Once we entered into the escrow phase he came through with timely recommendations as to making the transaction as easy as possible during what is without a doubt a very involved process. He was always available to answer any questions and made us feel like helping us was his highest priority.
I would highly recommend James Benvenuto for anyone’s real estate needs.
Most Sincerely, Very Pleased and Satisfied Clients,
Barbara and Chuck Besanty

20 jamesbenvenuto.com
SNOWMASS VILLAGE – ALL MLS
25%SINGLE FAMILY HOME SALES
INCREASE
AVERAGE COST PER SQUARE
FOOTCONDO VS. SINGLE
FAMILY HOMES
average sale price
average sell price/sq. ft.
average days on market
$3.58 million 378$954.91
S I N G L E F A M I L Y H O M E S
2013 2014 2015 2016
2200
1500
800
Single Family Home Condo

21jamesbenvenuto.com
SINGLE FAMILY HOMES 2013 2014 2015 2016 2016 vs 2015
Number of Properties Sold 12 17 12 15 25%
Sold Dollar Volume 24,900,000 42,369,000 54,536,500 66,797,000 22%
Avg Days on Market 309 202 245 378 54%
Avg List Price 2,310,000 2,770,229 5,052,083 5,075,600 0%
Avg Sale Price 2,075,000 2,492,294 4,544,708 4,453,133 -2%
Median Sale Price 2,110,000 1,675,000 5,497,500 3,584,000 -35%
Avg List Price/Sq. Ft. 697.44 739.45 1022.60 1082.90 6%
Avg Sell Price/Sq. Ft. 633.44 669.68 924.76 954.91 3%
Average Sold/List Price % .92 .91 .90 .89 -1%
Highest Sold Price 3,415,000 8,600,000 8,350,000 10,595,000 27%
Lowest Sold Price 660,000 785,000 1,600,000 1,518,000 -5%
CONDOS/TH/HALF DUPLEX 2013 2014 2015 2016 2016 vs 2015
Number of Properties Sold 65 48 50 35 -30%
Sold Dollar Volume 46,320,058 42,139,055 53,415,417 34,203,875 -36%
Avg Days on Market 204 272 324 390 20%
Avg List Price 770,688 955,357 1,138,418 689.13 -100%
Avg Sale Price 712,616 877,897 1,068,308 640.70 -100%
Median Sale Price 465,025 595,000 750,000 600,000 -20%
Avg List Price/Sq. Ft. 754.78 715.17 752.65 689.13 -8%
Avg Sell Price/Sq. Ft. 707.32 660.95 702.02 640.70 -9%
Average Sold/List Price % .94 .93 .93 .94 1%
Highest Sold Price 3,300,000 3,750,000 3,500,000 3,200,000 -9%
Lowest Sold Price 183,500 71,000 193,000 225,000 17%
VACANT LAND 2013 2014 2015 2016 2016 vs 2015
Units Sold 1 6 2 3 50%
Sold Dollar Volume 575,000 10,935,000 2,600,000 7,165,000 176%
Avg Days on Market 1092 396 53 320 504%
Avg List Price 750,000 2,052,333 1,300,000 2,566,333 97%
Avg Sale Price 575,000 1,822,500 1,300,000 2,388,333 84%
Median Sale Price 575,000 1,325,000 1,300,000 2,800,000 115%
Average Sold/List Price % .77 .89 1.0 .92 -8%
Highest Sold Price 575,000 3,600,000 1,450,000 3,300,000 128%
Lowest Sold Price 575,000 695,000 1,150,000 1,065,000 -7%
The statistics compare Jan-May months 2013 to 2016 for Snowmass Village with a with a year-over-year percentage comparing 2016 to 2015. All of the numbers in these charts are Closed Transactions.
Source Aspen/Glenwood Springs MLS. The information provided is deemed reliable but has been provided by third par ties. There is no guarantee that the information is accurate and this may not reflect all of the real estate activity in the area. Square footage is an estimate only.

22 jamesbenvenuto.com
H O R S E R A N C H
SINGLE FAMILY HOMES 2013 2014 2015 2016 2016 vs 2015
Number of Properties Sold 1 1 1 0 -100%
Sold Dollar Volume 3,415,000 1,500,000 2,100,000 0 -100%
Avg Days on Market 40 440 320 0 -100%
Avg List Price 3,495,000 1,650,000 2,295,000 0 -100%
Avg Sale Price 3,415,000 1,500,000 2,100,000 0 -100%
Median Sale Price 3,415,000 1,500,000 2,1000,000 0 -100%
Avg List Price/Sq. Ft. 909.92 679.57 781.94 0 -100%
Avg Sell Price/Sq. Ft. 899.09 617.79 715.50 0 -100%
Average Sold/List Price % .98 .91 .92 0 -100%
Highest Sold Price 3,415,000 1,500,000 2,100,000 0 -100%
Lowest Sold Price 3,415,000 1,500,000 2,100,000 0 -100%
VACANT LAND 2013 2014 2015 2016 2016 vs 2015
Units Sold 0 0 1 0 -100%
Sold Dollar Volume 0 0 1,150,000 0 -100%
Avg Days on Market 0 0 73 0 -100%
Avg List Price 0 0 1,150,000 0 -100%
Avg Sale Price 0 0 1,150,000 0 -100%
Median Sale Price 0 0 1,150,000 0 -100%
Average Sold/List Price % 0 0 1 0 -100%
Highest Sold Price 0 0 1,150,000 0 -100%
Lowest Sold Price 0 0 1,150,000 0 -100%
The statistics above compare Jan-May months 2013 to 2016 for Horse Ranch with a year-over-year percentage comparing 2016 to 2015. All of the numbers in these charts are Closed Transactions.
Source Aspen/Glenwood Springs MLS. The information provided is deemed reliable but has been provided by third par ties. There is no guarantee that the information is accurate and this may not reflect all of the real estate activity in the area. Square footage is an estimate only.

23jamesbenvenuto.com
MELTON RANCH/WILDRIDGE
SINGLE FAMILY HOMES 2013 2014 2015 2016 2016 vs 2015
Number of Properties Sold 2 4 0 3 -100%
Sold Dollar Volume 2,800,000 6,732,000 0 6,375,000 -100%
Avg Days on Market 93 250 0 167 -100%
Avg List Price 1,400,000 1,816,250 0 683.97 -100%
Avg Sale Price 1,400,000 1,683,000 0 629.14 -100%
Median Sale Price 1,400,000 1,635,500 0 2,240,000 -100%
Avg List Price/Sq. Ft. 550.37 587.95 0 683.97 -100%
Avg Sell Price/Sq. Ft. 550.37 545.48 0 629.14 -100%
Average Sold/List Price % 1 .93 0 .92 -100%
Highest Sold Price 1,450,000 1,850,000 0 2,300,000 -100%
Lowest Sold Price 1,350,000 1,575,000 0 1,835,000 -100%
VACANT LAND 2013 2014 2015 2016 2016 vs 2015
Units Sold 1 0 0 0 -100%
Sold Dollar Volume 575,000 0 0 0 -100%
Avg Days on Market 1092 0 0 0 -100%
Avg List Price 750,000 0 0 0 -100%
Avg Sale Price 575,000 0 0 0 -100%
Median Sale Price 575,000 0 0 0 -100%
Average Sold/List Price % .77 0 0 0 -100%
Highest Sold Price 575,000 0 0 0 -100%
Lowest Sold Price 575,000 0 0 0 -100%
The statistics above compare Jan-May months 2013 to 2016 for Melton Ranch/Wildridge with a year-over-year percentage comparing 2016 to 2015. All of the numbers in these charts are Closed Transactions.
Source Aspen/Glenwood Springs MLS. The information provided is deemed reliable but has been provided by third par ties. There is no guarantee that the information is accurate and this may not reflect all of the real estate activity in the area. Square footage is an estimate only.
average sale price
average sell price/sq. ft.
average days on market
$2.24 million 167$629.14
S I N G L E F A M I L Y H O M E S

24 jamesbenvenuto.com
T H E P I N E S
SINGLE FAMILY HOMES 2013 2014 2015 2016 2016 vs 2015
Number of Properties Sold 0 0 1 1 0%
Sold Dollar Volume 0 0 8,350,000 4,500,000 -46%
Avg Days on Market 0 0 224 1,571 601%
Avg List Price 0 0 8,995,000 5,950,000 -34%
Avg Sale Price 0 0 8,350,000 4,500,000 -46%
Median Sale Price 0 0 8,350,000 4,500,000 -46%
Avg List Price/Sq. Ft. 0 0 1487 1,075.95 -28%
Avg Sell Price/Sq. Ft. 0 0 1380.17 813.74 -41%
Average Sold/List Price % 0 0 .93 .76 -18%
Highest Sold Price 0 0 8,350,000 4,500,000 -46%
Lowest Sold Price 0 0 8,350,000 4,500,000 -46%
VACANT LAND 2013 2014 2015 2016 2016 vs 2015
Units Sold 0 1 0 2 -100%
Sold Dollar Volume 0 3,600,000 0 6,100,000 -100%
Avg Days on Market 0 21 0 440 -100%
Avg List Price 0 3,600,000 0 3,249,000 -100%
Avg Sale Price 0 3,600,000 0 3,050,000 -100%
Median Sale Price 0 3,600,000 0 3,050,000 -100%
Average Sold/List Price % 0 1 0 .94 -100%
Highest Sold Price 0 3,600,000 0 3,300,000 -100%
Lowest Sold Price 0 3,600,000 0 2,800,000 -100%
The statistics above compare Jan-May months 2013 to 2016 for The Pines with a year-over-year percentage comparing 2016 to 2015. All of the numbers in these charts are Closed Transactions.
Source Aspen/Glenwood Springs MLS. The information provided is deemed reliable but has been provided by third par ties. There is no guarantee that the information is accurate and this may not reflect all of the real estate activity in the area. Square footage is an estimate only.
average sale price
average sell price/sq. ft.
average days on market
$4.5 million 1,571$813.74
S I N G L E F A M I L Y H O M E S

25jamesbenvenuto.com
R I D G E R U N
SINGLE FAMILY HOMES 2013 2014 2015 2016 2016 vs 2015
Number of Properties Sold 3 3 8 3 -63%
Sold Dollar Volume 5,970,000 6,661,000 27,159,000 8,388,000 -69%
Avg Days on Market 679 272 291 349 20%
Avg List Price 2,271,667 2,449,667 3,695,625 2,985,000 -19%
Avg Sale Price 1,990,000 2,220,333 3,394,875 2,796,000 -18%
Median Sale Price 2,075,000 2,511,000 2,387,500 2,220,000 -7%
Avg List Price/Sq. Ft. 725 607.38 846.03 694.86 -18%
Avg Sell Price/Sq. Ft. 648.05 606.37 768.67 650.91 -15%
Average Sold/List Price % .90 .90 .90 .93 3%
Highest Sold Price 3,020,000 2,800,000 6,375,000 4,650,000 -27%
Lowest Sold Price 875,000 1,350,000 1,000,000 1,518,000 52%
The statistics above compare Jan-May months 2013 to 2016 for the Ridge Run with a over-year percentage comparing 2016 to 2015.
Source Aspen/Glenwood Springs MLS. The information provided is deemed reliable but has been provided by third par ties. There is no guarantee that the information is accurate and this may not reflect all of the real estate activity in the area. Square footage is an estimate only.
average sale price
average sell price/sq. ft.
average days on market
$2.2 million 349$650.91
S I N G L E F A M I L Y H O M E S

26 jamesbenvenuto.com
WOO D RU N / T WO C R EEK S
SINGLE FAMILY HOMES 2013 2014 2015 2016 2016 vs 2015
Number of Properties Sold 4 5 2 5 150%
Sold Dollar Volume 9,895,000 30,514,000 11,105,000 30,514,000 175%
Avg Days on Market 402 355 108 355 229%
Avg List Price 2,908,850 7,068,000 6,722,500 7,068,000 5%
Avg Sale Price 2,473,750 6,102,800 5,552,500 6,102,800 10%
Median Sale Price 2,410,000 4,675,000 5,552,500 4,675,000 -16%
Avg List Price/Sq. Ft. 771.62 1,502.22 1242.95 1,502.22 21%
Avg Sell Price/Sq. Ft. 656.93 1,305.93 1056.97 1,305.33 23%
Average Sold/List Price % .85 .89 .85 .89 5%
Highest Sold Price 2,975,000 8,600,000 5,610,000 10,595,000 89%
Lowest Sold Price 2,100,000 3,560,000 5,495,000 3,560,000 -35%
VACANT LAND 2013 2014 2015 2016 2016 vs 2015
Units Sold 0 1 0 0 -100%
Sold Dollar Volume 0 3,075,000 0 0 -100%
Avg Days on Market 0 546 0 0 -100%
Avg List Price 0 3,500,000 0 0 -100%
Avg Sale Price 0 3,075,000 0 0 -100%
Median Sale Price 0 3,075,000 0 0 -100%
Average Sold/List Price % 0 .88 0 0 -100%
Highest Sold Price 0 3,075,000 0 0 -100%
Lowest Sold Price 0 3,075,000 0 0 -100%
The statistics above compare Jan-May months 2013 to 2016 for Wood Run/Two Creeks with a year-over-year percentage comparing 2016 to 2015. All of the numbers in these charts are Closed Transactions.
Source Aspen/Glenwood Springs MLS. The information provided is deemed reliable but has been provided by third par ties. There is no guarantee that the information is accurate and this may not reflect all of the real estate activity in the area. Square footage is an estimate only.
average sale price
average sell price/sq. ft.
average days on market
$4.675 million 355$1,305.33
S I N G L E F A M I L Y H O M E S

27jamesbenvenuto.com
SINGLE FAMILY HOMES 2013 2014 2015 2016 2016 vs 2015
Number of Properties Sold 0 0 1 2 100%
Sold Dollar Volume 0 0 7,297,500 7,525,000 3%
Avg Days on Market 0 0 117 291 149%
Avg List Price 0 0 7,995,000 8,325,000 4%
Avg Sale Price 0 0 7,297,000 7,525,000 3%
Median Sale Price 0 0 7,297,000 7,525,000 3%
Avg List Price/Sq. Ft. 0 0 1,497.19 1,309.39 -13%
Avg Sell Price/Sq. Ft. 0 0 1,366.57 1,184.06 -13%
Average Sold/List Price % 0 0 .91 .90 -1%
Highest Sold Price 0 0 7,297,500 7,550,000 3%
Lowest Sold Price A 0 7,297,500 7,500,000 3%
The statistics above compare Jan-May months 2013 to 2016 for The Divide with a year-over-year percentage comparing 2016 to 2015. All of the numbers in these charts are Closed Transactions.
Source Aspen/Glenwood Springs MLS. The information provided is deemed reliable but has been provided by third par ties. There is no guarantee that the information is accurate and this may not reflect all of the real estate activity in the area. Square footage is an estimate only.
T H E D I V I D E
average sale price
average sell price/sq. ft.
average days on market
$5.07 million 381$1,172.73
S I N G L E F A M I L Y H O M E S

28 jamesbenvenuto.com
$ 1 0 M I L L I O N +
SINGLE FAMILY HOMES 2013 2014 2015 2016 2016 vs 2015
Number of Properties Sold 3 10 11 5 -55%
Sold Dollar Volume 43,500,000 139,033,617 151,122,000 57,501,389 -62%
Avg Days on Market 402 559 256 194 -24%
Avg List Price 16,666,667 16,417,257 15,931,364 13,758,800 -14%
Avg Sale Price 14,500,000 13,902,262 13,738,364 11,500,389 -16%
Median Sale Price 15,000,000 12,448,000 13,200,000 10,595,000 -20%
Avg List Price/Sq. Ft. 2,170.00 1,767.65 2,064.04 2,261.77 10%
Avg Sell Price/Sq. Ft. 1840.86 1,512.57 1,810.26 1,978.20 9%
Average Sold/List Price % .86 .85 .87 .83 -5%
Highest Sold Price 17,500,000 26,000,000 19,300,000 15,000,000 -22%
Lowest Sold Price 11,000,000 9,500,000 9,047,000 9,365,455 4%
The statistics above compare properties listed at 10m+ in both Aspen and Snowmass that sold Jan-May year-over-year percentage comparing 2016 to 2015. All of the numbers in these charts are Closed Transactions.
Source Aspen/Glenwood Springs MLS. The information provided is deemed reliable but has been provided by third par ties. There is no guarantee that the information is accurate and this may not reflect all of the real estate activity in the area. Square footage is an estimate only.
average sale price
average sell price/sq. ft.
average days on market
$10.6 million 194$1,978.20
S I N G L E F A M I L Y H O M E S
AVERAGE SALE VS.
LIST PRICEFAMILY HOMES
2016
20
15
2014
20
13
Average sale price Average list price

29jamesbenvenuto.com
C O R E V A L U E S
UNCOMPROMISING INTEGRITY
PROFESSIONAL EXPERTISE
CLIENT ASTONISHMENT

30 jamesbenvenuto.com
PR IVATE RES IDENCE CLUBS
ASPEN
2013 2014 2015 2016 2016 vs 2015
Number of Properties Sold 39 44 38 33 -13%
Sold Dollar Volume 27,222,750 17,538,300 6,053,000 2,622,400 -57%
Avg Days on Market 310 375 263 183 -30%
Avg List Price 721,033 437,052 171,771 87,730 -49%
Avg Sale Price 698,019 388,598 159,302 79,467 -50%
Median Sale Price 170,000 204,500 90,000 79,000 -12%
Avg List Price/Sq. Ft. 295.69 195.91 96.82 52.67 -46%
Avg Sell Price/Sq. Ft. 283.36 180.44 89.34 47.67 -47%
Average Sold/List Price % .88 .88 .88 .90 2%
Highest Sold Price 8,000,000 1,400,000 785,000 280,000 -64%
Lowest Sold Price 7,250 16,000 20,000 5,500 -73%
SNOWMASS
2013 2014 2015 2016 2016 vs 2015
Number of Properties Sold 10 16 6 16 167%
Sold Dollar Volume 1,885,133 3,704,000 1,218,500 2,176,500 79%
Avg Days on Market 208 263 146 205 40%
Avg List Price 215,503 252,312 219,500 154,500 -30%
Avg Sale Price 188,513 231,500 203,083 136,031 -33%
Median Sale Price 163,066 270,000 205,000 91,500 -55%
Avg List Price/Sq. Ft. 108.75 123.39 114.13 78.18 -31%
Avg Sell Price/Sq. Ft. 95.35 113.59 105.54 69.35 -34%
Average Sold/List Price % .88 .91 .91 .87 -5%
Highest Sold Price 280,000 275,000 287,000 275,000 -4%
Lowest Sold Price 99,000 129,000 110,000 70,000 -36%
The statistics above compare Jan-May months 2013 to 2016 for Private Residence Clubs (Fractional Ownership) year-over-year percentage comparing 2016 to 2015. All of the numbers in these charts are Closed Transactions.
Source Aspen/Glenwood Springs MLS. The information provided is deemed reliable but has been provided by third par ties. There is no guarantee that the information is accurate and this may not reflect all of the real estate activity in the area. Square footage is an estimate only.

31jamesbenvenuto.com
T H E ROOF TOP DECK OF T H E DA N C I N G B E A R - A PR I VAT E R E S I D EN CE CLU B
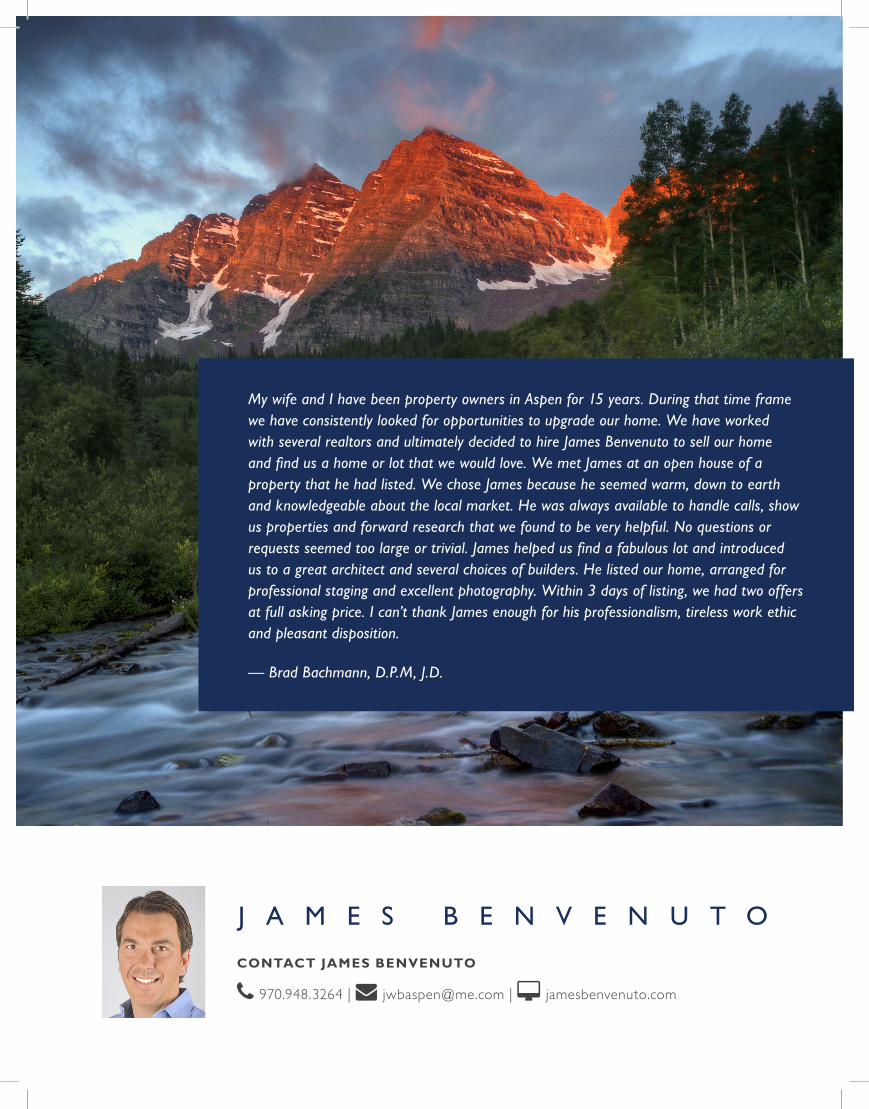
My wife and I have been property owners in Aspen for 15 years. During that time frame we have consistently looked for opportunities to upgrade our home. We have worked with several realtors and ultimately decided to hire James Benvenuto to sell our home and find us a home or lot that we would love. We met James at an open house of a property that he had listed. We chose James because he seemed warm, down to earth and knowledgeable about the local market. He was always available to handle calls, show us properties and forward research that we found to be very helpful. No questions or requests seemed too large or trivial. James helped us find a fabulous lot and introduced us to a great architect and several choices of builders. He listed our home, arranged for professional staging and excellent photography. Within 3 days of listing, we had two offers at full asking price. I can’t thank James enough for his professionalism, tireless work ethic and pleasant disposition.
— Brad Bachmann, D.P.M, J.D.
CONTACT JAMES BENVENUTO
970.948.3264 | [email protected] | jamesbenvenuto.com
J A M E S B E N V E N U T O