cidco @smartcidco-smartcity.niua.org/wp-content/uploads/2015/12/... · 2017-11-14 · case study of...
TRANSCRIPT
April - June 2015 • Vol. 1 No. 2
CIDCO@SMART
TeamSiddharth PanditA. N. Nanda KishoreRyan Christopher SequeiraDinesh Kapur
Project CoordinatorP. Suresh Babu (Additional Chief Planner, A&R)
Newsletter
CidCo Smart City Lab @ NiUA
Research ProjectRedevelopment of Urban Villages
datasheeton gaothans in Navi Mumbai
National Smart Cities MissionLaunch of Smart Cities Mission by Hon’ble Prime Minister
Initiatives@ Smart City LabCidCo Smart City Lab drives Citizen Engagement through ideas Competitions
CIDCO goes Globalinterviews with Mrs. Rekha dhar, Mr. Soma Vijaykumar and Mr. P. Suresh Babu
Smart City CornerEmerging ideas: Electric Vehicles—An Economic opportunity
datasheet on Central Government subsidies for Electric Vehicles
Conversations: open data for Smarter Cities
innovations: Smart Tree
2
7
9
11
12
16
18
22
20
Redevelopment of Urban VillagesResearch Project
Case study of Navi Mumbai through the summary of a research study on impact of redevelopment of gaothans and surrounding areas in Navi Mumbai
by increasing floor space index (FSI) to four
The phenomenon of urban villages in the Indian context can be viewed from two different perspectives. The first suggests that under the influence of rapid urbanisation and economic development, many urban areas in Indian cities and towns have doubled or tripled in terms of land cover and population. As a result, a large number of traditional rural villages,
located in the peripheral areas of cities, have became part of the city’s built up areas.
They have been turned into the so-called ‘urban villages’ and examples can be seen across the country - from small towns like Bhiwadi in the National Capital Region, to cities like Hyderabad and Bangalore.
The second is the case of existing urban villages within city limits and includes examples such as Delhi, Mumbai and Navi Mumbai. In the case of Delhi, these urban villages also identified as lal dora, are exempted from municipal and building
codes. In Navi Mumbai, these urban villages, locally known as gaothans were initially not included in the land acquisition process during the formation of the Navi Mumbai New Town Development Authority Notified Area.
IntroductionIn 2014, the Maharashtra State Government proposed a resolution for Urban Renewal Schemes for gaothans and surrounding areas in the Navi Mumbai Notified Area to regulate unplanned and haphazard development. The scheme relies heavily on voluntary and participatory involvement of eligible inhabitants of gaothans and surrounding areas. It is envisaged that this redevelopment approach will also address unauthorised development of structures owned by the Project Affected Persons (PAPs) and other individuals on lands acquired by CIDCO. The proposed redevelopment and regularisation of the existing eligible structures by increasing the floor space index to four must be preceded by an impact assessment study as per the instructions of the High Court of the State of Maharashtra.
A joint research study was initiated by the CIDCO Smart City Lab at NIUA with the Royal Institute of Chartered Surveyors, India as per the scope of work suggested by CIDCO. The research study assesses the impact of the redevelopment of gaothans and surrounding areas by increasing the FSI to 4 on physical, social infrastructure and other facilities such as parking, open spaces etc. Ten gaothans were studied in detail to map the status quo of the urban villages in Navi Mumbai and re-establish the need for redevel-opment, and providing communities with better quality of life and safe neighbourhoods. The infrastructure gap analysis was
followed by a financial analysis to assess the economic viability of the scheme with the demonstration of a financial model for the Shelgar1 gaothan. The study concludes with guidelines to mitigate the impacts of future developments as part of the reform action plan.
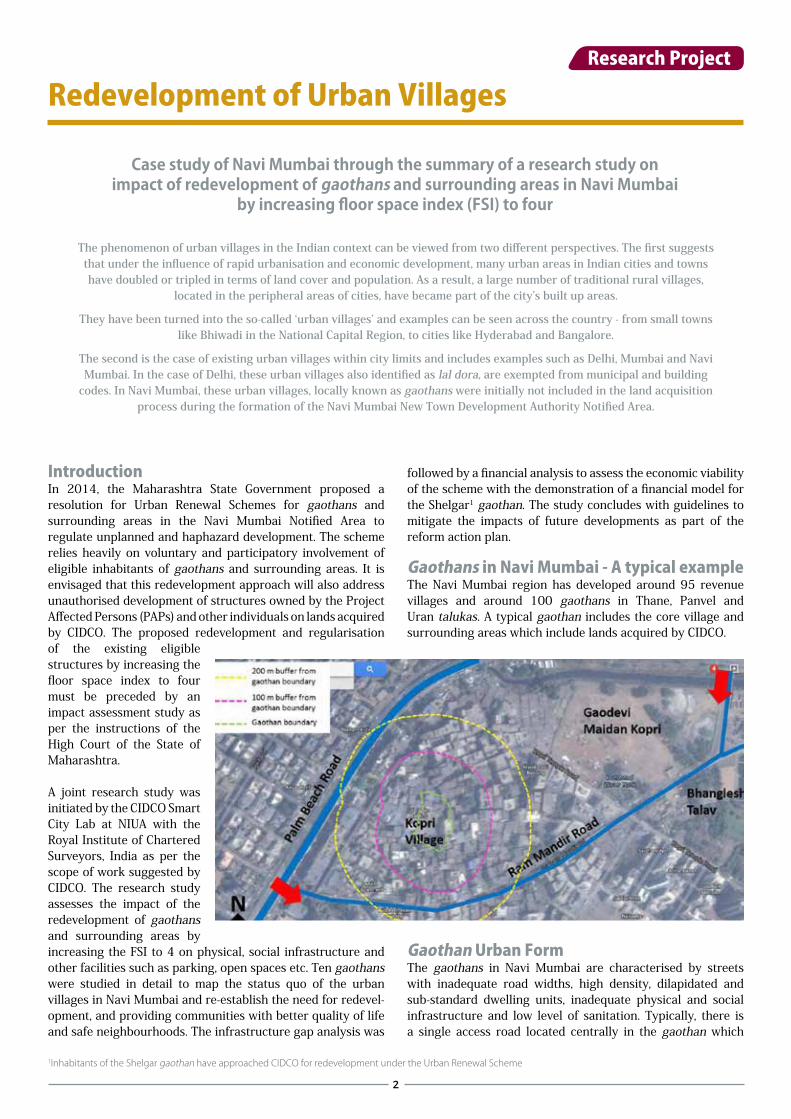
Gaothans in Navi Mumbai - A typical example The Navi Mumbai region has developed around 95 revenue villages and around 100 gaothans in Thane, Panvel and Uran talukas. A typical gaothan includes the core village and surrounding areas which include lands acquired by CIDCO.
Gaothan Urban FormThe gaothans in Navi Mumbai are characterised by streets with inadequate road widths, high density, dilapidated and sub-standard dwelling units, inadequate physical and social infrastructure and low level of sanitation. Typically, there is a single access road located centrally in the gaothan which
1Inhabitants of the Shelgar gaothan have approached CIDCO for redevelopment under the Urban Renewal Scheme
2
further leads to pedestrian approach roads to individual housing clusters or units. The land-use change around these gaothans has influenced the urban form greatly. During site visits to selected gaothans, it was observed that the houses in the core gaothan area are on small plots, typically one-room or two-room tenements with a small place for cooking and sanitation.
Most of the gaothans have grown outside their boundaries up to around 200 metres or even beyond. The sprawl areas have plotted housing (on land given to villagers under the 12.5 per cent compensation scheme), chawls and walk up apartments.
People have attempted to adopt to changing needs within their constraints which is clearly evident in the transformations seen in the physical form of the villages and in urban sprawl areas. The nature and extent of the transformation in gaothan housing is influenced by the location of each specific gaothan in the Navi Mumbai region, proximity to public transit (local trains, bus), industries and other employment opportunities in the region provided by the Thane-Belapur Industrial Belt, IT industries, APMC Market in Vashi, Taloja-Kalamboli Industrial Development, CBD in Belapur, and future development projects such as Navi Mumbai Metro, Mumbai Trans Harbour Link (MTHL) and Navi Mumbai Airport.
Infrastructure Services within GaothansThe following observations about the status quo of the infrastructure provision and services is based on primary visits by the project team and also based on available secondary data. These are general observations on the infrastructure aspects common to most of the gaothan and peripheral areas.
Water SupplyEssential water supply to the gaothans is provided by NMMC and CIDCO in their respective areas of jurisdiction. Elevated service reservoirs were found in most of the gaothans through which water is supplied to the residents. Limited hours of supply is provided on daily basis.
Sewage and Surface Water DisposalSewage disposal system has been laid in the gaothans by the respective authorities, however, open drains were found in most of the gaothans in the core areas. This has led to unhygienic living conditions. Surface water flows through the roads and pathways into nallahs or open drains nearby gaothans.
Solid Waste Management Garbage collection bins were occasionally found installed in the gaothans. However, there is no proper collection and disposal system for solid waste. In most of the gaothans, solid waste was found littered on the outskirts of the gaothan. The gaothans within the prime nodes like Belapur, Vashi, Nerul were found to be cleaner due to more organised solid waste management systems in these areas.
Electricity Electricity for gaothans is supplied by MSEDBL (Maharashtra State Electricity Distribution Board Limited). There is a severe load shedding problem especially during summers.
Fire ServicesNo special fire stations are provided for gaothans. In case of fire, the fire stations at the node level would serve the emergency. However, the roads in the gaothan are narrow (varying from 1m footpaths to 3m - 6m vehicular roads) and not adequate for fire access to all the localities.
Roads Typically, every gaothan is served by a nodal level major road and internal vehicular road approximately 4m to 6m wide. The internal vehicular road is further split into multiple pedestrian roads to access individual houses/properties. Pedestrian roads are also used by bicycles, two wheelers and auto rickshaws depending on the width of the roads. Usually, the surface treatments/pavements on the roads are appropriate to ensure pedestrian safety. Certain internal roads are dark due to narrow width and tall buildings along the roads. Such roads are inadequate for fire access in case of fire hazards. Internal
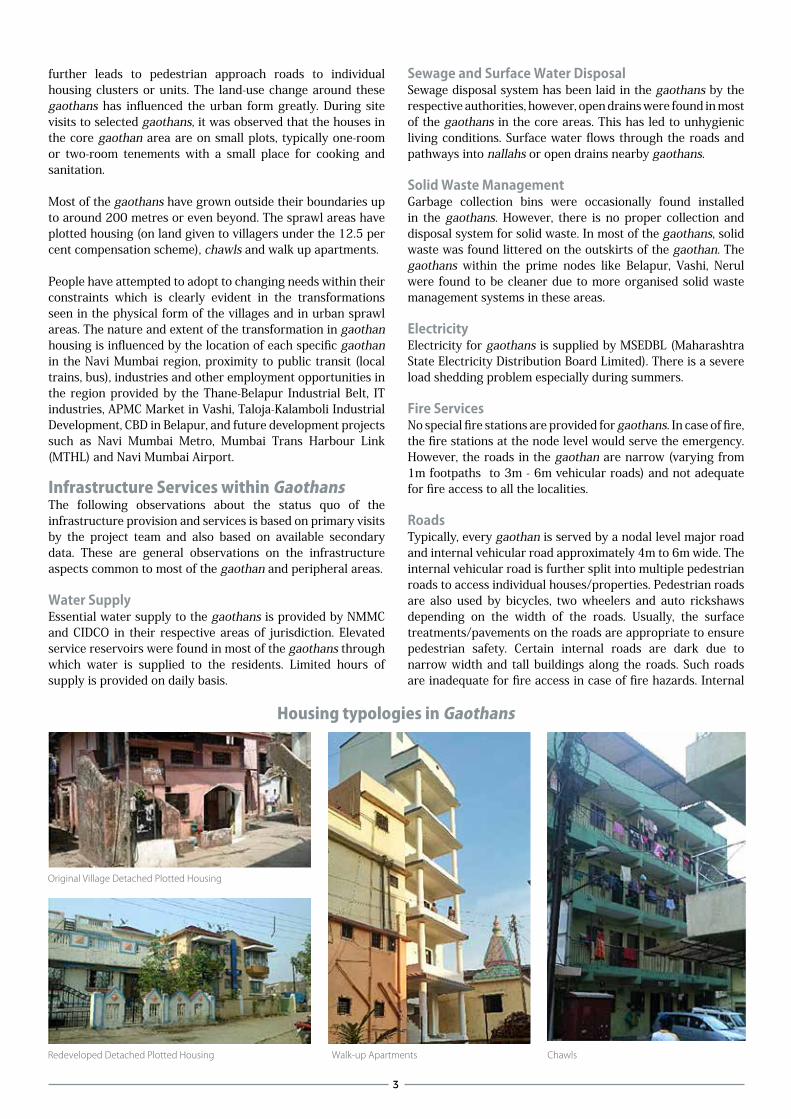
Original Village Detached Plotted Housing
Redeveloped Detached Plotted Housing Walk-up Apartments Chawls
Housing typologies in Gaothans
3
roads in case of gaothan communities also act as social spaces and informal areas.
Social InfrastructureEvery gaothan has a municipal school or zila parishad school for primary and secondary level depending on the jurisdiction of the gaothan. Every school has a sizable open space / playground. Some gaothans also have aanganwadis or pre-primary schools. Gaothans in urbanised nodes like Vashi, Nerul, Belapur etc. also have private pre-primary schools. For secondary schools, colleges, and higher education, the gaothan population is dependent on the nodal infrastructure.
The school playgrounds are used for other occasional social activities. For other social amenities like auditoria, public gardens, sports facilities etc., the nearest nodal level facilities are used. Public toilets are provided in gaothans, however, due to a lack of regular maintenance, cleanliness and hygiene, the toilets are not in use.
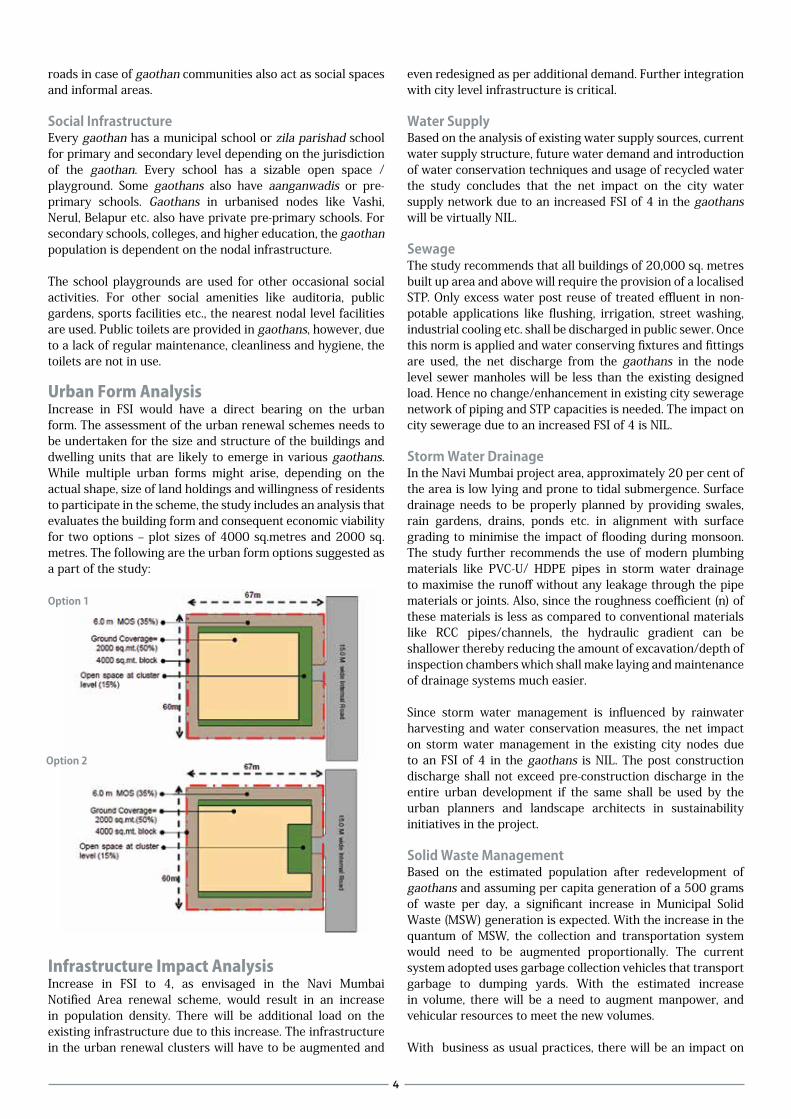
Urban Form Analysis Increase in FSI would have a direct bearing on the urban form. The assessment of the urban renewal schemes needs to be undertaken for the size and structure of the buildings and dwelling units that are likely to emerge in various gaothans. While multiple urban forms might arise, depending on the actual shape, size of land holdings and willingness of residents to participate in the scheme, the study includes an analysis that evaluates the building form and consequent economic viability for two options – plot sizes of 4000 sq.metres and 2000 sq. metres. The following are the urban form options suggested as a part of the study:
Infrastructure Impact AnalysisIncrease in FSI to 4, as envisaged in the Navi Mumbai Notified Area renewal scheme, would result in an increase in population density. There will be additional load on the existing infrastructure due to this increase. The infrastructure in the urban renewal clusters will have to be augmented and
even redesigned as per additional demand. Further integration with city level infrastructure is critical.
Water SupplyBased on the analysis of existing water supply sources, current water supply structure, future water demand and introduction of water conservation techniques and usage of recycled water the study concludes that the net impact on the city water supply network due to an increased FSI of 4 in the gaothans will be virtually NIL.
SewageThe study recommends that all buildings of 20,000 sq. metres built up area and above will require the provision of a localised STP. Only excess water post reuse of treated effluent in non-potable applications like flushing, irrigation, street washing, industrial cooling etc. shall be discharged in public sewer. Once this norm is applied and water conserving fixtures and fittings are used, the net discharge from the gaothans in the node level sewer manholes will be less than the existing designed load. Hence no change/enhancement in existing city sewerage network of piping and STP capacities is needed. The impact on city sewerage due to an increased FSI of 4 is NIL.
Storm Water DrainageIn the Navi Mumbai project area, approximately 20 per cent of the area is low lying and prone to tidal submergence. Surface drainage needs to be properly planned by providing swales, rain gardens, drains, ponds etc. in alignment with surface grading to minimise the impact of flooding during monsoon. The study further recommends the use of modern plumbing materials like PVC-U/ HDPE pipes in storm water drainage to maximise the runoff without any leakage through the pipe materials or joints. Also, since the roughness coefficient (n) of these materials is less as compared to conventional materials like RCC pipes/channels, the hydraulic gradient can be shallower thereby reducing the amount of excavation/depth of inspection chambers which shall make laying and maintenance of drainage systems much easier.
Since storm water management is influenced by rainwater harvesting and water conservation measures, the net impact on storm water management in the existing city nodes due to an FSI of 4 in the gaothans is NIL. The post construction discharge shall not exceed pre-construction discharge in the entire urban development if the same shall be used by the urban planners and landscape architects in sustainability initiatives in the project.
Solid Waste Management Based on the estimated population after redevelopment of gaothans and assuming per capita generation of a 500 grams of waste per day, a significant increase in Municipal Solid Waste (MSW) generation is expected. With the increase in the quantum of MSW, the collection and transportation system would need to be augmented proportionally. The current system adopted uses garbage collection vehicles that transport garbage to dumping yards. With the estimated increase in volume, there will be a need to augment manpower, and vehicular resources to meet the new volumes.
With business as usual practices, there will be an impact on
Option 1
Option 2
4
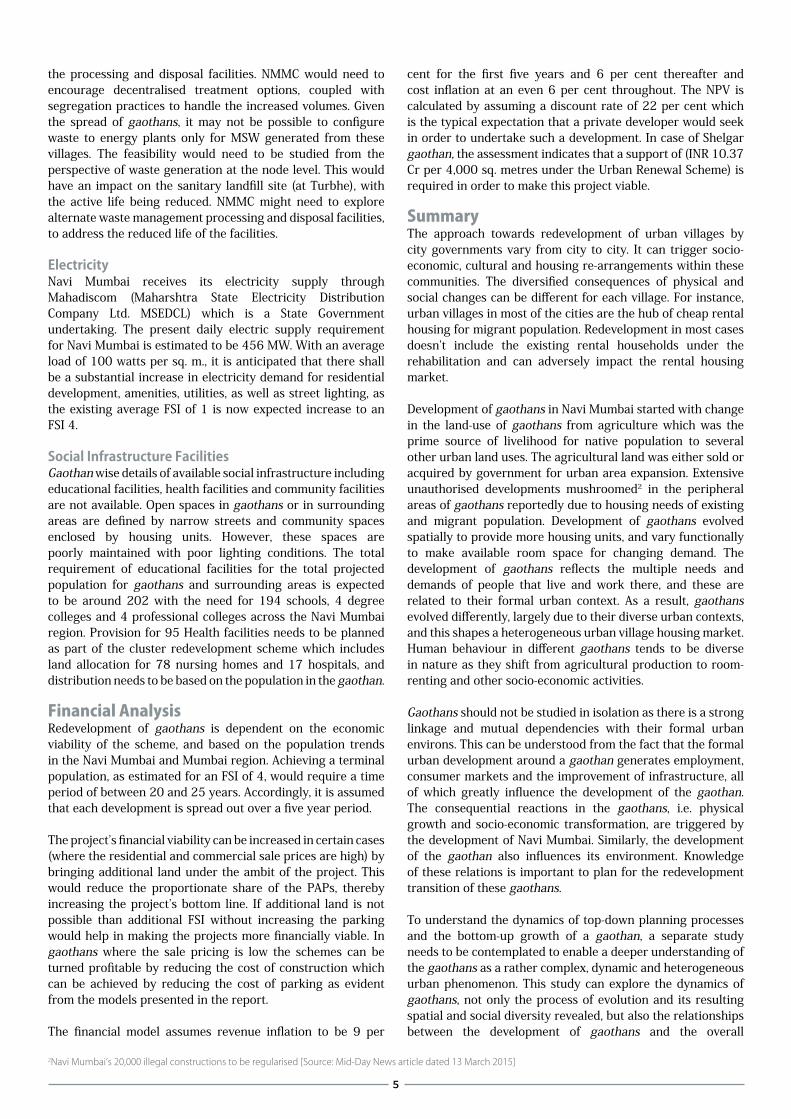
the processing and disposal facilities. NMMC would need to encourage decentralised treatment options, coupled with segregation practices to handle the increased volumes. Given the spread of gaothans, it may not be possible to configure waste to energy plants only for MSW generated from these villages. The feasibility would need to be studied from the perspective of waste generation at the node level. This would have an impact on the sanitary landfill site (at Turbhe), with the active life being reduced. NMMC might need to explore alternate waste management processing and disposal facilities, to address the reduced life of the facilities.
Electricity Navi Mumbai receives its electricity supply through Mahadiscom (Maharshtra State Electricity Distribution Company Ltd. MSEDCL) which is a State Government undertaking. The present daily electric supply requirement for Navi Mumbai is estimated to be 456 MW. With an average load of 100 watts per sq. m., it is anticipated that there shall be a substantial increase in electricity demand for residential development, amenities, utilities, as well as street lighting, as the existing average FSI of 1 is now expected increase to an FSI 4.
Social Infrastructure FacilitiesGaothan wise details of available social infrastructure including educational facilities, health facilities and community facilities are not available. Open spaces in gaothans or in surrounding areas are defined by narrow streets and community spaces enclosed by housing units. However, these spaces are poorly maintained with poor lighting conditions. The total requirement of educational facilities for the total projected population for gaothans and surrounding areas is expected to be around 202 with the need for 194 schools, 4 degree colleges and 4 professional colleges across the Navi Mumbai region. Provision for 95 Health facilities needs to be planned as part of the cluster redevelopment scheme which includes land allocation for 78 nursing homes and 17 hospitals, and distribution needs to be based on the population in the gaothan.
Financial AnalysisRedevelopment of gaothans is dependent on the economic viability of the scheme, and based on the population trends in the Navi Mumbai and Mumbai region. Achieving a terminal population, as estimated for an FSI of 4, would require a time period of between 20 and 25 years. Accordingly, it is assumed that each development is spread out over a five year period.
The project’s financial viability can be increased in certain cases (where the residential and commercial sale prices are high) by bringing additional land under the ambit of the project. This would reduce the proportionate share of the PAPs, thereby increasing the project’s bottom line. If additional land is not possible than additional FSI without increasing the parking would help in making the projects more financially viable. In gaothans where the sale pricing is low the schemes can be turned profitable by reducing the cost of construction which can be achieved by reducing the cost of parking as evident from the models presented in the report.
The financial model assumes revenue inflation to be 9 per
cent for the first five years and 6 per cent thereafter and cost inflation at an even 6 per cent throughout. The NPV is calculated by assuming a discount rate of 22 per cent which is the typical expectation that a private developer would seek in order to undertake such a development. In case of Shelgar gaothan, the assessment indicates that a support of (INR 10.37 Cr per 4,000 sq. metres under the Urban Renewal Scheme) is required in order to make this project viable.
SummaryThe approach towards redevelopment of urban villages by city governments vary from city to city. It can trigger socio-economic, cultural and housing re-arrangements within these communities. The diversified consequences of physical and social changes can be different for each village. For instance, urban villages in most of the cities are the hub of cheap rental housing for migrant population. Redevelopment in most cases doesn’t include the existing rental households under the rehabilitation and can adversely impact the rental housing market.
Development of gaothans in Navi Mumbai started with change in the land-use of gaothans from agriculture which was the prime source of livelihood for native population to several other urban land uses. The agricultural land was either sold or acquired by government for urban area expansion. Extensive unauthorised developments mushroomed2 in the peripheral areas of gaothans reportedly due to housing needs of existing and migrant population. Development of gaothans evolved spatially to provide more housing units, and vary functionally to make available room space for changing demand. The development of gaothans reflects the multiple needs and demands of people that live and work there, and these are related to their formal urban context. As a result, gaothans evolved differently, largely due to their diverse urban contexts, and this shapes a heterogeneous urban village housing market. Human behaviour in different gaothans tends to be diverse in nature as they shift from agricultural production to room-renting and other socio-economic activities.
Gaothans should not be studied in isolation as there is a strong linkage and mutual dependencies with their formal urban environs. This can be understood from the fact that the formal urban development around a gaothan generates employment, consumer markets and the improvement of infrastructure, all of which greatly influence the development of the gaothan. The consequential reactions in the gaothans, i.e. physical growth and socio-economic transformation, are triggered by the development of Navi Mumbai. Similarly, the development of the gaothan also influences its environment. Knowledge of these relations is important to plan for the redevelopment transition of these gaothans.
To understand the dynamics of top-down planning processes and the bottom-up growth of a gaothan, a separate study needs to be contemplated to enable a deeper understanding of the gaothans as a rather complex, dynamic and heterogeneous urban phenomenon. This study can explore the dynamics of gaothans, not only the process of evolution and its resulting spatial and social diversity revealed, but also the relationships between the development of gaothans and the overall
2Navi Mumbai’s 20,000 illegal constructions to be regularised [Source: Mid-Day News article dated 13 March 2015]
5
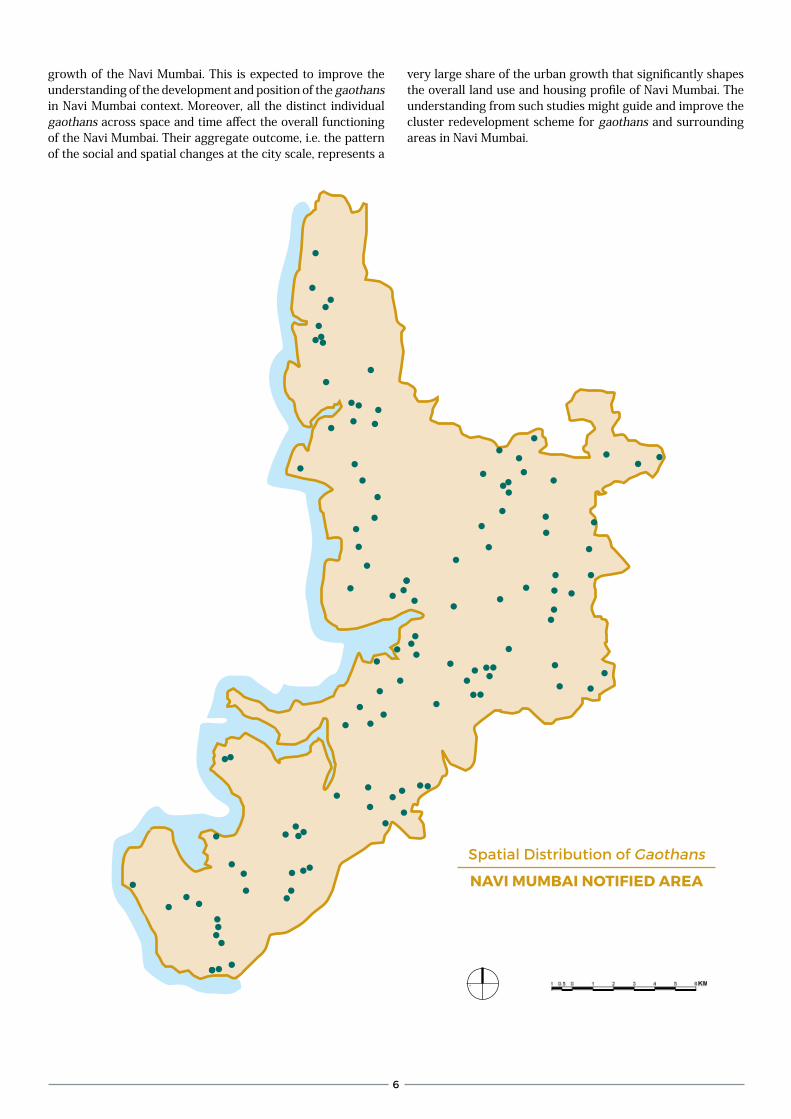
growth of the Navi Mumbai. This is expected to improve the understanding of the development and position of the gaothans in Navi Mumbai context. Moreover, all the distinct individual gaothans across space and time affect the overall functioning of the Navi Mumbai. Their aggregate outcome, i.e. the pattern of the social and spatial changes at the city scale, represents a
very large share of the urban growth that significantly shapes the overall land use and housing profile of Navi Mumbai. The understanding from such studies might guide and improve the cluster redevelopment scheme for gaothans and surrounding areas in Navi Mumbai.
Spatial distribution of Gaothans
Navi MuMbai Notified area
6
Datasheet
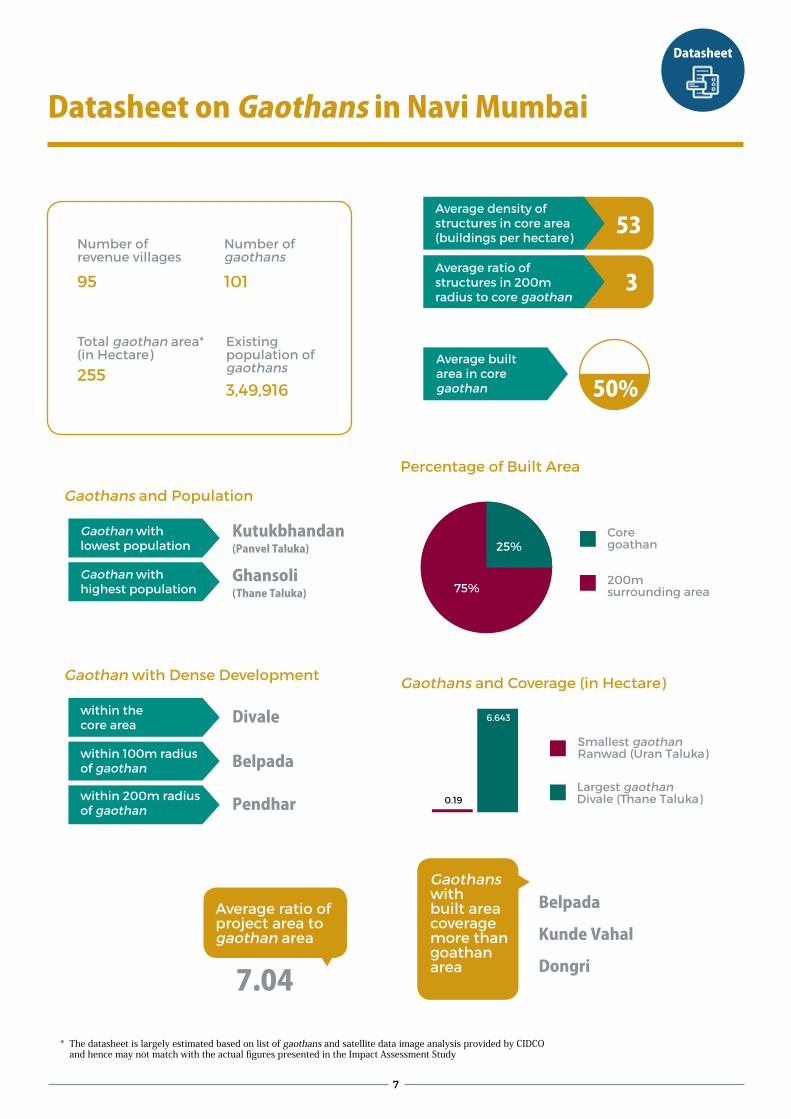
Belpada
Kunde Vahal
Dongri
Number of revenue villages
Number of gaothans
Total gaothan area* (in Hectare)
Existing population of gaothans
95 101
2553,49,916
7.04
Datasheet on Gaothans in Navi Mumbai
Average ratio of project area to gaothan area
Gaothans with built area coverage more than goathan area
Smallest gaothan Ranwad (Uran Taluka)
Core goathan
200m surrounding area
Largest gaothan divale (Thane Taluka)
Gaothans and Coverage (in Hectare)
0.19
6.643within the core area
within 100m radius of gaothan
within 200m radius of gaothan
Divale
Belpada
Pendhar
Gaothan with dense development
Gaothan with lowest population
Gaothan with highest population
Kutukbhandan (Panvel Taluka)
53
3
Ghansoli (Thane Taluka)
Gaothans and Population
Percentage of Built Area
Average density of structures in core area (buildings per hectare)
Average ratio of structures in 200m radius to core gaothan area
Average built area in core gaothan 50%
25%
75%
* The datasheet is largely estimated based on list of gaothans and satellite data image analysis provided by CIDCO and hence may not match with the actual figures presented in the Impact Assessment Study
7
within the core area
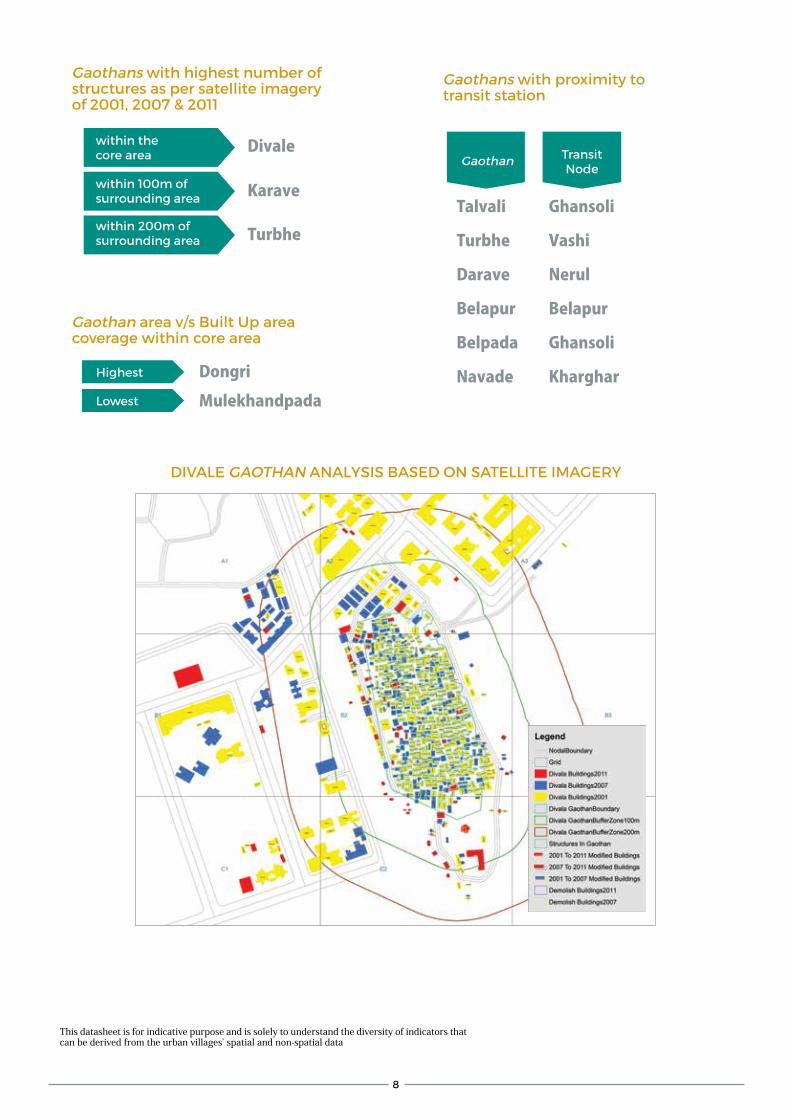
Ghansoli
Darave Nerul
Navade Kharghar
within 100m of surrounding area Talvali
Belapur Belapur
within 200m of surrounding area
Gaothan Transit Node
Turbhe Vashi
Belpada Ghansoli
Divale
Dongri
Karave
Mulekhandpada
Turbhe
This datasheet is for indicative purpose and is solely to understand the diversity of indicators that can be derived from the urban villages’ spatial and non-spatial data
Gaothans with proximity to transit station
Gaothan area v/s Built Up area coverage within core area
Highest
Lowest
Gaothans with highest number of structures as per satellite imagery of 2001, 2007 & 2011
diVALE GAoTHAN ANALYSiS BASEd oN SATELLiTE iMAGERY
8
On 25 June 2015, the Prime Minister of India launched the Smart Cities Mission along with two other programmes (AMRUT and Housing for All) aimed at transforming urbanisation in India.
Objectives of the Smart Cities Mission are toi. Provide basic infrastructureii. Improve quality of lifeiii. Clean and sustainable environmentiv. Apply smart solutionsv. Set examples to be replicated both within and outside the Smart City to catalyse similar developments in other cities Following the approach of area-based developments, the motivation for the Smart Cities Mission is to drive economic growth and improve the quality of life of people by enabling local area development and harnessing technology, especially technology that leads to smart outcomes.
The strategic components of area-based development in the Smart Cities Mission are city improvement (retrofitting), city renewal (redevelopment) and city extension (greenfield development) plus a pan-city initiative in which Smart Solutions are applied to cover a larger part of the city.
Smart City FeaturesSome typical features that the Smart City Mission expects to deliver through comprehensive development in the selected
cities are• Promoting mixed land use in area-based developments• Housing and inclusiveness• Creating walkable localities• Preserving and developing open spaces• Promoting a variety of transport options• Making governance citizen-friendly and cost effective• Giving an identity to the city• Applying smart solutions
Coverage and DurationThe Mission will cover 100 cities and its duration will be five years (FY 2015-16 to FY 2019- 20). The diagram on the following page shows the timeline for the first year of the mission.
The Centre will invest a total of INR 48,000 Crore in 100 cities across the country for 5 years – each Smart City will get INR 100 Crore each for five years. States / ULBs are expected to mobilise additional resources of INR 48,000 Crore as per a 50:50 funding pattern.
Launch of Smart Cities Mission by Hon’ble Prime Minister
National Smart Cities Mission
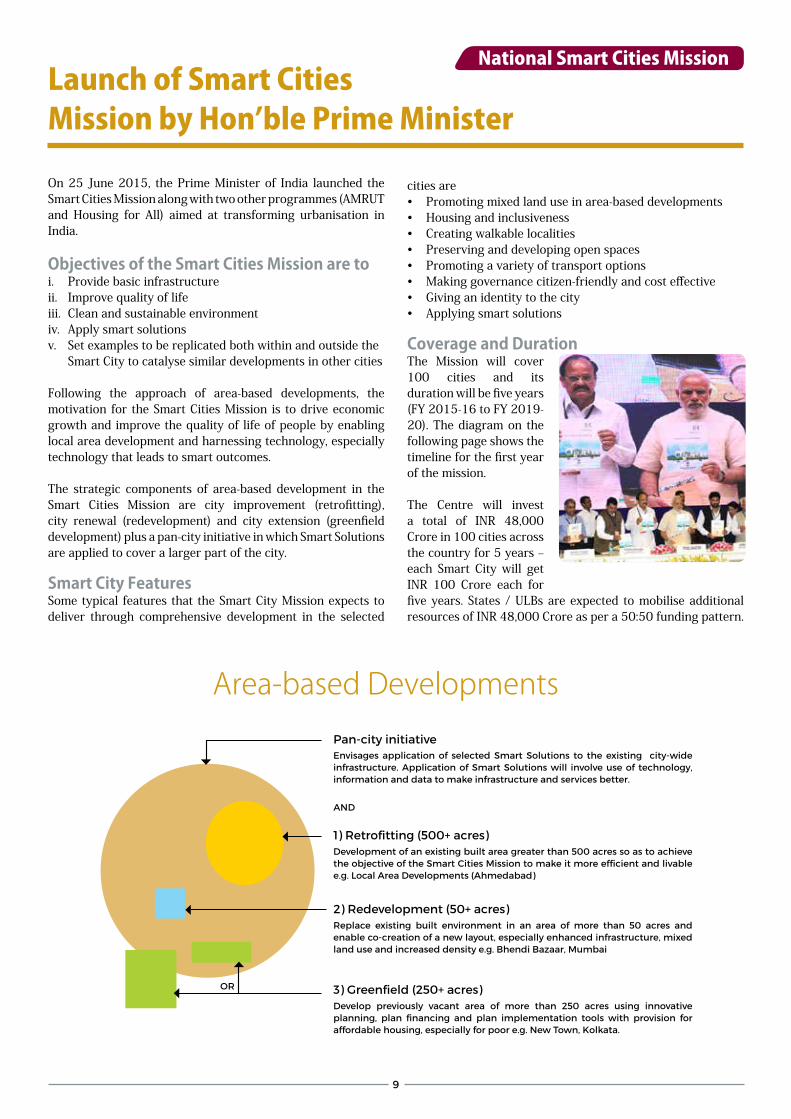
Area-based DevelopmentsPan-city initiativeEnvisages application of selected Smart Solutions to the existing city-wide infrastructure. Application of Smart Solutions will involve use of technology, information and data to make infrastructure and services better.
ANd
oR
1) Retrofitting (500+ acres)development of an existing built area greater than 500 acres so as to achieve the objective of the Smart Cities Mission to make it more efficient and livable e.g. Local Area developments (Ahmedabad)
2) Redevelopment (50+ acres) Replace existing built environment in an area of more than 50 acres and enable co-creation of a new layout, especially enhanced infrastructure, mixed land use and increased density e.g. Bhendi Bazaar, Mumbai
3) Greenfield (250+ acres)develop previously vacant area of more than 250 acres using innovative planning, plan financing and plan implementation tools with provision for affordable housing, especially for poor e.g. New Town, Kolkata.
9
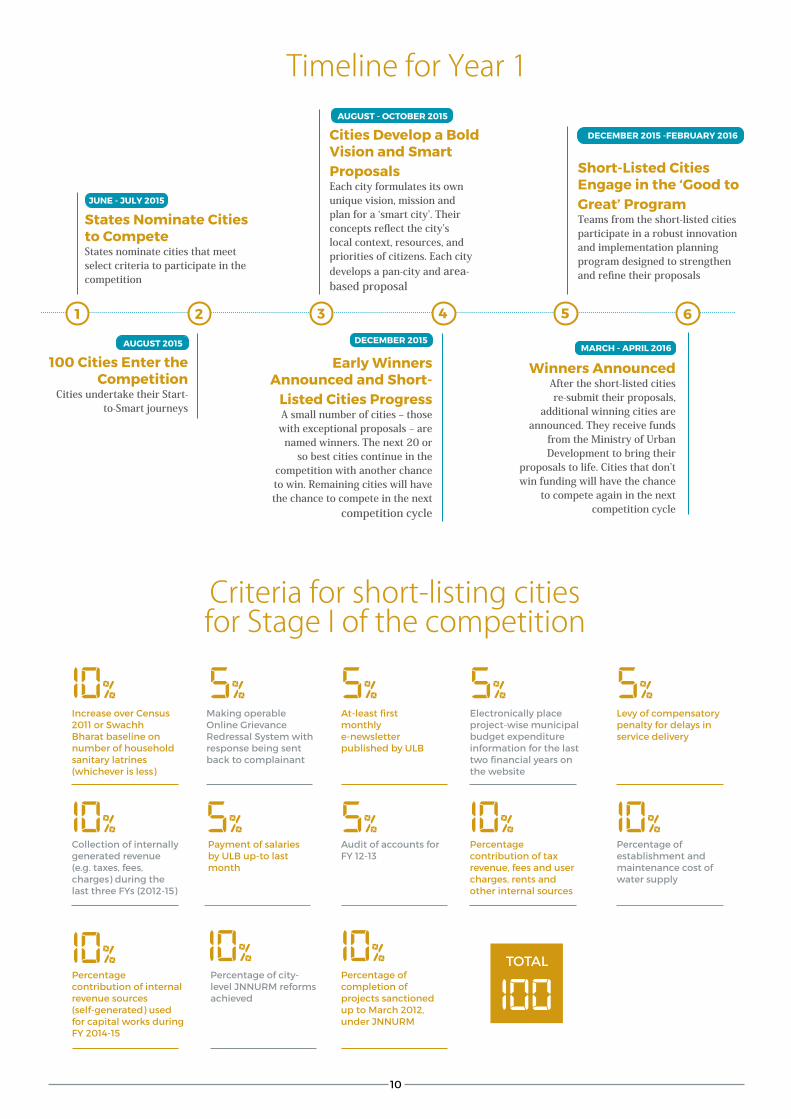
1 65432
States Nominate Cities to CompeteStates nominate cities that meet select criteria to participate in the competition
JuNe - JuLY 2015
100 Cities enter the Competition
Cities undertake their Start-to-Smart journeys
auGuSt 2015
early Winners announced and Short-
Listed Cities ProgressA small number of cities – those with exceptional proposals – are
named winners. The next 20 or so best cities continue in the
competition with another chance to win. Remaining cities will have the chance to compete in the next
competition cycle
deCeMber 2015
Winners announcedAfter the short-listed cities re-submit their proposals,
additional winning cities are announced. They receive funds
from the Ministry of Urban Development to bring their
proposals to life. Cities that don’t win funding will have the chance
to compete again in the next competition cycle
MarCH - aPriL 2016
Short-Listed Cities engage in the ‘Good to Great’ ProgramTeams from the short-listed cities participate in a robust innovation and implementation planning program designed to strengthen and refine their proposals
deCeMber 2015 -februarY 2016Cities develop a bold vision and Smart ProposalsEach city formulates its own unique vision, mission and plan for a ‘smart city’. Their concepts reflect the city’s local context, resources, and priorities of citizens. Each city develops a pan-city and area-based proposal
auGuSt - oCtober 2015
Timeline for Year 1
ToTAL
Collection of internally generated revenue (e.g. taxes, fees, charges) during the last three FYs (2012-15)
Payment of salaries by ULB up-to last month
Audit of accounts for FY 12-13
Levy of compensatory penalty for delays in service delivery
Making operable online Grievance Redressal System with response being sent back to complainant
At-least first monthly e-newsletter published by ULB
Electronically place project-wise municipal budget expenditure information for the last two financial years on the website
increase over Census 2011 or Swachh Bharat baseline on number of household sanitary latrines (whichever is less)
10%
10% 10%10%
10%10% 10%
5% 5%
5%
5%
5%
5%
Percentage of establishment and maintenance cost of water supply
Percentage contribution of internal revenue sources (self-generated) used for capital works duringFY 2014-15
Percentage of city-level JNNURM reforms achieved
Percentage contribution of tax revenue, fees and user charges, rents and other internal sources
Percentage of completion of projects sanctioned up to March 2012, under JNNURM
Criteria for short-listing cities for Stage I of the competition
100
10
Citizen engagement and participatory governance are viewed as two essential prerequisites for urbanisation that is world class, environmentally sustainable and drives economic growth. Involving residents of a city in planning new projects can go a long way in facilitating easier implementation and creating ownership for infrastructure. This is one of the key features and objectives of the 100 smart cities mission.
Building on the curiosity, genuine interest and enthusiasm engendered by the concept of ‘Smart Cities’ the CIDCO Smart City Lab, over the last 3 months, has assisted the Ministry of Urban Development (MoUD) and Pune Municipal Corporation in conceptualising competitions for citizen engagement. For both competitions the CIDCO Smart City Lab took on the responsibility of evaluating entries (a total of around 8,500) along with support in conceptualising the competitions, identifying experts and administration.
Acting as a knowledge partner the CIDCO Smart City Lab in collaboration with the Government of India’s online platform MyGov, organised the ‘Mera Shahar Mera Sapna’ contest, a precursor to the launch of the National Smart Cities Mission. The competition ran from 15 June 2015 to 20 June 2015. Citizens were asked to contribute their ideas and solutions for addressing challenges faced by Indian cities. The format posed 12 questions related to city-level challenges across three
distinct categories. The mix of questions were aimed at crowd-sourcing solutions and understanding the priorities of citizens for informing future strategies.
The interest generated by the competition motivated Pune Municipal Corporation to invite Punekars to share their ideas on making Pune a smarter city. The ‘Maza Swapna, Smart Pune’ competition gave citizens an open ended brief to share their ideas on major themes of urbanisation. Drawing on lessons from MoUD’s competition, the Pune edition took citizen engagement to the next level by organising an online citizen poll to choose the top 10 ideas (out of 30 shortlisted entries). The entries included smart strategies for bicycle sharing schemes, revitalisating the local river, reducing wastage of food, smart garbage management and improving public safety among others.
Both competitions saw enthusiastic and passionate participation with several sensible and innovative suggestions. Moving forward cities should focus on 1) increasing the scope of such citizen engagement (by including offline formats), 2) asking citizens the right questions because the common man may not be an expert but might have insights and 3) doing quick research and demonstration projects to test the feasibility of these ideas or build viable business plans.
CIDCO Smart City Lab drives Citizen Engagement through Ideas Competitions
Initiatives @ Smart City Lab
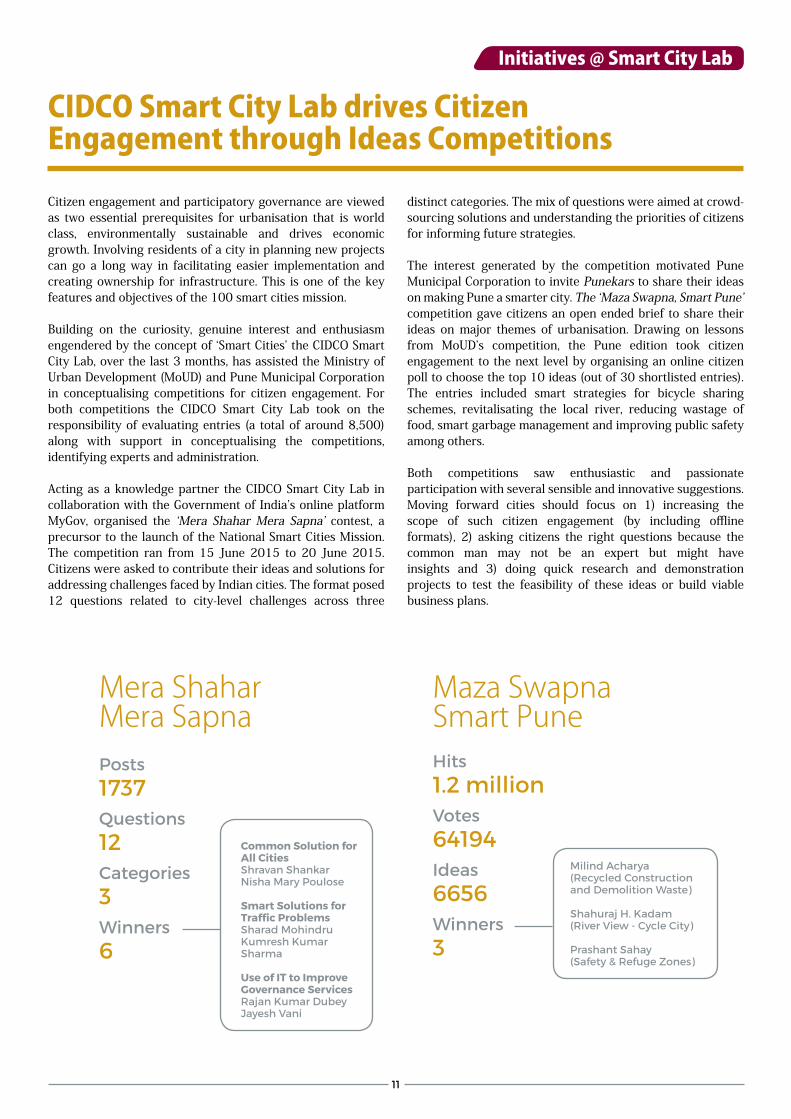
Hits 1.2 millionVotes 64194ideas6656Winners3
Milind Acharya(Recycled Construction and demolition Waste)
Shahuraj H. Kadam(River View - Cycle City)
Prashant Sahay (Safety & Refuge Zones)
Common Solution for all Cities Shravan ShankarNisha Mary Poulose
Smart Solutions for traffic ProblemsSharad MohindruKumresh Kumar Sharma
use of it to improve Governance ServicesRajan Kumar dubeyJayesh Vani
Posts 1737Questions12Categories3Winners6
Maza Swapna Smart Pune
Mera Shahar Mera Sapna
11
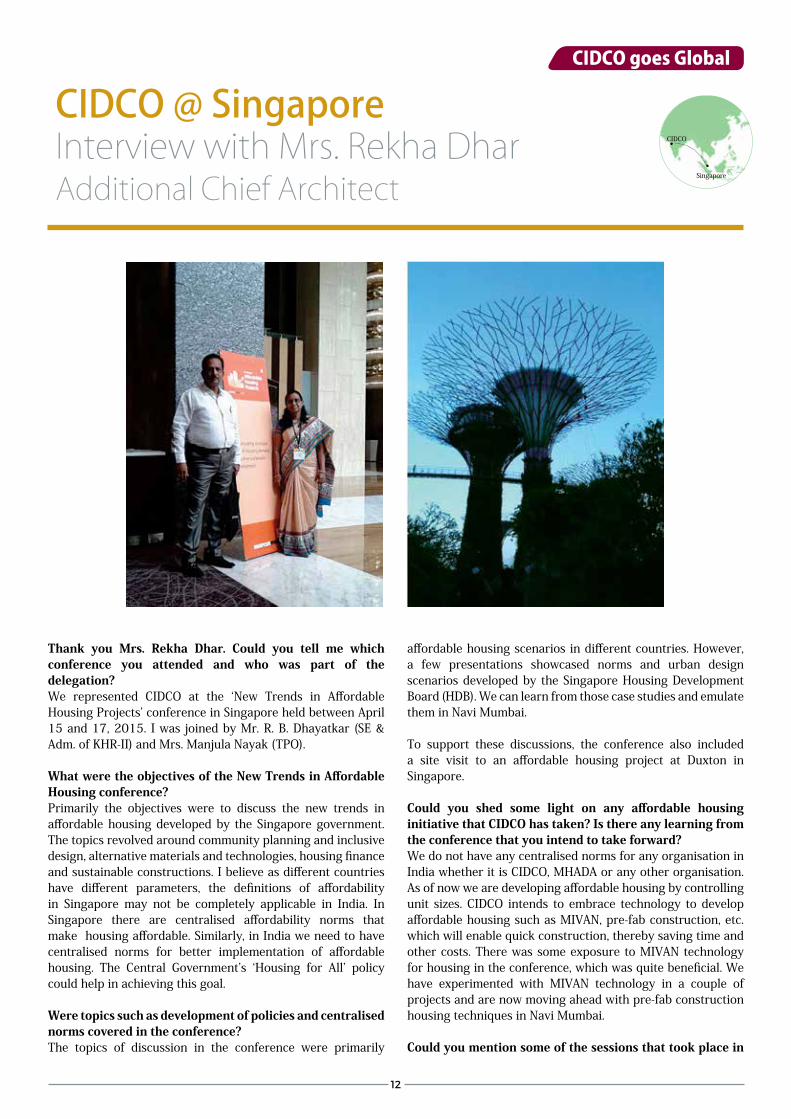
CIDCO @ Singapore Interview with Mrs. Rekha DharAdditional Chief Architect
Thank you Mrs. Rekha Dhar. Could you tell me which conference you attended and who was part of the delegation?We represented CIDCO at the ‘New Trends in Affordable Housing Projects’ conference in Singapore held between April 15 and 17, 2015. I was joined by Mr. R. B. Dhayatkar (SE & Adm. of KHR-II) and Mrs. Manjula Nayak (TPO).
What were the objectives of the New Trends in Affordable Housing conference?Primarily the objectives were to discuss the new trends in affordable housing developed by the Singapore government. The topics revolved around community planning and inclusive design, alternative materials and technologies, housing finance and sustainable constructions. I believe as different countries have different parameters, the definitions of affordability in Singapore may not be completely applicable in India. In Singapore there are centralised affordability norms that make housing affordable. Similarly, in India we need to have centralised norms for better implementation of affordable housing. The Central Government’s ‘Housing for All’ policy could help in achieving this goal.
Were topics such as development of policies and centralised norms covered in the conference?The topics of discussion in the conference were primarily
affordable housing scenarios in different countries. However, a few presentations showcased norms and urban design scenarios developed by the Singapore Housing Development Board (HDB). We can learn from those case studies and emulate them in Navi Mumbai.
To support these discussions, the conference also included a site visit to an affordable housing project at Duxton in Singapore.
Could you shed some light on any affordable housing initiative that CIDCO has taken? Is there any learning from the conference that you intend to take forward?We do not have any centralised norms for any organisation in India whether it is CIDCO, MHADA or any other organisation. As of now we are developing affordable housing by controlling unit sizes. CIDCO intends to embrace technology to develop affordable housing such as MIVAN, pre-fab construction, etc. which will enable quick construction, thereby saving time and other costs. There was some exposure to MIVAN technology for housing in the conference, which was quite beneficial. We have experimented with MIVAN technology in a couple of projects and are now moving ahead with pre-fab construction housing techniques in Navi Mumbai.
Could you mention some of the sessions that took place in
CIDCO goes Global
Singapore
CIDCO
12

the conference that were especially beneficial to you as a participant?There were sessions related to green buildings, affordable housing, design and policy making, financing and affordability which were quite beneficial for the CIDCO team, in general.
Finally, what was your general experience about Singapore?It is a very well designed city. All parts of the city are neat and
clean. Following urban design guidelines is mandatory which makes it a suitable city to live. Most importantly, it is safe for its citizens. In Navi Mumbai, we must implement and follow similar urban design guidelines and try to imbibe them with the ‘Smart Cities’ project. The ongoing Airport Rehabilitation project can be taken as a pilot for the same. Overall, it was an excellent opportunity for learning and bringing back the ideas to Navi Mumbai.
Interview with Mr. Soma VijaykumarChief General Manager (T&A)
Thank you Mr. Vijaykumar. Please tell our readers the topic of the conference that you attended and who else was in the delegation ?I was joined by Mr Venugopal (Officer on Special Duty - Navi Mumbai Airport Influence Notified Area). We represented CIDCO at the ‘Safe Cities’ conference held in Singapore between May 12-14, 2015.
What were the objectives of the Safe Cities conference? How were your views reinforced or changed by the conference?My perception of safe cities conference was limited to the adoption of technologies for surveillance and public safety. Various cities have implemented CCTV systems to monitor law
and order situations. Surveillance technology is also expected to serve as a deterrent for possible criminal and terrorist acts. Technology coupled with rules and regulations for public order and safety leads to safer cities - this is my belief. CIDCO is also investing in public safety and surveillance systems through the usage of CCTV cameras through the Navi Mumbai region.
The Safe Cities conference gave me exposure to aspects of cyber terrorism that confront cities with heavy investments in technology and information systems. Today, city systems carry vast troves of data and are vulnerable to possible acts of cyber terrorism. As CIDCO moves forward with capital investments in infrastructure, due attention now needs to be given to protecting this valuable civic and private data. Public agencies have been grappling with the issue of maintaining the privacy of data and CIDCO should, as always demonstrate leadership for the other agencies to follow.
Could you talk a little bit about the CCTV initiative that CIDCO has undertaken and any learning for this project that you gained from the conference.CIDCO has recently floated a proposal to install 500 CCTV cameras in the Navi Mumbai project area. I shared the details of our specifications with other participants on the first day (focus day) of the conference. I am happy to report that
13
the feedback from experts from the United States and other countries present at the conference, confirmed that CIDCO’s specifications for the project are contemporary. I exchanged ideas on broadening surveillance beyond CCTVs through establishment of a cyber-terrorism cell to interact and interface with our national surveillance agencies. An expert from Interpol gave the attendees ideas of various threats that public agencies have to deal with in this age. A CCTV system needs to be complemented with appropriate human resources to manage the system and communication protocols with national and international safety agencies effectively deter possible acts of violence.
The possibility of data residing across multiple systems necessitates coordination amongst these systems to protect against cyber attacks at multiple points in the overall system.
Can you mention some of the sessions at the Safe Cities Conference that were interesting to you as a participant?There were multiple sessions going on in parallel and so I missed out on some of the sessions. But there were couple of sessions that were very insightful.
There was a session where a speaker from Japan shared his methodology to rank cities based on safety indices. Indian cities were ranked in the mid 40s based on a limited set of parameters such as smart technologies, cyber security and public safety. This methodology needs to be re-examined, especially since it does not consider environmental sustainability, water and air pollution and other natural hazards. We should be looking at the included and omitted parameters to adapt the framework for CIDCO.
Another interesting session was on cyber security in Malaysia. There are opportunities for collaboration between our public safety agencies and Malaysian authorities. The Iskandar Regional Development Authority also presented some of its recent work on cyber security.
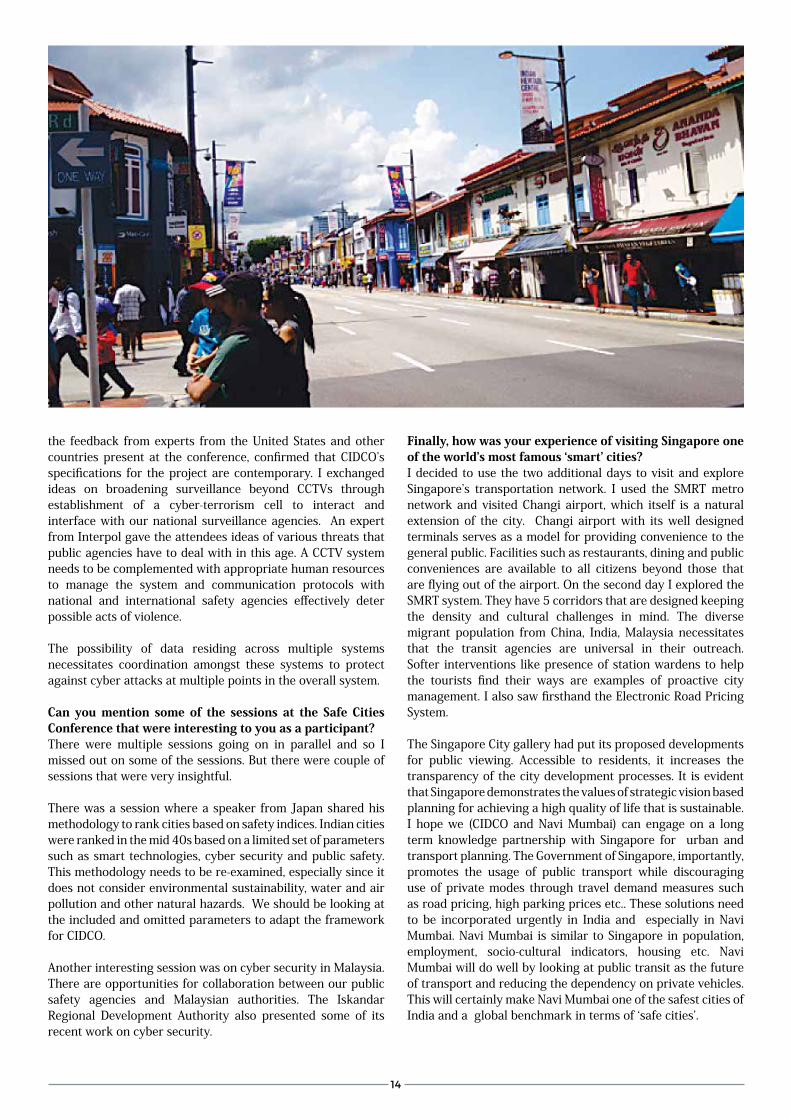
Finally, how was your experience of visiting Singapore one of the world’s most famous ‘smart’ cities?I decided to use the two additional days to visit and explore Singapore’s transportation network. I used the SMRT metro network and visited Changi airport, which itself is a natural extension of the city. Changi airport with its well designed terminals serves as a model for providing convenience to the general public. Facilities such as restaurants, dining and public conveniences are available to all citizens beyond those that are flying out of the airport. On the second day I explored the SMRT system. They have 5 corridors that are designed keeping the density and cultural challenges in mind. The diverse migrant population from China, India, Malaysia necessitates that the transit agencies are universal in their outreach. Softer interventions like presence of station wardens to help the tourists find their ways are examples of proactive city management. I also saw firsthand the Electronic Road Pricing System.
The Singapore City gallery had put its proposed developments for public viewing. Accessible to residents, it increases the transparency of the city development processes. It is evident that Singapore demonstrates the values of strategic vision based planning for achieving a high quality of life that is sustainable. I hope we (CIDCO and Navi Mumbai) can engage on a long term knowledge partnership with Singapore for urban and transport planning. The Government of Singapore, importantly, promotes the usage of public transport while discouraging use of private modes through travel demand measures such as road pricing, high parking prices etc.. These solutions need to be incorporated urgently in India and especially in Navi Mumbai. Navi Mumbai is similar to Singapore in population, employment, socio-cultural indicators, housing etc. Navi Mumbai will do well by looking at public transit as the future of transport and reducing the dependency on private vehicles. This will certainly make Navi Mumbai one of the safest cities of India and a global benchmark in terms of ‘safe cities’.
14
CIDCO @ MalaysiaInterview with Mr. P. Suresh BabuAdditional Chief Planner (A&R)
Thank you for your time Mr. Babu. Please tell our readers about the topic of the conference you attended and who else was part of your delegation?We attended the ‘Global Airport Development Conference - Asia, 2015’ in Kuala Lumpur from 9 to 11th of June 2015. Its focus was airport development and finance. I was joined by Joint Managing Director Ms. V Radha, IAS, Mr. Soma Vijaykumar, Chief General Manager (T&A) and Mr. Chowdhary, Chief Engineer, Navi Mumbai (North) as part of the delegation representing CIDCO.
What was the primary objective of the conference? Did you find your experience to be productive?The conference was primarily meant to bring together airport operators, financers and policy makers to enable sustainable financing of airport development projects of all scales, shapes and sizes, while making them efficient for smooth and quick flow of traffic. Since CIDCO is in the process of building one of the world’s largest greenfield international airports with the aim of offering world class facilities for passengers, aircrafts, airline operations as well as cargo it is useful to know different approaches for financing such infrastructure development.
Can you talk about your airport exposure visit to Kuala Lumpur and Hong Kong airports? Kuala Lumpur and Hong Kong airports handle huge amount traffic from Asia, Middle East and Europe with great efficiency. Kuala Lumpur airport has two terminals which serve domestic as well as international traffic and are connected by an automated shuttle train. Hong Kong airport is currently under construction for addition of a new terminal. Both of these airports are very systematic and efficient and maintain a quick flow of traffic through them. They have been designed and built considering present and future needs.
As the delegation was so diverse, were each of your objectives fully achieved? Even though the conference was focused on financing and sustainability, everything that was discussed was relevant to our work. For example, there was due emphasis on discussing topics such as relief and rehabilitation (R&R), engineering and planning of the airport and administration of the airport. These issues have a considerable impact on financing strategies and hence were part of the discussion.
Were all the issues that CIDCO faces reflected by others at the conference?In overall terms the answer is yes. However, there was a feeling that this should have happened sooner, as we are half way through the process of calling for bids and all. Many of
the financers there might have been interested in partnering with CIDCO on our project. Their expertise could have been leveraged for raising finances and exploring alternate avenues.
Could you talk about the R&R initiative that you at CIDCO are doing at the airport and how it is different from what you saw and heard at the conference? In our airport project there are 10 village settlements or gaothans that have not been acquired by CIDCO. After considerable evaluation it has been ascertained that CIDCO needs to acquire them for development of the airport. In our R&R scheme the people are offered a package that includes several components. For an existing house the compensation is 3 times the area of plinth. In the case of land, 22.5 per cent of the land is given as a gross developed plot to the person affected. This results in a transfer of 15.75 per cent as net plot with the remaining for facilities. It is an interesting and favourable package in terms of market value. In addition we also undertake the activities of construction and/or reconstruction of facilities and amenities.
What is your impression of Hong Kong and Kuala Lumpur ?Kuala Lumpur is well managed and organised and shows good approaches to solving issues or urbanisation. Hong Kong has limited space and is relatively congested. We couldn’t visit the Petronas tower. But we did visit Hong Kong for half a day. Even though it is densely populated, development of Hong Kong’s main island was achieved 100 years ago and it is still maintained.
Would such exposure visits help CIDCO in future?Absolutely. It should be compulsory for everyone. The exposure is valuable, not only for individual employees, but also for the organisation.
For example, CIDCO goes through its own processes for objectives such as finding financiers or engaging technical experts. Often this is achieved by going to consultants even though there are more efficient approaches. CIDCO can use conferences such as this one to achieve objectives related to financing and technical expertise.
For example, financiers at this conference were not aware that 1000 hectares of land is available with a self financing organisation like CIDCO to develop it. If we engage in such conferences better financial and technical support might have been available for our projects particularly the airport. At the conference, there were more than 20 financers present who would be open to financing the airport with long term loans of 15 - 20 years.
CIDCO
Malaysia
CIDCO goes Global
15
Smart City Corner
Need for electrifying transportation in IndiaAt approximately 46,89,842 kilometres, India has the 2nd largest road network in the world. While this statistic might be viewed as a source of pride, providing accessible, reliable and cost-effec-
tive public transport to ply on these roads remains a persistent challenges for city agencies and governments at various levels.
Coupled with poorly planned urbanisation, the growth of road networks, particularly in cities, has exacerbated increasing dependence on environmentally unsustainable options for urban transport. Case in point, according to a report by Nielsen (India) Pvt. Ltd. for the Petroleum Ministry, 70 per cent of diesel consumption and 99.6 per cent of petrol consumption in India is by the transport sector alone. Cars, utility vehicles (UVs) and 3-wheelers consumed the highest share of diesel at 28.48 per cent.
This heavy dependence on fossil fuels is economically unviable and a major cause for air pollution - a leading health hazard in India. For example, New Delhi, which adds an average of 1200 cars per day is often cited as the city with the highest levels of air pollution (PM 2.5 particle concentration) in the world. Due to its location, the city also sees tens of thousands of diesel vehicles and freight trucks traversing through it on their journey to other states. These vehicles often use fuel of a lower standard (BS III) in engines performing below environmental pollution control norms. Alarmingly, yet somewhat unsurprising today 13 out of the 20 most polluted cities in the world are in India!
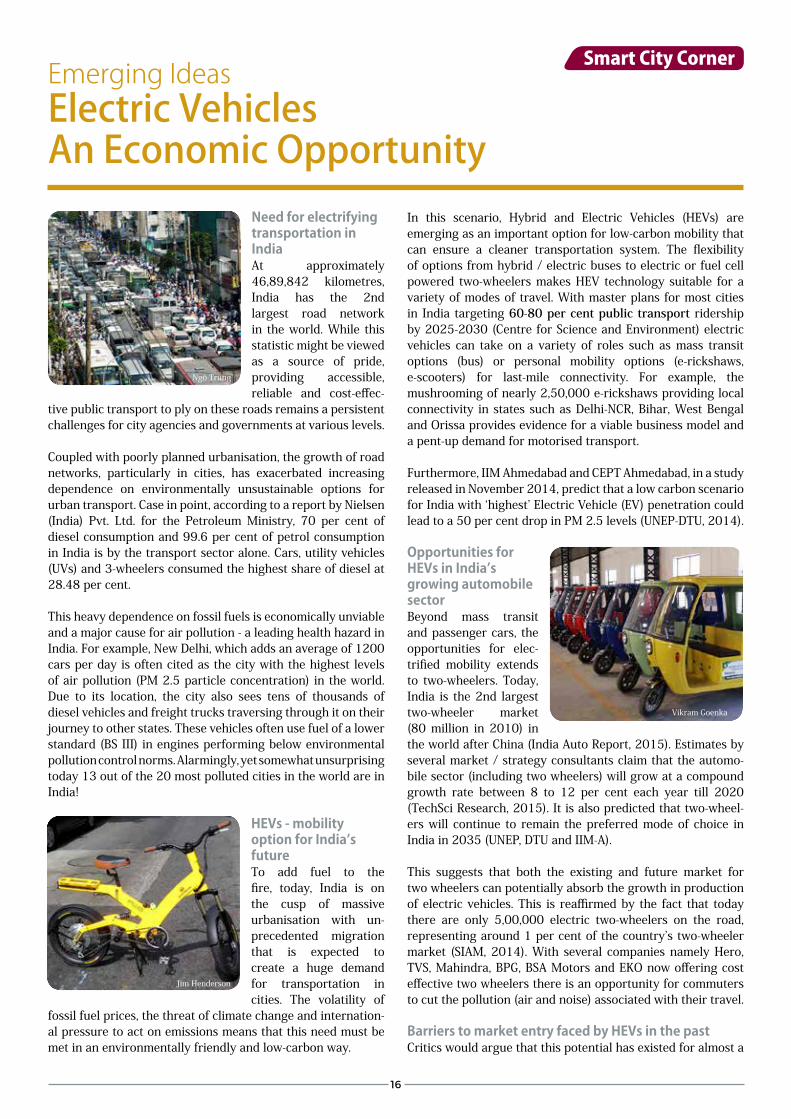
HEVs - mobility option for India’s futureTo add fuel to the fire, today, India is on the cusp of massive urbanisation with un-precedented migration that is expected to create a huge demand for transportation in cities. The volatility of
fossil fuel prices, the threat of climate change and internation-al pressure to act on emissions means that this need must be met in an environmentally friendly and low-carbon way.
In this scenario, Hybrid and Electric Vehicles (HEVs) are emerging as an important option for low-carbon mobility that can ensure a cleaner transportation system. The flexibility of options from hybrid / electric buses to electric or fuel cell powered two-wheelers makes HEV technology suitable for a variety of modes of travel. With master plans for most cities in India targeting 60-80 per cent public transport ridership by 2025-2030 (Centre for Science and Environment) electric vehicles can take on a variety of roles such as mass transit options (bus) or personal mobility options (e-rickshaws, e-scooters) for last-mile connectivity. For example, the mushrooming of nearly 2,50,000 e-rickshaws providing local connectivity in states such as Delhi-NCR, Bihar, West Bengal and Orissa provides evidence for a viable business model and a pent-up demand for motorised transport.
Furthermore, IIM Ahmedabad and CEPT Ahmedabad, in a study released in November 2014, predict that a low carbon scenario for India with ‘highest’ Electric Vehicle (EV) penetration could lead to a 50 per cent drop in PM 2.5 levels (UNEP-DTU, 2014).
Opportunities for HEVs in India’s growing automobile sectorBeyond mass transit and passenger cars, the opportunities for elec-trified mobility extends to two-wheelers. Today, India is the 2nd largest two-wheeler market (80 million in 2010) in the world after China (India Auto Report, 2015). Estimates by several market / strategy consultants claim that the automo-bile sector (including two wheelers) will grow at a compound growth rate between 8 to 12 per cent each year till 2020 (TechSci Research, 2015). It is also predicted that two-wheel-ers will continue to remain the preferred mode of choice in India in 2035 (UNEP, DTU and IIM-A).
This suggests that both the existing and future market for two wheelers can potentially absorb the growth in production of electric vehicles. This is reaffirmed by the fact that today there are only 5,00,000 electric two-wheelers on the road, representing around 1 per cent of the country’s two-wheeler market (SIAM, 2014). With several companies namely Hero, TVS, Mahindra, BPG, BSA Motors and EKO now offering cost effective two wheelers there is an opportunity for commuters to cut the pollution (air and noise) associated with their travel.
Barriers to market entry faced by HEVs in the pastCritics would argue that this potential has existed for almost a
Ngô Trung
Jim Henderson
Vikram Goenka
Emerging IdeasElectric Vehicles An Economic Opportunity
16
decade now, however, lack of consistency in policies and high costs make electric vehicles unviable. Most notably, the failure for implement the National Electric Mobility Plan announced in 2013 in a timely manner was highly detrimental to the EV industry. The delay in providing previously promised support stifled the sector’s growth and lead to losses for manufacturers and dealers.
Furthermore, despite obvious advantages and benefits in segments such as bikes and e-rickshaws we must acknowledge there are some long standing issues such as the need for infrastructure, business models and solutions for charging batteries. The silver lining for companies in this sector, environmentally conscious consumers and our cities is that most of the existing barriers can be resolved.
Demand Side Incentives announced by Government of India in April 2015The Government of India has taken important step towards addressing the issue through demand side incentives under the FAME (FAME India - Faster Adoption and Manufacturing of (Hybrid &) Electric vehicles in India) programme. Launched in April 2015, it is aimed at strengthening India’s competence in manufacturing fuel efficient cars and electric vehicles including hybrid vehicles. Leveraging other schemes such as the ‘Smart Cities’ Mission, FAME India aims to increase the uptake of EVs and hybrid vehicles in cities across India.
With dedicated allocations for ‘Charging Infrastructure’ that allows EVs / hybrid vehicles to refuel when not in operation or parked and demand side incentives the move has been welcomed by the EV industry. However, the initial allocation of 75 Crores in this year’s budget is considered modest by industry representatives.
(Please see Datasheet 1 for more information on incentives for hybrid and electric vehicles)
HEVs for public transportNot limited to personal transport, electric vehicle and hybrid vehicle technology can also be used in public transport buses. Besides eliminating the use of diesel or CNG and reducing noise, these buses provide a smoother ride and are more reliable. Hybrid buses that use a combination of electricity with another fuel (could be hydrogen or a fossil-fuel) provide a cost-effective and well understood technological option for buses. There are many successful examples of commercially viable hybrid buses in cities in Europe and North America. Acknowledging the benefits of EVs and a need for the right
business model, in April 2015, Mumbai Metropolitan Regional Development Authority (MMRDA) floated an RFP for providing 25 AC electric / hybrid buses that will operate from the Bandra Kurla Complex to 3 nearby railway stations. Targeted at professionals and the working population in the region, the convenience and comfort of the buses Bangalore Municipal Corporation has also conducted successful trials with electric vehicles. However, the agency was unable due to procure electric buses due to its own severe cash constraints.
Government programmes that enable the uptake of HEVsNonetheless, programmes like FAME India can help city agencies meet the shortfall in funds. Financial support from multilateral agencies such as the World Bank and Asian Development Bank is also expected to increase for projects aimed at low-carbon and sustainable transportation. The ambitious National Solar Mission targeting 100 GW of solar energy could also improve the economics of EVs - as these vehicles can serve as an option for storing energy from renewables. In overall terms, the National Smart Cities Mission aimed at transforming 100 existing cities in India into ‘smarter’ and more ‘livable’ also presents city governments with a unique opportunity to improve their transportation infrastructure by leveraging funds and expertise from wide pool of sources. This augers well for the deployment of HEVs in Indian cities.
Electric mobility for Jawaharlal Nehru Port Trust (JNPT)Close proximity to JNPT gives the region the option of emerging as an exporter of EVs and hybrid vehicles. The port’s impending expansion itself provides massive opportunities for Navi Mumbai to ensure that infrastructure for electric mobility is imbedded. This can play a major role in improving the air quality in the port region which likely became a huge challenge in the years ahead.
Auto-mart for Electric VehiclesMoving forward, Navi Mumbai could leverage itself as a hub for electric vehicles in india. The presence of car manufacturing facilities in nearby regions in Maharashtra makes this plausible. Manufacturing electric vehicles / hybrid vehicles will not require massive changes to existing car manufacturing facilities. The development of the delhi-Mumbai industrial Corridor and existing transportation linkages would allow the region to meet growing domestic demand in other parts of the country.
Another project that the city could take up is existing exhibition facilities in Navi Mumbai to develop Asia’s largest auto-mart for electric vehicles. This would give the city of Navi Mumbai a unique opportunity to brand itself as a modern city championing green technology.
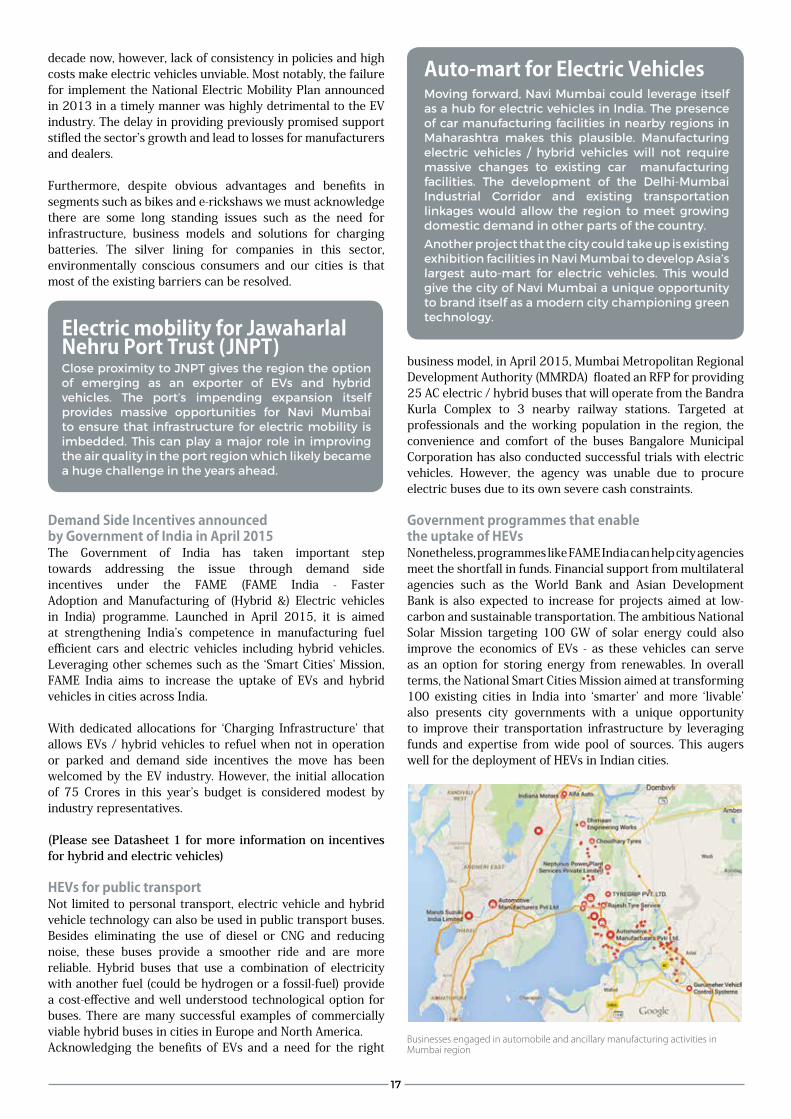
Businesses engaged in automobile and ancillary manufacturing activities in Mumbai region
17
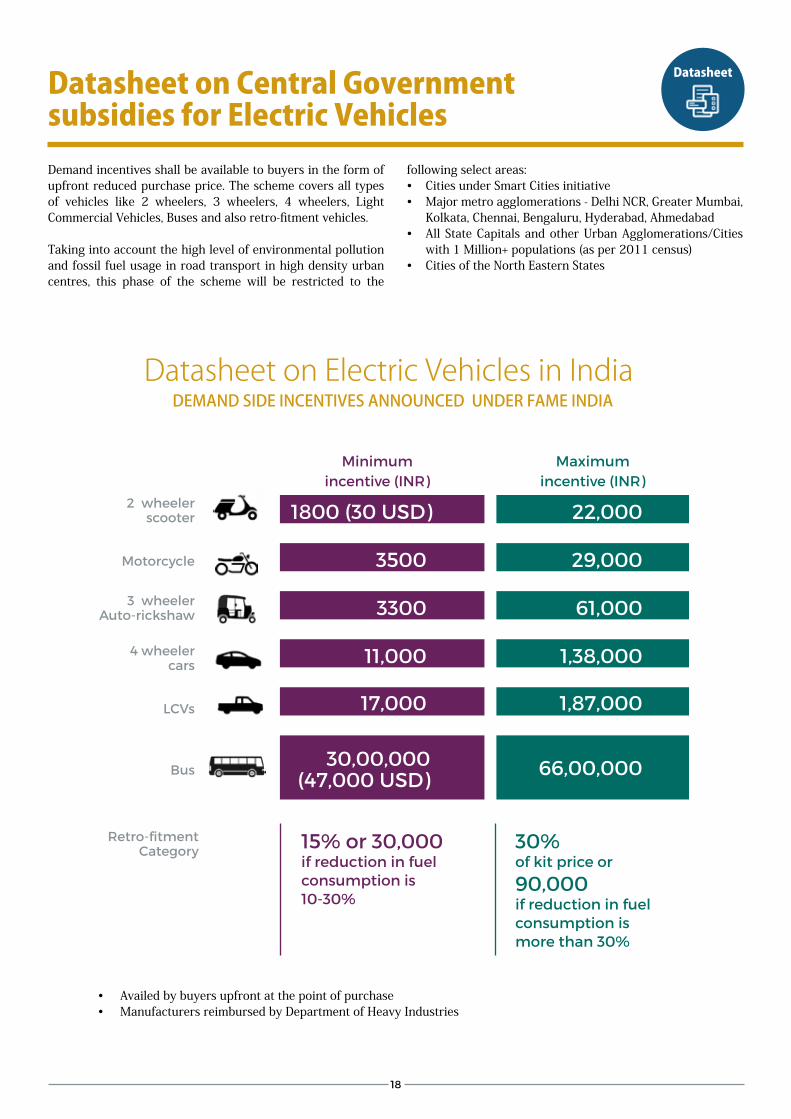
Datasheet on Central Government subsidies for Electric Vehicles Demand incentives shall be available to buyers in the form of upfront reduced purchase price. The scheme covers all types of vehicles like 2 wheelers, 3 wheelers, 4 wheelers, Light Commercial Vehicles, Buses and also retro-fitment vehicles.
Taking into account the high level of environmental pollution and fossil fuel usage in road transport in high density urban centres, this phase of the scheme will be restricted to the
following select areas:• Cities under Smart Cities initiative• Major metro agglomerations - Delhi NCR, Greater Mumbai,
Kolkata, Chennai, Bengaluru, Hyderabad, Ahmedabad• All State Capitals and other Urban Agglomerations/Cities
with 1 Million+ populations (as per 2011 census)• Cities of the North Eastern States
Datasheet on Electric Vehicles in IndiaDEMAnD SIDE InCEntIVES AnnOunCED unDEr FAME InDIA
• Availed by buyers upfront at the point of purchase• Manufacturers reimbursed by Department of Heavy Industries
15% or 30,000 if reduction in fuel consumption is 10-30%
30% of kit price or
90,000 if reduction in fuel consumption is more than 30%
Retro-fitment Category
3500 29,000
3300 61,000
11,000 1,38,000
17,000 1,87,000
30,00,000 (47,000 USd)
1800 (30 USd) 22,0002 wheeler scooter
Motorcycle
3 wheeler Auto-rickshaw
4 wheeler cars
LCVs
Bus
Minimum incentive (iNR)
Maximum incentive (iNR)
66,00,000
Datasheet
18
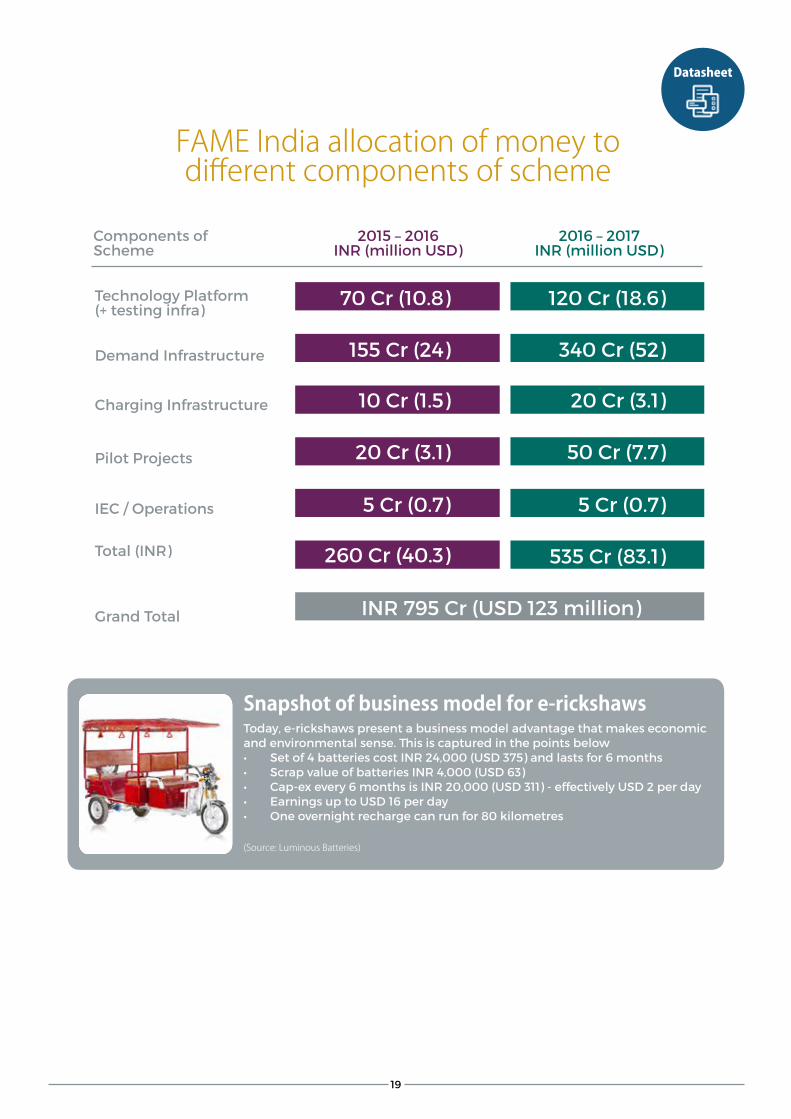
FAME India allocation of money to different components of scheme
Technology Platform (+ testing infra)
Pilot Projects
demand infrastructure
Charging infrastructure
iEC / operations
Total (iNR)
Grand Total iNR 795 Cr (USd 123 million)
Components of Scheme
2015 – 2016iNR (million USd)
2016 – 2017 iNR (million USd)
70 Cr (10.8) 120 Cr (18.6)
155 Cr (24) 340 Cr (52)
10 Cr (1.5) 20 Cr (3.1)
20 Cr (3.1) 50 Cr (7.7)
5 Cr (0.7) 5 Cr (0.7)
535 Cr (83.1)
Snapshot of business model for e-rickshawsToday, e-rickshaws present a business model advantage that makes economic and environmental sense. This is captured in the points below• Setof4batteriescostINR24,000(USD375)andlastsfor6months• ScrapvalueofbatteriesINR4,000(USD63)• Cap-exevery6monthsisINR20,000(USD311)-effectivelyUSD2perday• EarningsuptoUSD16perday• Oneovernightrechargecanrunfor80kilometres
(Source: Luminous Batteries)
260 Cr (40.3)
Datasheet
19
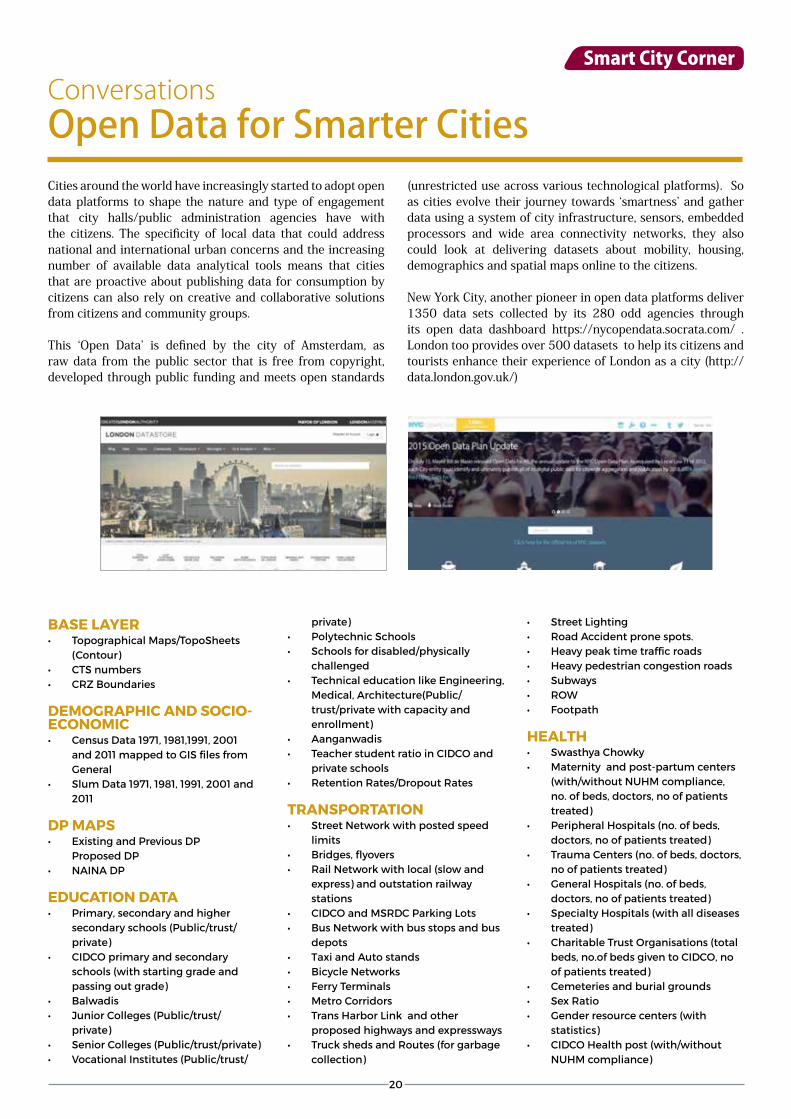
ConversationsOpen Data for Smarter CitiesCities around the world have increasingly started to adopt open data platforms to shape the nature and type of engagement that city halls/public administration agencies have with the citizens. The specificity of local data that could address national and international urban concerns and the increasing number of available data analytical tools means that cities that are proactive about publishing data for consumption by citizens can also rely on creative and collaborative solutions from citizens and community groups.
This ‘Open Data’ is defined by the city of Amsterdam, as raw data from the public sector that is free from copyright, developed through public funding and meets open standards
(unrestricted use across various technological platforms). So as cities evolve their journey towards ‘smartness’ and gather data using a system of city infrastructure, sensors, embedded processors and wide area connectivity networks, they also could look at delivering datasets about mobility, housing, demographics and spatial maps online to the citizens.
New York City, another pioneer in open data platforms deliver 1350 data sets collected by its 280 odd agencies through its open data dashboard https://nycopendata.socrata.com/ . London too provides over 500 datasets to help its citizens and tourists enhance their experience of London as a city (http://data.london.gov.uk/)
baSe LaYer• Topographical Maps/TopoSheets
(Contour) • CTS numbers • CRZ Boundaries
deMoGraPHiC aNd SoCio-eCoNoMiC • Census data 1971, 1981,1991, 2001
and 2011 mapped to GiS files from General
• Slum data 1971, 1981, 1991, 2001 and 2011
dP MaPS • Existing and Previous dP
Proposed dP • NAiNA dP eduCatioN data• Primary, secondary and higher
secondary schools (Public/trust/private)
• CidCo primary and secondary schools (with starting grade and passing out grade)
• Balwadis • Junior Colleges (Public/trust/
private) • Senior Colleges (Public/trust/private)• Vocational institutes (Public/trust/
private) • Polytechnic Schools • Schools for disabled/physically
challenged • Technical education like Engineering,
Medical, Architecture(Public/trust/private with capacity and enrollment)
• Aanganwadis • Teacher student ratio in CidCo and
private schools • Retention Rates/dropout Rates
traNSPortatioN• Street Network with posted speed
limits • Bridges, flyovers • Rail Network with local (slow and
express) and outstation railway stations
• CidCo and MSRdC Parking Lots • Bus Network with bus stops and bus
depots • Taxi and Auto stands • Bicycle Networks • Ferry Terminals • Metro Corridors • Trans Harbor Link and other
proposed highways and expressways• Truck sheds and Routes (for garbage
collection)
• Street Lighting • Road Accident prone spots. • Heavy peak time traffic roads • Heavy pedestrian congestion roads• Subways • RoW • Footpath HeaLtH• Swasthya Chowky • Maternity and post-partum centers
(with/without NUHM compliance, no. of beds, doctors, no of patients treated)
• Peripheral Hospitals (no. of beds, doctors, no of patients treated)
• Trauma Centers (no. of beds, doctors, no of patients treated)
• General Hospitals (no. of beds, doctors, no of patients treated)
• Specialty Hospitals (with all diseases treated)
• Charitable Trust organisations (total beds, no.of beds given to CidCo, no of patients treated)
• Cemeteries and burial grounds • Sex Ratio • Gender resource centers (with
statistics) • CidCo Health post (with/without
NUHM compliance)
Smart City Corner
20
Upcoming workshops for CIDCO@Smart
HOuSINg POLICy AND TeCHNOLOgySeptember 2015
geTTINg CIDCO ONLINe –SOCIAL MeDIA eNgAgeMeNTOctober 2015
TRANSPORTATION PLANNINgOctober 2015
AIRPORT AND INFLueNCe AReA PLANNINgNovember 2015
MAKINg CIDCO AN IT eNABLeD ORgANISATIONNovember 2015
• CidCo dispensaries (with/without NUHM compliance)
• Maternal Mortality Rates, infant Mortality Rates
• Birth Rates, death Rates • Children with disability • Ward wise disease reported (Malaria,
dengue, Tuberculosis, diabetes, diarrhea) data
• Provision of Health Services
HouSiNG• CidCo Tenements (EWS, LiG) • CidCo Housing (MiG, HiG) • Private developments • Gaothans • Chawls • Night Shelters • Trust Housing (land ownership
data) • Hostels and accommodation
facilities (public and private)• Mobile Tower locations • Slum Boundaries (Population - Pre
1998 and Post 1998) • Transit Camps (Population) • FSi Applicable and FSi Consumed
(on building level) • Cessed Buildings • Ready Reckoner/Stamp duty
eNviroNMeNt• Saltpans • Rivers, creeks, natural courses • Lakes, Tanks, Ponds • PG playgrounds • RGs • Parks and gardens • Beaches • Recreational facilities (public and
private with ownership data) • Promenades • CRZ Boundaries • Tree Counts • Forests (reserved and private
forests) • Mangroves (reserved, private and
critical forests) • Mudflats • intertidal zones • Hillslopes • Vulnerable settlements
• Flood prone area and water logging spots.
• Cyclone prone area • Locations which are vulnerable to
fire accidents. • Locations have storage of hazardous
goods. • open spaces and Water Bodies
inventory • inventory of Environmental Features
Water aNd SaNitatioN• Water Supply Grids • Storm water drains, storm water
pumping stations • Sewage treatment plants • Water treatment plants • Aeration ponds • Public Taps • Bore Wells • Water Pumping Stations • Reservoirs/over-head tanks/Water
Supply facilities • Sewerage Lines • Toilet Blocks (within slums) • Public toilets and Private toilets (CBo
data) • Settlements which are not served by
sewer lines. • open Wells locations. • % of unfit water samples
WaSte MaNaGeMeNt• Solid Waste Management • Trash recycling centers • Segregation centers • Raddiwala shops • dumping Grounds • Waste Collection Points • E-waste collection/segregation/
recycling centers • Bio-medical waste collection/
segregation/recycling centers • Composting centers • Transfer Stations urbaN forM• UNESCo world heritage sites (with
buffer zone) • ASi sites (with defined zones) • State archeological sites (with buffer
zone)
• Hoarding/Billboard Locations • Street Furniture GoverNaNCe• Citizen Facilitation Centers • ALM Locations and Boundaries • Police Stations & Jurisdiction • Fire Stations & Jurisdiction • Local/High/Supreme/Sessions/
Civil court/ Criminal courts/Metropolitan
• Crime Locations • Property Tax Collection • ACQUA Collection • Node wise Budgets
LiveLiHoodS• Municipal Markets/APMC
Market • Naka Worker locations • Vendor locations (licensed/
unlicensed) • Hawkers (roaming/fixed) • Shops and Establishments (licensed/
unlicensed) • Employment Rate • dependency Ratio • Poverty Rate (BPL, Antyodaya card
holders) • Per Capita income eNerGY• Power distribution grid (with
ownership) • Electric Meters in Slums • Electric Metering in Residential
Areas SoCiaL aMeNitieS• Theatres • Art Galleries • Museums • Auditoriums • Shopping Malls • Libraries • Creches • Places of Workship • Location of predominant activity in
Slums
21
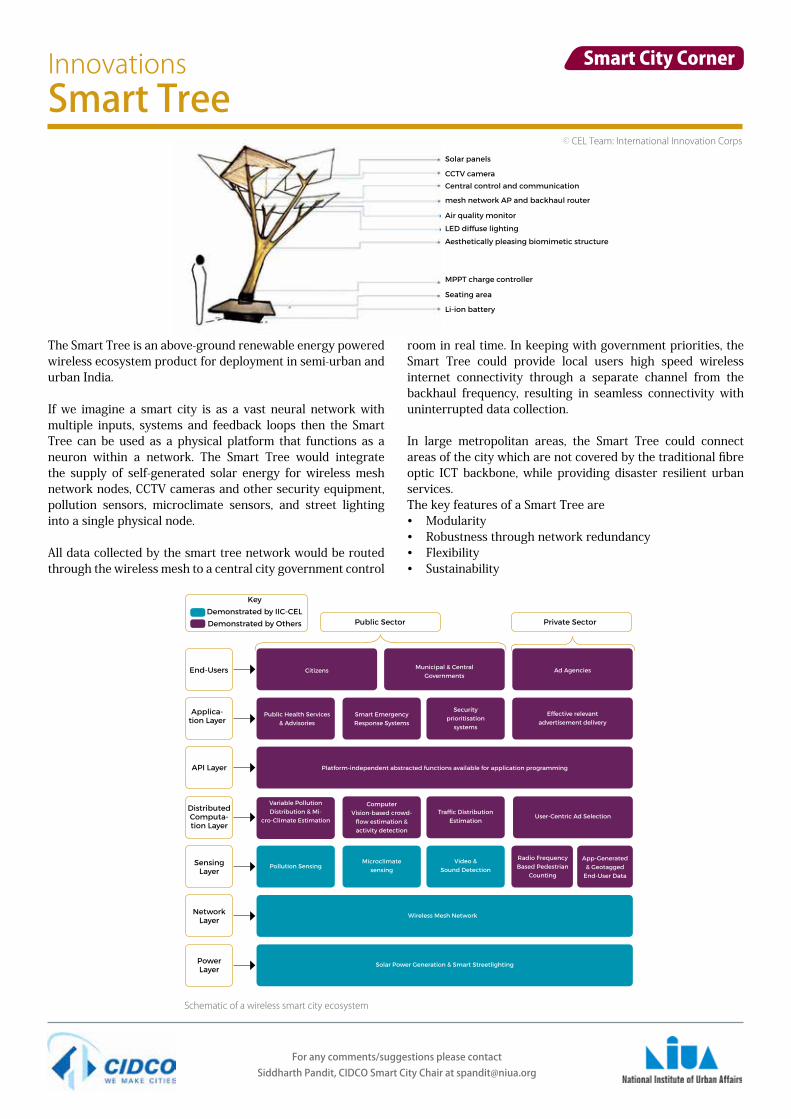
The Smart Tree is an above-ground renewable energy powered wireless ecosystem product for deployment in semi-urban and urban India.
If we imagine a smart city is as a vast neural network with multiple inputs, systems and feedback loops then the Smart Tree can be used as a physical platform that functions as a neuron within a network. The Smart Tree would integrate the supply of self-generated solar energy for wireless mesh network nodes, CCTV cameras and other security equipment, pollution sensors, microclimate sensors, and street lighting into a single physical node.
All data collected by the smart tree network would be routed through the wireless mesh to a central city government control
room in real time. In keeping with government priorities, the Smart Tree could provide local users high speed wireless internet connectivity through a separate channel from the backhaul frequency, resulting in seamless connectivity with uninterrupted data collection.
In large metropolitan areas, the Smart Tree could connect areas of the city which are not covered by the traditional fibre optic ICT backbone, while providing disaster resilient urban services. The key features of a Smart Tree are• Modularity• Robustness through network redundancy• Flexibility• Sustainability
Schematic of a wireless smart city ecosystem
Key
demonstrated by iiC-CEL
demonstrated by others Private SectorPublic Sector
Citizens
Public Health Services & Advisories
Variable Pollution distribution & Mi-
cro-Climate Estimation
Pollution Sensing
Computer Vision-based crowd-
flow estimation & activity detection
Traffic distribution Estimation
User-Centric Ad Selection
Security prioritisation
systems
Municipal & Central Governments
Smart Emergency Response Systems
Effective relevant advertisement delivery
Ad Agencies
Platform-independent abstracted functions available for application programming
Wireless Mesh Network
Solar Power Generation & Smart Streetlighting
End-Users
Applica-tion Layer
APi Layer
distributed Computa-tion Layer
Sensing Layer
Network Layer
Power Layer
Microclimate sensing
Video & Sound detection
Radio Frequency Based Pedestrian
Counting
App-Generated & Geotagged
End-User data
Solar panels
CCTV camera
Central control and communication
mesh network AP and backhaul router
Air quality monitor
LEd diffuse lighting
Aesthetically pleasing biomimetic structure
MPPT charge controller
Seating area
Li-ion battery
For any comments/suggestions please contact Siddharth Pandit, CIDCO Smart City Chair at [email protected]
InnovationsSmart tree
Smart City Corner
Ⓒ CEL Team: International Innovation Corps