coupa roadshow master deck atlanta
TRANSCRIPT

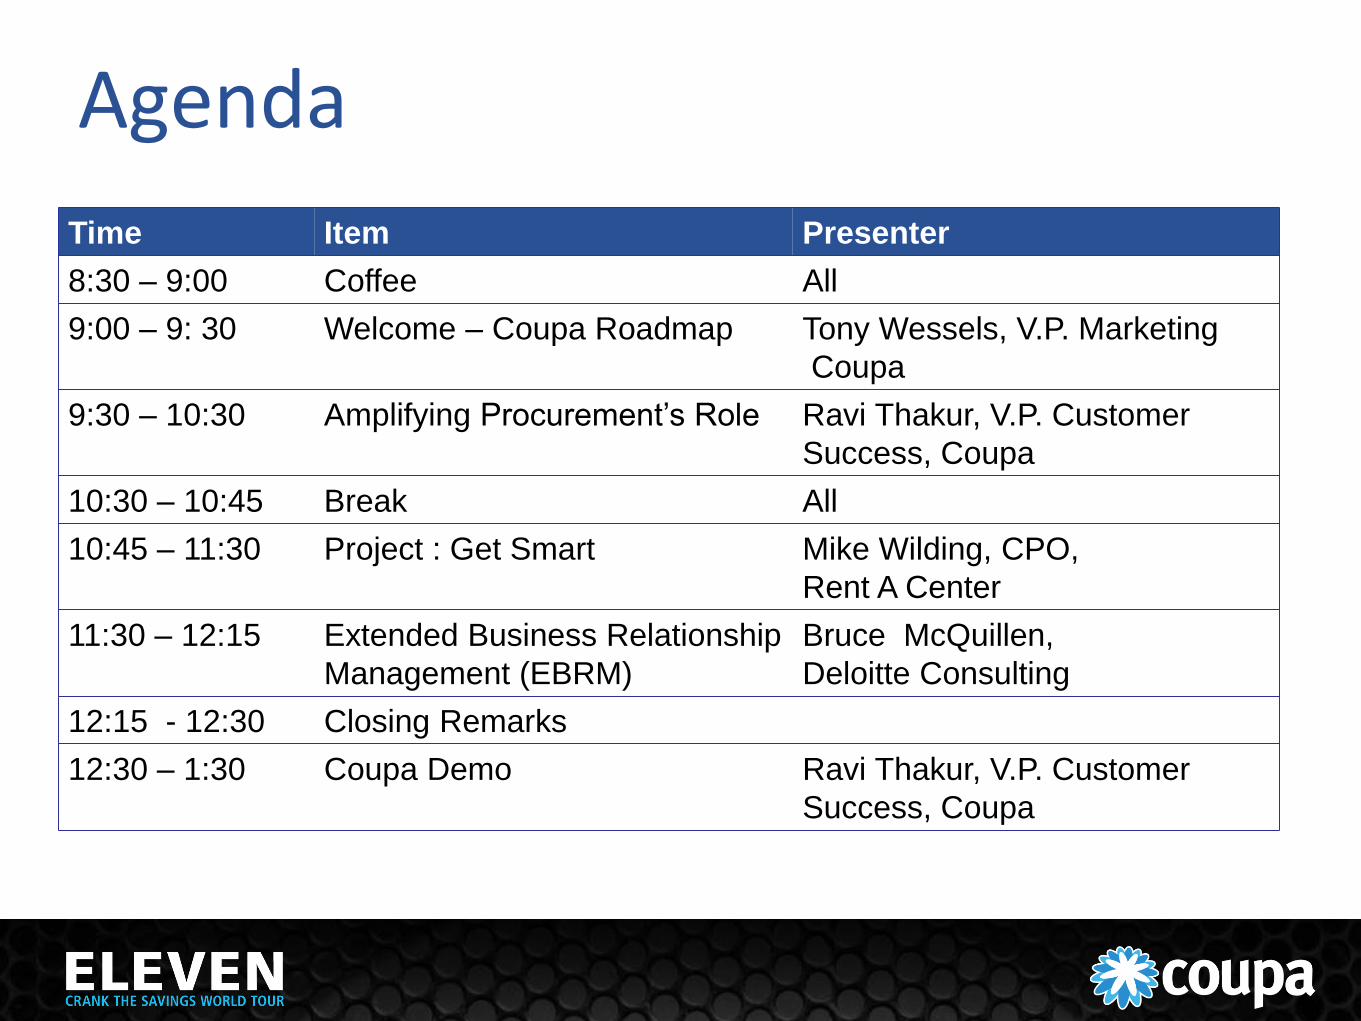
Agenda
Time Item Presenter
8:30 – 9:00 Coffee All
9:00 – 9: 30 Welcome – Coupa Roadmap Tony Wessels, V.P. Marketing
Coupa
9:30 – 10:30 Amplifying Procurement’s Role Ravi Thakur, V.P. Customer
Success, Coupa
10:30 – 10:45 Break All
10:45 – 11:30 Project : Get Smart Mike Wilding, CPO,
Rent A Center
11:30 – 12:15 Extended Business Relationship
Management (EBRM)
Bruce McQuillen,
Deloitte Consulting
12:15 - 12:30 Closing Remarks
12:30 – 1:30 Coupa Demo Ravi Thakur, V.P. Customer
Success, Coupa

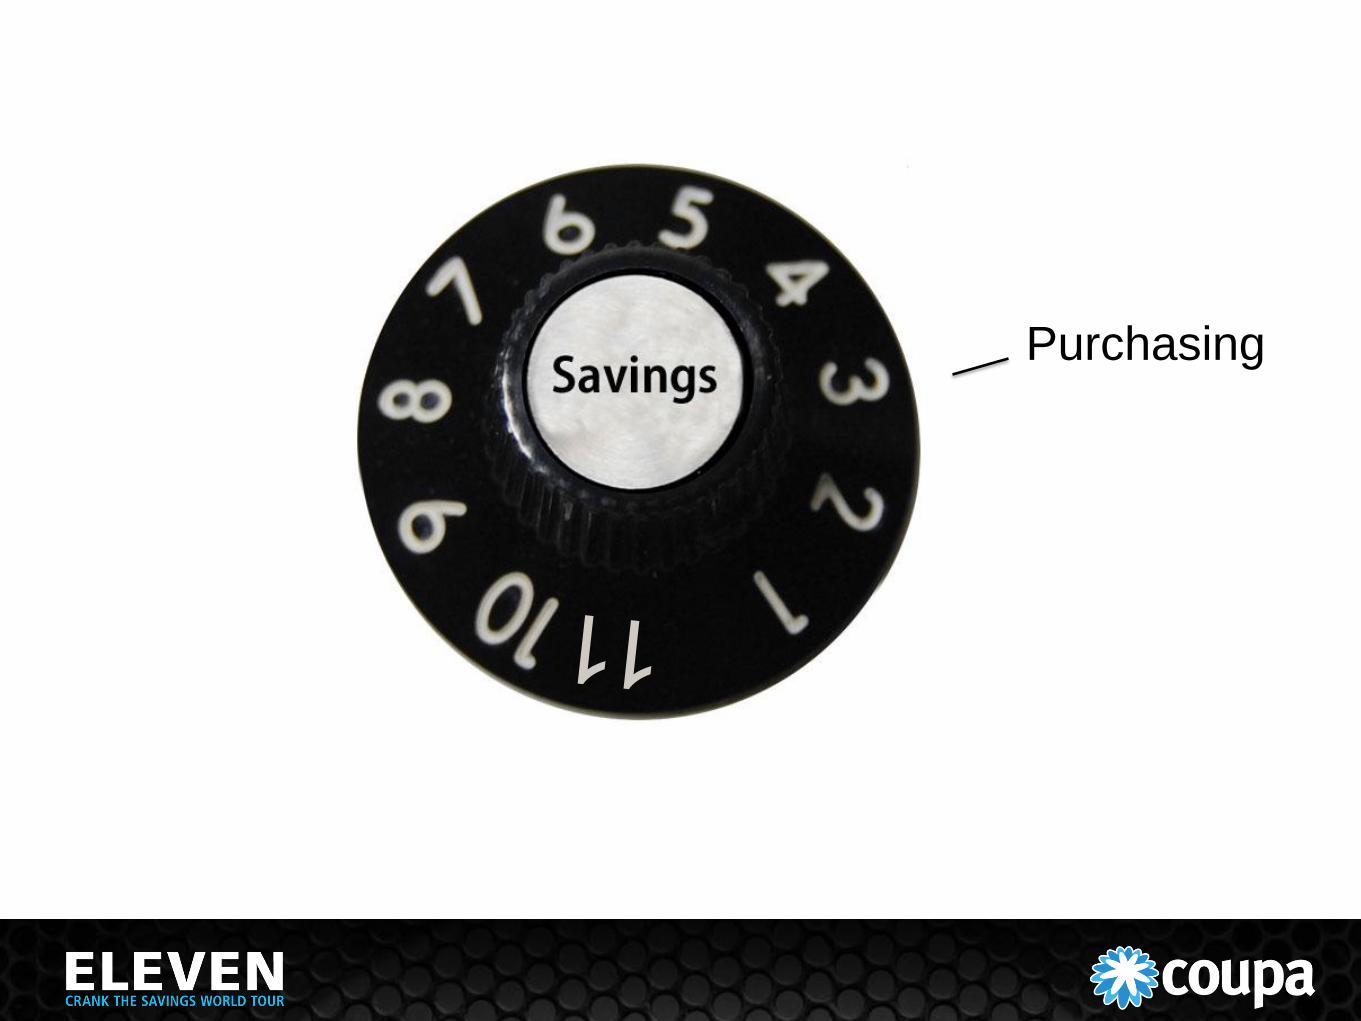
Purchasing

Purchasing
Procurement
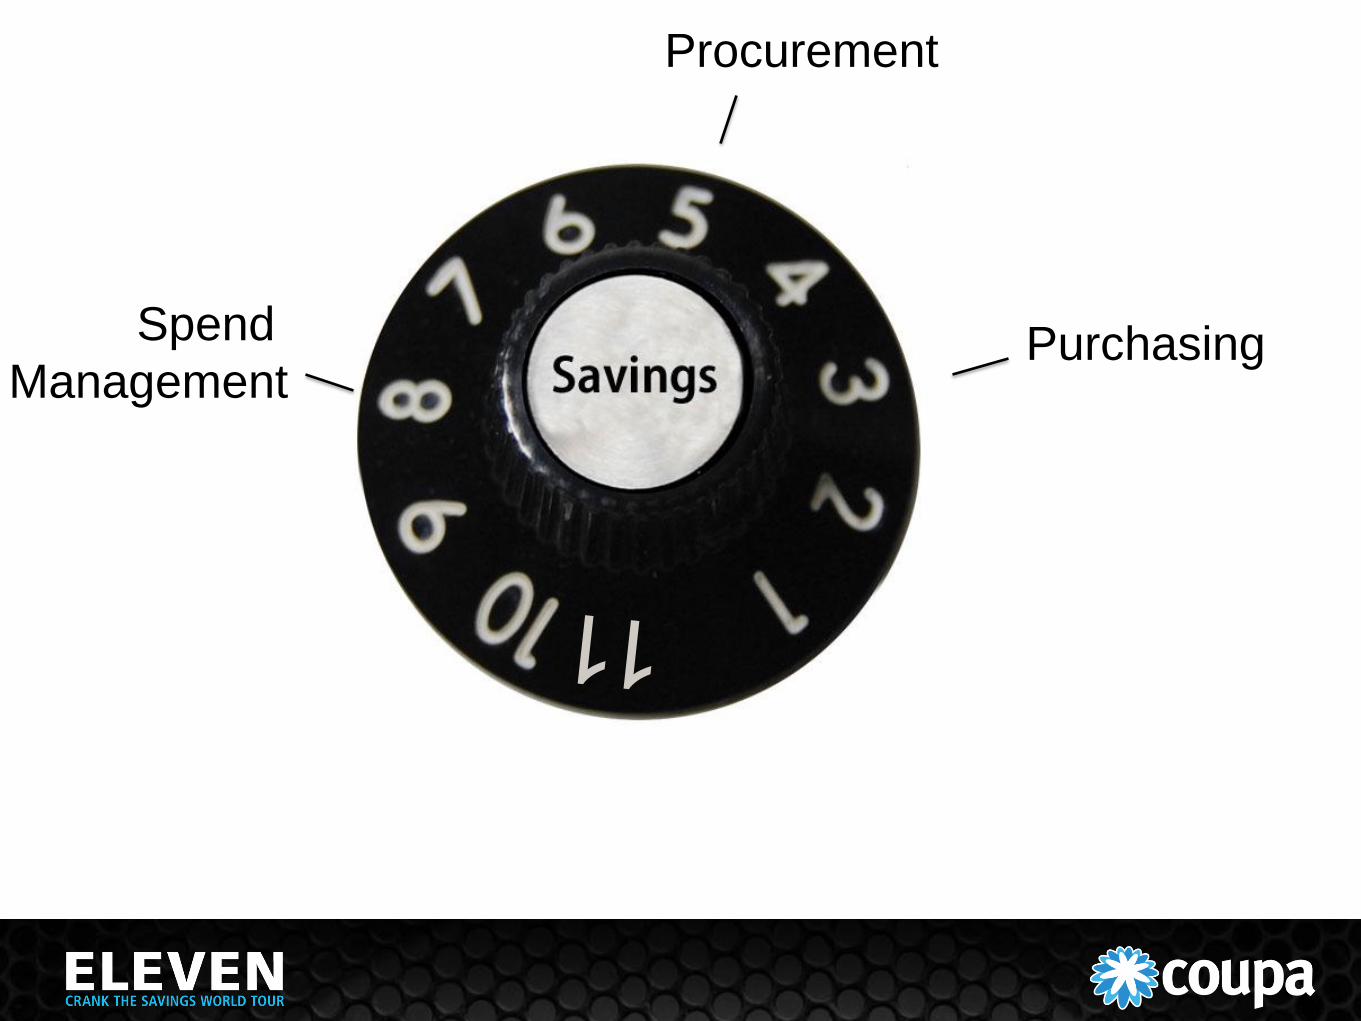
Purchasing
Procurement
Spend
Management

Purchasing
Procurement
Spend Optimization
Spend
Management

Coupa Overview
Tony Wessels
Vice President, Marketing
Coupa’s Mission
Delivering software innovation that
breeds responsible spending while
impacting the company bottom line.
Innovation
Responsible Spending
Bottom Line

Spend Optimization
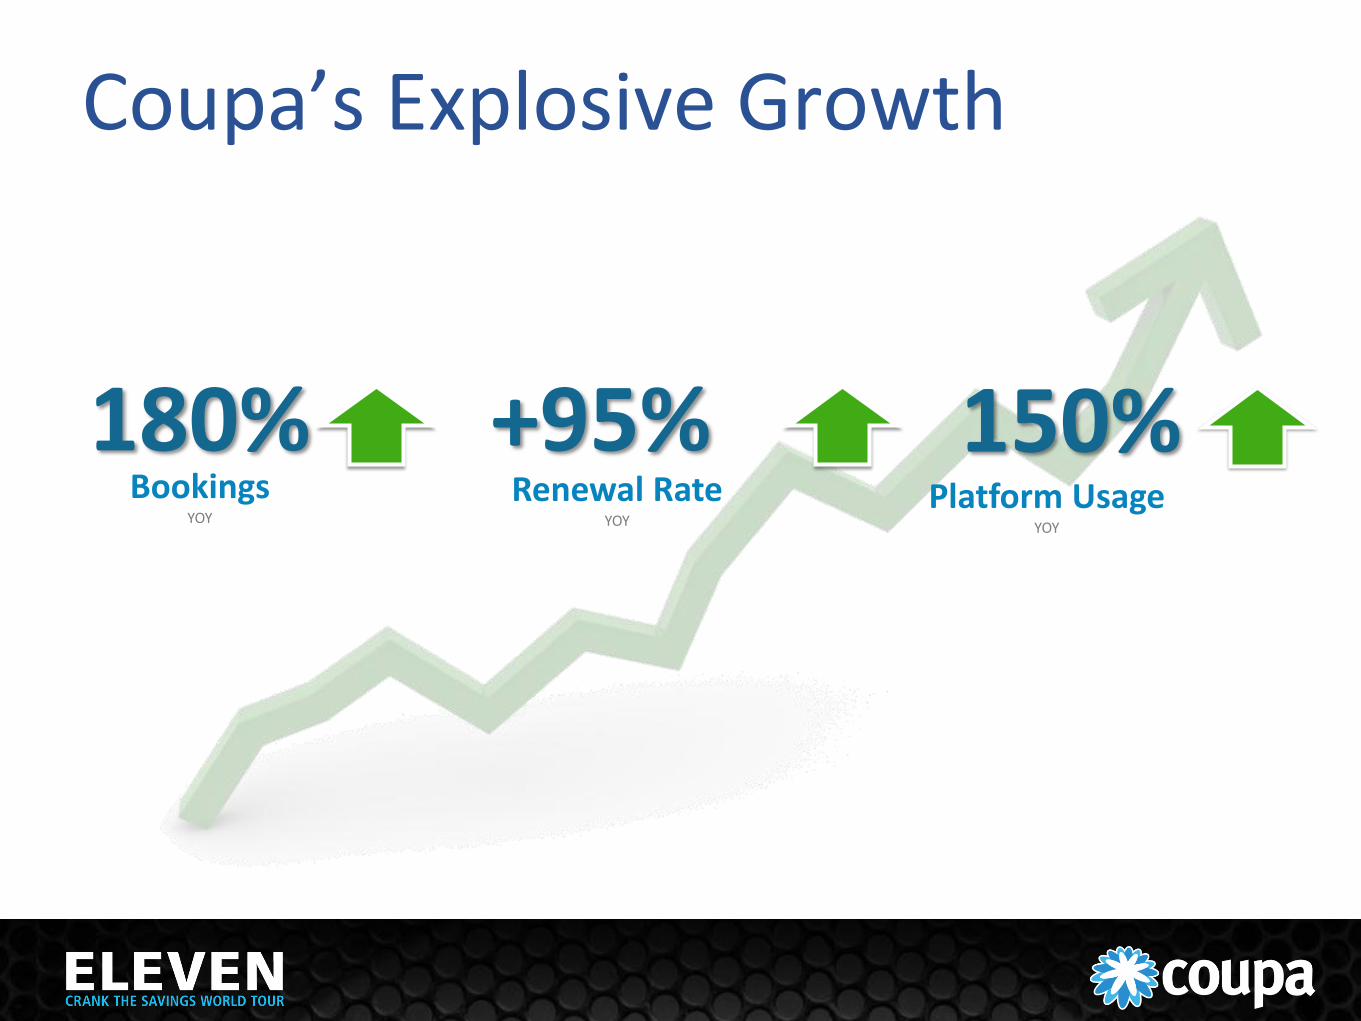
Coupa’s Explosive Growth
180% Bookings
YOY
+95% Renewal Rate
YOY
150% Platform Usage
YOY

One World, One Platform
10 Languages
40 Countries
100,000 Users

Customers Highlights
Retail Finance Mfg. Health Care High Tech

Amplifying Procurement’s Role
Ravi Thakur
Vice President, Customer Success & Services
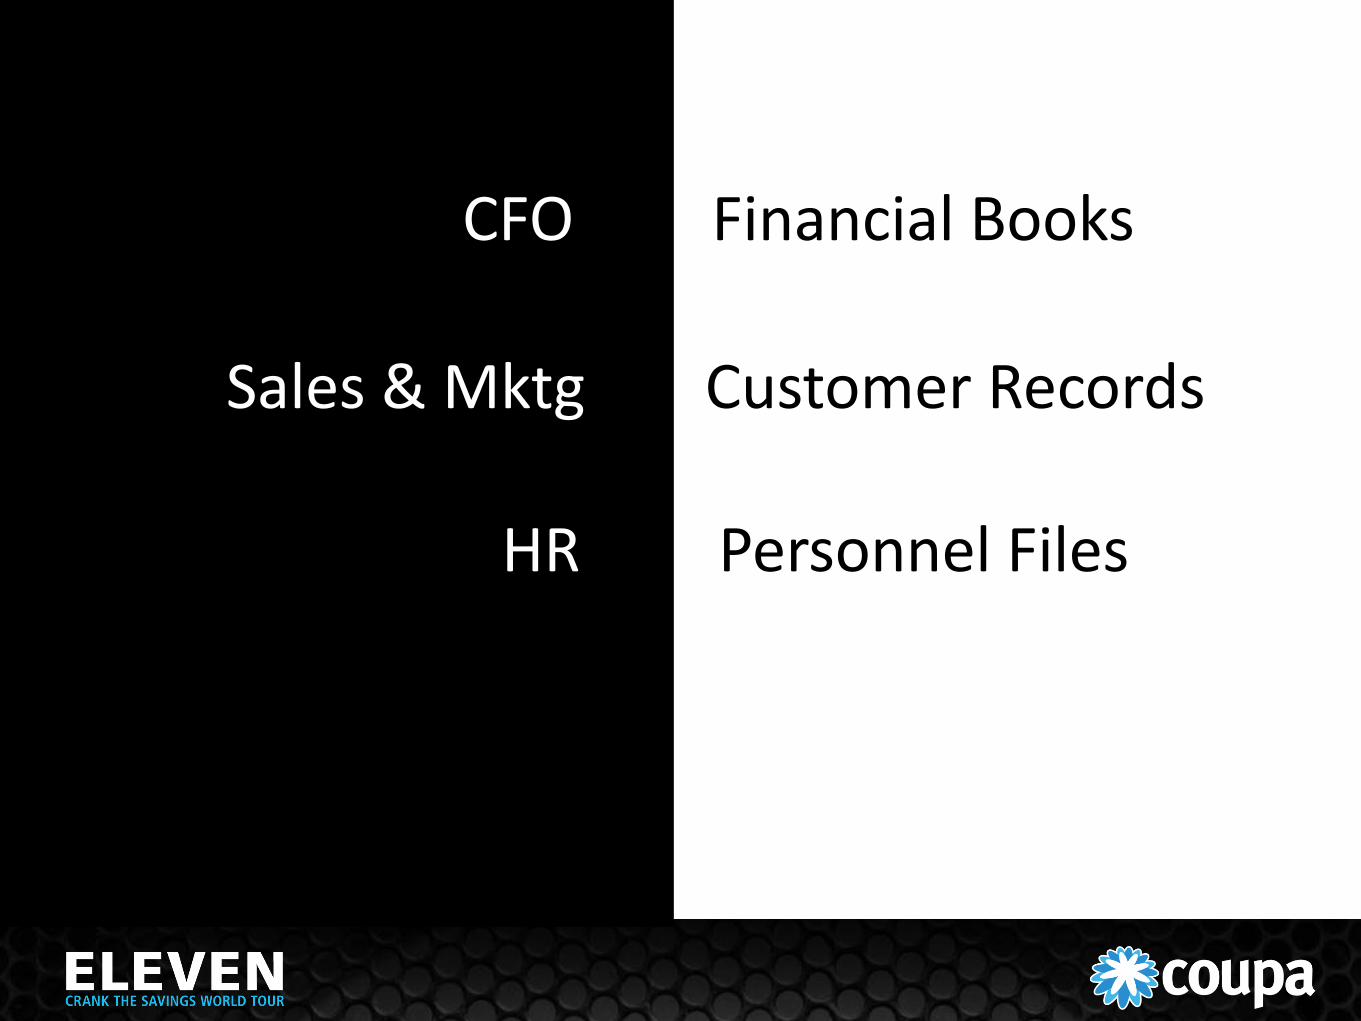
CFO Financial Books
HR Personnel Files
Sales & Mktg Customer Records

Procurement Needs To Own Spend Transactions

Own The Transaction
Optimize Spend
Spend Optimization Platform & Processes

Procurement Must Orchestrate
VS.
How Do You Do It?
Proactively participate in growth strategy
Manage change effectively
Measure & demonstrate success
Participate In Growth Strategy

Understand Growth Strategies
Geographic Expansion
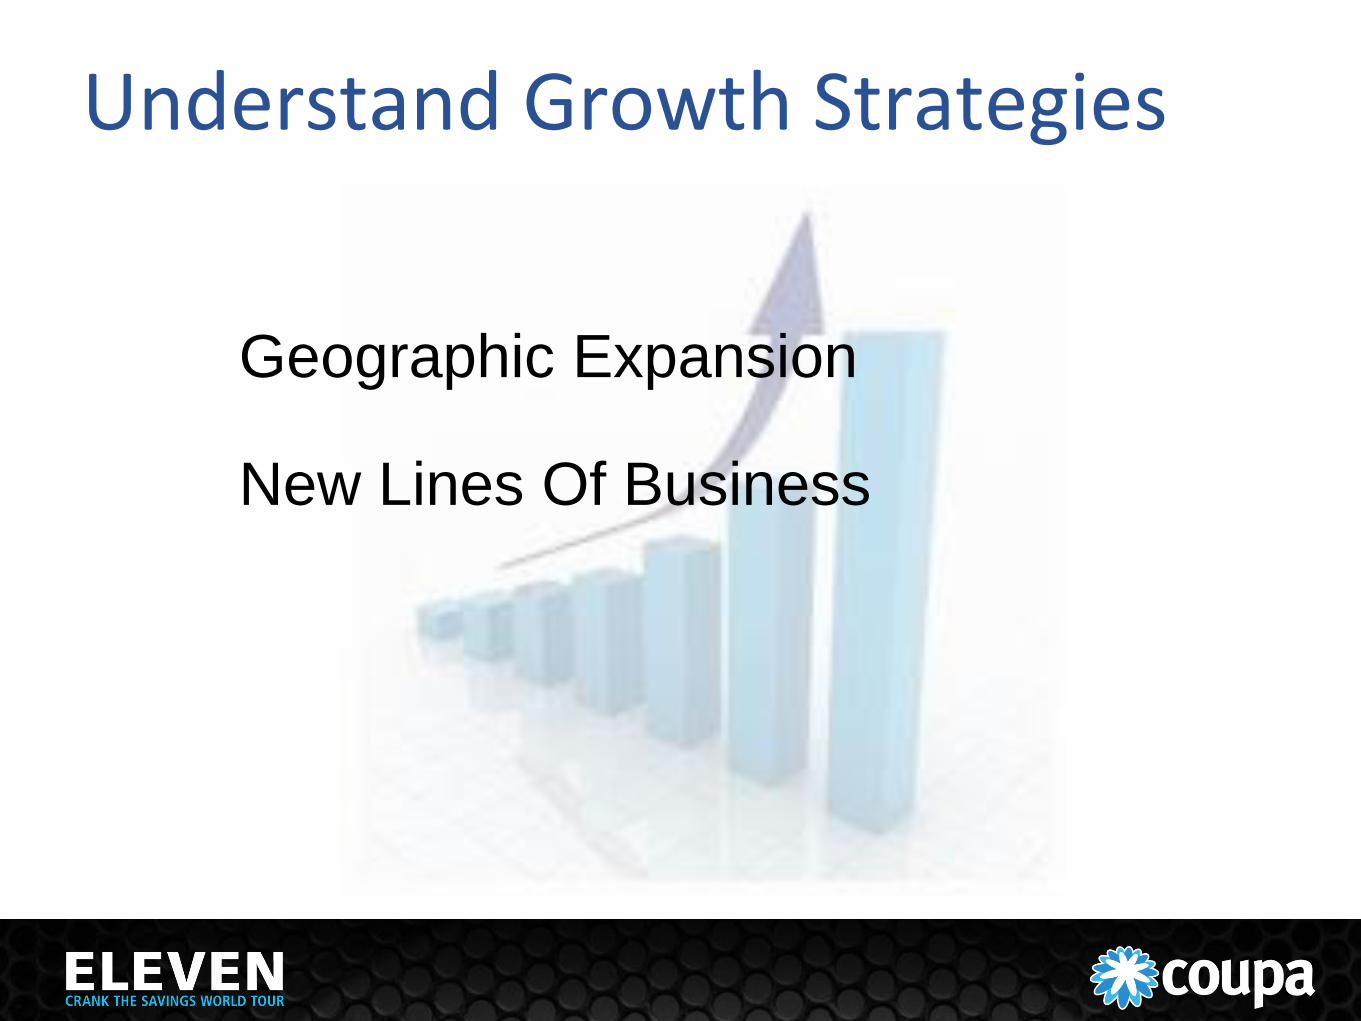
Understand Growth Strategies
Geographic Expansion
New Lines Of Business

Understand Growth Strategies
Acquisitions
Geographic Expansion
New Lines Of Business

Provide Truly Strategic Value
Ensure executive team supports your Spend Optimization strategy
Work with R & D / Product Development Be aligned with M & A and global expansion
Develop Agile Spend Processes
Bring distributed locations under management
Involve all stakeholders e.g. facilities, marketing
Proactively integrate acquisitions

Managing Change
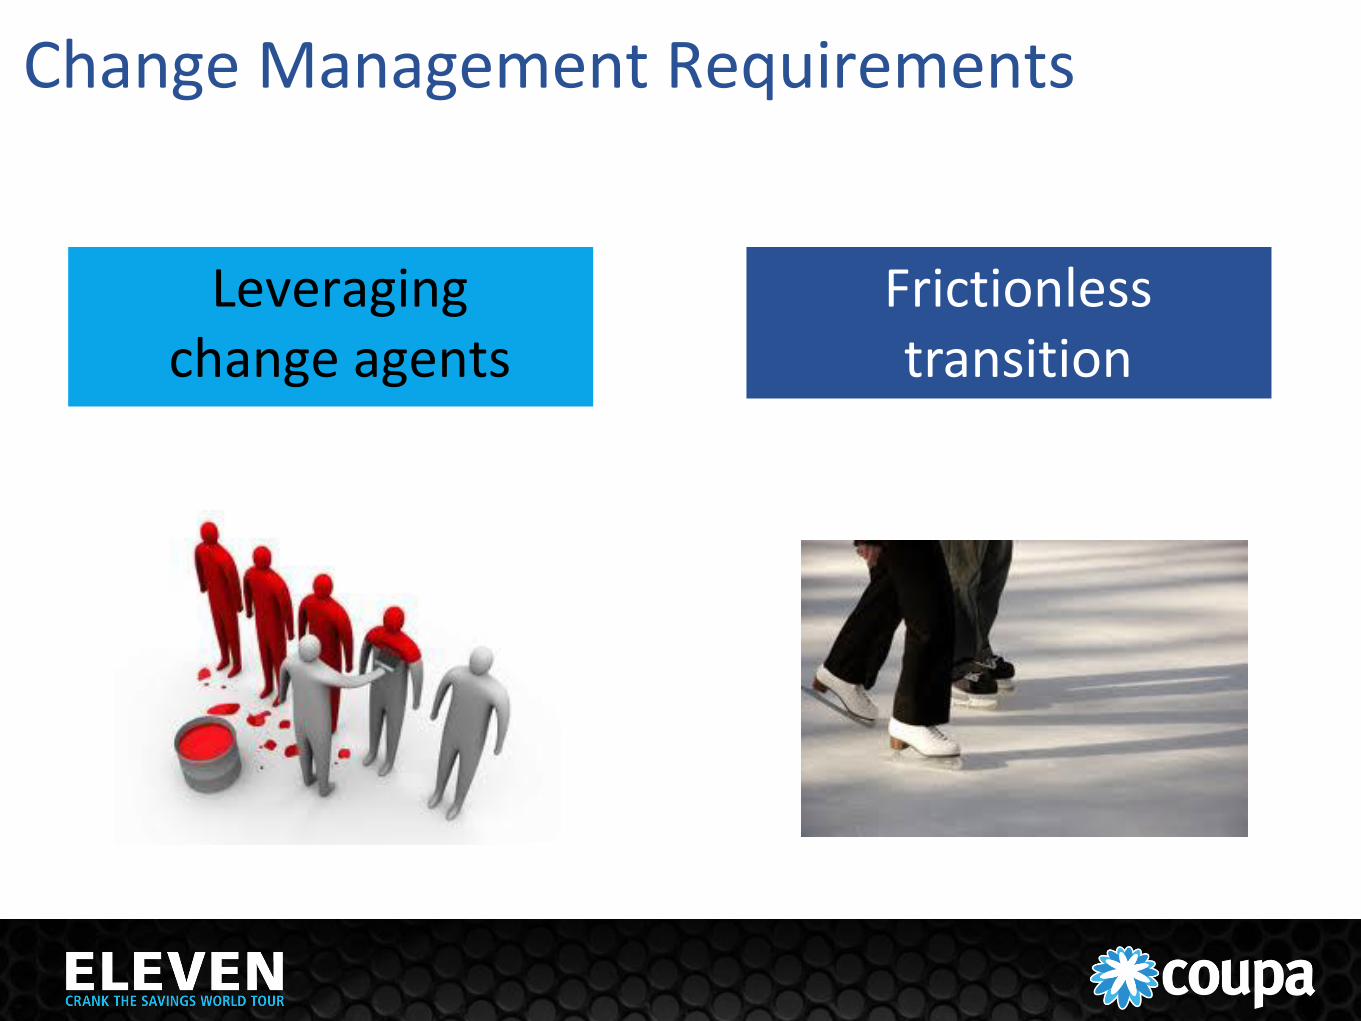
Change Management Requirements
Leveraging change agents
Frictionless transition

Leveraging Change Agents
Functional Users
IT
Procurement
Payables
Suppliers

Functional Users
Familiar user interface
Support for function specific spend
Solution
A solution that they can use
Not stand in their
way
Needs
Procurement
Enables transaction ownership
Measurable results
Solution
Ensure policy compliance
Attain savings goals
Needs
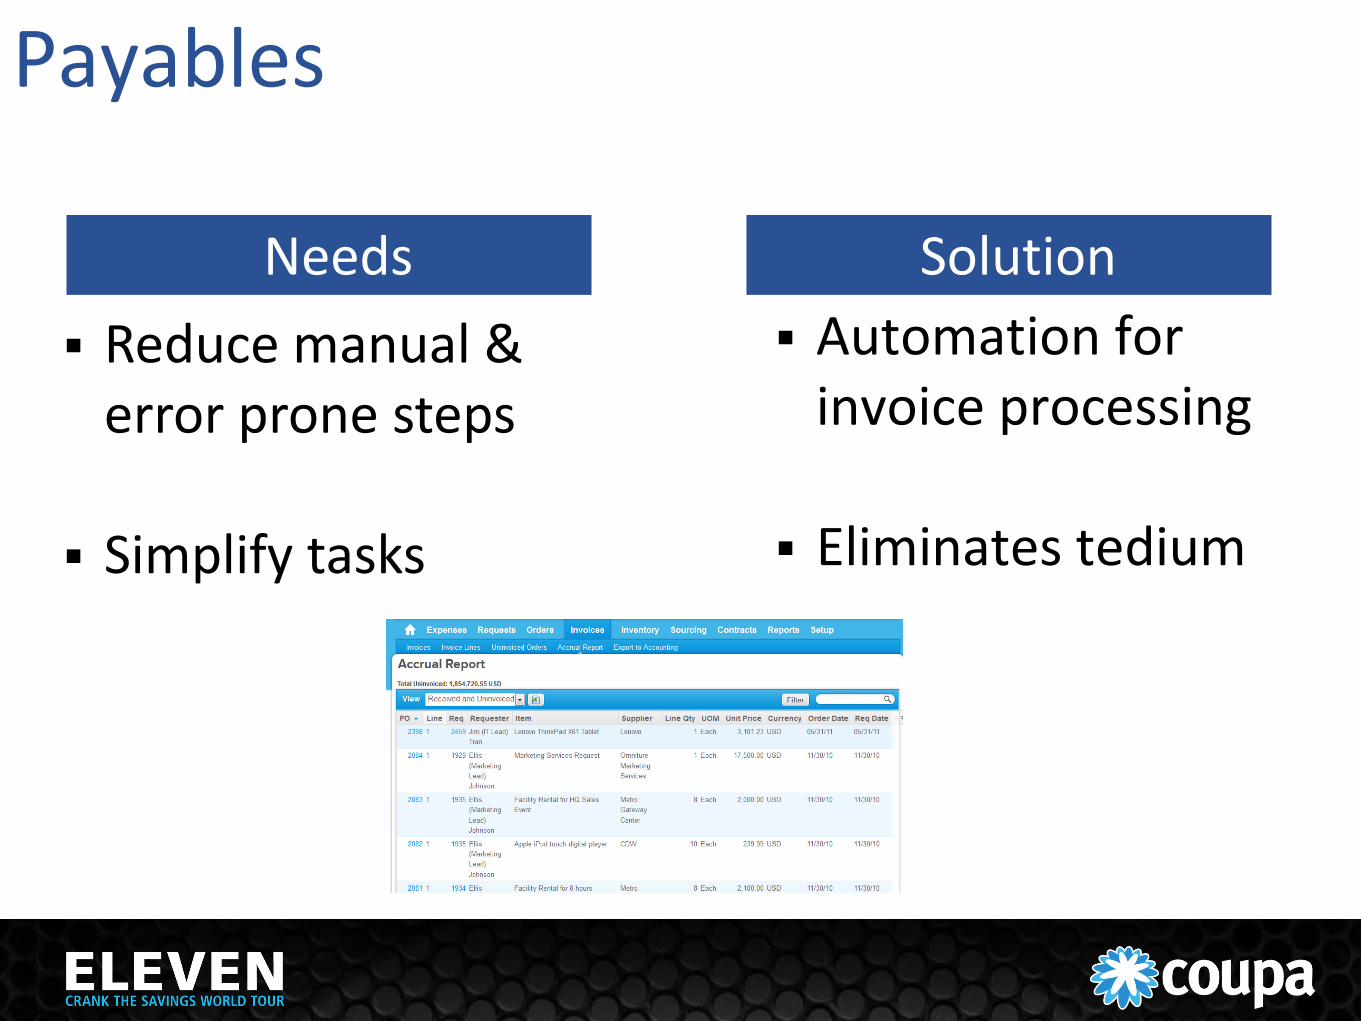
Payables
Automation for invoice processing
Eliminates tedium
Solution
Reduce manual & error prone steps
Simplify tasks
Needs

IT
SaaS/Cloud based platform
User configurable
solution
Solution
Reduce burden on IT resources
Focus on value-add
tasks
Needs
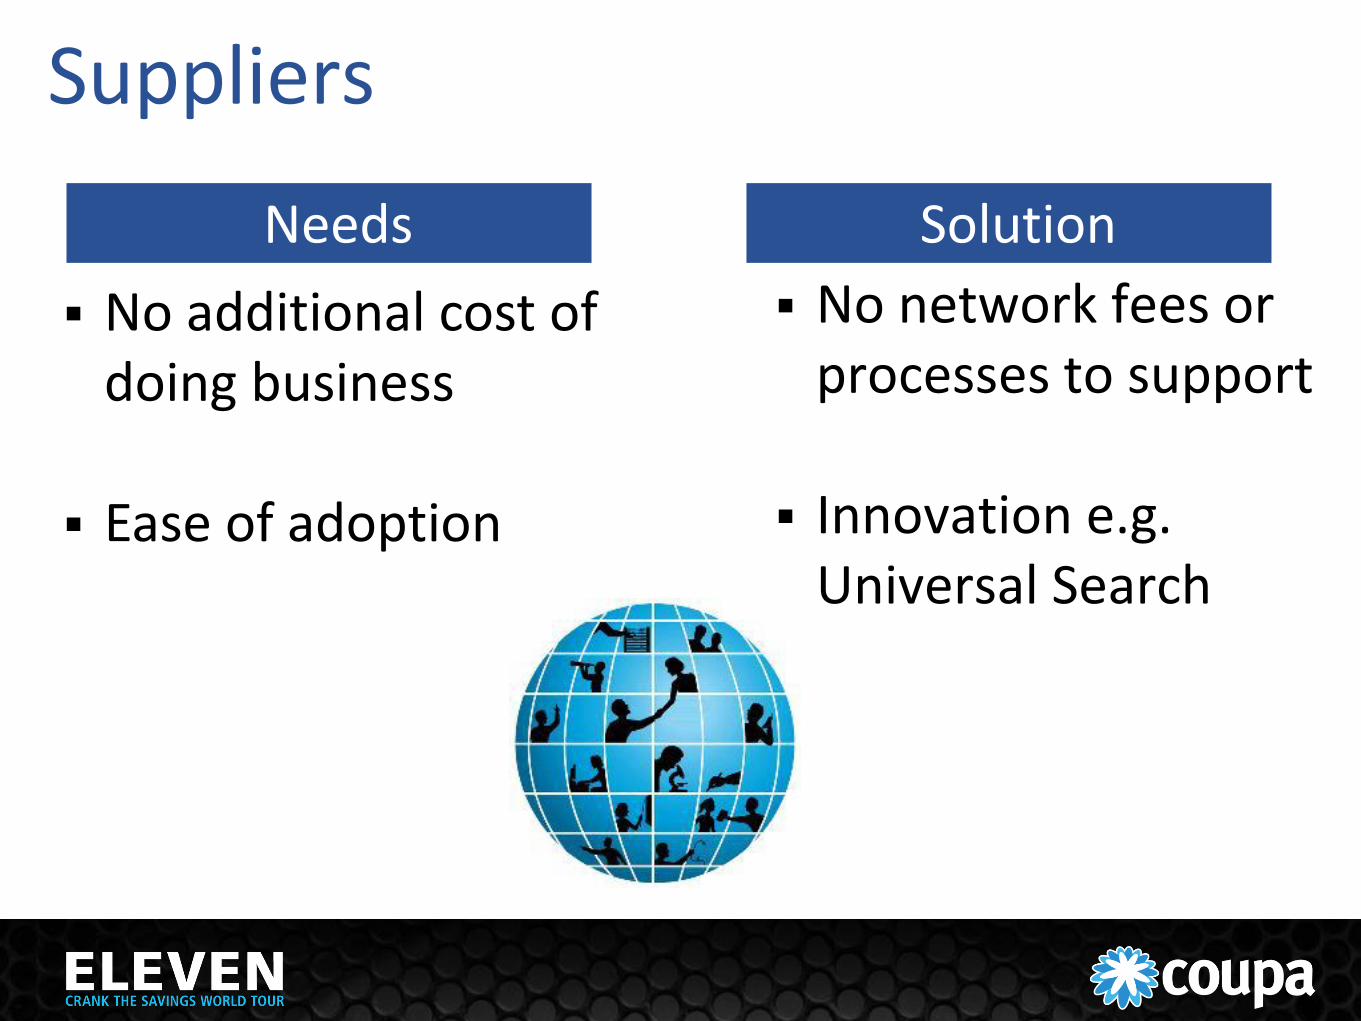
Suppliers
No network fees or processes to support
Innovation e.g. Universal Search
Solution
No additional cost of doing business
Ease of adoption
Needs

Frictionless Transition
Familiar & convenient user interface Weave into daily life
Demonstrate Success

Set Targets
Measure Success
• Establish benchmarks and determine targets
• Use data to analyze: • Tradeoffs and interdependencies • Root cause
• Measurement excellence = capability to improve and stay ahead Be Excellent
Achieve Targets

Benchmark Success Productivity
Transaction cycle time
PO & invoices processed
per FTE (#)
Support costs – not just IT
Effectiveness
Spend under management
User adoption = customer satisfaction
% saving / spend

Communicate Success
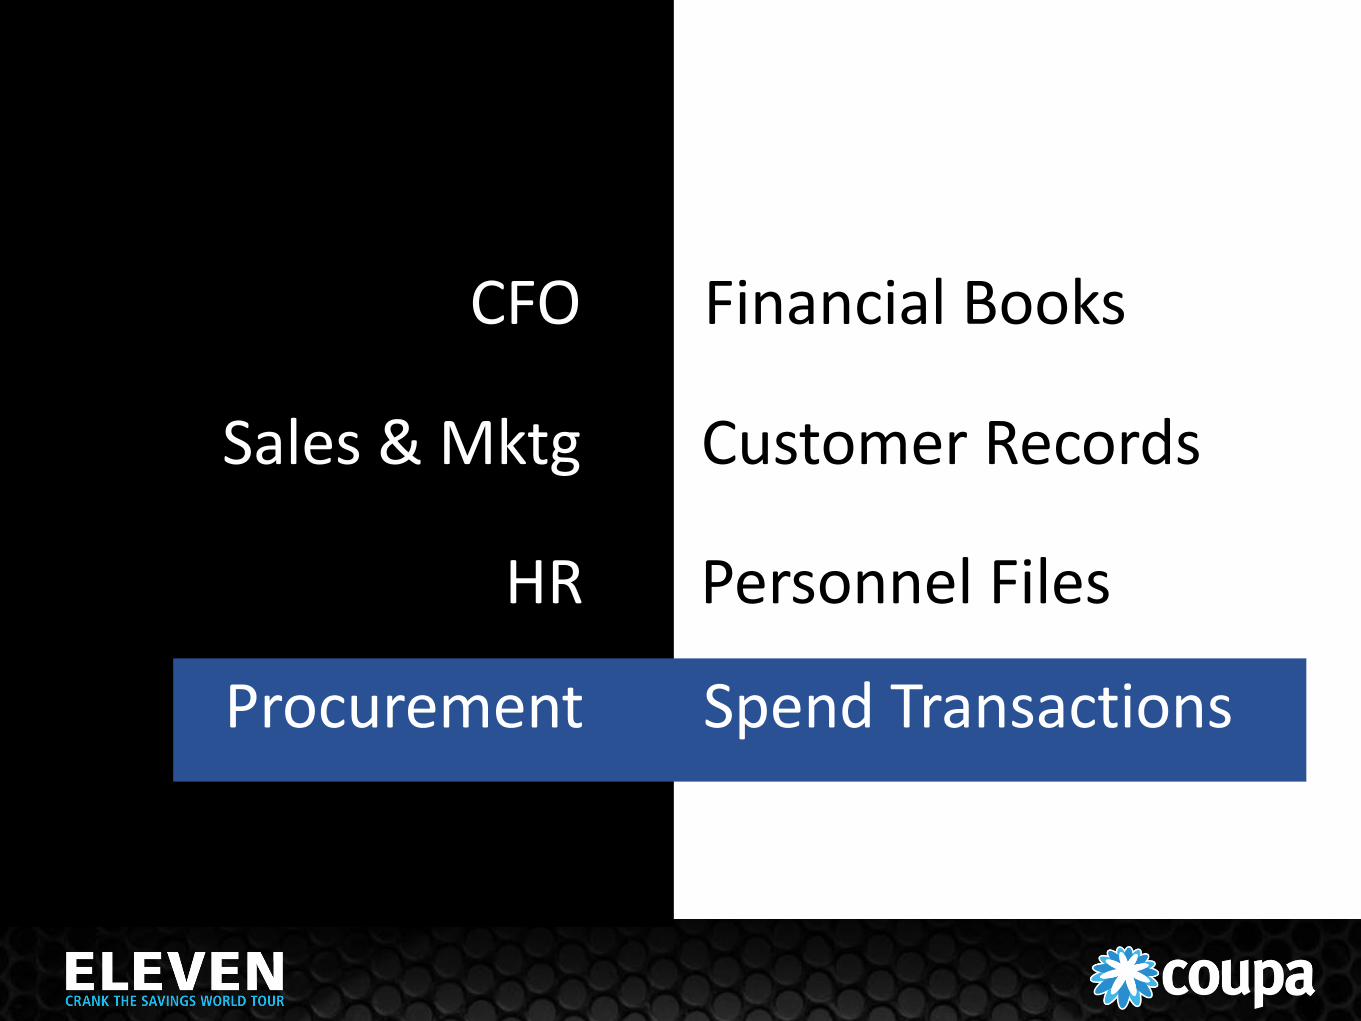
CFO Financial Books
HR Personnel Files
Sales & Mktg Customer Records
Procurement Spend Transactions

Break

Mike Wilding
44
Chief Procurement Officer
Rent A Center
Project: Get Smart

- 45 -
Crank the Savings World Tour
May 1, 2012

- 46 -
Executive Summary
About Rent-A-Center
• The largest operator in the United States rent-to-own industry
• Over 4,000 locations (2,983 Core U.S.; 763 RAC Acceptance; 87 International, 218
ColorTyme franchisees)
• Stores offer high quality, brand name durable products such as major consumer
electronics, appliances, computers, and furniture and accessories under flexible rental
purchase agreements
• Allows customers to obtain ownership of the merchandise at the conclusion of an
agreed-upon rental period
• Approximately 20,000 employees
• Annual revenues projected to exceed $3.0 billion in 2012
• NASDAQ: RCII
• Headquarters: Plano, Texas (opened a Field Support Center in Monterrey, Mexico
dedication is May 15th)

- 47 -
A peek into the past
• Two procurement tools in past 18 months prior to June 30, 2010
• Lack of visibility into invoice submitted by vendor at store location
• Punch out catalogues and catalogues in general not consistently utilized
• Existing platform extremely clunky and lacked ability to find product quickly (minimum
of five clicks before you were able to place an order)
• User adoption was slow and intermediate; complaints were fast and frequent
• On boarding of suppliers was not an easy, friendly process
• Invoices were entered into ERP by hand
• Procurement of approximately $600 million of indirect spend was very decentralized
• No consistent esourcing tools utilized
• Invoicing off of a contract was foreign
• No central repository for contracts
• Spend analyzing was performed by tearing apart general ledger accounts
- 48 -
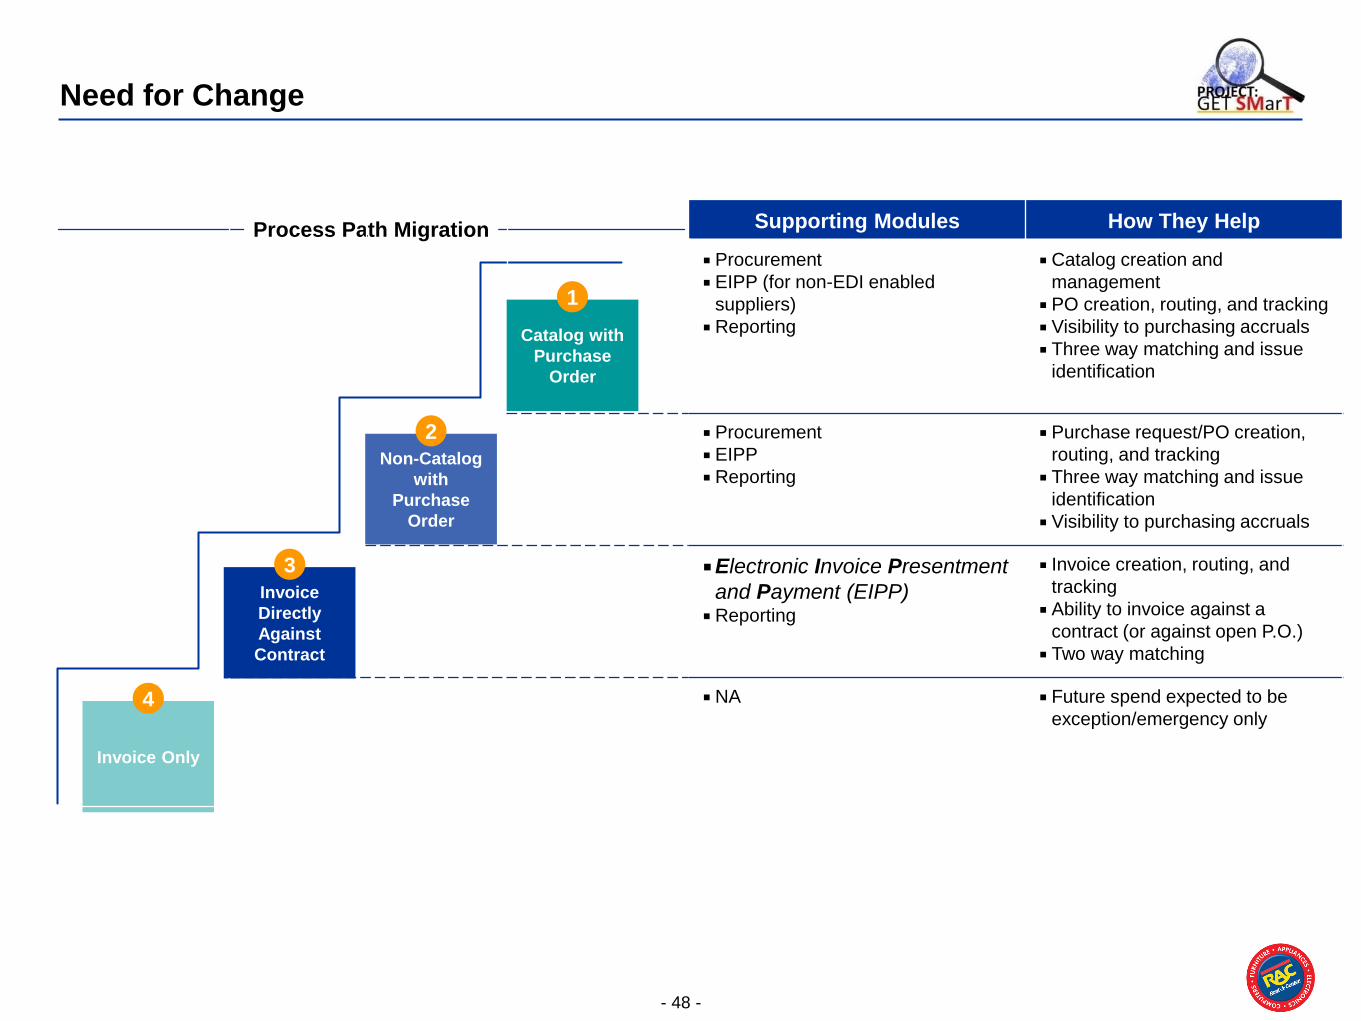
Need for Change
Process Path Migration
Catalog with
Purchase
Order
1
Non-Catalog
with
Purchase
Order
2
Invoice
Directly
Against
Contract
3
Invoice Only
4
Supporting Modules How They Help
Procurement
EIPP (for non-EDI enabled
suppliers)
Reporting
Catalog creation and
management
PO creation, routing, and tracking
Visibility to purchasing accruals
Three way matching and issue
identification
Procurement
EIPP
Reporting
Purchase request/PO creation,
routing, and tracking
Three way matching and issue
identification
Visibility to purchasing accruals
Electronic Invoice Presentment
and Payment (EIPP) Reporting
Invoice creation, routing, and
tracking
Ability to invoice against a
contract (or against open P.O.)
Two way matching
NA Future spend expected to be
exception/emergency only
- 49 -
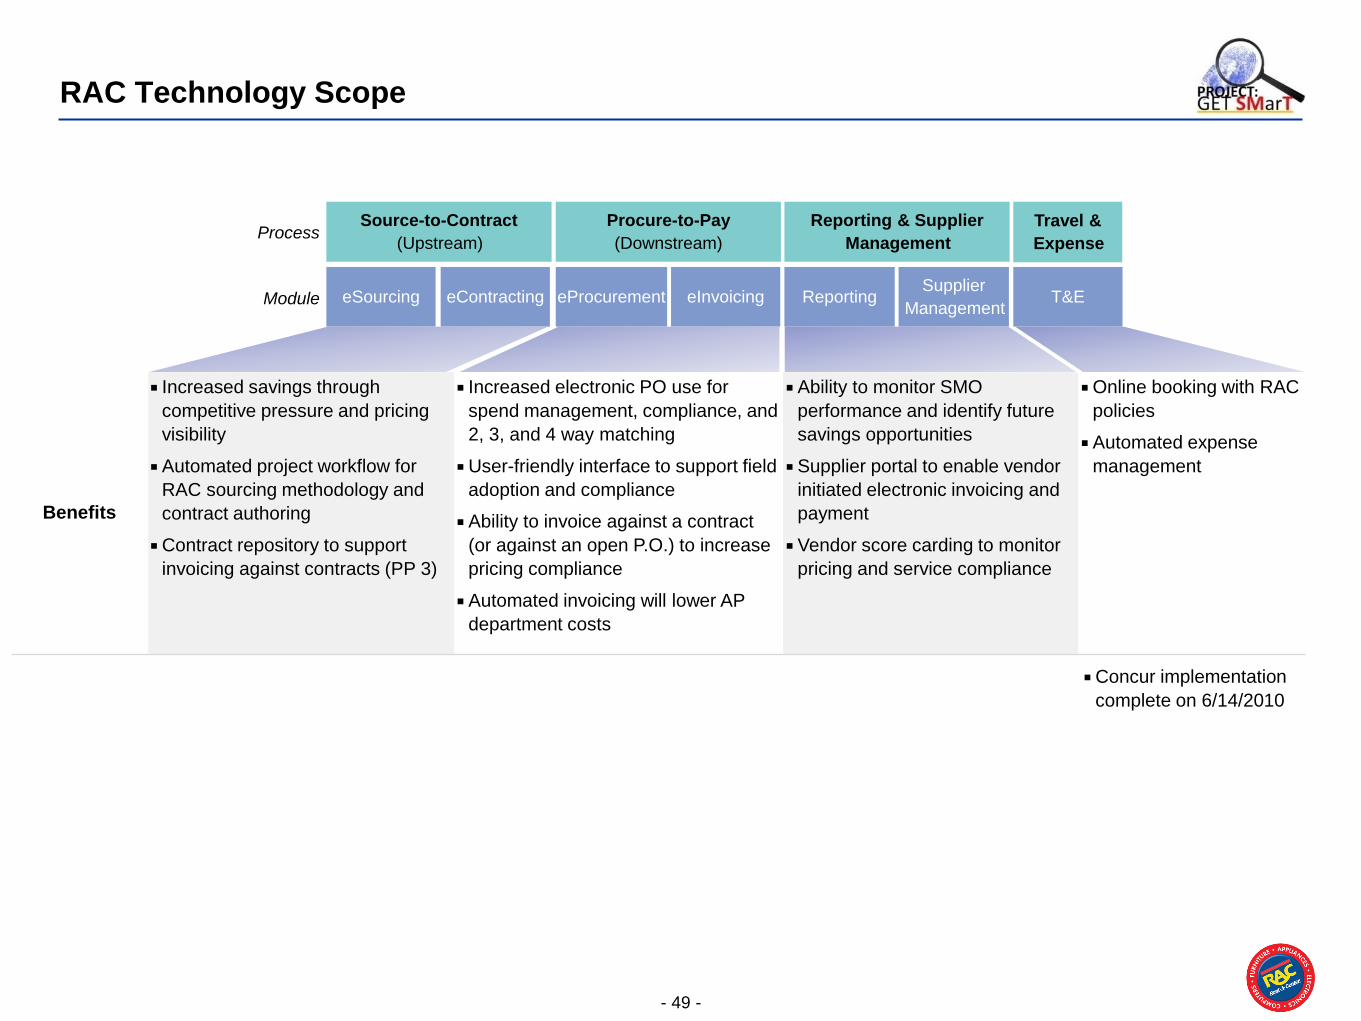
RAC Technology Scope
eContracting eSourcing
Source-to-Contract
(Upstream)
eInvoicing eProcurement
Procure-to-Pay
(Downstream)
Supplier
Management Reporting
Reporting & Supplier
Management
T&E
Travel &
Expense Process
Module
Benefits
Increased savings through
competitive pressure and pricing
visibility
Automated project workflow for
RAC sourcing methodology and
contract authoring
Contract repository to support
invoicing against contracts (PP 3)
Increased electronic PO use for
spend management, compliance, and
2, 3, and 4 way matching
User-friendly interface to support field
adoption and compliance
Ability to invoice against a contract
(or against an open P.O.) to increase
pricing compliance
Automated invoicing will lower AP
department costs
Ability to monitor SMO
performance and identify future
savings opportunities
Supplier portal to enable vendor
initiated electronic invoicing and
payment
Vendor score carding to monitor
pricing and service compliance
Online booking with RAC
policies
Automated expense
management
Concur implementation
complete on 6/14/2010

- 50 -
The RAC Technology Assessment Approach
The RAC team assessed our spend needs and capabilities, developed the future state vision for the SMO, and created the options
that the Technology Steering Committee assessed to make the final recommendation
As – Is Assessment Strategy Development Technology Selection Implementation
Project: Get SMarT Accomplishments Potential Next Phase
Maturity survey
SMO vision development
Needs assessment
prioritization
Process and technology
assessment
Implementation scenario
development
Scenario ROI analysis
Implementation prioritization
Formation of steering
committee
RFP development and
distribution
Response analysis
Technology selection
RAC solution design
Solution implementation
User training
Business and technology
needs identified
Technology Business Case
created
Solution and vendor
recommendation developed
Technology implemented
Example
implementation roadmap
Majo
r A
cti
vit
ies
E
xam
ple
Do
cu
men
ts
Ou
tco
me
Technology cost / benefit
assessment
Technology demo
scripts
Maturity model assessment
and gap analysis
- 3 -
Tech Selection RFP Scoring Results
RAC stakeholders have completed the scoring process and identified SAP, Oracle, and Ariba as the best full suite providers,
and Emptoris as a leading single process provider.
Full Suite Upstream Only Downstream Only
Oracle SAP Ariba Ketera Emptoris BravoSolution Basware Lawson
General
Company
Information
3.9 3.9 3.7 3.6 3.8 3.9 3.4 3.7
Source to
Contract
4.4 4.7 4.6 3.0 4.8 3.3 N/A N/A
Procure to
Pay
4.6 4.3 4.3 3.3 N/A N/A 3.8 2.9
Spend
Analysis &
Reporting
4.2 4.2 4.3 3.5 4.2 3.8 2.9 3.4
Supplier
Management
4.5 4.4 4.4 3.2 2.7 1.9 3.1 3.2
Technical
4.0 3.4 3.8 2.9 3.5 3.4 3.4 3.6
Considering the strong performance of the full-suite providers and the relatively weak performance
of the niche providers, the team has not included Aravo and JPMC in this assessment.
2 13
2 13
1 2 3
12 3
1 2 3
1 2 3
Note: RAC stakeholders include M. Wilding, T. Fuller, P. Hall, J. Whitehead, B. Corley, N. Stevens, J.Chanani, M. Douglas, J. Arnette and R. Salvans
Technology
RFP evaluation

- 51 -
The Business Case - Executive Summary
Contracts eSourcing
Source-to-Contract
Invoicing eProcurement
Procure- to- Pay
Supplier
Management Reporting
Reporting & Supplier
Management
T&E
Travel &
Expense
RAC had some spend management technology in place, however further investments were required to reach the desired to-be
state
RAC had limited Sourcing and Contracting technology in place
The eProcurement technology was at a low level of maturity and required an upgrade to support new process paths if not replaced
RAC had very limited spend management Reporting capabilities, and no Supplier Management technology
Beyond basic electronic forms, the Travel and Expense (T&E) analysis, audits, and reporting were at a low level of maturity
5 Year financial analysis shows net savings of $ – $ MM for RAC
Scope of Business Case
Process
Module

- 52 -
The Technology Selection Process
Conducted high level market
analysis 44 vendors
Perform functionality review
and financial assessment
Down select to 19 vendors
that could potentially meet
RAC needs
Conducted capability
assessment and detailed
financial analysis
Down selected from 19 to 11
vendors that would receive
RFP
Developed and distributed
detailed RFP consisting of:
‒ 6 sections
‒ 275 questions
Evaluated responses and
identified 4 vendors that best met
RAC’s needs and provided
competitive pricing estimates
Developed seven page script
and executed detailed vendor
demos
Identified best-fit solution and
implementation scenario for
RAC
The RAC technology selection team conducted a 4 step process to identify the right technology solution to meet our needs
2. Detailed Analysis 3. RFP 1. Market Research 4. Demo Analysis
Vendors included in
initial assessment
Vendors included in
capability assessment Vendors receiving RFP
Vendors that provided
demonstrations
Where’s Coupa?
- 53 -
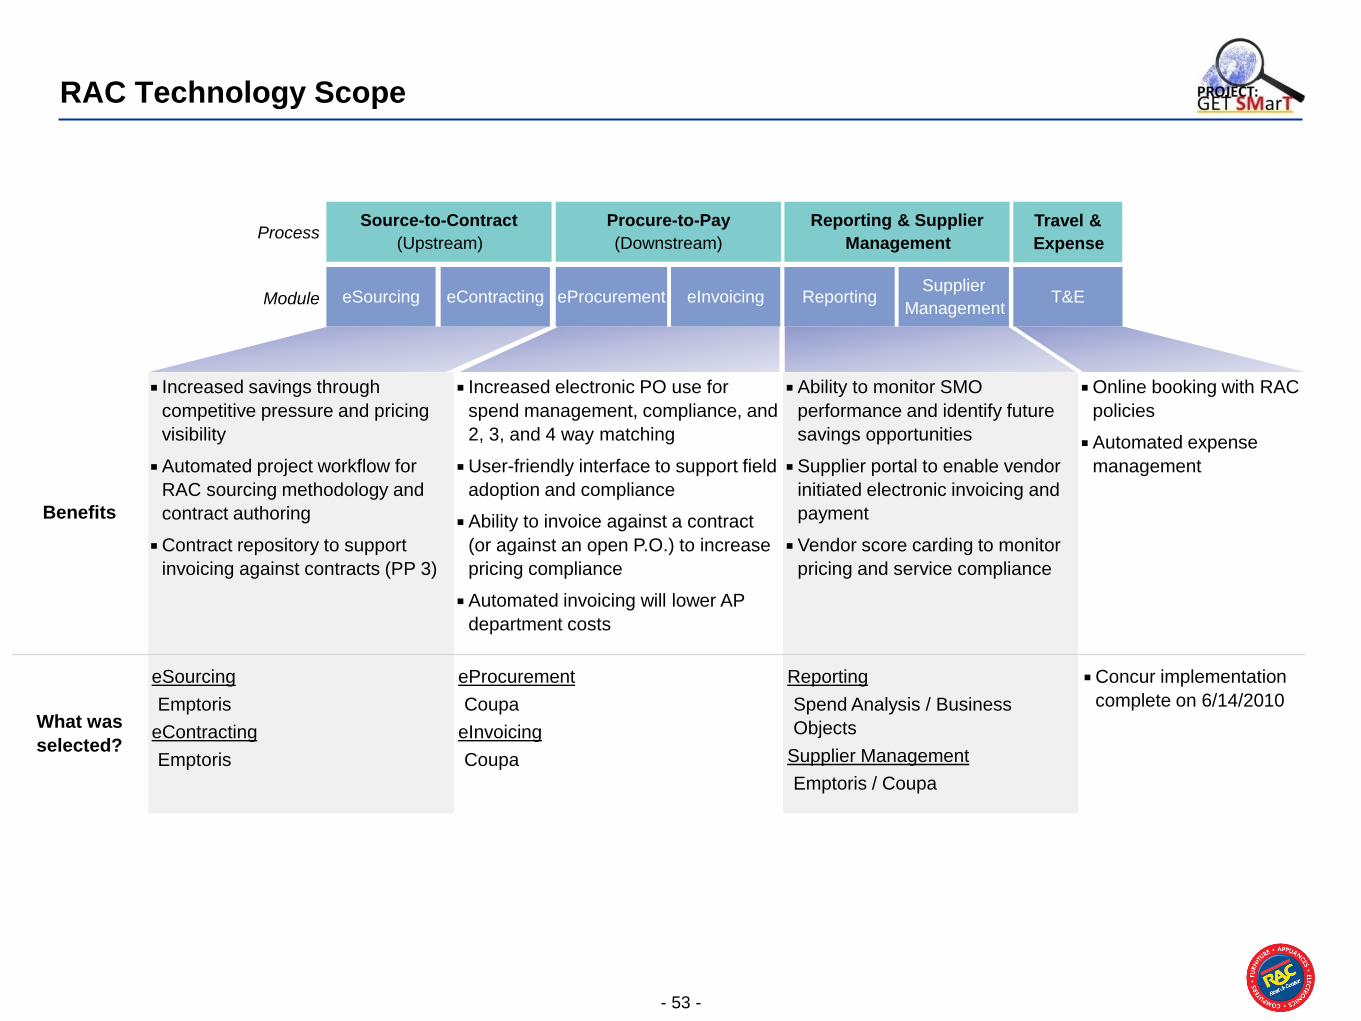
RAC Technology Scope
eContracting eSourcing
Source-to-Contract
(Upstream)
eInvoicing eProcurement
Procure-to-Pay
(Downstream)
Supplier
Management Reporting
Reporting & Supplier
Management
T&E
Travel &
Expense Process
Module
Benefits
Increased savings through
competitive pressure and pricing
visibility
Automated project workflow for
RAC sourcing methodology and
contract authoring
Contract repository to support
invoicing against contracts (PP 3)
Increased electronic PO use for
spend management, compliance, and
2, 3, and 4 way matching
User-friendly interface to support field
adoption and compliance
Ability to invoice against a contract
(or against an open P.O.) to increase
pricing compliance
Automated invoicing will lower AP
department costs
Ability to monitor SMO
performance and identify future
savings opportunities
Supplier portal to enable vendor
initiated electronic invoicing and
payment
Vendor score carding to monitor
pricing and service compliance
Online booking with RAC
policies
Automated expense
management
What was
selected?
eSourcing
Emptoris
eContracting
Emptoris
eProcurement
Coupa
eInvoicing
Coupa
Reporting
Spend Analysis / Business
Objects
Supplier Management
Emptoris / Coupa
Concur implementation
complete on 6/14/2010

- 54 -
June July August September October December Q1, 2011
6/7 6/14 6/21 6/28 7/5 7/12 7/19 7/26 8/2 8/9 8/16 8/23 8/30 9/6 9/13 9/20 9/27 10/4 10/11
PMO
Source to
Contract •eSourcing
•eContracting
Spend Analysis
Procure to Pay •eProcurement
•eInvoicing
Supplier
Management
Master Data
CTC
Technology Implementation Timeline
Change, Training, Communications
Build Validate Go-Live
Coupa Release 21
(Invoice to Contract, PP3)
Build Validate Go-Live
Coupa Release 31
(Tiered Pricing)
Build Validate Go-
Live Plan Design
Installation
completed
Configuration
completed
Integration
completed
Program Leadership (PMO)
Plan Build Validate Go-
Live Design
Master Data
Validate Build Go-Live Design Plan
Validate Go-
Live Design Plan Build
Installation
completed
Configuration
completed
Integration
completed Coupa Release 1
(Blanket PO)
Installation
completed
Configuration
completed
Configuration
completed
Integration
completed
Installation
completed

- 55 -
eSourcing Overview
What’s at Stake for RAC
eSourcing Benefits to RAC
Increased competitive pressure and visibility into market pricing
Streamlined RAC supplier evaluation for rapid “apples to apples” analysis
Automated workflow to ensure enforcement of RAC’s 6 step sourcing methodology
Module Assessment
eContracting eSourcing
Source-to-Contract
(Upstream)
eInvoicing eProcurement
Procure-to-Pay
(Downstream)
Supplier
Management Reporting
Reporting & Supplier
Management Process
Module
eSourcing advanced functionality will be used by the SMO to achieve incremental soft dollar savings for RAC.
Sourcing Impact
All current and future events can use traditional and advanced sourcing functionality
SMO can use auction functionality for rapid “spot sourcing” events
Like other retailers, RAC can use the eSourcing tool for merchandise

- 56 -
eContracting Overview
eContracting Benefits to RAC
Contract authoring automates contract development, enforces internal approval flows, and provides visibility to progress
Contract repository enables uploading of new and existing contracts for automated procurement and invoicing (PP3)
Automated tracking enables pricing, commitment, vendor compliance, and lifecycle management
Module Assessment
eContracting eSourcing
Source-to-Contract
(Upstream)
eInvoicing eProcurement
Procure-to-Pay
(Downstream)
Supplier
Management Reporting
Reporting & Supplier
Management Process
Module
eContracts automated authoring, storage, and procurement integration will drive efficiencies, compliance, and savings identification.
What’s at Stake for RAC

- 57 -
eProcurement Overview
What Coupa brings to RAC
Electronic PO acknowledgements and approval flows lower cost to serve and increase visibility and compliance
Reduction of headcount in our AP group
Advanced search functionality and user friendly interface drives compliance and use of catalogs and punch-outs in the field
Extremely high adoption rate of tool
Ability to order supplies from the desktop keeping our employees in the store renting and selling merchandise
Labor hours under control; sales going up
Business partner to discuss other needs and solutions (sales tax)
Increased performance against established KPIs
Module Assessment
eContracting eSourcing
Source-to-Contract
(Upstream)
eInvoicing eProcurement
Procure-to-Pay
(Downstream)
Supplier
Management Reporting
Reporting & Supplier
Management Process
Module
Invoiced spend will
be moved to PO
based process path
(PP 1 & PP 2)
Catalog
with
Purchase
Order (PO)
1
Non-
Catalog
with PO
2
Invoice
Directly
Against
Contract
3
Invoice
Only
4
Transparent Controlled
- 58 -
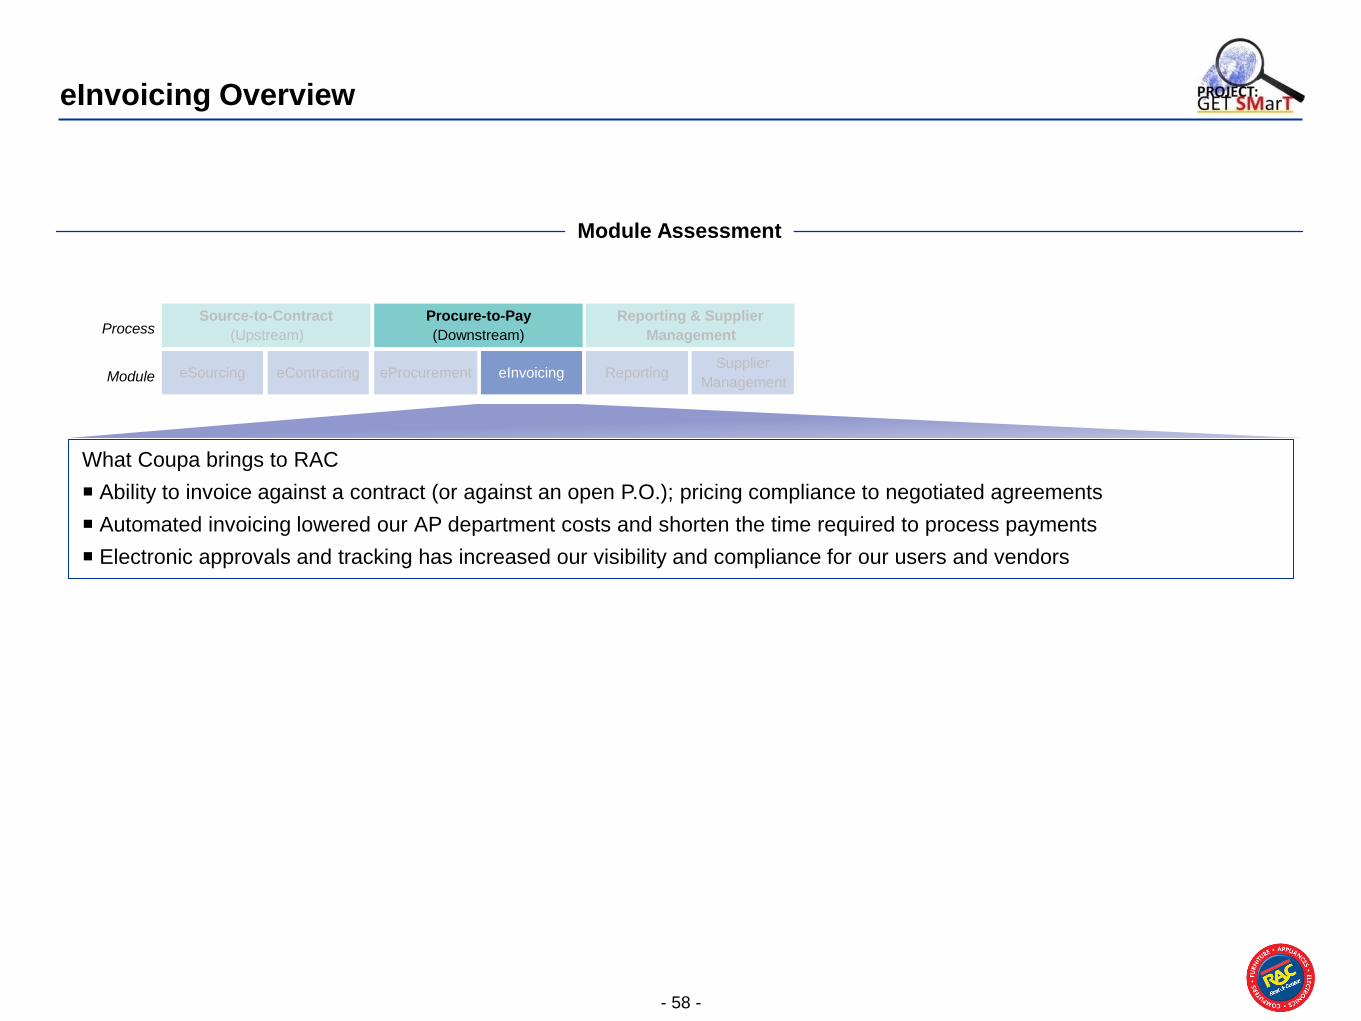
eInvoicing Overview
What Coupa brings to RAC
Ability to invoice against a contract (or against an open P.O.); pricing compliance to negotiated agreements
Automated invoicing lowered our AP department costs and shorten the time required to process payments
Electronic approvals and tracking has increased our visibility and compliance for our users and vendors
Module Assessment
eContracting eSourcing
Source-to-Contract
(Upstream)
eInvoicing eProcurement
Procure-to-Pay
(Downstream)
Supplier
Management Reporting
Reporting & Supplier
Management Process
Module
- 59 -
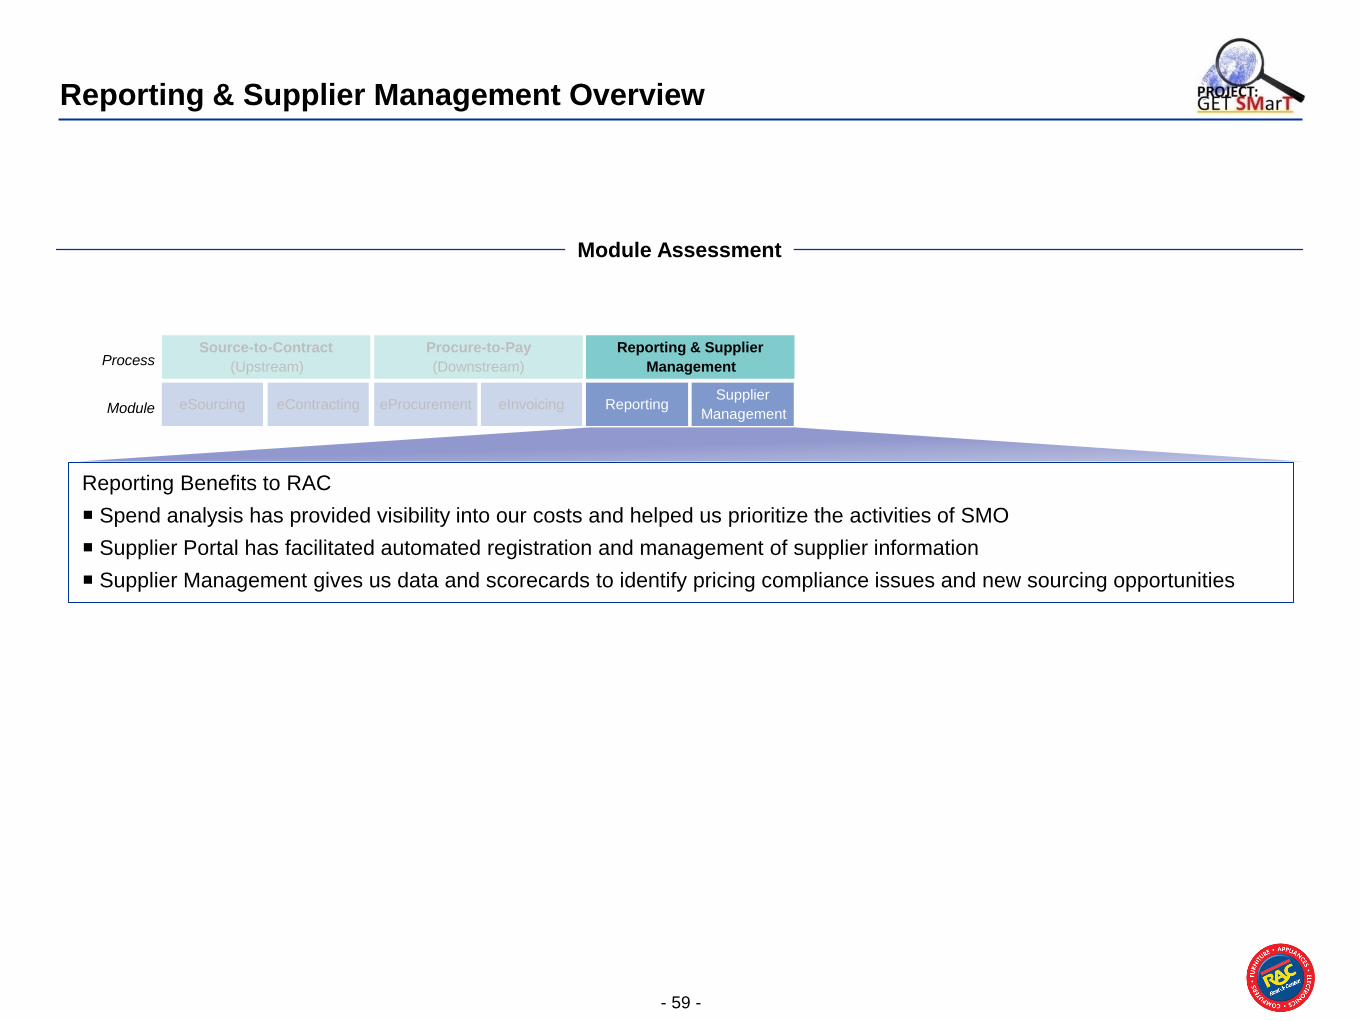
Reporting & Supplier Management Overview
Reporting Benefits to RAC
Spend analysis has provided visibility into our costs and helped us prioritize the activities of SMO
Supplier Portal has facilitated automated registration and management of supplier information
Supplier Management gives us data and scorecards to identify pricing compliance issues and new sourcing opportunities
Module Assessment
eContracting eSourcing
Source-to-Contract
(Upstream)
eInvoicing eProcurement
Procure-to-Pay
(Downstream)
Supplier
Management Reporting
Reporting & Supplier
Management Process
Module
- 60 -
Lessons learned
• View a live environment, see how other companies use the product and see what
hardware they are using
• Engage internal IT group earlier and more frequently in the process (what will be
required on ongoing basis after implementation)
• Engage Internal Audit and IT Security earlier in the process
• First significant Software as Service model for RAC (IT, Legal, IA)

- 61 -
Contact information
Mike Wilding
SVP- Accounting/Global Controller & CPO
972 801 1404
Confidential and proprietary
Extended Business Relationship Management (EBRM)
62
Bruce McQuillen
Deloitte Consulting LLP

Deloitte Consulting LLP
Extended Business Relationship Management (EBRM)
A Deloitte Perspective
May 2012

- 64 -
The launch of a technology company’s long-anticipated white smartphone was delayed for 10 months because of the
quality and longevity of the white paints manufactured in China.
Companies across industries are feeling the impact of ineffective management of
their business relationships
Examples
A toy maker was forced to recall nearly 2 million toys and pay $2.3 million in fines due to identification of lead paint in
toys made by one of its Chinese contract manufacturers.
Note: Sources listed on slide 17
Due to a concern over the role of third party risk in bank failures, the Office of the Comptroller of the Currency has
required that national banks establish a “comprehensive program for managing the relationship” with third parties.
The closure of the German company responsible for supplying a convertible model’s folding roof left the otherwise
finished car in purgatory while the automaker searched for a new supplier.
Coupa is one of several components that can help address the impact of ineffective business relationships
- 65 -
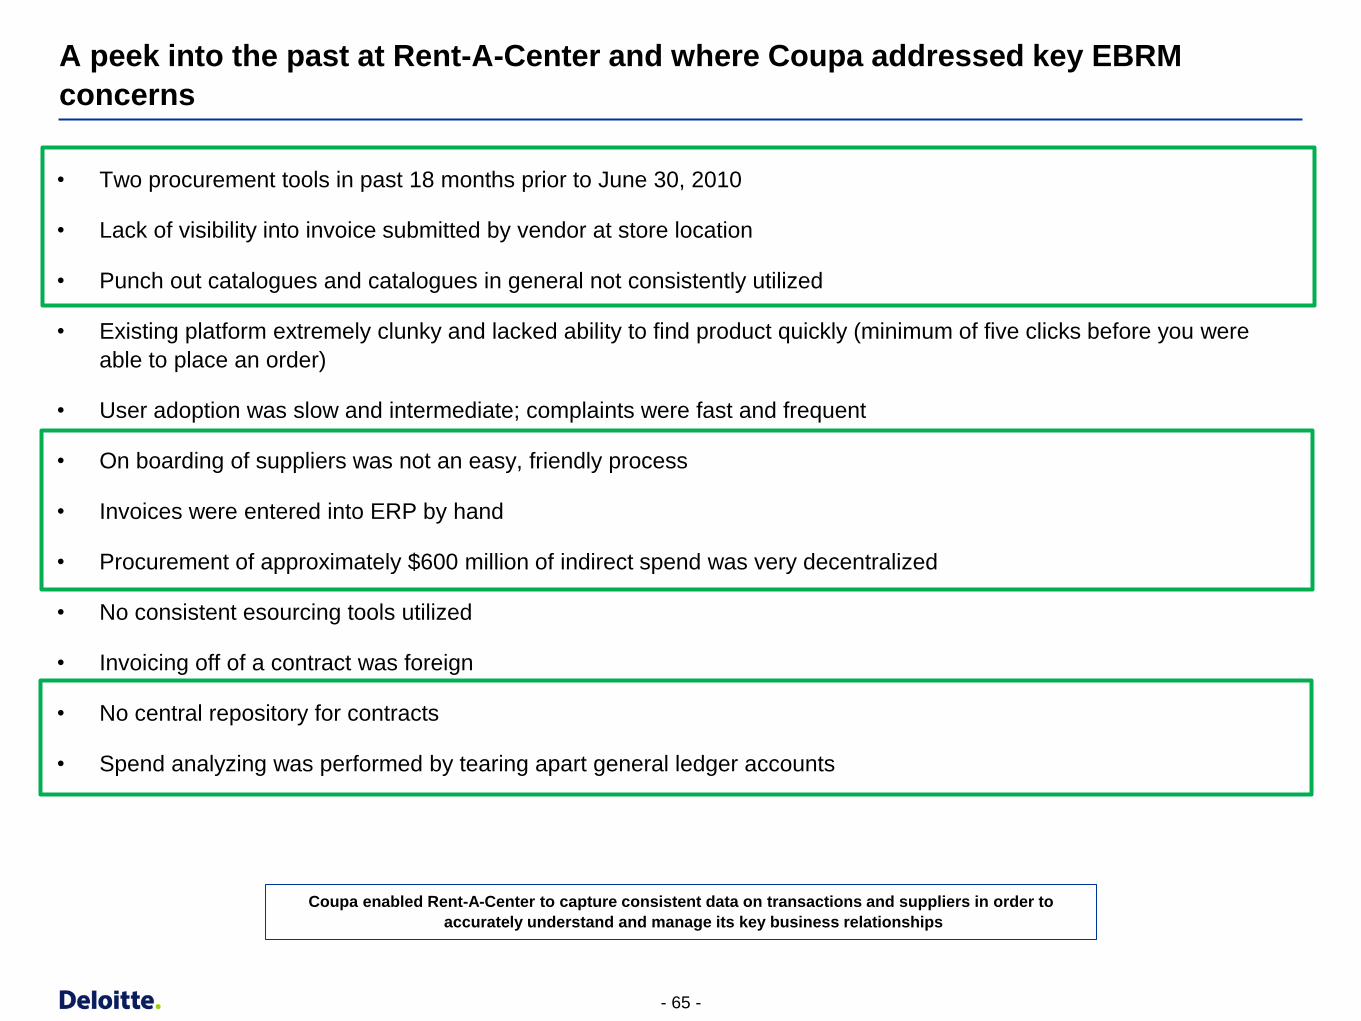
A peek into the past at Rent-A-Center and where Coupa addressed key EBRM
concerns
• Two procurement tools in past 18 months prior to June 30, 2010
• Lack of visibility into invoice submitted by vendor at store location
• Punch out catalogues and catalogues in general not consistently utilized
• Existing platform extremely clunky and lacked ability to find product quickly (minimum of five clicks before you were
able to place an order)
• User adoption was slow and intermediate; complaints were fast and frequent
• On boarding of suppliers was not an easy, friendly process
• Invoices were entered into ERP by hand
• Procurement of approximately $600 million of indirect spend was very decentralized
• No consistent esourcing tools utilized
• Invoicing off of a contract was foreign
• No central repository for contracts
• Spend analyzing was performed by tearing apart general ledger accounts
Coupa enabled Rent-A-Center to capture consistent data on transactions and suppliers in order to
accurately understand and manage its key business relationships
- 66 -
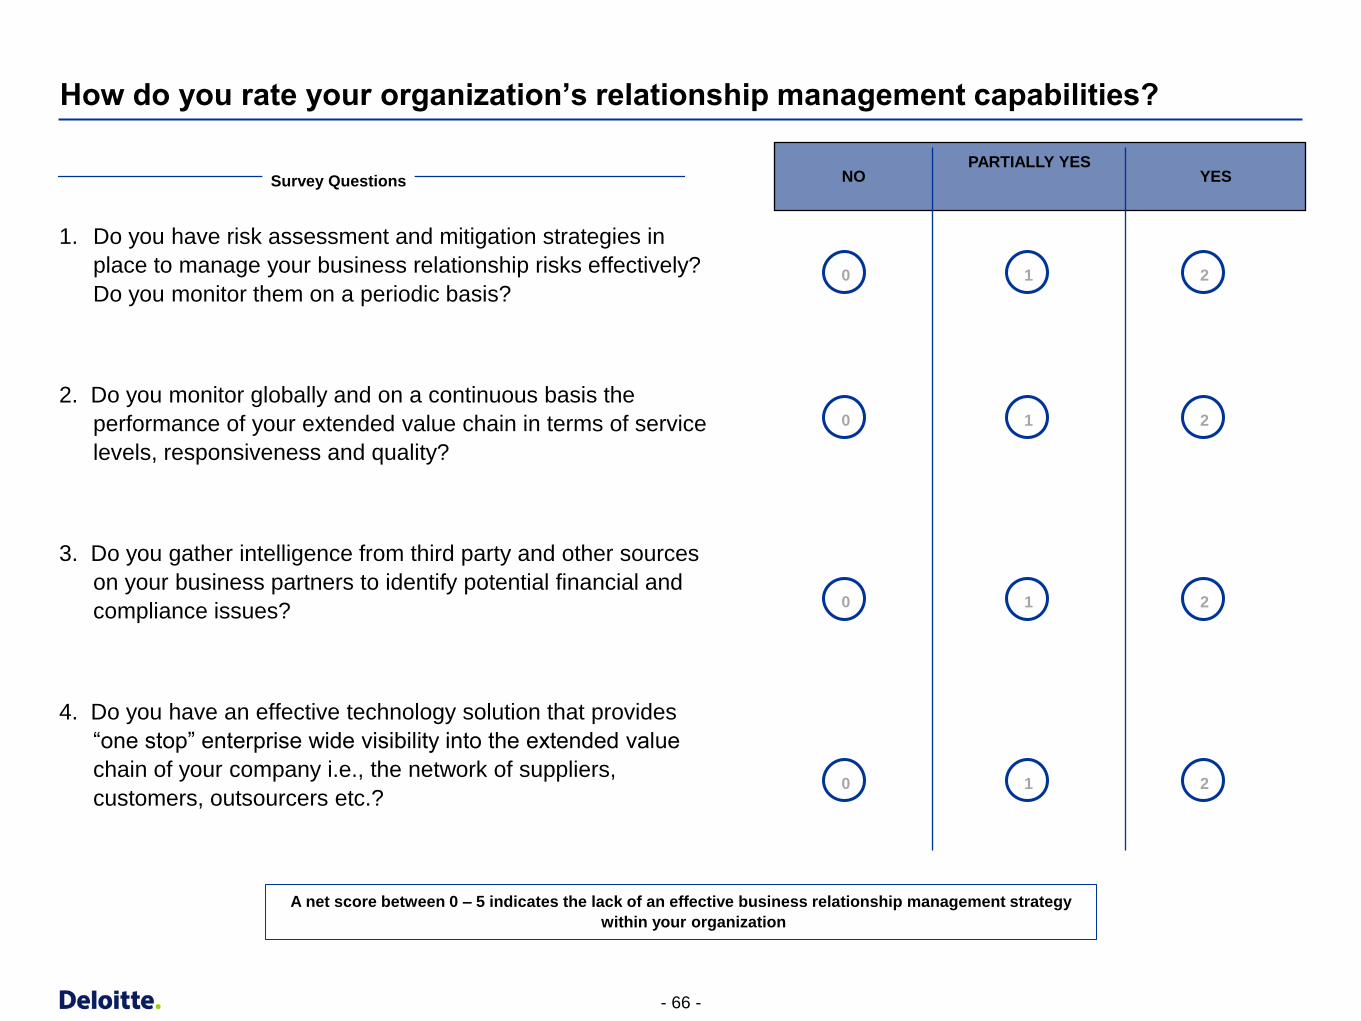
How do you rate your organization’s relationship management capabilities?
1. Do you have risk assessment and mitigation strategies in
place to manage your business relationship risks effectively?
Do you monitor them on a periodic basis?
2. Do you monitor globally and on a continuous basis the
performance of your extended value chain in terms of service
levels, responsiveness and quality?
3. Do you gather intelligence from third party and other sources
on your business partners to identify potential financial and
compliance issues?
4. Do you have an effective technology solution that provides
“one stop” enterprise wide visibility into the extended value
chain of your company i.e., the network of suppliers,
customers, outsourcers etc.?
NO PARTIALLY YES
YES
0
0
0
0
1
1
1
1
2
2
2
2
Survey Questions
A net score between 0 – 5 indicates the lack of an effective business relationship management strategy
within your organization
- 67 -
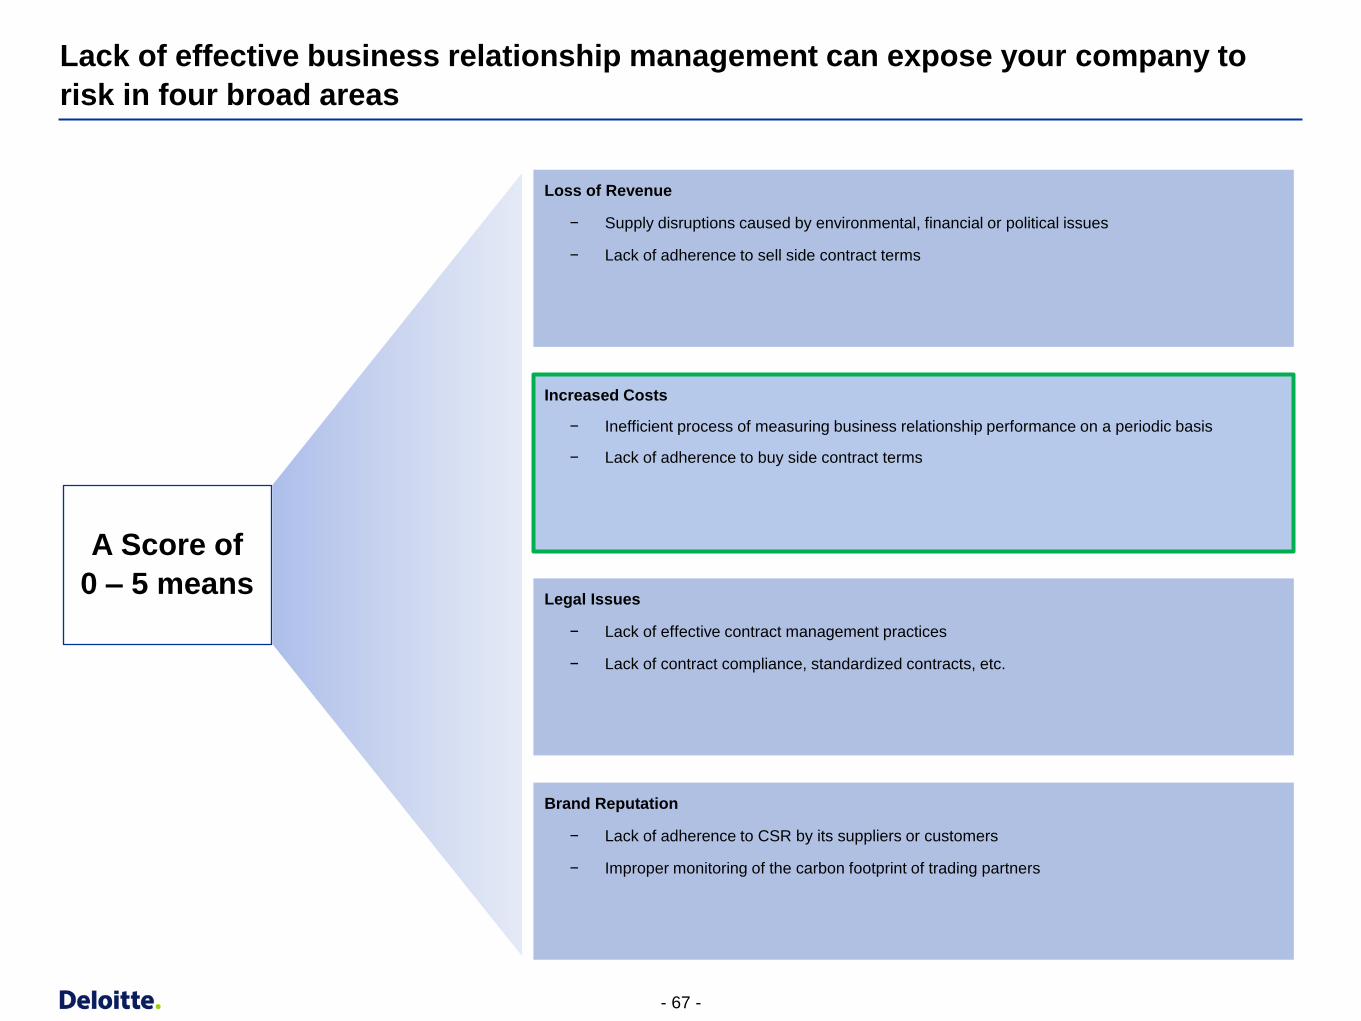
Lack of effective business relationship management can expose your company to
risk in four broad areas
Loss of Revenue
− Supply disruptions caused by environmental, financial or political issues
− Lack of adherence to sell side contract terms
Increased Costs
− Inefficient process of measuring business relationship performance on a periodic basis
− Lack of adherence to buy side contract terms
Legal Issues
− Lack of effective contract management practices
− Lack of contract compliance, standardized contracts, etc.
Brand Reputation
− Lack of adherence to CSR by its suppliers or customers
− Improper monitoring of the carbon footprint of trading partners
A Score of
0 – 5 means
- 68 -
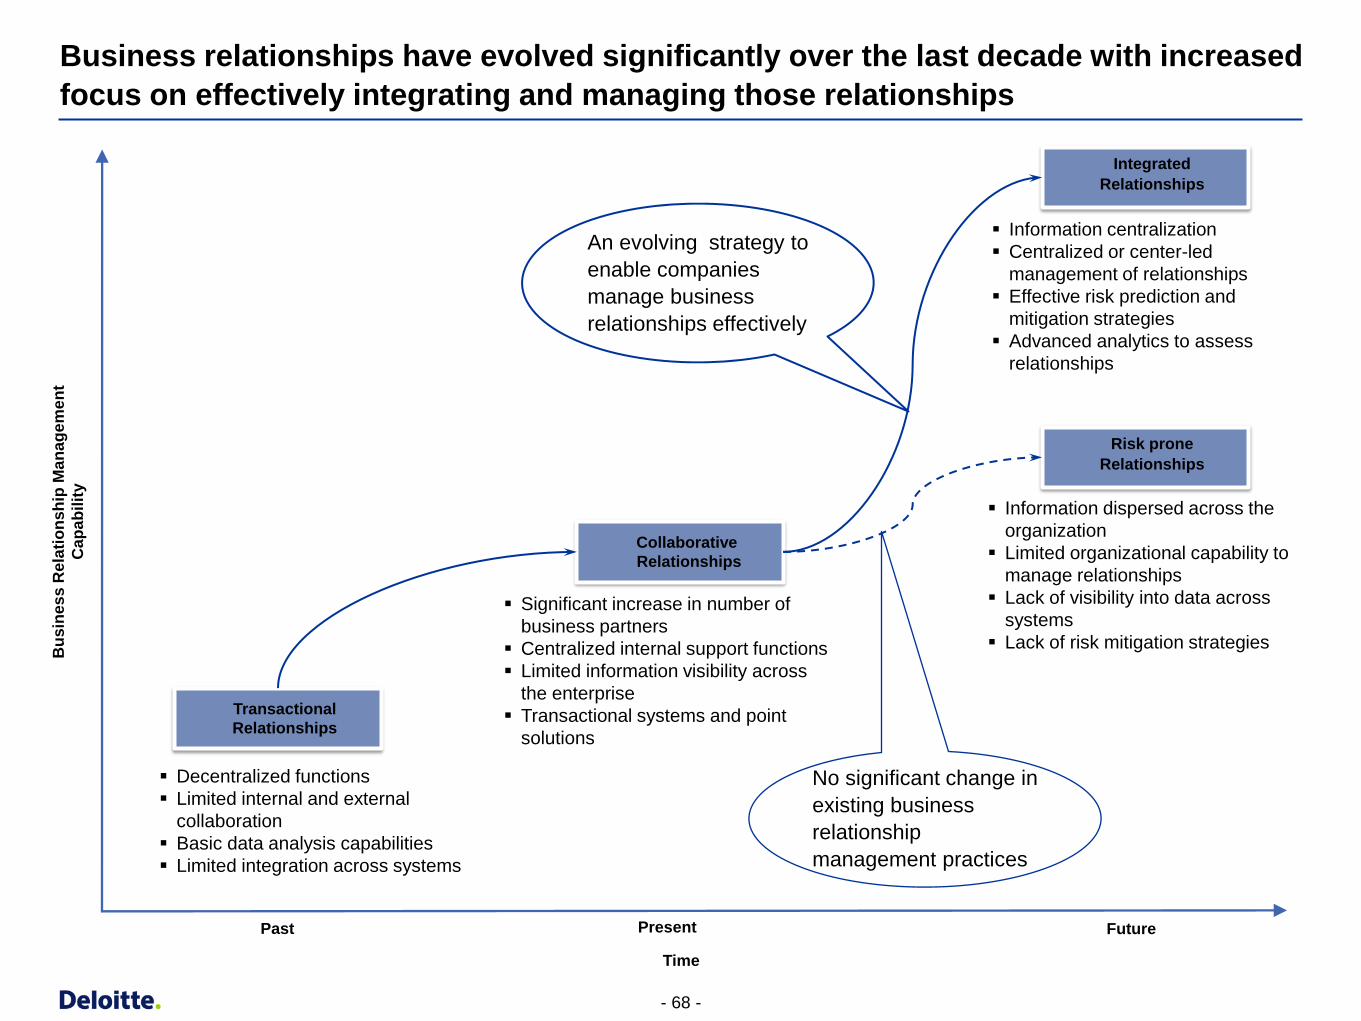
Business relationships have evolved significantly over the last decade with increased
focus on effectively integrating and managing those relationships
Legacy
transactional
systems
Information centralization
Centralized or center-led
management of relationships
Effective risk prediction and
mitigation strategies
Advanced analytics to assess
relationships
Collaborative
Relationships
Transactional
Relationships
Integrated
Relationships
Decentralized functions
Limited internal and external
collaboration
Basic data analysis capabilities
Limited integration across systems
Significant increase in number of
business partners
Centralized internal support functions
Limited information visibility across
the enterprise
Transactional systems and point
solutions
Risk prone
Relationships
Future Present Past
Information dispersed across the
organization
Limited organizational capability to
manage relationships
Lack of visibility into data across
systems
Lack of risk mitigation strategies
An evolving strategy to
enable companies
manage business
relationships effectively
Bu
sin
es
s R
ela
tio
nsh
ip M
an
ag
em
en
t
Cap
ab
ilit
y
Time
No significant change in
existing business
relationship
management practices

- 69 -
Extended Business Relationship Management (EBRM) is a strategy to monitor and
manage key business relationships across the company
Sales
Finance
Operations
IT
HR
Procurement
Logistics
Marketing
Direct Materials Suppliers
Indirect Suppliers
Trade Partners
Customers
Alliance Partners
Corporate Functions Buy Side Partners
Sell Side Partners
Other Partners
Contract Manufacturers
Outsourced Service
Providers
Extended Business Relationship
Management (EBRM)
Provide central visibility to business
relationships
Measure, monitor and manage relationships
risk, performance, compliance and
information
Manage relationships proactively vs.
reactively
Deepen and improve key relationships
Improve top ad bottom line performance

- 70 -
Responsibility and ownership to take
necessary actions for risk mitigation
Alignment of organizational structure
and governance with EBRM strategy
Shift in mindset towards the nature of
business relationships – from
transactional to a long term strategic
perspective
Superior database management and data analytics capabilities
Integration of different information systems within the enterprise
Improved visibility into the systems across different functions
Ability to assess and correct existing
business processes that monitor risk
and performance metrics
Continuous benchmarking with
industry best practices to measure the
effectiveness of the relationship
Standardized data capture,
management and reporting processes
EBRM Strategy
Technology Capability
Successful EBRM strategy requires building capabilities at a people, process and technology level
Illustrative Capabilities

- 71 -
Ele
men
ts o
f E
BR
M
Our EBRM Lifecycle Framework provides the capability to assess and manage
relationship across multiple elements of EBRM
EBRM Lifecycle Framework
Manage Relationships Evaluate Relationships Prioritize Relationships
• Segment
relationships
within each type
based on various
criteria (e.g.,
importance,
business impact,
financial
obligations, etc.)
• Identify key
existing
relationship types
(suppliers,
customers,
channel partners,
contract
manufacturers,
outsourced
service providers,
etc.)
Define
Criteria
Segment /
Prioritize Identify
Set Target
Levels
Monitor
Performance
Implement
improvements
• Assess
performance of
companies based
on pre-defined
criteria
• Set performance
targets for each
relationship type
and segment
• Define
evaluation criteria
(quantitative and
qualitative) for
each relationship
type and
segment
• Identify data
required to
measure defined
criteria
• Identify and
execute
performance
improvement
opportunities
based on gaps
observed against
the key criteria
• Monitor
performance of
companies within
a relationship
type on a
periodic basis
against the set
targets
Risk Management
Compliance Management (regulatory, financial, sustainability, etc.)
Performance Management
Information Management
- 72 -
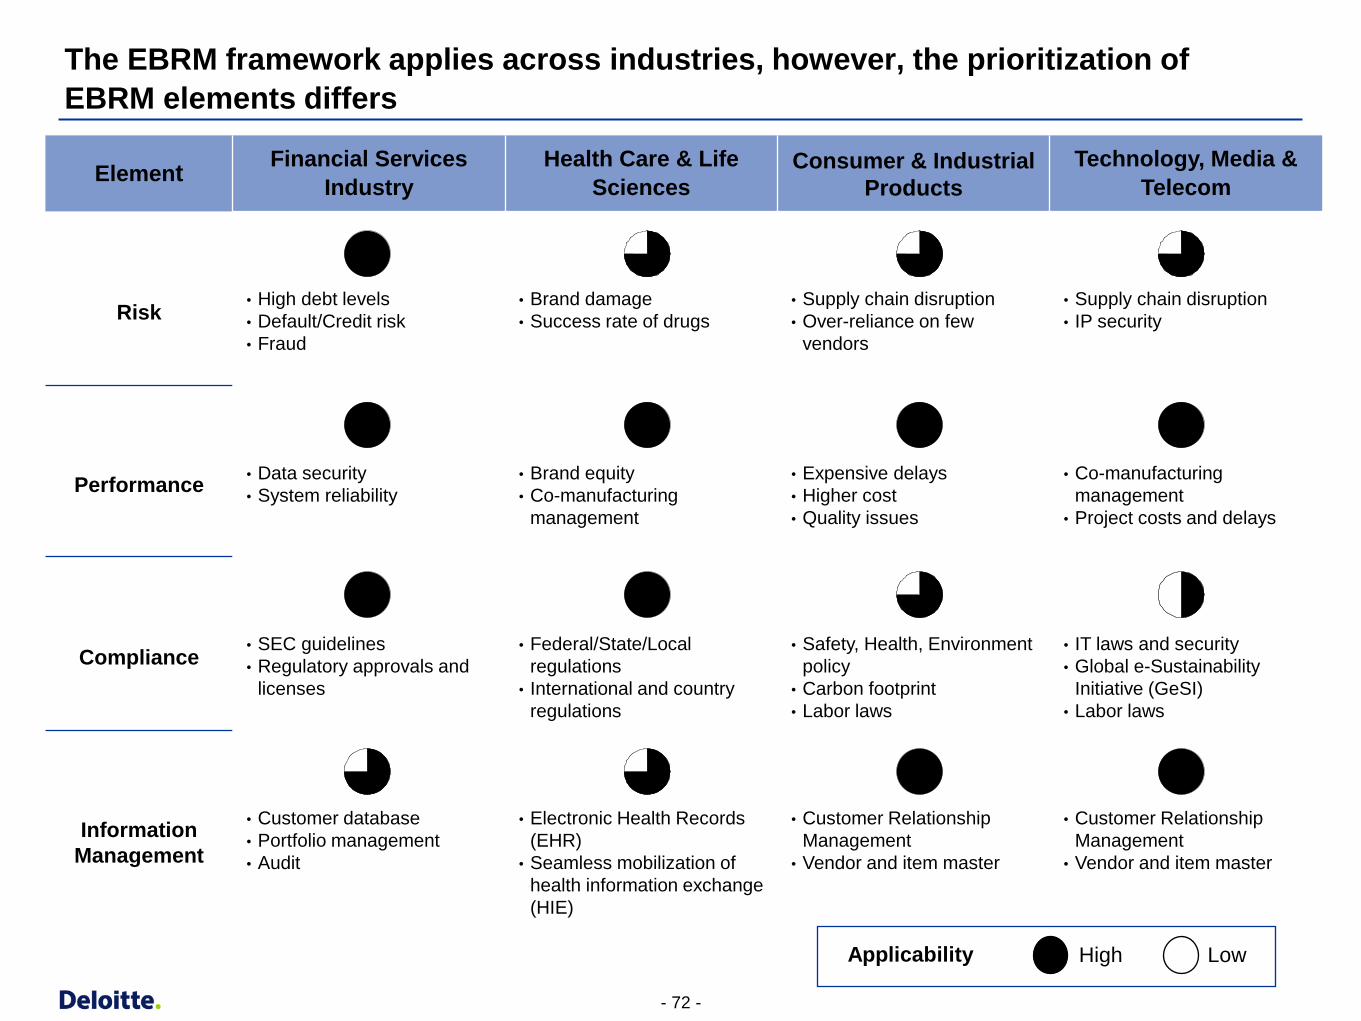
Element Financial Services
Industry
Health Care & Life
Sciences
Consumer & Industrial
Products
Technology, Media &
Telecom
Risk
• High debt levels
• Default/Credit risk
• Fraud
• Brand damage
• Success rate of drugs
• Supply chain disruption
• Over-reliance on few
vendors
• Supply chain disruption
• IP security
Performance
• Data security
• System reliability
• Brand equity
• Co-manufacturing
management
• Expensive delays
• Higher cost
• Quality issues
• Co-manufacturing
management
• Project costs and delays
Compliance
• SEC guidelines
• Regulatory approvals and
licenses
• Federal/State/Local
regulations
• International and country
regulations
• Safety, Health, Environment
policy
• Carbon footprint
• Labor laws
• IT laws and security
• Global e-Sustainability
Initiative (GeSI)
• Labor laws
Information
Management
• Customer database
• Portfolio management
• Audit
• Electronic Health Records
(EHR)
• Seamless mobilization of
health information exchange
(HIE)
• Customer Relationship
Management
• Vendor and item master
• Customer Relationship
Management
• Vendor and item master
The EBRM framework applies across industries, however, the prioritization of
EBRM elements differs
High Low Applicability

- 73 -
The key to effective EBRM is capturing and managing three inter-connected layers of
data: Strategic, Tactical and Transactional
Data Management Example: Performance Management
Data Category Description Example Data
Strategic Data that directly drives shareholder value
such as revenues, costs of goods sold, and
cost of capital
Increased
Supply Cost Lost Revenue
Tactical
Data that is used to help make day-to-day
management decisions
Tactical data is derived by consolidating
transactional data elements such as
contractual price and invoice price to calculate
purchase price variance
Purchase Price
Variance % of On-Time
Deliveries
Transactional Data that describes a business transaction
such as orders, invoices, payments, and
delivery details
Invoice Price Delivery Date

- 74 -
EBRM Technology can be classified into 3 broad categories – Transactional, Tactical,
Strategic, in conjunction with the type of data it handles
EBRM Solutions by Data Type
Strategic Tactical Transactional
SAP
Oracle
CVM solutions
Hiperos
Emptoris
Coupa
Aravo
Xcitec
Tools like ERP and CRM capture
transactional data useful primarily
at an operational level
Typically fail to capture tactical or
strategic data
Some ERP providers also provide
“upstream” tactical solutions
Solutions like spend analysis, e-
sourcing, contract management
provide expertise in respective
domains
Can access tactical and even
transactional data but fail to
assess strategic aspects (e.g.,
risk)
Lack an enterprise-wide view of
business relationships
Consolidate information from
several solutions like ERP, CRM,
and CLM
Provide seamless data integration
and analysis for “one-stop”
enterprise-wide snapshot of
relationships
Enable comprehensive
assessment and management of
key business relationships
- 75 -
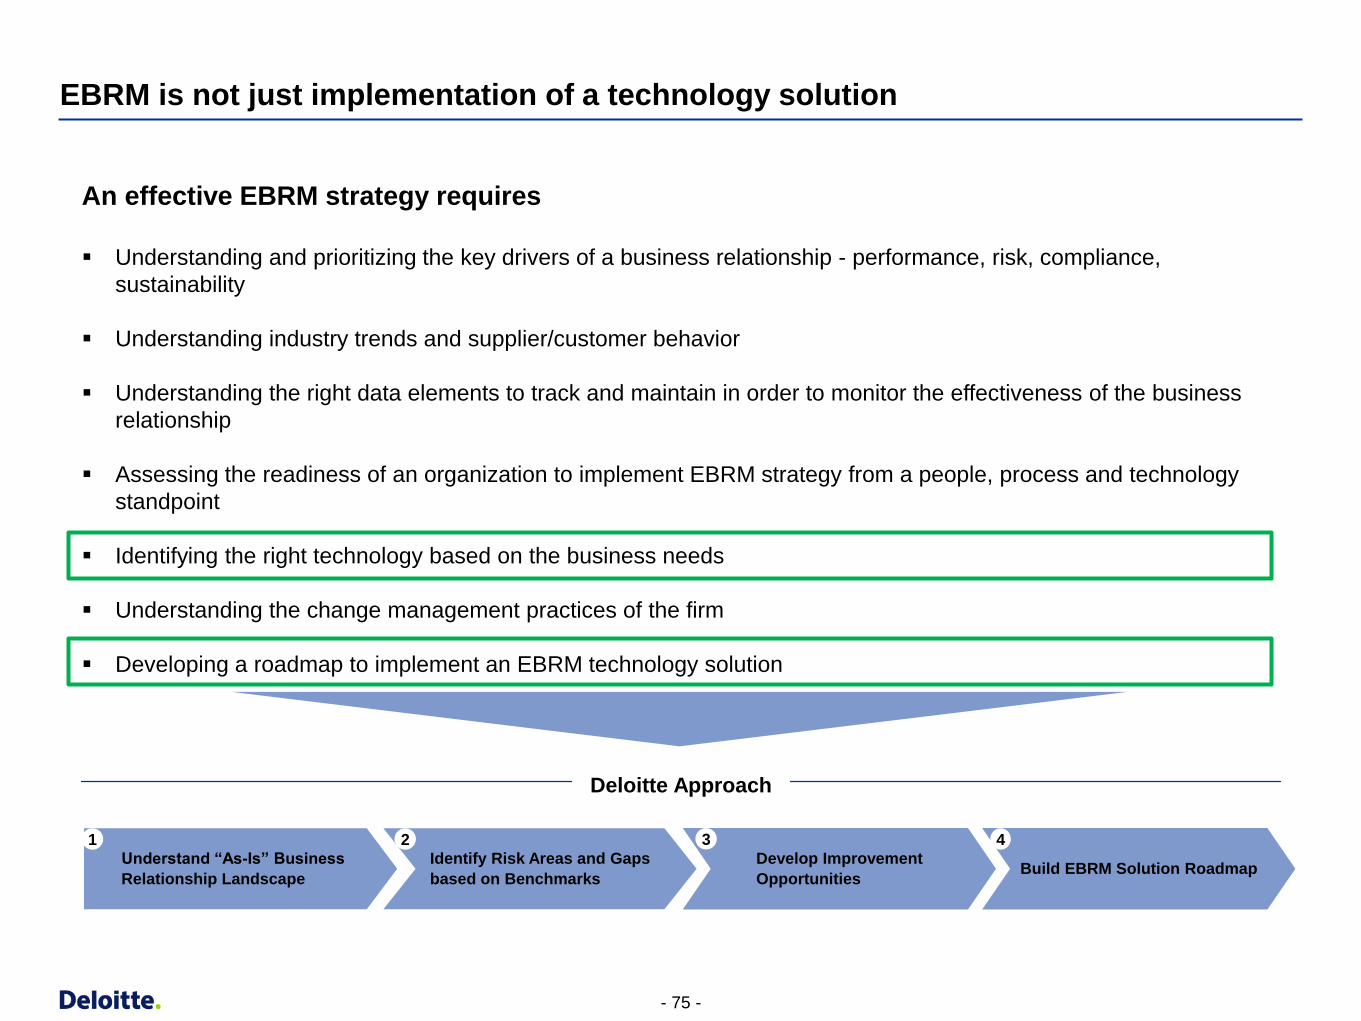
EBRM is not just implementation of a technology solution
An effective EBRM strategy requires
Understanding and prioritizing the key drivers of a business relationship - performance, risk, compliance,
sustainability
Understanding industry trends and supplier/customer behavior
Understanding the right data elements to track and maintain in order to monitor the effectiveness of the business
relationship
Assessing the readiness of an organization to implement EBRM strategy from a people, process and technology
standpoint
Identifying the right technology based on the business needs
Understanding the change management practices of the firm
Developing a roadmap to implement an EBRM technology solution
Deloitte Approach
Identify Risk Areas and Gaps
based on Benchmarks
2
Build EBRM Solution Roadmap
4
Understand “As-Is” Business
Relationship Landscape
1
Develop Improvement
Opportunities
3

- 76 -
• Current State Analysis
• Business Relationship Profile
• Maturity Assessment
• Gap Analysis/Prioritization
• Solution Roadmap
• Business Case
Deloitte helps companies begin the EBRM process by assessing existing relationship
management processes and developing improvement plans
Identify Risk Areas and Gaps
based on Benchmarks
2
Build EBRM Solution Roadmap
4
Understand “As-Is” Business
Relationship Landscape
1
Des
cri
pti
on
• Understand current business relationship landscape, processes, organization, and technology for each stage in the EBRM lifecycle
• Validate baseline with key stakeholders
• Develop the “As-Is” business relationship landscape profile
• Compare “As-Is” state with industry best practices. Use a defined scoring method that ranks each EBRM element from I - Basic to IV – Superior
• Quantify relationship management risk exposure and prioritize areas that need to be addressed
• Develop list of improvement initiatives based on gap assessment and identified risk areas
• Identify key metrics and develop target state leveraging framework
• Determine resources and technology required for each initiative
Ke
y D
eli
ve
rab
les
Implementation Roadmap
May JulyJune Aug.MarFebJanDec AprilOct Nov May JulyJune Aug.MarFebJanDec AprilOct Nov
Process
People
Tech.
(subset)
FSS &
Facility
Assessment
Detailed Design
Post Go-Live support & monitoring
Location Selection
FSS
Leader Identified
HR, Change Leadership, CommunicationsFSS Mgrs.
HiredFSS Mgrs.
HiredFSS Staff Begins
FSS Staff Begins
Train
Integrated
Testing
Go-LiveGo-Live
Interview & Hire
Activity to Role, Role to
Job Mapping
Develop Org.
Model
Post Job
Desc
Straw-man
Org. Model
Lease Negotiations
User Accept-
anceTesting
Facility Buildout (Including technical infrastructure)
Design Available for Occupancy
Design
Workshops
By location gap analysis/ Design Modifications
Config./Document
Process Document.
Training Mat. Develop.
T3
Kick-off
Bus. Specs
Prioritize/ Approve Specs
Prioritize/ Approve Specs
Tech Spec
Development/ Mods, Unit Testing
!st Draft Detailed Designs
Build & Test Implement
Designs Complete
Design
Challenge Sesions
Develop Test Scenarios & Scripts
User
Accept-ance
Testing
Develop Governance & Service Level Agreements, performance measures
Business Case Update
Steering Committee Updates, Change Leadership, Communications
Various Technology (Software licensing, Hardware
selection, other prep)
Tax implications &
benefits
Change
readiness assessment
Leadership Action Plan
Controls Compliance
Review Complete
Cont.
Review
Assessment
Develop Improvement
Opportunities
3
• Develop a roadmap to realize target state across people, process, technology and governance
• Identify cost/benefits for each initiative on the roadmap
• Develop business case
• Improvement Initiatives
• Key Initiative Charters
Project Roadmap Process People Tech.Difficulty of
ImplementationTimeframe Status
Identify the Sales contracts that will be part of
the central repository across functional groups
and regions Medium Difficulty 3- 6 Months -
OCR existing contracts and store in a central
repository to allow for key-word searches and
associate “meta-data” (header data) with each
contract to improve reporting and searching
functionality
Medium Difficulty 3- 6 Months -
Use an integrated process and platform to create
and store contracts to enable Apple to search
through all contracts using advanced filters and
restrict access as needed
High Difficulty Long-Term -
Automate customize alerts/notifications based on
key contract attributes (e.g., expiration date,
customer certification status) High Difficulty Long-Term -
Develop the ability to audit executed to contracts
for the following:
• Contracts with sections and clauses that differ
from the “model form” (template)
• Cycle time for contract creation and other key
performance metrics
• How often alternate clauses are used by
negotiator
High Difficulty Long-Term -
Initiative Type (Place ‘X’ Next to Correct Type) Analysis & Planning X Implementation
Initiative Summary
Initiative Description Assess current org structure and align reporting lines and define internal KPI reports for effective performance of the contract team
Initiative Objective Improve the performance of the contracts team
Dependencies None
Initiative Driver(s)
Driver Place ‘X’ if it Applies Driver Description
Revenue Enhancement X Minimize revenue leakage by including proper checks and balances
Stakeholder Engagement (Request)
Cost & Efficiency X Improved performance of the contracts team leading to better efficiencies in the contracting process
Risk Management & Compliance
X Improvements in risk and compliance owing to improved performance of the contracts team
Initiative Business Case Estimates (Optional)
Resource CostTechnology Cost
(Hardware)
Technology Cost
(Software)Total Cost
Investment Rationale Benefit Rationale
(Risk Mitigation/Cost Savings/Revenue Opportunity)
Benefits Achieved to Date
(if Existing Initiative)
Revenue enhancement/Efficiency/Risk Management/Compliance
Investments Needed (Resources,
Software, Hardware)
Timeline
FY 2011 FY 2012 FY 2013
Jul Aug Sep Oct Nov Dec Jan Feb Mar Apr May Jun Jul Aug Sep Oct Nov Dec Jan Feb Mar Apr May Jun
Apple Executive Sponsor: Eric Dante
Apple Lead: XXX
Roadmap Element: Organization Development & Training
Initiative Name: Organization development

Thank You

Closing Remarks

Coupa Demo

Back-up Slides

- 81 -
EBRM Technology Landscape
EBRM solutions available are centered primarily around following four key indicators
Risk
– EBRM provides a comprehensive risk assessment framework which captures all kinds of risks
specific to the business, partner, relationship
Performance
– EBRM provides a complete solution to build key performance indicators for both internal as well
as for external stakeholders
Compliance
– EBRM tracks compliance related information and requirements different aspects of corporate
responsibility like safety, health, environment, diversity etc.
Information Management
– EBRM provides a ‘one-stop’ solution with consolidated information collected over a period of
time giving an enterprise-wide visibility
Solutions Providers of EBRM
Users of EBRM
Following companies provide packaged solutions with five
modules aligned with key indicators mentioned.
Hiperos
– provides an on-demand platform with the all the required functions
to track five key indicators of all the partners
Aravo Solutions, Inc.
– provides a complete solution which includes configuration and
implementation of the system, both on-site and remote training
and a global technical support.
- 82 -
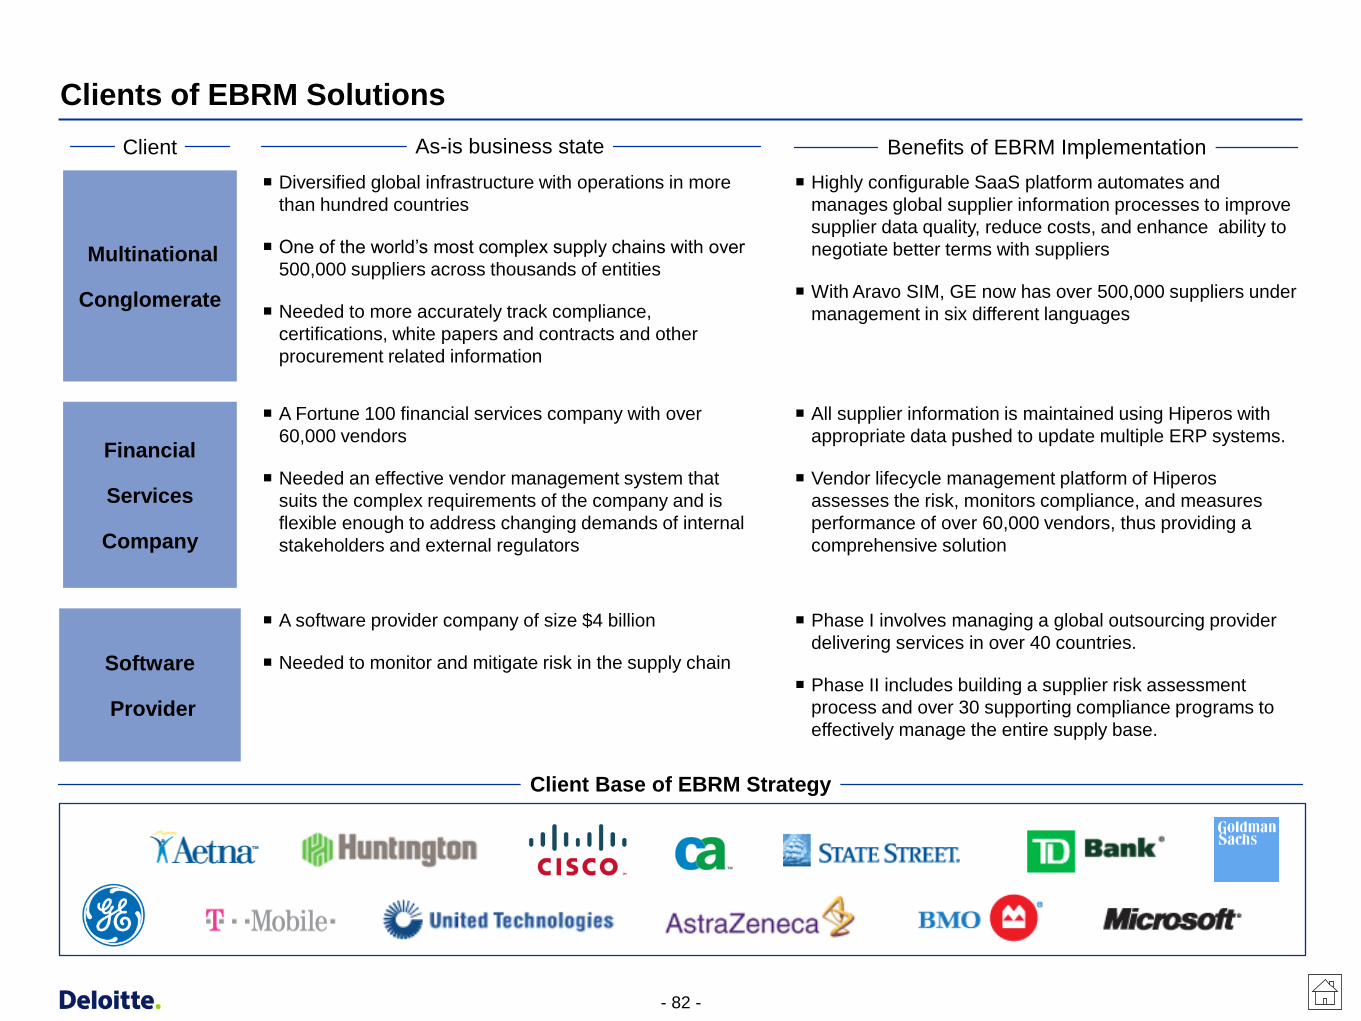
Clients of EBRM Solutions
Diversified global infrastructure with operations in more
than hundred countries
One of the world’s most complex supply chains with over
500,000 suppliers across thousands of entities
Needed to more accurately track compliance,
certifications, white papers and contracts and other
procurement related information
Highly configurable SaaS platform automates and
manages global supplier information processes to improve
supplier data quality, reduce costs, and enhance ability to
negotiate better terms with suppliers
With Aravo SIM, GE now has over 500,000 suppliers under
management in six different languages
A Fortune 100 financial services company with over
60,000 vendors
Needed an effective vendor management system that
suits the complex requirements of the company and is
flexible enough to address changing demands of internal
stakeholders and external regulators
All supplier information is maintained using Hiperos with
appropriate data pushed to update multiple ERP systems.
Vendor lifecycle management platform of Hiperos
assesses the risk, monitors compliance, and measures
performance of over 60,000 vendors, thus providing a
comprehensive solution
A software provider company of size $4 billion
Needed to monitor and mitigate risk in the supply chain
Phase I involves managing a global outsourcing provider
delivering services in over 40 countries.
Phase II includes building a supplier risk assessment
process and over 30 supporting compliance programs to
effectively manage the entire supply base.
Client Base of EBRM Strategy
Multinational
Conglomerate
Financial
Services
Company
Software
Provider
As-is business state Benefits of EBRM Implementation Client

- 83 -
Trend Description Impact
Increased
Regulatory
Complexity
Complexity of local and international regulatory regime: Need to
comply with a multitude of US and international regulatory and
standards (e.g., FDA, NIH, CDC, HHS, WHO, ICH)
Increasing number of laws and regulations: Increasing number of
regulations covering all aspects of the Life Sciences industry. E.g., the
Drug Safety and Accountability act of 2010 gives the FDA broad
authority to mandate recalls and requires improved raw material
tracking
Difficulty tracking increasingly complex
regulatory compliance across supply base
Need for increased visibility into supply chain
Significant cost of non-compliance – potential
recalls and criminal penalties
Growth of Co-
Manufacturing
29% of Life Sciences manufacturing output in 2010 is produced by 3rd
parties vs. 21% in 20071
The average CM Manager manages 10 CMOs (contract manufacturing
organizations) which increases the risk of missed warning signs
Increased risk of supply shortages, quality
issues, and recalls if co-manufacturers are not
effectively managed
Recent trends in the life sciences industry have increased the need to proactively
and effectively manage extended business relationships
Recent Trends in the Life Sciences Industry
1 – Contract Manufacturing in Life Sciences, AMD Research, 2007
Relevant Elements of EBRM
Risk Management
Compliance
Management
Performance
Management
Information
Management
Integrate risk management tools with internal and third party supplier data to monitor supplier financial and
other risk elements
Measure and track supplier performance criteria, including quality, cost and service
Drive compliance to contract terms, including regulatory requirements
Proactively manage supplier and item data to enable more effective risk, performance and compliance
management

- 84 -
Impact Area Impact Magnitude Real World Examples
Recall
Expense
Product recalls cost, on average, more than
$8 Million per incident1
Toyota recall to exceed $2 Billion (2010)
Peanut recall cost producers over $1 Billion (2009)
Share Price Stock price of affected company
underperforms sector index by an average of
2.3 percent2
P&G shares fell share 3% the day they expanded
their pet food recall (8/3/2010)
Within 48 hours of the Renu recall, Bausch & Lomb's
stock price dropped from $57.67 to $45.61
Category Sales 57% of consumers stopped eating foods of a
certain category after a recall3
After the Mattel recalls of 2007, other toy
manufacturers suffered a 25% decrease in sales
from previous years5
Brand Equity Loss of sales of manufacturer’s other brands
can be as high as $2.4MM per recall4
From CNN.com: "Tylenol recalls: big opportunity for
private label rivals“6
279
384 393 396
266 293 255 240
338
565
923
0
100
200
300
400
500
600
700
800
900
1000
1999 2001 2003 2005 2007 2009
Lack of EBRM strategies contribute to the recent increase in recalls that negatively
impact a company’s bottom line, market value, and brand image
Year
Nu
mb
er
of
Re
ca
lls
Number of recalls has increased by 3X
since 2005
Number of Food & Beverage Recalls by Year4
Impact of Product Recalls
Sources: See Appendix for source details
- 85 -
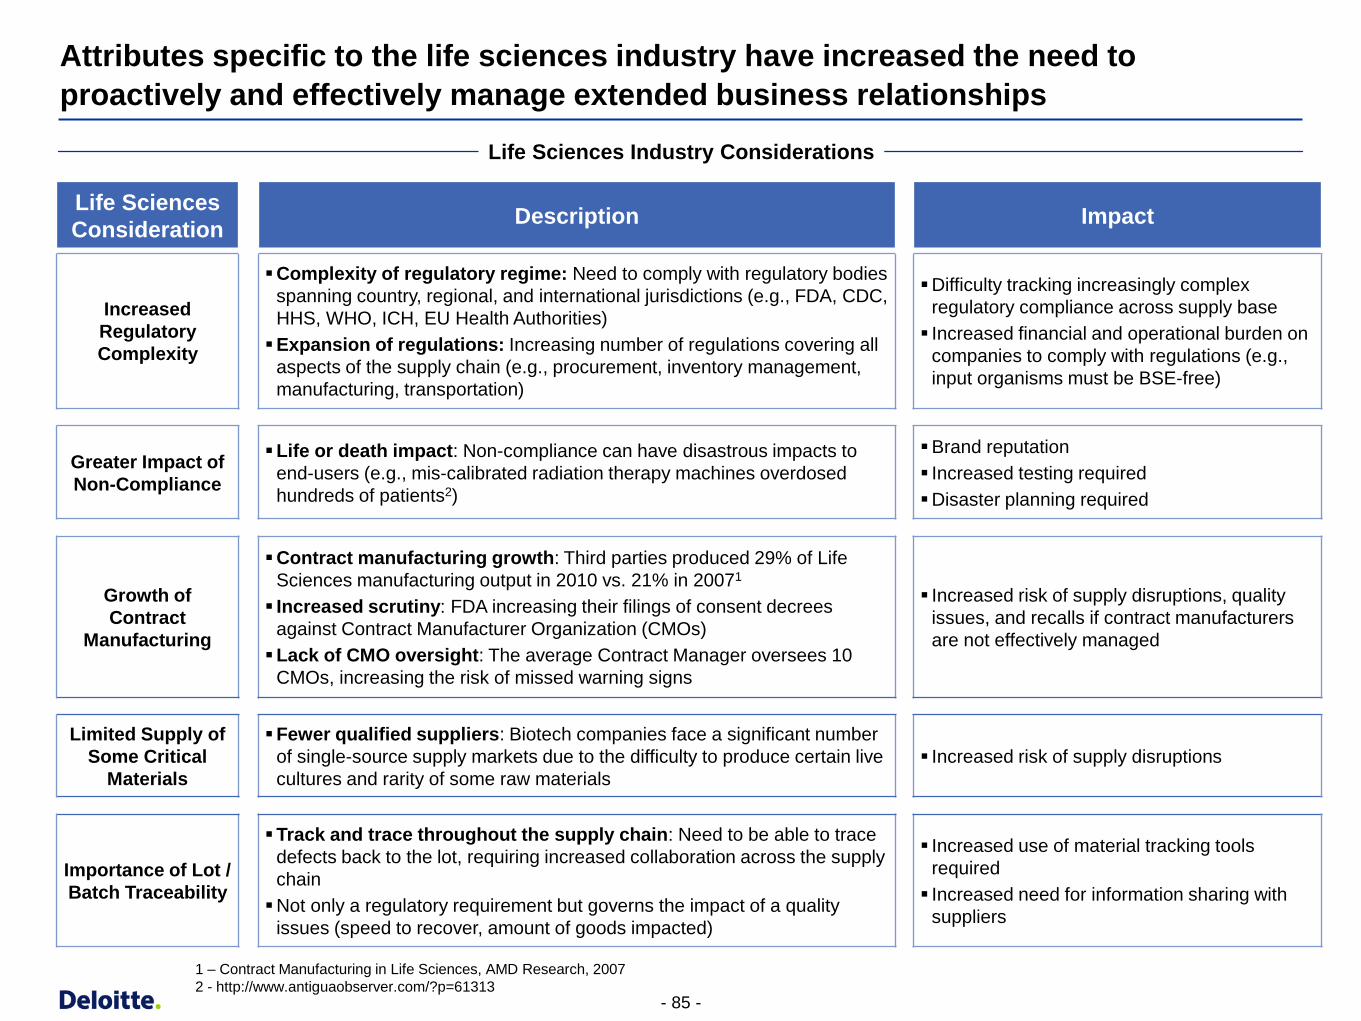
Life Sciences
Consideration Description Impact
Increased
Regulatory
Complexity
Complexity of regulatory regime: Need to comply with regulatory bodies
spanning country, regional, and international jurisdictions (e.g., FDA, CDC,
HHS, WHO, ICH, EU Health Authorities)
Expansion of regulations: Increasing number of regulations covering all
aspects of the supply chain (e.g., procurement, inventory management,
manufacturing, transportation)
Difficulty tracking increasingly complex
regulatory compliance across supply base
Increased financial and operational burden on
companies to comply with regulations (e.g.,
input organisms must be BSE-free)
Greater Impact of
Non-Compliance
Life or death impact: Non-compliance can have disastrous impacts to
end-users (e.g., mis-calibrated radiation therapy machines overdosed
hundreds of patients2)
Brand reputation
Increased testing required
Disaster planning required
Growth of
Contract
Manufacturing
Contract manufacturing growth: Third parties produced 29% of Life
Sciences manufacturing output in 2010 vs. 21% in 20071
Increased scrutiny: FDA increasing their filings of consent decrees
against Contract Manufacturer Organization (CMOs)
Lack of CMO oversight: The average Contract Manager oversees 10
CMOs, increasing the risk of missed warning signs
Increased risk of supply disruptions, quality
issues, and recalls if contract manufacturers
are not effectively managed
Limited Supply of
Some Critical
Materials
Fewer qualified suppliers: Biotech companies face a significant number
of single-source supply markets due to the difficulty to produce certain live
cultures and rarity of some raw materials
Increased risk of supply disruptions
Importance of Lot /
Batch Traceability
Track and trace throughout the supply chain: Need to be able to trace
defects back to the lot, requiring increased collaboration across the supply
chain
Not only a regulatory requirement but governs the impact of a quality
issues (speed to recover, amount of goods impacted)
Increased use of material tracking tools
required
Increased need for information sharing with
suppliers
Attributes specific to the life sciences industry have increased the need to
proactively and effectively manage extended business relationships
Life Sciences Industry Considerations
1 – Contract Manufacturing in Life Sciences, AMD Research, 2007
2 - http://www.antiguaobserver.com/?p=61313

- 86 -
Financial
Services
Consideration
Description Impact
Increased
Regulatory
Pressure
Increased regulatory pressure from the Office of the Comptroller of
the Currency (OCC): The OCC has increased their rate of enforcement
actions since the baking melt down of 2008 causing many banks and
financial services company to scramble to meet EBRM related
requirements
Banking-Related Regulations from Other Federal Agencies: As a
response to financial crisis in 2008, Federal Reserve System increased
reserve requirements for the banks
Other Laws and Regulations: Secure and Fair Enforcement for
Mortgage Licensing Act of 2008 (S.A.F.E. Act) Implementation
Risk of non-compliance to tighter regulatory
and legal requirements in future
Need to precociously identify any potential
compliance related issues of all the business
partners
Need to update on a regular basis the existing
performance metrics used to track the
performance of suppliers and other business
partners for them to be consistent with most
recent regulations
Increase in M&A
Activity
Banking sector is witnessing consolidation among small- to mid-size asset
management firms, FDIC assisted M&A deals.
Decreased revenue sources on account of low interest rates and slow
loan growth coupled with higher legal and compliance costs will continue
to provide impetus for M&A activities in banking sector. 1
Risk of failure to successfully integrate
processes, information systems as well as
internal stakeholders of two entities
Need to have a unified risk management
framework in place for the combined entity
Increase in Bank
Failures
Bank failures in the US have increased significantly from meager 3 in
2007 to 146 in 2010. 2
FDIC fund which reimburses customers in case of a bank default
witnessed a deficit of $15.2 billion in June 2010.
Need to monitor and mitigate credit risk the
bank is exposed to on account of increased
instances of loan default
Increase in
Outsourcing
US banks have been increasingly outsourcing middle-level executive jobs
for key functions like accounts maintenance, risk management.
It is estimated that US banks will outsource back-office activities totaling
$67.2 bn in 2015 with annual market growth of 7.6% from 2010 to 2015. 3
Need to have advanced data privacy and
information security measures in place as the
back-end operations go truly global
Attributes specific to the financial services industry have increased the need to
proactively and effectively manage extended business relationships
Financial Services Industry Considerations
1 – http://www.sourcingline.com/resources/us-banks-outsourcing-middle-level-jobs-to-economize-operations
2 – http://www.reuters.com/article/2011/03/30/us-ubs-deals-idUSTRE72T2GN20110330
3 – http://www.marketwatch.com/story/bank-failures-surge-credit-crunch
- 87 -
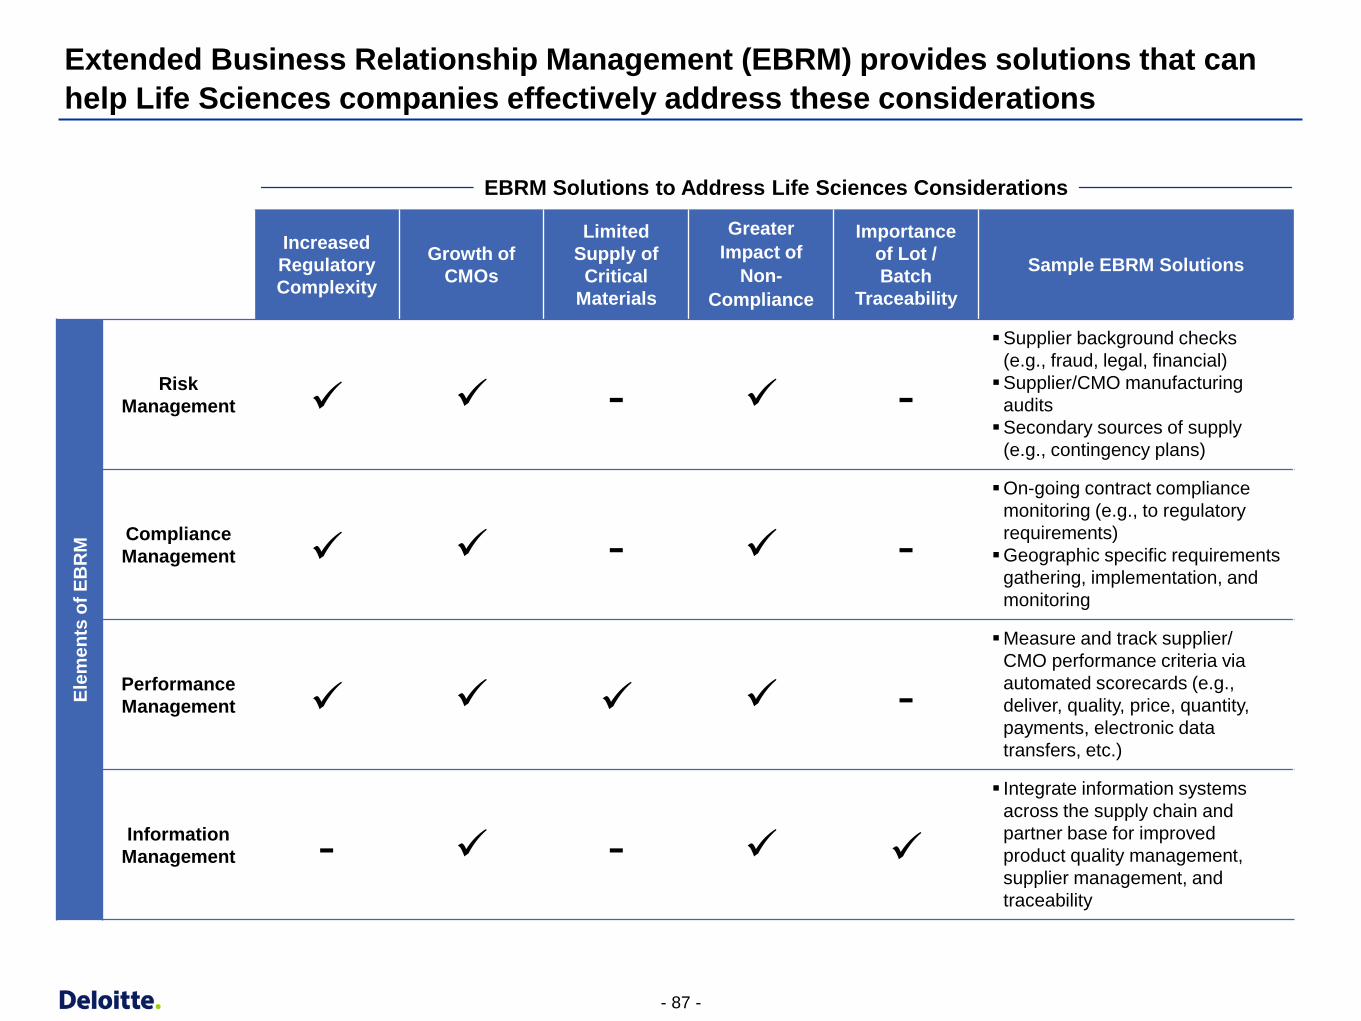
Increased
Regulatory
Complexity
Growth of
CMOs
Limited
Supply of
Critical
Materials
Greater
Impact of
Non-
Compliance
Importance
of Lot /
Batch
Traceability
Sample EBRM Solutions
Ele
me
nts
of
EB
RM
Risk
Management - -
Supplier background checks
(e.g., fraud, legal, financial)
Supplier/CMO manufacturing
audits
Secondary sources of supply
(e.g., contingency plans)
Compliance
Management - -
On-going contract compliance
monitoring (e.g., to regulatory
requirements)
Geographic specific requirements
gathering, implementation, and
monitoring
Performance
Management -
Measure and track supplier/
CMO performance criteria via
automated scorecards (e.g.,
deliver, quality, price, quantity,
payments, electronic data
transfers, etc.)
Information
Management - -
Integrate information systems
across the supply chain and
partner base for improved
product quality management,
supplier management, and
traceability
Extended Business Relationship Management (EBRM) provides solutions that can
help Life Sciences companies effectively address these considerations
EBRM Solutions to Address Life Sciences Considerations
- 88 -
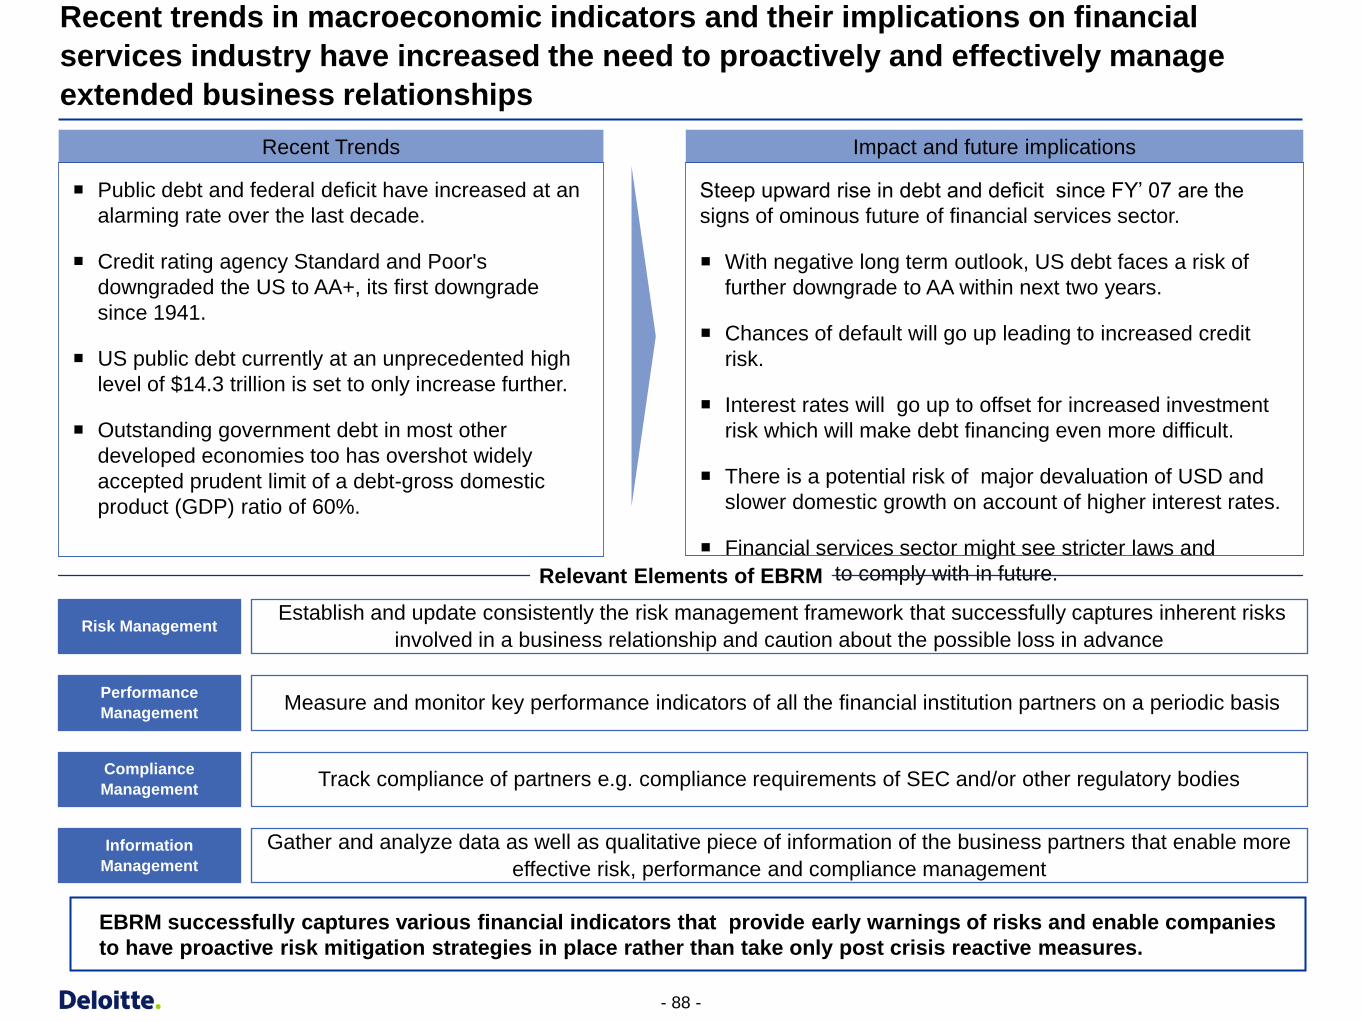
Recent trends in macroeconomic indicators and their implications on financial
services industry have increased the need to proactively and effectively manage
extended business relationships
Recent Trends
Public debt and federal deficit have increased at an
alarming rate over the last decade.
Credit rating agency Standard and Poor's
downgraded the US to AA+, its first downgrade
since 1941.
US public debt currently at an unprecedented high
level of $14.3 trillion is set to only increase further.
Outstanding government debt in most other
developed economies too has overshot widely
accepted prudent limit of a debt-gross domestic
product (GDP) ratio of 60%.
Impact and future implications
Steep upward rise in debt and deficit since FY’ 07 are the
signs of ominous future of financial services sector.
With negative long term outlook, US debt faces a risk of
further downgrade to AA within next two years.
Chances of default will go up leading to increased credit
risk.
Interest rates will go up to offset for increased investment
risk which will make debt financing even more difficult.
There is a potential risk of major devaluation of USD and
slower domestic growth on account of higher interest rates.
Financial services sector might see stricter laws and
regulations to comply with in future.
EBRM successfully captures various financial indicators that provide early warnings of risks and enable companies
to have proactive risk mitigation strategies in place rather than take only post crisis reactive measures.
Relevant Elements of EBRM
Risk Management
Compliance
Management
Performance
Management
Information
Management
Establish and update consistently the risk management framework that successfully captures inherent risks
involved in a business relationship and caution about the possible loss in advance
Measure and monitor key performance indicators of all the financial institution partners on a periodic basis
Track compliance of partners e.g. compliance requirements of SEC and/or other regulatory bodies
Gather and analyze data as well as qualitative piece of information of the business partners that enable more
effective risk, performance and compliance management
- 89 -
Sources
1. http://www.reliableplant.com/Read/25897/Outsourcing-failure-tough-times
2. http://www.businessweek.com/autos/autobeat/archives/2009/09/toyota_recalls.html
3. http://www.joc.com/logistics-economy/sony-idles-japan-plants-may-shift-production
4. http://articles.boston.com/2011-06-07/bostonworks/29630335_1_child-labor-labor-cases-minors
5. http://hbr.org/product/ikea-s-global-sourcing-challenge-indian-rugs-and-c/an/906414-PDF-ENG
6. http://www.wikinvest.com/stock/Toyota_Motor_(TM)
7. http://www.businessinsider.com/oil-supply-disruptions-2011-4
8. http://www.theregister.co.uk/2001/12/05/dutch_officials_seize_cadmiumpacked_playstation/
9. http://www.siteselectiongroup.com/_blog/Site_Selection_Group/calendar/2011/3/
https://kx.deloitteresources.com/G1000/Lists/Qualification/DispForm.aspx?ID=3736
https://kx.deloitteresources.com/G1000/Lists/Qualification/DispForm.aspx?ID=30207
https://kx.deloitteresources.com/G1000/Lists/Qualification/DispForm.aspx?ID=25943
http://epaper.livemint.com/ArticleText.aspx?article=08_08_2011_001_011&mode=1#
http://www.usgovernmentdebt.us/us_deficit
Slide # 22:
http://www.marketwatch.com/story/bank-failures-surge-credit-crunch
http://www.sourcingline.com/resources/us-banks-outsourcing-middle-level-jobs-to-economize-
operations
http://www.reuters.com/article/2011/03/30/us-ubs-deals-idUSTRE72T2GN20110330