development of a laser-based water level sensor for fine-scale ecohydrological measurements
TRANSCRIPT

Engineering School of Sustainable Infrastructure and Environment
Development of a Laser-Based Water Level Sensor for Fine-Scale Ecohydrological MeasurementsJoshua Benjamin, Dr. David Kaplan
November 14th, 2017

Engineering School of Sustainable Infrastructure and Environment
http://water.usgs.gov/edu/graphics/evapotranspiration.gif
Evapotranspiration (ET) is a
critical component of the global
water balance
ET accounts for 70-95% of
incoming precipitation in
Florida1
ET is difficult to pinpoint due to
a lack of accurate and
affordable sensor technology
Different types of
measurement techniques http://water.usgs.gov/edu/graphics/wctranspirationwatertable.gif
Background

Engineering School of Sustainable Infrastructure and Environment
White Method6
Developed by Walter White in 1932
Sy = Specific Yield
∆𝑠 = is the daily change in storage
R = net inflow/outflow rate [L/T]
Major assumptions6:
Diurnal water table fluctuations are a
product of plant water use
Groundwater consumption negligible
b/w midnight and 5 AM
Constant inflow/outflow rate
Specific yield is constant over time
𝐸𝑇 = 𝑆𝑦 ×∆𝑠
𝑡+ 𝑅

Engineering School of Sustainable Infrastructure and Environment
Current Technology Onset HOBO U20L Water Level Data
Logger
Accuracy = 0.4 cm
Precision/Resolution = 0.14 cm
Cost = $300.00
Subject to errors (>1cm) from2:
Moisture accumulation
Differential heating across the system
Errors based on3:
Installation location and media
Differences in atmospheric and water
temperature
Variations in solar radiation
Long equilibrium times
𝑝 = 𝜌𝑔ℎ
http://www.onsetcomp.com/files/styles/image_widget_large/public/product-images/HOBO-Water-Level-Logger-
U20L-01-apart_1.jpg?itok=KNSuKT0i

Engineering School of Sustainable Infrastructure and Environment
New Technology
http://www.solinst.com/products/data/images/Levelogger-Edge-Barologger-Edge.jpg
Leica DISTO E7100i4
Accuracy = ±0.15 cm
Resolution = 0.01 cm
IP54 Certified
Costs $150.00
Measurement Principle:
The Phase-Shift Method
c = the speed of light [L/T]
f = the modulation frequency
[1/T]
Δφ is the phase shift between the
measurement signal and the
reference signal [L]
𝐷 =𝑐
2𝑓∙∆𝜑
2𝜋

Engineering School of Sustainable Infrastructure and Environment
Phase-Shift vs Time-of-Flight Time of Flight Method
c = the speed of light [L/T]
T = time [L]
More for long range distance
measurements
Light is fast (300,000,000 m/s)
Phase-shift Method
f = the modulation frequency [1/T]
Δφ is the phase shift between the
measurement signal and the reference
signal [L]
Process signals w/ heterodyne method
mm-range resolution of 0.0015 to 60.96 m
with non-cooperative targets
𝐷 =𝑐
2𝑓∙∆𝜑
2𝜋
https://upload.wikimedia.org/wikipedia/commons/4/40/Earth%27s_Moon_from_NOAA.jpg
𝐷 =𝑐𝑡
2

Engineering School of Sustainable Infrastructure and Environment
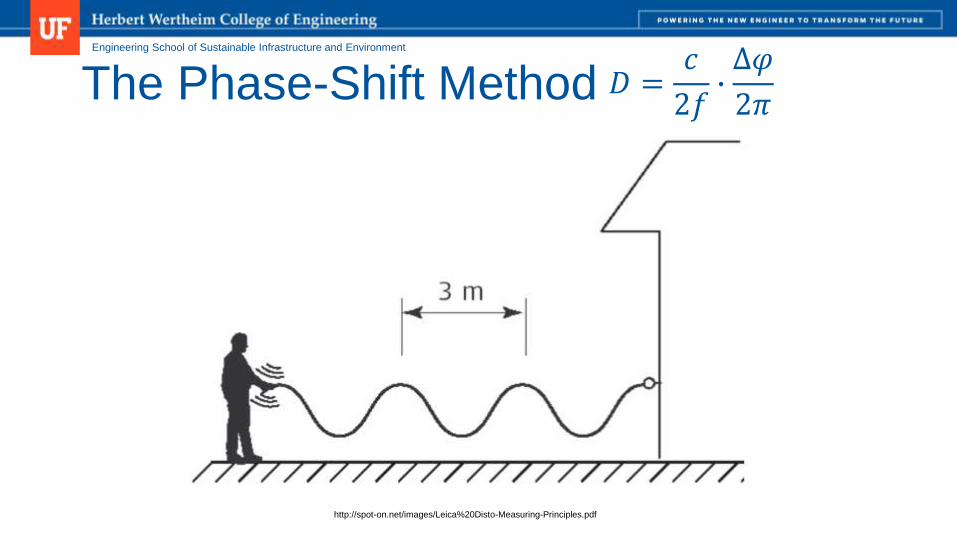
The Phase-Shift Method
http://spot-on.net/images/Leica%20Disto-Measuring-Principles.pdf
𝐷 =𝑐
2𝑓∙∆𝜑
2𝜋

Engineering School of Sustainable Infrastructure and Environment
The Phase-Shift Method
http://spot-on.net/images/Leica%20Disto-Measuring-Principles.pdf
𝐷 =𝑐
2𝑓∙∆𝜑
2𝜋
Engineering School of Sustainable Infrastructure and Environment
The Phase-Shift Method
http://spot-on.net/images/Leica%20Disto-Measuring-Principles.pdf
𝐷 =𝑐
2𝑓∙∆𝜑
2𝜋

Engineering School of Sustainable Infrastructure and Environment
The Phase-Shift Method
http://spot-on.net/images/Leica%20Disto-Measuring-Principles.pdf
𝐷 =𝑐
2𝑓∙∆𝜑
2𝜋

Engineering School of Sustainable Infrastructure and Environment
Sensor Components
http://lasers.leica-
geosystems.com/sites/default/files/product_images/e7100i_left
_top.jpg_c636653a1m.jpg
Leica DISTO E7100i5
Floating Target Platform
Next Thing Co. C.H.I.P.
http://images.bit-tech.net/content_images/2016/10/next-thing-co-
chip-and-pocketchip-review/chip-2b.jpg

Engineering School of Sustainable Infrastructure and Environment
Laser Mods Modified Laser to be USB
powered
Convert 5V to 3V – USB to
AAA
Started out with a custom
board

Engineering School of Sustainable Infrastructure and Environment
Laser Mod – Buck
Converter
Modified Laser to be USB
powered
Converts 5V to 3V – USB to
AAA
Started out with a custom
board, transitioned to a Buck
converter mounted in a
custom casing inside of the
Disto battery casing

Engineering School of Sustainable Infrastructure and Environment
https://upload.wikimedia.org/wikipedia/commons/thumb/0/0a/Python.svg/2000px-Python.svg.pnghttps://upload.wikimedia.org/wikipedia/commons/thumb/9/9f/Bluetooth-Logo.svg/1280px-Bluetooth-Logo.svg.png
Written in Python
Interfaces between the computer
and the laser
Has custom start and end time
configurations
Exports data in a .txt format
https://eltechs.com/wp-content/uploads/2013/03/eltechs-sq-512-300x300.png
Laser.py

Engineering School of Sustainable Infrastructure and Environment
𝐹𝑏 = 𝛾𝑓𝑙𝑢𝑖𝑑∀𝑏𝑜𝑑𝑦Floating Target
Platform

Engineering School of Sustainable Infrastructure and Environment
Floating
Target
Platform𝐹𝑏 = 𝛾𝑓𝑙𝑢𝑖𝑑∀𝑏𝑜𝑑𝑦
Left is MK-IV
Right is MK-V

Engineering School of Sustainable Infrastructure and Environment
RSE Calculation 𝑅𝑆𝐸 = 𝑦2

Engineering School of Sustainable Infrastructure and Environment
Results – Early Lab Trial Residual
Noise:
(Abs) (in mm)
TPT-BPT
Avg : 2.698
mm
LB-WLS
Avg: 0.083
mm
LB-WLS 32.5x
LESS
residual
noise

Engineering School of Sustainable Infrastructure and Environment
Results – Later Lab Trial Residual
Noise:
(Abs) (in mm)
TPT-BPT
Avg : 2.303
mm
LB-WLS
Avg: 0.163
mm
LB-WLS 14.1x
LESS
residual
noise

Engineering School of Sustainable Infrastructure and Environment
Longleaf
Flatwoods
Preserve Owned by the St.
John’s Water
Management District
2850 acres
Study site is Mesic
Flatwoods w/ Pomona
soil5 – sandy clay loam,
established in 20036
http://www.worldatlas.com/img/locator/city/039/20039-gainesville-locator-map.jpg

Engineering School of Sustainable Infrastructure and Environment
Results – July Trial
Almost 60 cm difference Laser shifted in
casing

Engineering School of Sustainable Infrastructure and Environment
Well Case Redesign

Engineering School of Sustainable Infrastructure and Environment
December
Experimental
Setup1. Leica DISTO E7100i4
Located inside of front well cap
2. Floating Target Platform
Inside Back well
3. Next Thing Co. C.H.I.P.
Located inside of gray box
4. AGM Car Battery
Inside of Black Box
5. Onset HOBO Logger
Located Inside back well
1
3
2
4
5

Engineering School of Sustainable Infrastructure and Environment
Results – December Trial

Engineering School of Sustainable Infrastructure and Environment
Results – December Trial

Engineering School of Sustainable Infrastructure and Environment
Results – December Trial

Engineering School of Sustainable Infrastructure and Environment
December Trial
Root Square Error
𝑅𝑆𝐸 = 𝑦2
LB-WLS Average = 0.05±0.04 cm/day
HOBO Logger Average = 0.19±0.16
cm/day

Engineering School of Sustainable Infrastructure and Environment
ET GraphLB-WLS Average = 0.19±0.06 cm/day
HOBO Logger Average = 0.23±0.10 cm/day
PET Average = 0.14±0.02 cm/day
Engineering School of Sustainable Infrastructure and Environment
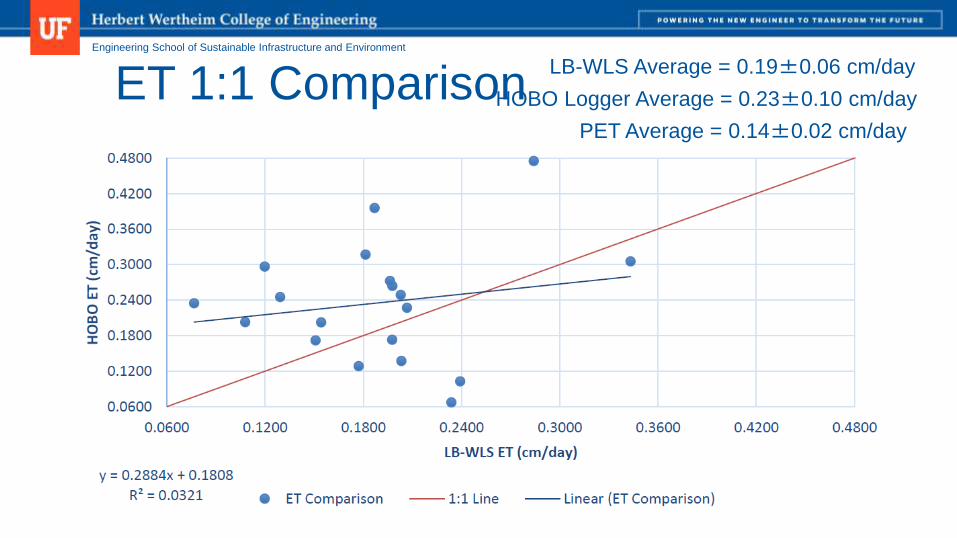
ET 1:1 ComparisonLB-WLS Average = 0.19±0.06 cm/day
HOBO Logger Average = 0.23±0.10 cm/day
PET Average = 0.14±0.02 cm/day

Engineering School of Sustainable Infrastructure and Environment
ET:PET RatiosLB-WLS Average = 1.43±0.52
HOBO Logger Average = 1.80±0.82

Engineering School of Sustainable Infrastructure and Environment
Power Analysis
LB-WLS Component Power Consumption
DeviceMinimum
(Watt)
Maximum
(Watt)
Disto E7100i 0.10 0.35
Raspberry Pi
2B 1.25 1.40
NTC CHIP 2.75 3.25
Note: Each device operates under 5V. Note that
while the CHIP uses more power than the Pi 2B,
this is with an attached touchscreen and
keyboard, which allows for easier data entry and
retrieval in the field.
𝑡 = 𝐻𝐶
𝐼𝐻
𝑘 t is time [hr]
H is rated discharge time [hr]
C is capacity [Amp*hr]
I is the actual current [Amp]
k is the Peukert constant,
which is 1.1 for an AGM
battery.

Engineering School of Sustainable Infrastructure and Environment
Power Analysis 𝑡 = 𝐻𝐶
𝐼𝐻
𝑘
LB-WLS Component Power Consumption relative to the central buck converter
Parameter Maximum Load Minimum Load With LoPya
Current (out) [Amp]0.72 0.62
0.17
Power (out) [W] 3.60 3.10 0.85
Current (in) [Amp]0.40 0.34
0.09
Power (in) [W] 4.77 4.10 1.13
Est. Run Time [hr]301 355
1473
Est Run Time
[days]12.5 14.8 61.4
Note: These values assume that the efficiency (η) of the buck converter is 76%, Vout is 5V, Vin is 12V,
and that Pin*η = Pout, with P=VI, where P is power (W), V is Voltage (V), and I is current (Amp).
aLoPy measurements are potential values based on lab-scale readings and have not yet been
experimentally verified.

Engineering School of Sustainable Infrastructure and Environment
Power Analysis𝐼𝐹 𝐸𝑛−1 − 𝐿 + 𝐶 ∗ 𝑆 > 𝐸𝑜
𝑇𝐻𝐸𝑁 𝐸𝑛 = 𝐸0𝐸𝐿𝑆𝐸 𝐸𝑛 = 𝐸𝑛−1 − 𝐿 + 𝐶 ∗ 𝑆
E0 = the Initial capacity of the battery
(W*hr)
En-1 = the capacity in the previous
step
En = the capacity in the calculated
step
L = the load (W*hr)
C = a conditional statement, that is
equal to 1 during peak sun and 0
when it is not peak sun
S = the solar cell energy generated
per hour (W*hr).

Engineering School of Sustainable Infrastructure and Environment
Error Analysis
February Incorrect
Installation
Dry well trial
May 2017
Periodic noise during
the daytime

Engineering School of Sustainable Infrastructure and Environment
Error Analysis
Noise consistent across all
dry trials
Possible Causes:
Temperature causes
variation in air’s refractive
index9
Optical Interference
Overall does not affect
measurement accuracy
Important measurements
during the night

Engineering School of Sustainable Infrastructure and Environment
Future Work Transition to a lower-power
computer
Reduce daytime
measurement error
Connect to solar charging
system for continuous
usage
Implement remote access
through LoRa

Engineering School of Sustainable Infrastructure and Environment
UF Watershed
Ecology Group
People :
John Loeffler – 3D
Printing
Jackson Benfer -
Programming
Kevin Henson –
Field Work
Acknowledgements

Engineering School of Sustainable Infrastructure and Environment
Thank you!Questions?

Engineering School of Sustainable Infrastructure and Environment
References1. McLaughlin, D., & Cohen, M. (2013). Realizing ecosystem services: wetland hydrologic function along a
gradient of ecosystem condition. Ecological Applications, 23(7), 1619–1631. doi:10.1890/12-1489.1
2. McLaughlin, D., and Cohen, M. (2011). “Thermal artifacts in measurements of fine‐scale water level
variation.” Water Resources Research, 47(9), n/a–n/a.
3. Cain III, S. F., Davis, G. A., Loheide II, S. P., and Butler Jr., J. R. (2004). “Noise in Pressure Transducer
Readings Produced by Variations in Solar Radiation.” Groundwater, Groundwater, 42(6), 939–944.
4. Leica Geosystems. (2016). “Leica DISTO E7100i.”
5. SJWMD, 2009. Longleaf Flatwoods Reserve Land Management Plan. St Johns Water Management District.
6. White, WN, 1932. A Method of Estimating Ground-Water Supplies Based on Discharge by Plants and
Evaporation from Soil: Results of Investigations in Escalante Valley, Utah.
7. Loheide, S., J. Butler, and S. Gorelick, 2005. Estimation of Groundwater Consumption by Phreatophytes
Using Diurnal Water Table Fluctuations: A Saturated‐unsaturated Flow Assessment. Water Resources
Research 41:n/a–n/a.
8. McLaughlin, D., D. Kaplan, and M. Cohen, 2013. Managing Forests for Increased Regional Water Yield in
the Southeastern U.S. Coastal Plain. JAWRA Journal of the American Water Resources Association
9. Shim, Y., O.-J. Kwon, H.-Y. Choi, and Y.-G. Han, 2015. Influence of Diverse Atmospheric Conditions on
Optical Properties of a Pulse Laser in a Time-of-Flight Laser Range Finder. Journal of the Optical Society of
Korea 19:1–6.

Engineering School of Sustainable Infrastructure and Environment
Current Technology
http://www.solinst.com/products/data/images/Levelogger-Edge-Barologger-Edge.jpg
Solinst Levelogger®-Barologger®
Combo
Subject to errors (>1cm) from2:
Moisture accumulation
Differential heating across the system
Errors based on3:
Installation location and media
Differences in atmospheric and water
temperature
Variations in solar radiation
Long equilibration times
𝑝 = 𝜌𝑔ℎ
Levelogger®
Accuracy = 0.3 cm
Precision/Resolutio
n = 0.05 cm
Barologger ®
Accuracy = 0.1 cm
Resolution = 0.03
cm

Engineering School of Sustainable Infrastructure and Environment
SPECIFIC YIELD7𝑆𝑦𝑑−𝑐𝑜𝑚𝑝
𝑑 = 𝜃𝑠 − 𝜃𝑅 +𝜃𝑠 − 𝜃𝑅
1 + 𝛼 𝑑 𝑛 𝑚
Sy = specific yield
θs = the water content at
saturation
θR = the residual water content
d = the depth to the water table
[L]
α = van Genuchten coefficient
[1/L].
N = van Genuchten coefficient
m = van Genuchten coefficient

Engineering School of Sustainable Infrastructure and Environment
Specific yield effect

Engineering School of Sustainable Infrastructure and Environment
Residual Noise (in mm)
Laser Based Water Level SensorTotal Pressure Transducer-Barometric
Pressure Transducer
Trial #Minimum
(abs)
Maximum
(abs)Mean (abs)
Minimum
(abs)
Maximum
(abs)Mean (abs)
1 0.002 0.279 0.099 0.085 9.153 2.865
2 0.001 0.234 0.067 0.070 6.287 2.532
3 0.005 0.666 0.163 0.184 7.519 2.303
Mean (#1-2)0.001 0.256 0.083 0.077 7.720 2.698
Mean (All) 0.003 0.393 0.110 0.113 7.653 2.566Note. All values are absolute. Trial 3 data is treated separately due to the difference in
experimental conditions.
Lab Trials Overall

Engineering School of Sustainable Infrastructure and Environment
Buffered TPT had lower overall temperature difference
Lab Trials Temperature
Trends
Engineering School of Sustainable Infrastructure and Environment
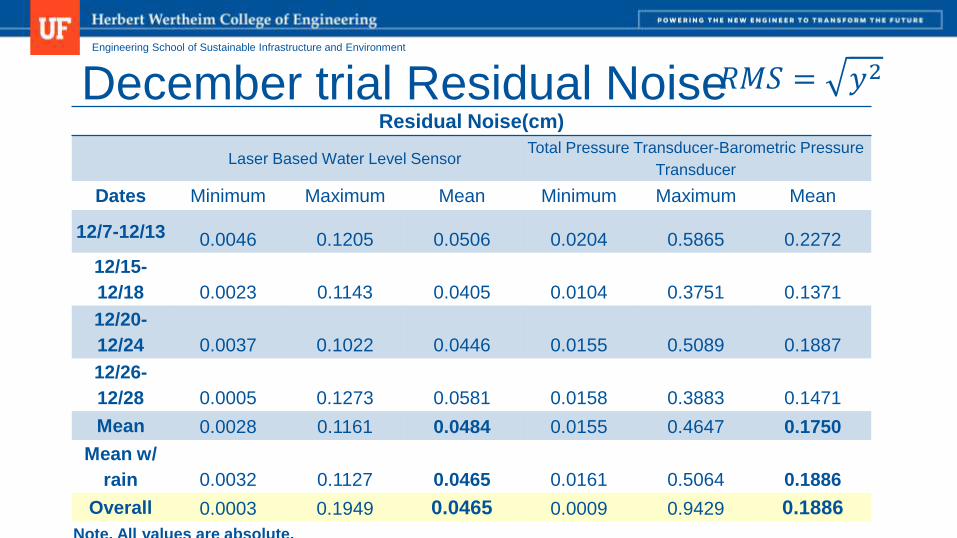
December trial Residual Noise𝑅𝑀𝑆 = 𝑦2
Residual Noise(cm)
Laser Based Water Level SensorTotal Pressure Transducer-Barometric Pressure
Transducer
Dates Minimum Maximum Mean Minimum Maximum Mean
12/7-12/13 0.0046 0.1205 0.0506 0.0204 0.5865 0.2272
12/15-
12/18 0.0023 0.1143 0.0405 0.0104 0.3751 0.1371
12/20-
12/24 0.0037 0.1022 0.0446 0.0155 0.5089 0.1887
12/26-
12/28 0.0005 0.1273 0.0581 0.0158 0.3883 0.1471
Mean 0.0028 0.1161 0.0484 0.0155 0.4647 0.1750
Mean w/
rain 0.0032 0.1127 0.0465 0.0161 0.5064 0.1886
Overall 0.0003 0.1949 0.0465 0.0009 0.9429 0.1886
Note. All values are absolute.