diagnostic test accuracy of a 2-transcript host rna ... · padilla, eugenia villanueva martínez,...
TRANSCRIPT
Supplementary Online Content Herberg JA, Kaforou M, Wright VJ, et al; IRIS Consortium. Diagnostic accuracy of a 2-transcript host RNA signature for discriminating bacterial vs viral infection in febrile children. JAMA. doi: 10.1001/jama.2016.11236. eAppendix. Members of the Study Consortium
eMethods
eStatistical Methods
eFigure 1. Principal Components Analysis of the Samples in the Discovery Set
eFigure 2. Heatmaps Showing Clustering of the Training and Test Datasets Based on
the Bacterial vs. Viral 38-Transcript Signature
eFigure 3. Elastic Net Prediction Value and Receiver Operator Characteristic Curves
Based on the 38-Transcript Signature Applied to the Definite Bacterial and Viral
Groups
eFigure 4. Disease Risk Scores and Receiver Operator Characteristic Curves Based
on the 2-Transcript Signature Applied to Training Set
eFigure 5. STARD Flow Diagrams and Assessment of Diagnostic Test Accuracy
eFigure 6. Principal Component Analysis of Meningococcal and IRIS Validation
Samples After Merging With Combat
eFigure 7. Disease Risk Scores and Receiver Operator Characteristic Curves Based
on the 2-Transcript Signature Applied to Children With Gram-Negative And Gram-
Positive Infection
eFigure 8. Disease Risk Scores and Receiver Operator Characteristic Curves Based
on the 2-Transcript Signature Applied to Additional Validation Datasets
eFigure 9. Performance of the Disease Risk Score in Relation to Severity of Illness in
the IRIS Validation Set
eFigure 10. Performance of the Disease Risk Score in Relation to Day of Illness in
the IRIS Validation Set
eTable 1. Demographic and Clinical Features of the Validation Groups
eTable 2. Viral and Bacterial Causative Pathogens in Patients in the Definite Bacterial
and Viral Groups in the Discovery and IRIS Validation Cohorts
eTable 3. 38-Transcript Signature for Distinguishing Bacterial From Viral Infection
eTable 4. Diagnostic Performance of the Bacterial vs. Viral 38-Transcript Elastic Net
and Disease Risk Score 2-Transcript Signatures in the Training, Test and IRIS
Validation Datasets
eTable 5. Gene Ontology (GO) Biological Process Terms Analysis
eTable 6. Additional Validation and External Microarray Datasets
© 2016 American Medical Association. All rights reserved.
Downloaded From: on 09/27/2018

eTable 7. Performance of Clinical Features in Relation to Disease Risk Score in
Patients With Indeterminate Infection Status (Combined Probable Bacterial,
Unknown, and Probable Viral Groups)
eReferences
This supplementary material has been provided by the authors to give readers
additional information about their work.
© 2016 American Medical Association. All rights reserved.
Downloaded From: on 09/27/2018

eAppendix. Members of the Study Consortium IRIS Consortium members Imperial College London (UK) Michael J Carter, Lachlan JM Coin, Hariklia Eleftherohorinou, Erin Fitzgerald, Stuart Gormley, Jethro A Herberg, Martin L Hibberd, Clive Hoggart, David Inwald, Victoria A Janes, Kelsey DJ Jones, Myrsini Kaforou, Sobia Mustafa, Simon Nadel, Stéphane Paulus, Nazima Pathan, Joanna Reid, Hannah Shailes, Victoria J Wright, Michael Levin. Southampton (UK) Saul Faust, Jenni McCorkill, Sanjay Patel. Oxford (UK) Andrew J Pollard, Louise Willis, Zoe Young. Micropathology Ltd (UK) Colin Fink, Ed Sumner. University of California San Diego (UCSD) and Rady Children’s Hospital, La Jolla, California (USA) John T. Kanegaye, Chisato Shimizu, Adriana Tremoulet, Jane Burns. Hospital Clínico Universitario de Santiago (Spain) Miriam Cebey Lopez, Antonio Salas, Antonio Justicia Grande, Irene Rivero, Alberto Gómez Carballa, Jacobo Pardo Seco, José María Martinón Sánchez, Lorenzo Redondo Collazo, Carmen Rodríguez-Tenreiro, Lucia Vilanova Trillo, Federico Martinón Torres. Academic Medical Centre (AMC) Amsterdam (Netherlands) Anouk M Barendregt, Merlijn van den Berg, Taco Kuijpers and Dieneke Schonenberg. London School of Hygiene and Tropical Medicine, London (UK) Martin L Hibberd. Newcastle upon Tyne Foundation Trust Hospitals and Newcastle University, Newcastle upon Tyne (UK) Marieke Emonts. Linked to IRIS consortium as GENDRES consortium member Enrique Bernaola Iturbe, Laura Moreno Galarraga, Jorge Álvarez (Hospital Materno Infantil Virgen del Camino, Pamplona); Teresa González López, Delfina Suarez Vázquez, Ángela Vázquez Vázquez, Susana Rey García (Complejo Hospitalario Universitario de Orense), Francisco Giménez Sánchez, Miguel Sánchez Forte (Hospital Torrecárdenas, Almería); Cristina Calvo Rey, María Luz García García (Hospital Severo Ochoa de Madrid); Ignacio Oulego Erroz, David Naranjo Vivas, Santiago Lapeña, Paula Alonso Quintela, Jorge Martínez Sáenz de Jubera, Estibaliz Garrido García (Hospital de León); Cristina Calvo Monge, Eider Oñate Vergara (Hospital de Donostia, San Sebastián); Jesús de la Cruz Moreno, Mª Carmen Martínez Padilla, Eugenia Villanueva Martínez, Ana González Espín (Complejo Hospitalario de Jaén); Manuel Baca Cots (Hospital Quirón, Málaga), David Moreno Pérez, Ana Cordón Martínez, Antonio Urda Cardona, José Miguel Ramos Fernández, Esmeralda Núñez Cuadros (Hospital Carlos Haya, Málaga); Susana Beatriz Reyes, María Cruz León León (Hospital Virgen de la Arrixaca, Murcia).
© 2016 American Medical Association. All rights reserved.
Downloaded From: on 09/27/2018

eMethods
Patient recruitment IRIS Discovery and IRIS Validation groups Children were classified as Definite Bacterial if they had a clinical syndrome consistent with SBI (sepsis with shock or severe focal infection), and if pathogenic bacteria were detected at a usually sterile site (such as blood or CSF, excluding surface swabs, endotracheal secretions, or broncho-alveolar lavage samples); patients without sterile-site bacteria but with the other features listed above were categorized as Probable Bacterial. Children were classified as Definite Viral if they had a viral clinical syndrome, displayed no bacterial features, and matching virus was identified; patients without detected viruses but with clinical features of viral infection were classified as Probable Viral. In the absence of sterile site bacteria, children with inconclusive clinical features were classified as Unknown Bacterial or Viral. We used a C-Reactive Protein (CRP) cut-off of above 60 mg/L for inclusion into the Probable Bacterial group, or exclusion from the Probable and Definite Viral groups; otherwise patients were categorized as Unknown. Inclusion in the Definite Bacterial group was irrespective of CRP. The indeterminate infection patients not selected for array were those with the most missing clinical data (Fig. 1B). Healthy controls In order to compare expression of identified biomarker genes with the healthy state and understand the direction of expression (up- or down-regulation), healthy children without intercurrent infection or recent immunization were recruited from the outpatient phlebotomy department (n=52). Data from healthy controls were not utilized in identification or validation of RNA expression signatures. Meningococcal Validation cohort We validated our expression signatures on children with meningococcal (gram-negative) infection (n=24), recruited to an earlier study at St Mary’s Hospital, London, UK [1]. Following informed parental consent, and with approval of the hospital Local Research Ethics Committee (EC3263), venous blood was collected on admission and within 24 hours of onset of symptoms, from patients admitted to Pediatric Intensive Care Unit (PICU) at St Mary’s hospital between December 2002 and May 2005 with suspected meningococcal sepsis, meningococcal meningitis or both. Group B meningococcus was detected in blood or CSF by culture or by bacterial DNA PCR amplification. Controls (used only for removal of array data batch effects) were healthy white adults recruited following informed consent [11 males, 10 females age median (IQR) 35.6 (30.8-44.5)]. Inflammatory Validation cohort In order to establish if gene expression signatures could also distinguish children with bacterial infection from childhood inflammatory or vasculitic diseases, we used data from children with inflammatory diseases (eTable 1). Patients were recruited at pediatric centers in the Netherlands and USA under approvals by the Research Ethics Committees of UCSD (Human Research Protection Program #140220), Amsterdam (NL41846.018.12 and NL34230.018.10). The inflammatory syndromes in the cohort were a) Henoch Schönlein Purpura (HSP) that was diagnosed in children presenting with palpable purpura, typically over the buttocks and extensor surfaces in association with abdominal pain, arthralgia or renal abnormalities (hematuria and proteinuria); and b) Juvenile Idiopathic arthritis (JIA) that was defined according to International League of Associations for Rheumatology [2]. Patients for the JIA cohort were recruited at initial presentation with early arthritis. They were not treated with disease-modifying anti-rheumatic drugs, corticosteroids or biologicals. Some patients used simple non-steroidal anti-inflammatory drugs. RNA sample extraction and processing Whole blood (2.5ml) was collected into PAXgene blood RNA tubes (PreAnalytiX, Germany), incubated for two hours, frozen at -20oC within six hours of collection, before storage at -80oC. Total RNA was extracted using PAXgene blood RNA kits (PreAnalytiX, Germany) according to the manufacturer’s instructions. The
© 2016 American Medical Association. All rights reserved.
Downloaded From: on 09/27/2018
integrity and yield of the total RNA was assessed using an Agilent 2100 Bioanalyser and a NanoDrop 1000 spectrophotometer. After quantification and quality control, biotin-labeled cRNA was prepared using Illumina TotalPrep RNA Amplification kits (Applied Biosystems) from 500ng RNA. Labeled cRNA was hybridized overnight to Human HT12-V4 Expression BeadChip arrays (Illumina) [Discovery cohort, Inflammatory Validation cohort] or Human HT12-V3 Expression BeadChip arrays (Illumina) [IRIS validation cohort] or Human Ref-8 V3 Beadchip (Meningococcal validation cohort). After washing, blocking, and staining, the arrays were scanned using an Illumina BeadArray Reader according to the manufacturer’s instructions. Using Genome Studio software, the microarray images were inspected for artifacts and QC parameters were assessed. No arrays were excluded at this stage. eStatistical Methods
Microarray pre-processing Data was analyzed using ‘R’ Language and Environment for Statistical Computing (R) 3.1.2 [3]. Expression values were transformed to a logarithmic scale (base 2). Mean raw intensity values for each probe were corrected for local background intensities and robust spline normalization [4] (combining quantile normalization and spline interpolation) was applied. Principal Component Analysis (PCA) was used as part of the quality control process. PCA is an approach that allowed us to summarize our data and reduce the dimensionality (240 arrays x 48,000 probes, down to 240 arrays x no of principal components) in order to explore variance in the expression level [5]. Transcript expression profiles of all samples in the discovery dataset clustered together on PCA; regardless of the diagnostic group (eFigure 1). The arrays in the discovery dataset that correspond to patients with definite diagnosis were divided into 80%-20% for the identification and validation of expression signatures, resulting in a balanced training set (nadenovirus=18, nflu=18, nRSV=22, nother viral=15, nbacterial gram-negative=20, nbacterial gram-positive=22) and test set (nadenovirus=5, nflu=5, nRSV=5, nother viral=4, nbacterial gram-negative=5, nbacterial gram-positive=5). Identification of expression signatures For the discovery dataset, we used transcripts that were measured on both V3 and V4 Illumina BeadChips (the intersection array IDs). Using the training set, we identified the transcripts that were differentially expressed between the definite viral and bacterial groups with |log2 FC| > 1 and adjusted P-value < 0·05, using a linear model for expression, conditional on recruitment site. These thresholds were chosen to ensure that differential expression for selected variables could be distinguished using the resolution of other validation techniques (i.e. qPCR). The transcripts that fulfilled the above criteria were taken forward to variable selection with elastic net, using glmnet [6] package in R. The parameters of elastic net, which control the size of the selected model, were optimized via ten-fold cross-validation (CV). In order to identify a smaller signature, we applied an in-house forward selection algorithm to discover a transcript signature, Forward Selection – Partial Least Squares (FS-PLS) which was then implemented as a Disease Risk Score (DRS) – see below. In order to discover gene expression signatures using FS-PLS, the first iteration of the algorithm considers the expression levels of all transcripts (N) and initially fits N univariate regression models. The regression coefficient for each model is estimated using the Maximum Likelihood Estimation (MLE) function, and the goodness of fit is assessed by means of a t-test. The variable with the highest MLE and smallest p-value is selected first (SV1). Before selecting which of the N-1 remaining variables to use next, the algorithm projects the variation explained by SV1 using Singular Value Decomposition. The algorithm iteratively fits up to N-1 models, at each step projecting the variation corresponding to the already selected variables, and selecting new variables based on the residual variation. This process terminates when the MLE p-value exceeds a pre-defined threshold. The final model includes regression coefficients for all selected variables. Disease Risk Score The DRS is based on subtracting the summed intensities of the down-regulated transcripts from the summed intensities of the up-regulated transcripts in the signature [7]. The disease risk score for individual i is:
© 2016 American Medical Association. All rights reserved.
Downloaded From: on 09/27/2018

𝐷𝐷𝐷𝐷𝐷𝐷𝐷𝐷𝐷𝐷𝐷𝐷𝐷𝐷 𝑅𝑅𝐷𝐷𝐷𝐷𝑅𝑅 𝑆𝑆𝑆𝑆𝑆𝑆𝑆𝑆𝐷𝐷𝑖𝑖 = �𝐷𝐷𝑒𝑒𝑒𝑒𝑆𝑆. 𝑣𝑣𝐷𝐷𝑣𝑣𝑣𝑣𝐷𝐷𝑘𝑘𝑖𝑖𝑛𝑛
𝑘𝑘=0
−�𝐷𝐷𝑒𝑒𝑒𝑒𝑆𝑆. 𝑣𝑣𝐷𝐷𝑣𝑣𝑣𝑣𝐷𝐷𝑙𝑙𝑖𝑖 (1)𝑚𝑚
𝑙𝑙=0
where: n the number of up-regulated probes in the signature in disease of interest (bacterial infection) compared to comparator group (viral infection) and m the number of down-regulated probes in the signature in disease of interest (bacterial infection) compared to comparator group (viral infection). For the 2-transcript signature, the DRS was calculated by subtracting the log2 transformed expression value of IFI44L from the log2 transformed FAM89A expression value for every patient. The range of DRS in the population can be between: [the minimum FAM89A value – the maximum IFI44L, the maximum FAM89A value –the minimum IFI44L value]. Higher scores indicate bacterial assignment, whilst lower scores indicate viral assignment, with viral or bacterial assignment for a particular patient defined relative to the threshold value calculated in the reference group. The performance of both the signatures was assessed on the 20% test and the IRIS validation dataset. The probable viral and bacterial groups as well as the unknown bacterial or viral infection group from the discovery cohort were assessed with the 20% test dataset. The thresholds for the classification throughout were calculated using the pROC package in R [8], employing the Youden's J statistic [9]. The optimal threshold was determined by the point in the ROC curve that maximizes the distance to the identity line (maximum of (sensitivities + specificities)). In the boxplots, boxes show median with 25th and 75th quartiles and whiskers show “range” (defined by ‘boxplot’ function in R). With a “range” value set at 1, the whiskers extend no more than 1 times the interquartile range. The calculation of the confidence intervals for the sensitivity and the specificity was based on a stratified bootstrap resampling. For small sample sizes and perfect classification metrics, the bootstrapping method overestimates the lower bound of the confidence intervals (CIs), resulting to CIs from 100 to 100. For these cases (listed here), we used the exact binomial method for the calculation of the CIs: the specificity of the 2-transcript signature in the test set and its sensitivity in the validation set; the sensitivity of the 2-transcript signature in the GSE6269 and GSE40396 sets and the sensitivity of the 38-transcript elastic net signature in the test and validation sets.
Analysis of IRIS validation dataset The IRIS validation dataset (analyzed using HT-12-V3 Illumina BeadChip arrays) was pre-processed and analyzed separately to the discovery dataset, using the same approach. Analysis of additional validation datasets To assess the performance of the signature in gram-negative bacterial infection, the IRIS validation dataset was merged with a dataset containing pediatric meningococcal infection and healthy controls. As the meningococcal and IRIS validation cohorts had been run on different versions of the Illumina chip, the data were merged for analysis using the ComBat method [10] to remove unwanted batch effects using transcripts common to the 2 platforms. The healthy controls in the IRIS validation set (Illumina HT12-V3), and the healthy controls in the meningococcal validation set (Illumina Ref-8) were used for the adjustment. One binary covariate was passed to ComBat which assigned samples to two groups - healthy, and disease (eFigure 6). The inflammatory validation dataset contained JIA and HSP patients run on Illumina HT12-V4 arrays. These arrays were processed and normalized alongside the Discovery arrays, and the discriminatory power of the 2-transcript signature was applied without further pre-processing of array data.
© 2016 American Medical Association. All rights reserved.
Downloaded From: on 09/27/2018

To further validate the performance of the disease risk score based on the 2-transcript signature, we used publicly available microarray expression datasets with bacterial infections and comparator groups run simultaneously on the same platform to avoid the introduction of batch effects, as follows:
1. GPL570 [HG-U133_Plus_2] Affymetrix Human Genome U133 Plus 2.0 [11] (accession series GSE6269) dataset. The dataset consists of 22 pediatric cases, 10 viral and 12 bacterial; 7 children were diagnosed with Influenza A, 3 with Influenza B, 6 with S. pneumoniae and 6 with S. aureus infection. Gene identities for the two genes in our signature from the Illumina arrays were mapped to the Affymetrix dataset and “204439_at” for IFI44L and “226448_at” for FAM89A transcript ids were used. Despite differences in experimental design - the GSE6269 gene expression dataset was acquired from peripheral blood mononuclear cells using a non-Illumina platform, the 2-transcript signature DRS had a sensitivity of 100% (95% Confidence Interval (CI), 73.5 to 100) and a specificity of 90% (95% CI, 70 to 100), misclassifying only one viral patient with Influenza A (patient id: GSM173316). The Area Under the Curve (AUC) was 96% (95% CI, 85 to 100) (eFigure 7).
2. GSE40396 dataset. This includes 30 febrile children with viral infection (8 with adenovirus, 6 with enterovirus and 8 with HHV6) and 8 with bacterial infection (MRSA, MSSA, salmonella and E.coli) [12]. As the arrays used were Illumina HT12-V4, the same probe ids for IFI44L and FAM89A were identified. The 2-transcript signature had a sensitivity of 100% (95% CI, 63.1 to 100) and a specificity of 77.3% (95% CI, 59.1 to 95.5) and an AUC of 89.2% (95% CI, 75.6 to 98.3).
3. GSE22098 dataset. This includes 48 children (aged <17 years) with bacterial infection (S. pneumoniae and S. aureus) and 31 children with systemic lupus erythematosus [13], run on Illumina Beadchip HT12-V3 arrays. The same probe IDs for the two-transcript signature were available on both HT12-V3 and V4 arrays, and were applied to the data. The 2-transcript signature had a sensitivity for detection of bacterial infection of 93.5% (95% CI, 83.9 to 100) and a specificity of 96.1% (95% CI, 96.9 to 100) and an AUC of 96.6% (95% CI, 91.9 to 100).
4. GSE22098 dataset. This dataset includes patients with bacterial lower respiratory tract infection (LRTI) n=22 and viral LRTI n=71 run on Illumina Beadchip HT12-V4 arrays. As the arrays used were Illumina HT12-V4, the same probe ids for IFI44L and FAM89A were identified. The 2-transcript signature had a sensitivity for detection of bacterial infection of 90.1 (95% CI, 77.3 to 100) and a specificity of 80.3 (95% CI, 70.4 to 88.7) and an AUC of 89.8 (95% CI, 83.4-95.5).
© 2016 American Medical Association. All rights reserved.
Downloaded From: on 09/27/2018
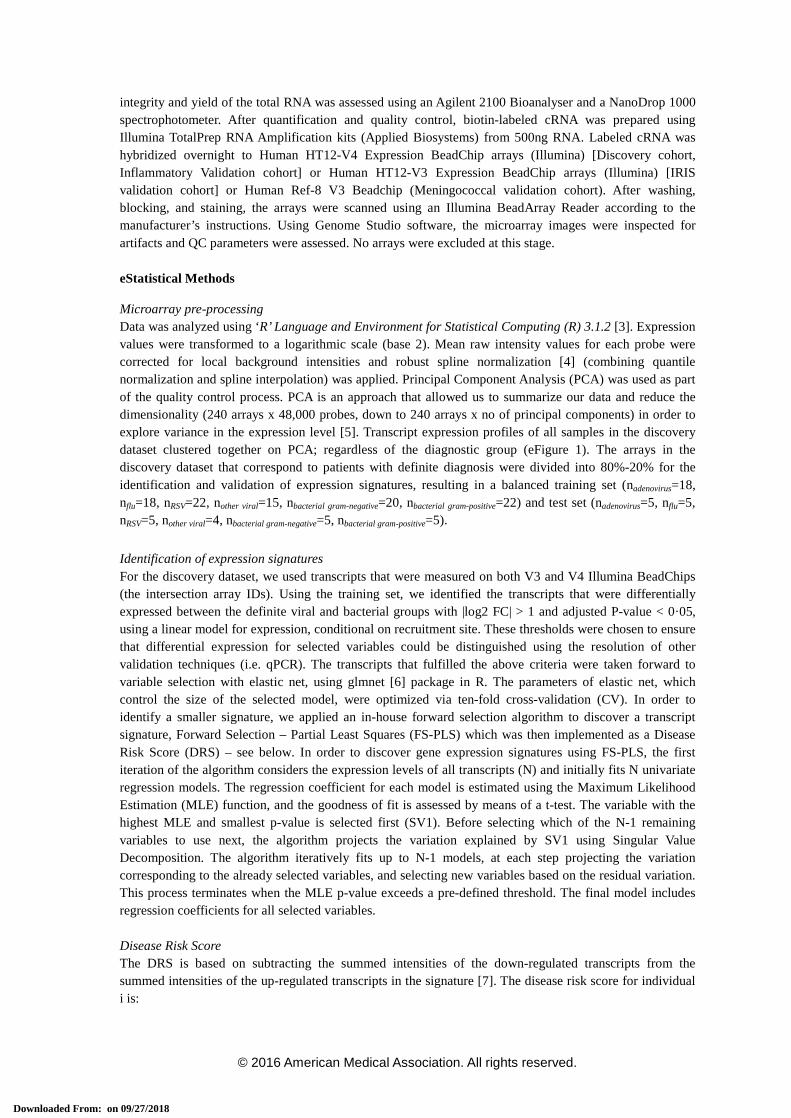
eFigure 1. Principal Components Analysis of the Samples in the Discovery Set Principal components analysis (PCA) plot of PC1 & PC2 based on all transcripts and samples in the discovery cohort after background adjustment and normalization. No sample was removed from the analysis at this stage. A confidence ellipse has been calculated for the population mean and is shown below (99%).
Number of arrays for each sample are: Viral n=92, Probable Viral n=5, Unknown n=49, Probable Bacterial n=42, Bacterial n=52.
© 2016 American Medical Association. All rights reserved.
Downloaded From: on 09/27/2018

eFigure 2. Heatmaps Showing Clustering of the Training and Test Datasets Based on the Bacterial vs. Viral 38-Transcript Signature
Patients are represented as columns (red are patients with Definite Bacterial infection, blue are patients with Definite Viral infection) and individual RNA transcripts are shown in rows (RNA transcripts shown in red are up-regulated and those in green are down-regulated). The dendrograms for samples and transcripts are shown on the top and left of the heatmaps respectively, indicating hierarchical clusters of the data.
Patients in the training set: Definite Bacterial n=42, Definite Viral n=92. Patients in the test set: Definite Bacterial n=10, Definite Viral n=19
© 2016 American Medical Association. All rights reserved.
Downloaded From: on 09/27/2018
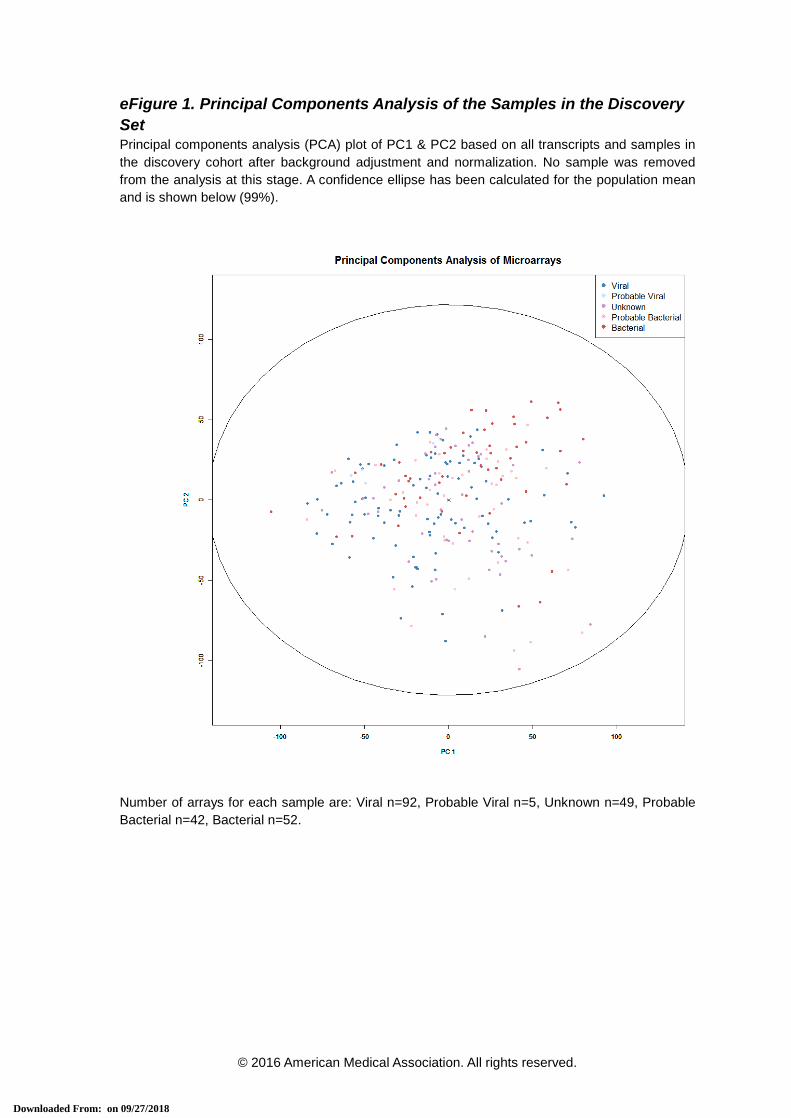
eFigure 3. Elastic Net Prediction Value and Receiver Operator Characteristic Curves Based on the 38-Transcript Signature Applied to the Definite Bacterial and Viral Groups
Classification performance and Receiver Operating Characteristic (ROC) curve, based on the 38-transcript signature, applied to the Definite Bacterial and Viral groups of the 80% training set (A & D), the 20% test set (B & E) and the IRIS validation dataset (C & F). Sensitivity, specificity and AUC are reported in eTable 3. Boxes show median with 25th and 75th quartiles; whiskers ” (defined by “range” in boxplot function in R) can extend no more than 1 times the interquartile range. The elastic net prediction value (the outcome variable Y obtained from fitting the elastic net model) can range from 0 (indicating viral infection) to 1 (indicating bacterial infection).
Patients in the training set: Definite Bacterial n=42, Definite Viral n=92. Patients in the test set: Definite Bacterial n=10, Definite Viral n=19. Patients in IRIS validation dataset: Definite Bacterial n=23, Definite Viral n=28.
© 2016 American Medical Association. All rights reserved.
Downloaded From: on 09/27/2018

eFigure 4. Disease Risk Scores and Receiver Operator Characteristic Curves Based on the 2-Transcript Signature Applied to Training Set
Classification performance (A) and Receiver Operating Characteristic (ROC) curve (B), based on the 2-transcript Disease Risk Score signature (the combination of IFI44L and FAM89A), applied to the Definite Bacterial and Viral groups of the 80% training set. Sensitivity, specificity and Area Under the Curve are reported in eTable 3. Boxes show median with 25th and 75th quartiles; whiskers, plotted using ‘boxplot’ in R, extend ≤1 times the interquartile range. The horizontal DRS threshold line separates patients predicted as bacterial (above) or viral (below the threshold). The threshold is determined by the point on the ROC curve that maximizes sensitivity and specificity (see Supplementary Statistical Methods).
Patients in the training set: Definite Bacterial n=42, Definite Viral n=92.
© 2016 American Medical Association. All rights reserved.
Downloaded From: on 09/27/2018

eFigure 5. STARD Flow Diagrams and Assessment of Diagnostic Test Accuracy
STARD flow diagram for assessment of diagnostic test accuracy in the test set (A) and validation set (B), including a 2x2 table of results comparing performance of the 2-transcript Disease Risk Score (DRS) against the clinical coding as bacterial or viral infection. DB – Definite Bacterial; DV – Definite Viral; PB – Probable Bacterial; U – Unknown Bacterial or Viral; PV – Probable Viral
© 2016 American Medical Association. All rights reserved.
Downloaded From: on 09/27/2018

© 2016 American Medical Association. All rights reserved.
Downloaded From: on 09/27/2018

eFigure 6. Principal Component Analysis of Meningococcal and IRIS Validation Samples After Merging With ComBat The two-transcript Disease Risk Score classifier was applied on external data, and its ability to discriminate between bacterial and non-bacterial patients was assessed. In the case of the meningococcal validation data set, there were no comparator non-bacterial patients, and in order to estimate the accuracy of the Disease Risk Score signature, we employed the viral group of the IRIS validation dataset. The two datasets were merged using the ComBat method to remove non-biological experimental variation, using the healthy controls from both datasets as reference. The Principal components analysis plot of the merged dataset indicates successful removal of the batch effects. The healthy controls from the IRIS dataset (HC_IRIS n=16) and the healthy controls from the meningococcal dataset (HC_Mening n=21) are shown lying adjacent, as well as the bacterial patients from both datasets (Bacterial_IRIS n=23 and Bacterial_Mening n=24). The viral patients of the IRIS dataset are shown in blue (Viral_IRIS n=28). The 1st principal component was found to capture the differences in gene expression by infection status.
-100 -50 0 50 100
-100
-50
050
100
PC 1
PC
2
-100 -50 0 50 100
-100
-50
050
100
-100 -50 0 50 100
-100
-50
050
100
-100 -50 0 50 100
-100
-50
050
100
-100 -50 0 50 100
-100
-50
050
100 HC_IRIS
HC_MeningBacterial_IRISBacterial_MeningViral_IRIS
© 2016 American Medical Association. All rights reserved.
Downloaded From: on 09/27/2018

eFigure 7. Disease Risk Scores and Receiver Operator Characteristic Curves Based on the 2-Transcript Signature Applied to Children With Gram-Negative and Gram-Positive Infection The classification performance (A) and Receiver Operating Characteristic (ROC) curve (B), based on the 2-transcript Disease Risk Score signature (the combination of IFI44L and FAM89A), applied to the gram-positive (IRIS validation), gram-negative (IRIS and meningococcal validation), and viral (IRIS validation) groups of the merged datasets. Boxes show median with 25th and 75th quartiles; whiskers, plotted using ‘boxplot’ in R, extend ≤1 times the interquartile range. The horizontal DRS threshold line separates patients predicted as bacterial (above) or viral (below the threshold). It is determined by the point on the ROC curve that maximizes sensitivity and specificity (see Supplementary Statistical Methods). Sensitivity, specificity and Area Under the Curve are reported in eTable 6, based on discrimination of gram-negative infection and viral infection. The bacterial gram-positive group is shown for illustrative purposes. A B
© 2016 American Medical Association. All rights reserved.
Downloaded From: on 09/27/2018

eFigure 8. Disease Risk Scores and Receiver Operator Characteristic Curves Based on the 2-Transcript Signature Applied to Additional Validation Datasets
The classification performance and Receiver Operating Characteristic (ROC) curve based on the 2-transcript Disease Risk Score signature (the combination of IFI44L and FAM89A) applied to the inflammatory validation groups Juvenile Idiopathic arthritis (JIA) and Henoch Schönlein Purpura (HSP) (A, B); and to 4 external published datasets: bacterial and inflammatory patients with systemic lupus erythematosus (C, D) [13]; bacterial and viral patients from the Ramilo et al study (E, F) [11]; bacterial and viral patients from the Hu et al study (G, H) [12]; and bacterial and viral patients from the Suarez et al study (I, J) [14]. Boxes show median with 25th and 75th quartiles; whiskers, plotted using ‘boxplot’ in R, extend ≤1 times the interquartile range. The horizontal DRS threshold line separates patients predicted as bacterial (above) or viral (below the threshold). It is determined by the point on the ROC curve that maximizes sensitivity and specificity (see Supplementary Statistical Methods). Sensitivity, specificity and Area Under the Curve are reported in eTable 6.
© 2016 American Medical Association. All rights reserved.
Downloaded From: on 09/27/2018

© 2016 American Medical Association. All rights reserved.
Downloaded From: on 09/27/2018

eFigure 9. Performance of the Disease Risk Score in Relation to Severity of Illness in the IRIS Validation Set
In order to investigate whether the severity of illness influenced the performance of the 2-transcript classifier, we analyzed the Disease Risk Score (DRS) values (the combined IFI44L and FAM89A expression values) in the definite Viral and definite Bacterial groups by need for admission to the pediatric intensive care unit (PICU) during their illness (as shown in Figure 4B). The horizontal DRS threshold line separates patients predicted as bacterial (above the line) or viral (below the line) (A). The 2-transcript DRS classified patients as bacterial or viral irrespective of their requirement for intensive care. The classification performance and Receiver Operating Characteristic (ROC) curve, based on the 2-transcript DRS signature is shown for patients requiring intensive care (solid line) or not requiring intensive care (dotted line) (B).
© 2016 American Medical Association. All rights reserved.
Downloaded From: on 09/27/2018

eFigure 10. Performance of the Disease Risk Score in Relation to Day of Illness in the IRIS Validation Set
In order to investigate whether the duration of illness influenced performance of the 2-transcript classifier, Disease Risk Score (DRS) values were plotted relative to the patient-reported day of illness (including symptomatic days before hospital admission) at the time of blood sampling. The horizontal DRS threshold line separates patients predicted as bacterial (above the line) and viral (below the line) (as shown on Figure 4B). Red triangles denote Definite Bacterial patients; blue triangles denote Definite Viral patients. There was no correlation of illness day with DRS. The plot does not include a single patient with a long illness.
© 2016 American Medical Association. All rights reserved.
Downloaded From: on 09/27/2018

eTable 1. Demographic and Clinical Features of the Validation Groups
Meningococcal Diseasea
Juvenile Idiopathic Arthritisb
Henoch-Schönlein purpurac
Number of patients 24 30 18
Age - mo. median (IQR) 23 (17-35) 163 (124-187) 56 (43-81)
Male, No. (%) 16 (66%) 11 (37%) 9 (50%)
White ethnicity - no. (%) 24/24 (100%) 27/30 (90%) 4/18 (22%)
Days from symptoms - median (IQR)
1(1-1) n/a 3.5 (2-6)
Intensive care, No. (%) 24 (100%) 0 0
Deaths, No. (%) 3 (12.5%) 0 0
CRP (mg/dl) - median (IQR) 6.8 (3.4-10) 0.1 (0.0-0.2) 2.2 (0.8-2.4)
Neutrophil %: median (IQR) 71 (56-83) 51 (45-57) 60 (45-68)
Lymphocyte %: median (IQR)
23 (12-53) 37 (33-45) 26 (16-34)
Monocyte %: median (IQR) ND 7 (6-8) 7 (5-8)
a sample size for data fields: % neutrophil n=20, % lymphocyte n=12, CRP n=22. b sample size for JIA (juvenile idiopathic arthritis) disease categories: enthesitis-related arthritis
n=6, extended oligoarthritis n=4, persistent oligoarthritis n=4, polyarthritis rheumatoid factor (RF)-negative n=12, polyarthritis RF-positive n=1, psoriatic n=3. Sample size for data fields: % neutrophil n=27, % lymphocyte n=27, % monocyte n=27 c HSP (Henoch-Schönlein purpura). Sample size for data fields: % neutrophil n=15, % monocyte n=15, CRP n=8
© 2016 American Medical Association. All rights reserved.
Downloaded From: on 09/27/2018
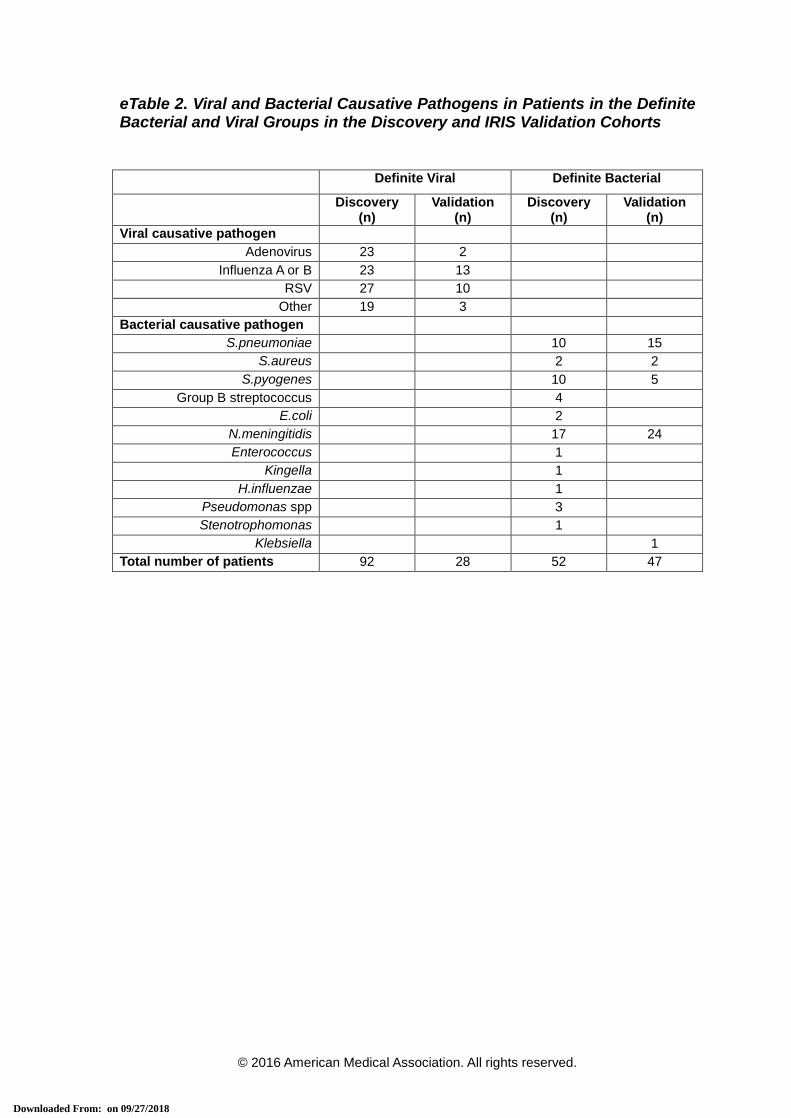
eTable 2. Viral and Bacterial Causative Pathogens in Patients in the Definite Bacterial and Viral Groups in the Discovery and IRIS Validation Cohorts
Definite Viral Definite Bacterial
Discovery (n)
Validation (n)
Discovery (n)
Validation (n)
Viral causative pathogen Adenovirus 23 2
Influenza A or B 23 13 RSV 27 10
Other 19 3 Bacterial causative pathogen
S.pneumoniae 10 15 S.aureus 2 2
S.pyogenes 10 5 Group B streptococcus 4
E.coli 2 N.meningitidis 17 24 Enterococcus 1
Kingella 1 H.influenzae 1
Pseudomonas spp 3 Stenotrophomonas 1
Klebsiella 1 Total number of patients 92 28 52 47
© 2016 American Medical Association. All rights reserved.
Downloaded From: on 09/27/2018
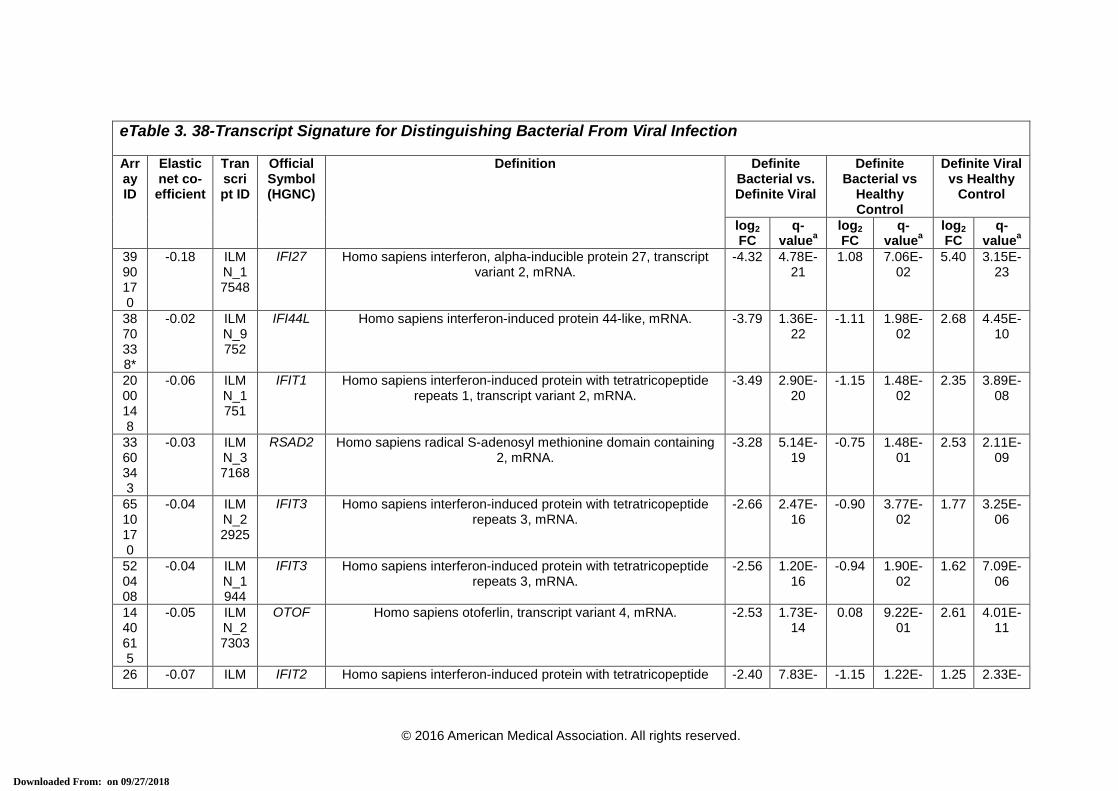
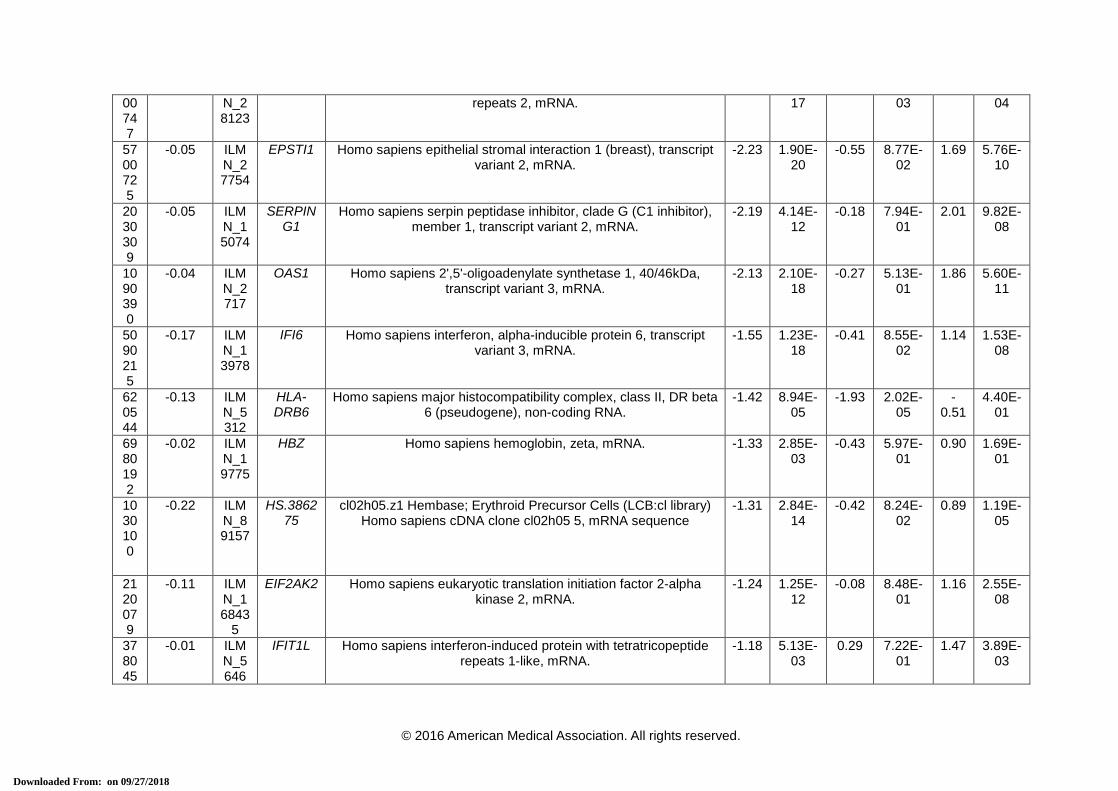
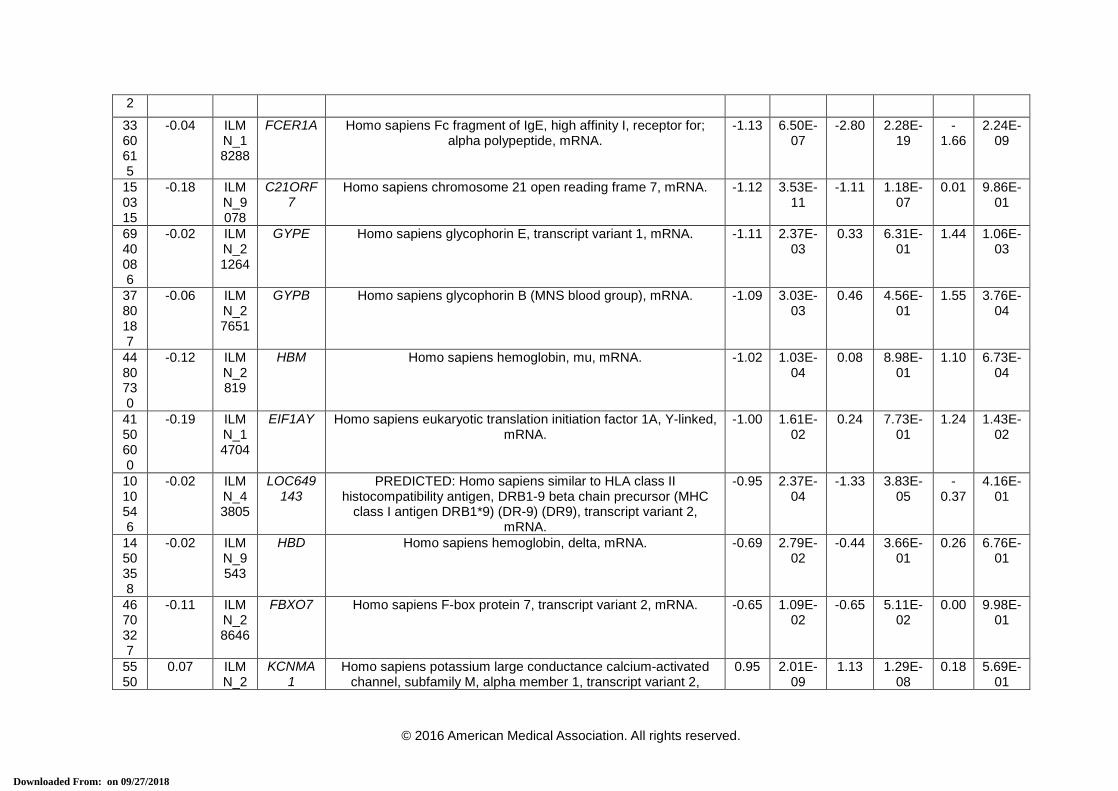
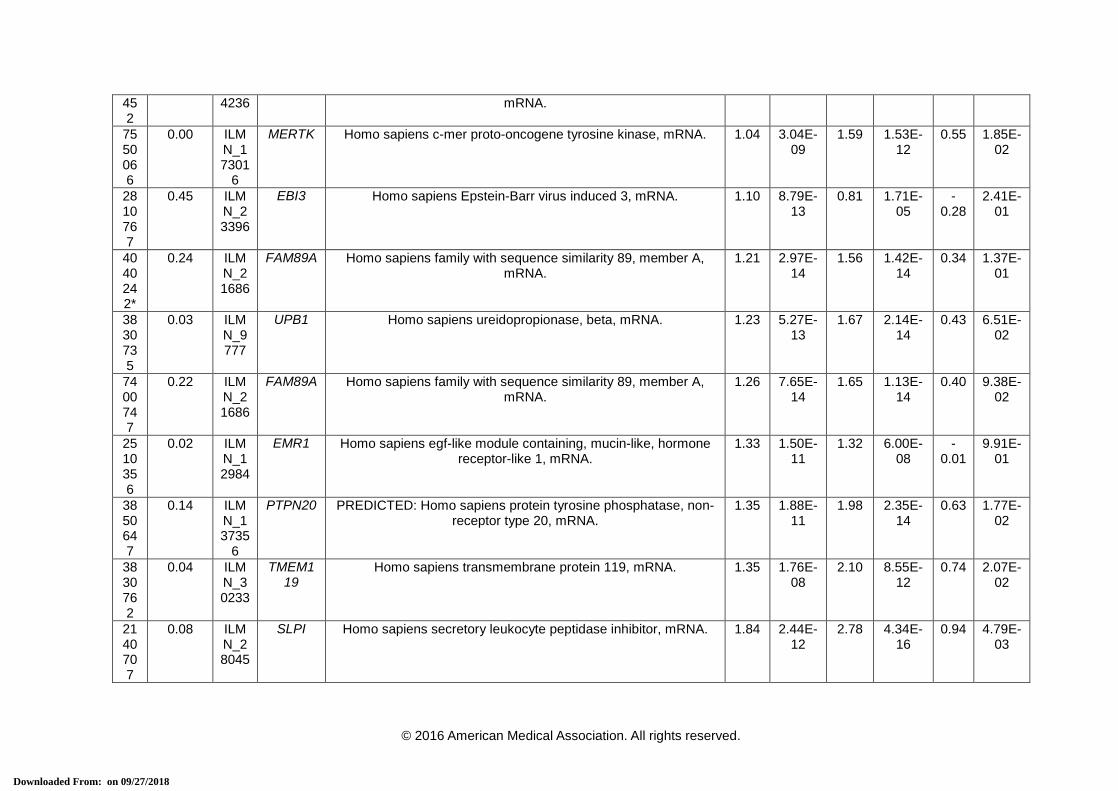
eTable 3. 38-Transcript Signature for Distinguishing Bacterial From Viral Infection
Array ID
Elastic net co-efficient
Transcript ID
Official Symbol (HGNC)
Definition Definite Bacterial vs. Definite Viral
Definite Bacterial vs
Healthy Control
Definite Viral vs Healthy
Control
log2 FC
q-valuea
log2 FC
q-valuea
log2 FC
q-valuea
3990170
-0.18 ILMN_17548
IFI27 Homo sapiens interferon, alpha-inducible protein 27, transcript variant 2, mRNA.
-4.32 4.78E-21
1.08 7.06E-02
5.40 3.15E-23
3870338*
-0.02 ILMN_9752
IFI44L Homo sapiens interferon-induced protein 44-like, mRNA. -3.79 1.36E-22
-1.11 1.98E-02
2.68 4.45E-10
2000148
-0.06 ILMN_1751
IFIT1 Homo sapiens interferon-induced protein with tetratricopeptide repeats 1, transcript variant 2, mRNA.
-3.49 2.90E-20
-1.15 1.48E-02
2.35 3.89E-08
3360343
-0.03 ILMN_37168
RSAD2 Homo sapiens radical S-adenosyl methionine domain containing 2, mRNA.
-3.28 5.14E-19
-0.75 1.48E-01
2.53 2.11E-09
6510170
-0.04 ILMN_22925
IFIT3 Homo sapiens interferon-induced protein with tetratricopeptide repeats 3, mRNA.
-2.66 2.47E-16
-0.90 3.77E-02
1.77 3.25E-06
520408
-0.04 ILMN_1944
IFIT3 Homo sapiens interferon-induced protein with tetratricopeptide repeats 3, mRNA.
-2.56 1.20E-16
-0.94 1.90E-02
1.62 7.09E-06
1440615
-0.05 ILMN_27303
OTOF Homo sapiens otoferlin, transcript variant 4, mRNA. -2.53 1.73E-14
0.08 9.22E-01
2.61 4.01E-11
26 -0.07 ILM IFIT2 Homo sapiens interferon-induced protein with tetratricopeptide -2.40 7.83E- -1.15 1.22E- 1.25 2.33E-
© 2016 American Medical Association. All rights reserved.
Downloaded From: on 09/27/2018
00747
N_28123
repeats 2, mRNA. 17 03 04
5700725
-0.05 ILMN_27754
EPSTI1 Homo sapiens epithelial stromal interaction 1 (breast), transcript variant 2, mRNA.
-2.23 1.90E-20
-0.55 8.77E-02
1.69 5.76E-10
2030309
-0.05 ILMN_15074
SERPING1
Homo sapiens serpin peptidase inhibitor, clade G (C1 inhibitor), member 1, transcript variant 2, mRNA.
-2.19 4.14E-12
-0.18 7.94E-01
2.01 9.82E-08
1090390
-0.04 ILMN_2717
OAS1 Homo sapiens 2',5'-oligoadenylate synthetase 1, 40/46kDa, transcript variant 3, mRNA.
-2.13 2.10E-18
-0.27 5.13E-01
1.86 5.60E-11
5090215
-0.17 ILMN_13978
IFI6 Homo sapiens interferon, alpha-inducible protein 6, transcript variant 3, mRNA.
-1.55 1.23E-18
-0.41 8.55E-02
1.14 1.53E-08
620544
-0.13 ILMN_5312
HLA-DRB6
Homo sapiens major histocompatibility complex, class II, DR beta 6 (pseudogene), non-coding RNA.
-1.42 8.94E-05
-1.93 2.02E-05
-0.51
4.40E-01
6980192
-0.02 ILMN_19775
HBZ Homo sapiens hemoglobin, zeta, mRNA. -1.33 2.85E-03
-0.43 5.97E-01
0.90 1.69E-01
1030100
-0.22 ILMN_89157
HS.386275
cl02h05.z1 Hembase; Erythroid Precursor Cells (LCB:cl library) Homo sapiens cDNA clone cl02h05 5, mRNA sequence
-1.31 2.84E-14
-0.42 8.24E-02
0.89 1.19E-05
2120079
-0.11 ILMN_16843
5
EIF2AK2 Homo sapiens eukaryotic translation initiation factor 2-alpha kinase 2, mRNA.
-1.24 1.25E-12
-0.08 8.48E-01
1.16 2.55E-08
378045
-0.01 ILMN_5646
IFIT1L Homo sapiens interferon-induced protein with tetratricopeptide repeats 1-like, mRNA.
-1.18 5.13E-03
0.29 7.22E-01
1.47 3.89E-03
© 2016 American Medical Association. All rights reserved.
Downloaded From: on 09/27/2018
2
3360615
-0.04 ILMN_18288
FCER1A Homo sapiens Fc fragment of IgE, high affinity I, receptor for; alpha polypeptide, mRNA.
-1.13 6.50E-07
-2.80 2.28E-19
-1.66
2.24E-09
150315
-0.18 ILMN_9078
C21ORF7
Homo sapiens chromosome 21 open reading frame 7, mRNA. -1.12 3.53E-11
-1.11 1.18E-07
0.01 9.86E-01
6940086
-0.02 ILMN_21264
GYPE Homo sapiens glycophorin E, transcript variant 1, mRNA. -1.11 2.37E-03
0.33 6.31E-01
1.44 1.06E-03
3780187
-0.06 ILMN_27651
GYPB Homo sapiens glycophorin B (MNS blood group), mRNA. -1.09 3.03E-03
0.46 4.56E-01
1.55 3.76E-04
4480730
-0.12 ILMN_2819
HBM Homo sapiens hemoglobin, mu, mRNA. -1.02 1.03E-04
0.08 8.98E-01
1.10 6.73E-04
4150600
-0.19 ILMN_14704
EIF1AY Homo sapiens eukaryotic translation initiation factor 1A, Y-linked, mRNA.
-1.00 1.61E-02
0.24 7.73E-01
1.24 1.43E-02
1010546
-0.02 ILMN_43805
LOC649143
PREDICTED: Homo sapiens similar to HLA class II histocompatibility antigen, DRB1-9 beta chain precursor (MHC
class I antigen DRB1*9) (DR-9) (DR9), transcript variant 2, mRNA.
-0.95 2.37E-04
-1.33 3.83E-05
-0.37
4.16E-01
1450358
-0.02 ILMN_9543
HBD Homo sapiens hemoglobin, delta, mRNA. -0.69 2.79E-02
-0.44 3.66E-01
0.26 6.76E-01
4670327
-0.11 ILMN_28646
FBXO7 Homo sapiens F-box protein 7, transcript variant 2, mRNA. -0.65 1.09E-02
-0.65 5.11E-02
0.00 9.98E-01
5550
0.07 ILMN_2
KCNMA1
Homo sapiens potassium large conductance calcium-activated channel, subfamily M, alpha member 1, transcript variant 2,
0.95 2.01E-09
1.13 1.29E-08
0.18 5.69E-01
© 2016 American Medical Association. All rights reserved.
Downloaded From: on 09/27/2018
452
4236 mRNA.
7550066
0.00 ILMN_17301
6
MERTK Homo sapiens c-mer proto-oncogene tyrosine kinase, mRNA. 1.04 3.04E-09
1.59 1.53E-12
0.55 1.85E-02
2810767
0.45 ILMN_23396
EBI3 Homo sapiens Epstein-Barr virus induced 3, mRNA. 1.10 8.79E-13
0.81 1.71E-05
-0.28
2.41E-01
4040242*
0.24 ILMN_21686
FAM89A Homo sapiens family with sequence similarity 89, member A, mRNA.
1.21 2.97E-14
1.56 1.42E-14
0.34 1.37E-01
3830735
0.03 ILMN_9777
UPB1 Homo sapiens ureidopropionase, beta, mRNA. 1.23 5.27E-13
1.67 2.14E-14
0.43 6.51E-02
7400747
0.22 ILMN_21686
FAM89A Homo sapiens family with sequence similarity 89, member A, mRNA.
1.26 7.65E-14
1.65 1.13E-14
0.40 9.38E-02
2510356
0.02 ILMN_12984
EMR1 Homo sapiens egf-like module containing, mucin-like, hormone receptor-like 1, mRNA.
1.33 1.50E-11
1.32 6.00E-08
-0.01
9.91E-01
3850647
0.14 ILMN_13735
6
PTPN20 PREDICTED: Homo sapiens protein tyrosine phosphatase, non-receptor type 20, mRNA.
1.35 1.88E-11
1.98 2.35E-14
0.63 1.77E-02
3830762
0.04 ILMN_30233
TMEM119
Homo sapiens transmembrane protein 119, mRNA. 1.35 1.76E-08
2.10 8.55E-12
0.74 2.07E-02
2140707
0.08 ILMN_28045
SLPI Homo sapiens secretory leukocyte peptidase inhibitor, mRNA. 1.84 2.44E-12
2.78 4.34E-16
0.94 4.79E-03
© 2016 American Medical Association. All rights reserved.
Downloaded From: on 09/27/2018

1510424
0.06 ILMN_23476
S100P Homo sapiens S100 calcium binding protein P, mRNA. 2.35 1.39E-16
2.91 6.99E-16
0.56 1.85E-01
1050168
0.03 ILMN_13685
PI3 Homo sapiens peptidase inhibitor 3, skin-derived, mRNA. 2.58 4.52E-10
0.77 2.39E-01
-1.82
3.76E-04
* Transcripts that comprise the 2-transcript DRS signature. HGNC = HUGO Gene Nomenclature Committee, FC = Fold Change. a This is the P-value corrected for false discovery, using Benjamini-Hochberg method [15], for the difference in expression between the 2 comparator
groups for each transcript using a moderated t-test in R using limma [16].
© 2016 American Medical Association. All rights reserved.
Downloaded From: on 09/27/2018
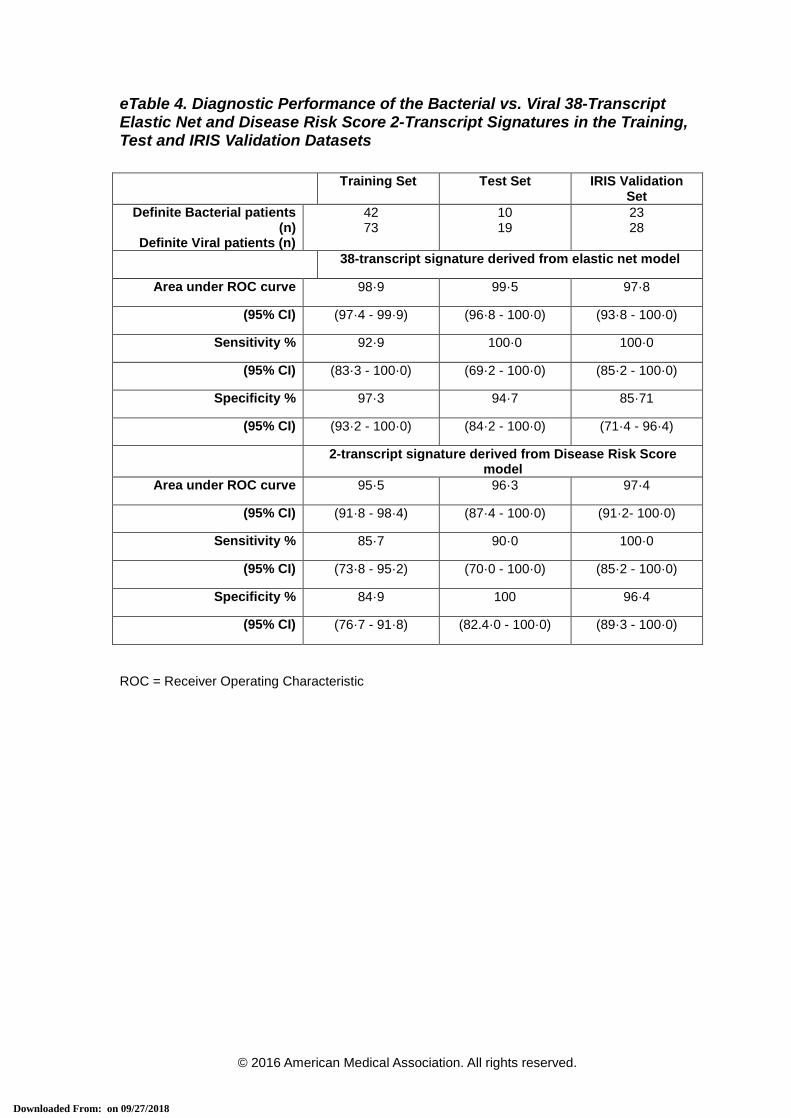
eTable 4. Diagnostic Performance of the Bacterial vs. Viral 38-Transcript Elastic Net and Disease Risk Score 2-Transcript Signatures in the Training, Test and IRIS Validation Datasets
Training Set Test Set IRIS Validation Set
Definite Bacterial patients (n)
Definite Viral patients (n)
42 73
10 19
23 28
38-transcript signature derived from elastic net model
Area under ROC curve 98·9 99·5 97·8
(95% CI) (97·4 - 99·9) (96·8 - 100·0) (93·8 - 100·0)
Sensitivity % 92·9 100·0 100·0
(95% CI) (83·3 - 100·0) (69·2 - 100·0) (85·2 - 100·0)
Specificity % 97·3 94·7 85·71
(95% CI) (93·2 - 100·0) (84·2 - 100·0) (71·4 - 96·4)
2-transcript signature derived from Disease Risk Score model
Area under ROC curve 95·5 96·3 97·4
(95% CI) (91·8 - 98·4) (87·4 - 100·0) (91·2- 100·0)
Sensitivity % 85·7 90·0 100·0
(95% CI) (73·8 - 95·2) (70·0 - 100·0) (85·2 - 100·0)
Specificity % 84·9 100 96·4
(95% CI) (76·7 - 91·8) (82.4·0 - 100·0) (89·3 - 100·0)
ROC = Receiver Operating Characteristic
© 2016 American Medical Association. All rights reserved.
Downloaded From: on 09/27/2018

eTable 5. Gene Ontology (GO) Biological Process Terms Analysis
GO Term (Biological Process)
Number of genes mapped
Expected
valuec
Over (+) or under (-)
representationd
Fold enrichmente
P-valuef
Genes associated with the GO Term
Background
Referencea
Signatureb
Cellular response to interferon-alpha
(GO:0035457)
9 3 0.01 + > 5 3.09E-03
IFIT2; OAS1; IFIT3
Response to interferon-alpha (GO:0035455)
18 4 0.03 + > 5 1.53E-04
IFIT2; OAS1; IFIT3; EIF2AK2
Oxygen transport (GO:0015671)
15 3 0.02 + > 5 1.42E-02
HBD; HBM; HBZ
Gas transport (GO:0015669)
19 3 0.03 + > 5 2.88E-02
HBD; HBM; HBZ
Negative regulation of viral genome replication
(GO:0045071)
46 5 0.07 + > 5 7.86E-05
SLPI; IFIT1; OAS1; RSAD2; EIF2AK2
Type I interferon signalling pathway (GO:0060337)
68 7 0.1 + > 5 9.68E-08
IFIT2; IFIT1; OAS1; IFI27; RSAD2; IFI6; IFIT3
Cellular response to type I interferon (GO:0071357)
68 7 0.1 + > 5 9.68E-08
IFIT2; IFIT1; OAS1; IFI27; RSAD2; IFI6; IFIT3
Response to type I interferon (GO:0034340)
69 7 0.11 + > 5 1.07E-07
IFIT2; IFIT1; OAS1; IFI27; RSAD2; IFI6; IFIT3
Regulation of viral genome replication
(GO:0045069)
70 5 0.11 + > 5 6.25E-04
SLPI; IFIT1; OAS1; RSAD2; EIF2AK2
Negative regulation of viral life cycle
84 5 0.13 + > 5 1.53E-
SLPI; IFIT1; OAS1; RSAD2; EIF2AK2
© 2016 American Medical Association. All rights reserved.
Downloaded From: on 09/27/2018

(GO:1903901) 03
Negative regulation of viral process (GO:0048525)
87 5 0.13 + > 5 1.82E-03
SLPI; IFIT1; OAS1; RSAD2; EIF2AK2
Defence response to virus (GO:0051607)
159 7 0.24 + > 5 3.36E-05
IFIT2; IFIT1; OAS1; IFI44L; RSAD2; EIF2AK2; IFIT3
Negative regulation of multi-organism process
(GO:0043901)
150 5 0.23 + > 5 2.59E-02
SLPI; IFIT1; OAS1; RSAD2; EIF2AK2
Response to virus (GO:0009615)
240 7 0.37 + > 5 5.51E-04
IFIT2; IFIT1; OAS1; IFI44L; RSAD2; EIF2AK2; IFIT3
Defence response to other organism (GO:0098542)
371 8 0.57 + > 5 5.69E-04
SLPI; IFIT2; IFIT1; OAS1; IFI44L; RSAD2; EIF2AK2; IFIT3
Immune effector process (GO:0002252)
447 8 0.69 + > 5 2.33E-03
IFIT2; IFIT1; OAS1; IFI44L; RSAD2; EIF2AK2; SERPING1; IFIT3
Cytokine-mediated signalling pathway
(GO:0019221)
487 8 0.75 + > 5 4.44E-03
IFIT2; IFIT1; OAS1; IFI27; RSAD2; IFI6; IFIT3; EBI3
Cellular response to cytokine stimulus
(GO:0071345)
632 8 0.97 + > 5 3.07E-02
IFIT2; IFIT1; OAS1; IFI27; RSAD2; IFI6; IFIT3; EBI3
Response to cytokine (GO:0034097)
730 9 1.12 + > 5 8.40E-03
IFIT2; IFIT1; OAS1; IFI27; RSAD2; IFI6; EIF2AK2; IFIT3; EBI3
Innate immune response (GO:0045087)
1012 10 1.56 + > 5 1.38E-02
IFIT2; IFIT1; OAS1; IFI27; RSAD2; IFI6; EIF2AK2; SERPING1; IFIT3; FCER1A
Immune response (GO:0006955)
1430 14 2.2 + > 5 5.82E-05
SLPI; IFIT2; IFIT1; EMR1; OAS1; IFI44L; IFI27; RSAD2; IFI6; EIF2AK2; IFIT3; SERPING1; EBI3; FCER1A
Defence response (GO:0006952)
1507 12 2.32 + > 5 9.19E-03
SLPI; IFIT2; IFIT1; OAS1; IFI27; IFI44L; RSAD2; IFI6; EIF2AK2; SERPING1; IFIT3; FCER1A
© 2016 American Medical Association. All rights reserved.
Downloaded From: on 09/27/2018

Immune system process (GO:0002376)
2163 16 3.33 + 4.81 1.67E-04
SLPI; IFIT2; HBZ; IFIT1; EMR1; MERTK; OAS1; IFI44L; IFI27; RSAD2; IFI6; EIF2AK2; IFIT3; SERPING1; EBI3; FCER1A;
Unclassified (Unclassified) 4272 6 6.57 - 0.91 0.00E+00
GYPB; EPSTI1; FAM89A; MAP3K7CL; GYPE; IFIT1B
Overrepresentation test for the genes in the 38-transcript signature for the GO: biological process Homo sapiens terms using the PANTHER Pathway resource (Bonferroni corrected) [17],[18].
a number of genes mapped to GO terms when using the background reference dataset of Homo Sapiens. The total number of genes in this dataset is 20814. b number of genes mapped to GO terms when using genes in the 38-transcript signature. The total number of genes in the signature is 36. c number of genes expected to be in signature for this category, based on the background reference dataset. d + indicates an over-representation of the GO term in the signature, - indicates an under-representation of the GO term in the signature. e GO term over-represented if >1, under-represented if <1 f Probability that the number of genes from the signature in the GO term occurred randomly.
© 2016 American Medical Association. All rights reserved.
Downloaded From: on 09/27/2018

eTable 6. Additional Validation and External Microarray Datasets
Overview of the gene expression microarray datasets used for assessment of the 2-transcript Disease Risk Score signature. Study and experimental
details, as well as the metrics for classification accuracy (i.e. Sensitivity, Specificity and Area Under the Curve (AUC) with 95% Confidence Intervals [CI])
are shown.
Results after application of the 2-transcript DRS signature
1st group 2nd group Gene Expression Omnibus accession
Reference Age (years)
Platform Sensitivity % (95%CI)
Specificity % (95%CI)
AUC % (95%CI)
Related eFigure
Meningococcal validation: 24
children
Viral group of the IRIS validation set
(after data merging)
GSE80496 Unpublished <3 Illumina Ref8-V3
91.7 (79.2-100)
96.0 (88.0-100)
92.6 (81.3-100)
eFig 6
Inflammatory validation: 30 JIA
& 18 HSP
20% Discovery Bacterial set (after
data merging)
GSE80412 Unpublished <18 Illumina HT12-V4
90.0 (70.0-100)
95.8 (89.6-100)
90.8 (73-100) eFig 7
48 bacterial: (S.aureus,
streptococcus)
31 Pediatric SLE GSE22098 Berry M (2010) [13]
<17 Illumina HT12-V3
93.5 (83.9-100)
96.1 (90.2-100)
96.6 (91.9-100)
eFig 7
12 bacterial (S.pneumoniae,
S.aureus)
10 viral (Influenza A and B)
GSE6269 – GPL570
Ramilo O (2007)[11]
<16 Affymetrix 100 (73.5-100)
90 (70-100) 96 (85-100) eFig 7
8 bacterial – mixed gram
positive & gram negative
22 viral – mixed adenovirus, HHV6,
enterovirus
GSE40396 Hu X (2013) [12]
<3 Illumina HT12-V4
100 (63.1-100)
77.3 (59.1-95.5)
89.2 (75.6-98.3)
eFig 7
© 2016 American Medical Association. All rights reserved.
Downloaded From: on 09/27/2018
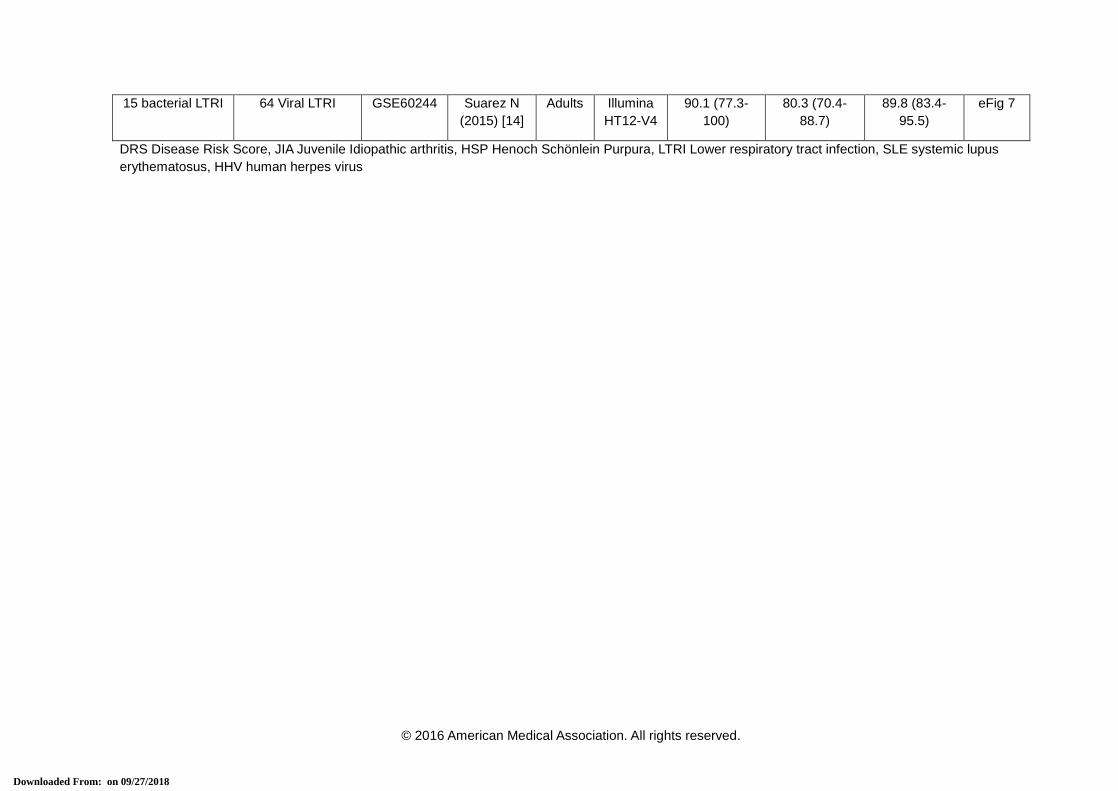
15 bacterial LTRI 64 Viral LTRI GSE60244 Suarez N (2015) [14]
Adults Illumina HT12-V4
90.1 (77.3-100)
80.3 (70.4-88.7)
89.8 (83.4-95.5)
eFig 7
DRS Disease Risk Score, JIA Juvenile Idiopathic arthritis, HSP Henoch Schönlein Purpura, LTRI Lower respiratory tract infection, SLE systemic lupus erythematosus, HHV human herpes virus
© 2016 American Medical Association. All rights reserved.
Downloaded From: on 09/27/2018
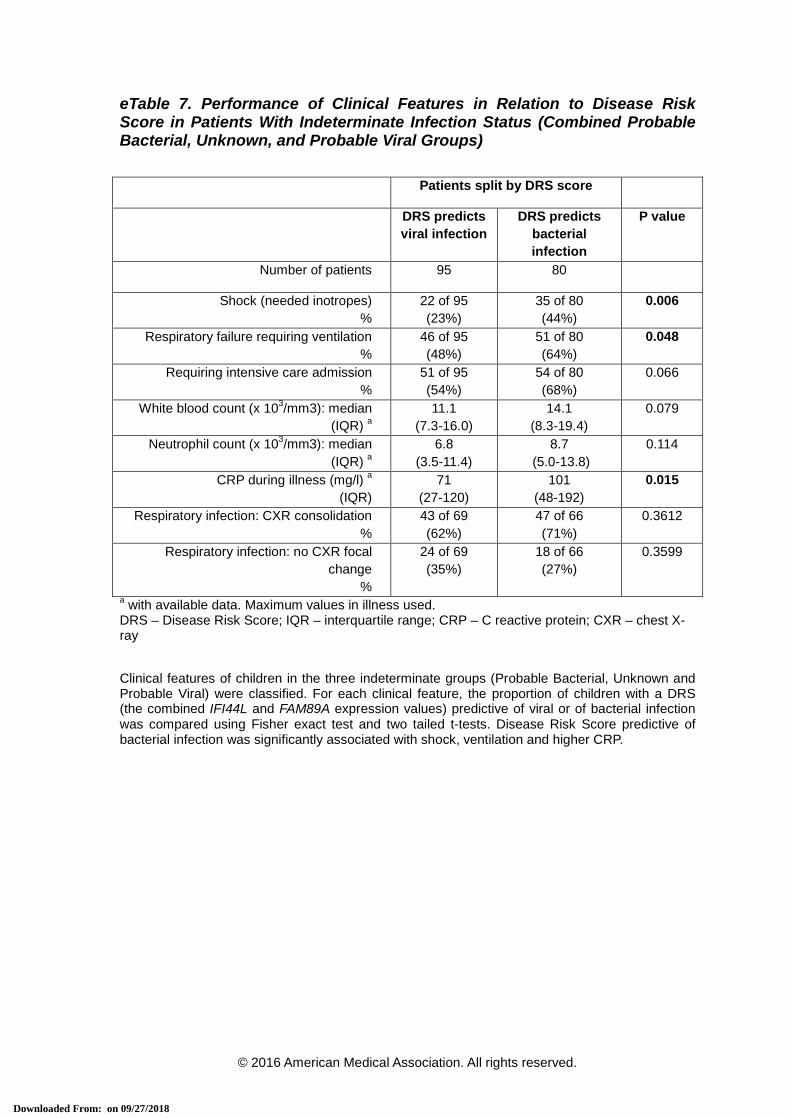
eTable 7. Performance of Clinical Features in Relation to Disease Risk Score in Patients With Indeterminate Infection Status (Combined Probable Bacterial, Unknown, and Probable Viral Groups)
Patients split by DRS score
DRS predicts viral infection
DRS predicts bacterial infection
P value
Number of patients 95 80
Shock (needed inotropes) %
22 of 95 (23%)
35 of 80 (44%)
0.006
Respiratory failure requiring ventilation %
46 of 95 (48%)
51 of 80 (64%)
0.048
Requiring intensive care admission %
51 of 95 (54%)
54 of 80 (68%)
0.066
White blood count (x 103/mm3): median (IQR) a
11.1 (7.3-16.0)
14.1 (8.3-19.4)
0.079
Neutrophil count (x 103/mm3): median (IQR) a
6.8 (3.5-11.4)
8.7 (5.0-13.8)
0.114
CRP during illness (mg/l) a
(IQR) 71
(27-120) 101
(48-192) 0.015
Respiratory infection: CXR consolidation %
43 of 69 (62%)
47 of 66 (71%)
0.3612
Respiratory infection: no CXR focal change
%
24 of 69 (35%)
18 of 66 (27%)
0.3599
a with available data. Maximum values in illness used. DRS – Disease Risk Score; IQR – interquartile range; CRP – C reactive protein; CXR – chest X-ray Clinical features of children in the three indeterminate groups (Probable Bacterial, Unknown and Probable Viral) were classified. For each clinical feature, the proportion of children with a DRS (the combined IFI44L and FAM89A expression values) predictive of viral or of bacterial infection was compared using Fisher exact test and two tailed t-tests. Disease Risk Score predictive of bacterial infection was significantly associated with shock, ventilation and higher CRP.
© 2016 American Medical Association. All rights reserved.
Downloaded From: on 09/27/2018

eReferences
1. Pathan, N., et al., Role of interleukin 6 in myocardial dysfunction of meningococcal septic
shock. Lancet, The, 2004. 363(9404): p. 203-9. 2. Petty, R.E., et al., International League of Associations for Rheumatology classification of
juvenile idiopathic arthritis: second revision, Edmonton, 2001. J Rheumatol, 2004. 31(2): p. 390-2.
3. R core development team, R: a language and environment for statistical computing. 2011. 4. Schmid, R., et al., Comparison of normalization methods for Illumina BeadChip
HumanHT-12 v3. BMC Genomics, 2010. 11: p. 349. 5. Jolliffe, I.T., Principal Component Analysis. 1986: Springer-Verlag. 6. Friedman, J., T. Hastie, and R. Tibshirani, Regularization Paths for Generalized Linear
Models via Coordinate Descent. J Stat Softw, 2010. 33(1): p. 1-22. 7. Kaforou, M., et al., Detection of tuberculosis in HIV-infected and -uninfected African
adults using whole blood RNA expression signatures: a case-control study. PLoS Med, 2013. 10(10): p. e1001538.
8. Robin, X., et al., pROC: an open-source package for R and S+ to analyze and compare ROC curves. BMC Bioinformatics, 2011. 12: p. 77.
9. Youden, W.J., Index for rating diagnostic tests. Cancer, 1950. 3(1): p. 32-5. 10. Leek, J.T., et al., The sva package for removing batch effects and other unwanted
variation in high-throughput experiments. Bioinformatics, 2012. 28(6): p. 882-3. 11. Ramilo, O., et al., Gene expression patterns in blood leukocytes discriminate patients with
acute infections. Blood, 2007. 109(5): p. 2066-77. 12. Hu, X., et al., Gene expression profiles in febrile children with defined viral and bacterial
infection. Proc Natl Acad Sci U S A, 2013. 110(31): p. 12792-7. 13. Berry, M.P., et al., An interferon-inducible neutrophil-driven blood transcriptional signature
in human tuberculosis. Nature, 2010. 466(7309): p. 973-7. 14. Suarez, N.M., et al., Superiority of transcriptional profiling over procalcitonin for
distinguishing bacterial from viral lower respiratory tract infections in hospitalized adults. J Infect Dis, 2015. 212(2): p. 213-22.
15. Benjamini, Y. and Y. Hochberg, Controlling the False Discovery Rate - a Practical and Powerful Approach to Multiple Testing. Journal of the Royal Statistical Society Series B-Methodological, 1995. 57(1): p. 289-300.
16. Smyth, G.K., Linear models and empirical bayes methods for assessing differential expression in microarray experiments. Stat Appl Genet Mol Biol, 2004. 3: p. Article3.
17. http://geneontology.org/. 18. Thomas, P.D., et al., PANTHER: a library of protein families and subfamilies indexed by
function. Genome Res, 2003. 13(9): p. 2129-41.
© 2016 American Medical Association. All rights reserved.
Downloaded From: on 09/27/2018