end term impact evaluation of resettlement action plan and...
TRANSCRIPT

End Term Impact Evaluation of Resettlement Action Planand Community Development Activities of
Rampur Hydro Electric Project
April 2015
AGRO-ECONOMIC RESEARCH CENTRE HIMACHAL PRADESH UNIVERSITY
SHIMLA-171005 (INDIA)
Report Prepared byC.S. Vaidya
Ranveer Singh

About the Centre
The Agro-Economic Research Centre (AERC) of Himachal Pradesh University was
established in December 1972 by the Ministry of Agriculture, Government of India to carry
out research and investigations in the field of Agricultural Economics in Western
Himalayan Region consisting of Himachal Pradesh and Jammu & Kashmir. This is one of
the 12 AER Centres established by the Government of India. The thrust areas of the Centre
include study of changes in rural economy; adhoc investigations of problems of interest to
the Ministry of Agriculture, Government of India; research on fundamental problems
relating to agricultural economics of the country and to provide technical advice to the
Government of India and State Government on agro-economic issues. The AER Centre is
fully financed by the Ministry of Agriculture, Government of India. The Centre has also
been taking up some adhoc studies on behalf of or in collaboration with some other national
and international agencies like World Bank, USAID, GTZ, ICIMOD, CIP, NJPC, SJVN and
different Departments of State Government. The faculty members guide the Ph. D and M.
Phil students of departments of Economics and Geography.
While program evaluation and impact evaluation studies continue to dominate the
work program of the Centre, a large number of adhoc policy oriented studies have also been
undertaken over these years. The research studies carried out by AER Centre cover a wide
spectrum of issues in the field of agricultural economy. The AER Centre has expertise in
conducting impact evaluation and economic feasibility studies for agriculture, horticulture,
animal husbandry, forestry and rural development related activities. The Centre expertise
in conducting techno economic feasibility of agricultural projects. Details at:
www.aercshimla.in

End Term Impact Evaluation of Resettlement Action Planand Community Development Activities of
Rampur Hydro Electric Project
April 2015
AGRO-ECONOMIC RESEARCH CENTRE HIMACHAL PRADESH UNIVERSITY
SHIMLA-171005 (INDIA)
Report Prepared by


ACKNOWLEDGEMENTS
The present study on “End Term Impact Evaluation of Implementation of R&R Plan and
Community Development Activities in Rampur Hydro Electric Project (HP) – 412 MW” was sponsored
by Rampur Hydro Electric Project, SJVN. The authors gratefully acknowledge financial assistance from
the RHEP, SJVN for carrying out this study report.
The authors are grateful to Mr. K.K. Gupta, Head of Project (H.O.P.), F. Badaik, Additional
General Manager (R&R), Ms. Alka Jaiswal, Senior Manager (R&R), Mrs. Kausalya Devi (Senior
Officer), R&R and other staff of RHEP, SJVN for their help in providing needed data and information,
suggestions and support in preparation of this document.
We are highly thankful to Professor A.D.N. Bajpai, Hon'ble Vice-Chancellor, H.P. University,
Shimla for his constant encouragement and valuable guidance in completing this study and making it
worthwhile.
Suggestions and comments were received at various stages of this study from Dr I.U.B. Reddy,
Senior Social Development Specialist at the World Bank, New Delhi Office. Our sincere thanks to him.
The authors are thankful to Dr. Pratap and Mr. Narender Kumar, Research Investigators, Agro-
Economic Research Centre, H.P. University, Shimla for coordinating field survey and computerisation of
data. We are also thankful to the team of field data collectors, Mr. Sujan Singh, Mr. Inder Singh, Mr.
Pawan Kumar, Mr. Lokesh. The secretarial assistance is provided by Mr. Chaman Lal and Mrs. Meera
Verma of this centre.
Shimla: 17th April 2015 Authors


CONTENTSAbbreviationsExecutive Summary ............................................................................................................................(i) - (ii)
Chapter 1: Introduction.............................................................................................................................11.1 Purpose of the Study1.2 Objective of the Study1.3 Scope of the Study1.4 Structure of the Report
Chapter 2: Approach and Methodology...................................................................................................32.1 Approach and Sample2.2 Data Collection2.3 Data Analysis
Chapter 3: Socio-Economic Impact of R&R Interventions......................................................................53.1 Demographic Profile3.2 Occupation Profile3.3 Changes in Income Pattern3.4 Changes in Housing Conditions3.5 Ownership of Assets3.6 Changes in Land Ownership and Cropping Pattern3.7 Animal Husbandry3.8 Household Expenditure and Consumption Pattern3.9 Impact on Overall Living Standards
Chapter 4: Status of R&R Interventions.................................................................................................124.1 Compensation to Landless and Homeless Families4.2 Resettlement Assistance4.3 Blast Damage Compensation4.4 Crop Damage Compensation4.5 Assistance to Non-title Holders4.6 Support to Local Schools4.7 Promotion of Fairs and Festivals4.8 Promotion of Sports4.9 Support to Advance Skill Development4.10 Women Empowerment4.11 Distribution of Pressure Cookers4.12 Employment Opportunities to Local People4.13 Health Improvement Initiatives4.14 Impact on Women4.15 Conclusion
Chapter 5: Impact of Community Development Activities ....................................................................215.1 Status of Community Development Works5.2 Impact of Community Development Works
Chapter 6: Consultations and Community Perceptions........................................................................246.1 Outcome of Consultations6.2 Perceptions of Project Impacts
Chapter 7: Conclusions ..........................................................................................................................26
Annexures .............................................................................................................................29

ABBREVIATION
AERC Agro-Economic Research Centre
B. Tech Bachelor of Technology
BAMS Bachelor of Ayurveda Medicine and Surgery
BCA Bachelor of Computer Application
BDS Bachelor of Dental Surgery
BOD Board of Directors
CD Community Development
CPSU Central Public Sector Undertaking
Ha Hectare (1ha = 2.5 acre, 12.50 bighas)
HH/hh household
ITI Industrial Training Institute
LADA Local Area Development Agency
PIC Public Information Centre
PAAFs Project Affected Area Families
PAFs Project Affected Families
PAP Project Affected Population
PTI Physical Training Instructor
R&R Resettlement & Rehabilitation
RHEP Rampur Hydro Electric Project
SIE Social Impact Evaluation
SJVN Satluj Jal Vidyut Nigam

The Rampur Hydro Electric Project (RHEP) has been constructed on the right bank of river Sutlej in District Kullu near to Rampur town with an installed capacity of 412 megawatts. The land has been acquired from four revenue villages of Bayal, Koyal, Averi and Duttnagar for the construction of project infrastructure and other activities. A total of 100 hectares of land were acquired/diverted from forest land for project activities of which 29 hectares were privately owned in these four villages. This has impacted the population, directly or indirectly. In order to mitigate any adverse impacts on the livelihoods and other social and economic fabric of the societies, SJVN implemented Resettlement & Rehabilitation plan for project affected families (PAFs) along with various community development initiatives. After the completion of RHEP, the efficacy of such measures has to be evaluated and the present study is an attempt in this direction.
Objectives and Methodology: The main objective of the study is to evaluate the final impact of R&R activities on PAFs. This has been done by comparing the current values of relevant parameter with same during the base line study (2005) and also with the control sample. The scope of the study required the primary and secondary data to be collected on selected indicators in respect of persons living in the project vicinity who will be directly or indirectly affected as a result of project activities. The data was collected on specifically designed schedules. The project affected families (PAFs) were located in villages Bayal, Koyal, Averi and Duttnagar. The 92 PAFs residing in these four villages were census surveyed (66% of total affected families) along with a control sample of 80 households located in four project affected and also in villages Brow and Randal. In addition to household survey, the study also relies on focused group discussions with village leaders, Panchayat officials and other key stakeholders. The data was collected during the period December 29, 2014 to January 4, 2015 by team of seven experienced field investigators.
Main findings: All the land acquisition and resettlement and rehabilitation activities
EXECUTIVE SUMMARY
planned under RAP have been completed. As regards community works due to change in the Implementation arrangement with district administration as an implementing agency, while most of the works are completed, but still few works are in progress and will continue. The main work pending is the implementation of integrated drinking water scheme for the affected villages. The outcome of household level survey and consultations is summarized here. The data reveal that the family size of the PAFs has declined from 4.55 to 4.21 persons per family. The sex ratio has declined marginally (from 1037 to 1013 females per 1000 males). The literacy has increased from 83 to 88 per cent. The workers in total population remained almost constant at 59.50 per cent and as a result the dependency ratio also remained constant at about 0.66. During current survey about 66 per cent workers reported agriculture as the main occupation which increased from about 60 per cent during base line period. No person from PAF was now working as agricultural labor but wage labor increased from 4.32 to 4.65 per cent. There were now more people engaged in business (8.96 % against 5.60 % earlier) and working in government and private service (19.35% against 15.52% in base period).
Majority of households rationally invested the compensation amount in purchase of land (18% households), in fixed deposits (68% households) and house construction (46% households). The percentage of households having some running business declined from 12 to 10 per cent, households having shops increased from 9 to 10 per cent and those having taxies remained constant at 7 per cent.
The average annual household income (at 2005 prices) during the base line period was Rs.120639 while in 2014 it increased to Rs.387204. At current prices the base line income comes to Rs.251472. In 2014 income of control households is Rs.152405. Thus, the average income of PAPs is increased by 54%from baseline income at current level and 87% higher than of controlled population. As regards in income changes among individual families as many as 79 families (87%) have
(i)

reported increased income compared to baseline income at current level. Hence, it is quite clear that the income of PAFs has improved considerably when compared with base line income or control household income. The average per capita monthly expenditure, on current prices, of PAFs on food items has increased from Rs.5302 to Rs.6226 and that of non-food items from Rs. 2473 to Rs. 3572 per month, showing improvement in their consumption pattern and standard of living. This is reflected from the finding that now 95 per cent households have televisions, against 72 per cent earlier, 90 per cent households have refrigerators, against 72 per cent earlier and now 95 per cent households have LPG connections, against 82 per cent earlier. Same way, 7 per cent households now have 2-wheelers against 6 per cent earlier and 42 per cent households now have 4-wheelers against 12 per cent earlier. Among those whose income have declined, 11 out of 12 families have improved in terms of their ownership of assets. Thus 99% of PAFs have improved their living standards measured in terms of real incomes or ownership of assets over baseline and also compared with controlled population. This also compares with the perceptions expressed by 74 per cent sample responded saying that their standards of living is improved and another 24% mentioning that their living standards is more or less same as before.
A significant change has been noticed in the housing situation. Now more people live in pucca (permanent) houses (100% as compared to 95% earlier), more families now have separate toilets (91% as compared to 68% earlier), and have separate kitchen within house (95% as against 79% earlier). The average size of house has increased from 578
2ft to 985 ft and the average number of rooms has gone up from 3.7 to 6.85 per house. However, the average size of land holding of the families has declined from 0.83 ha to 0.45 ha due to loss of land for the project. As compared to 2005 data the overall yield rate of maize has not changed but that of wheat has increased from1792 to 2632 Kg./ha and that of paddy from 3137 to 3495 Kg./ha. The value
2
productivity of land, at current prices, has doubled from Rs. 121328 to Rs. 242340 per hectare. Number of all types of livestock owned by the PAFs has declined; during 2005 on an average a family owned 2.2 livestock which declined to 1.46 only in 2014. Similarly, the number of milch cattle declined from 1.99 to 0.86 per household.
Conclusions. The data collected from the sample PAFs clearly shows that the overall living standard of the families has improved due to R&R activities of RHEP. Following changes are noteworthy: There is significant increase in the proportion of workers in the regular employment, especially with SJVN and with its contractors as daily wage earners. The earning capacity has been increased. Diversification of income and employment avenues through income generation schemes, towards business and other self-employment activities, is taking place and 99% have improved their living standard when measured with real incomes or ownership of assets over baseline and also with controlled population, there is improvement in the housing standard. The quality of health care has also improved due to enhancement of consultation and diagnostic facilities with the introduction of mobile health unit, which tours villages in the project area. The RHEP has taken measures to strengthen the existing infrastructure facilities, including health facilities and education and roads which are providing immense benefits to the PAFs in the project area.
Project affected families have received full and adequate compensation. The compensation amount has been used rationally and judiciously by the families. Overall situation of all the project affected people is better now. During the post commissioning stage, the project affected families will receive 100 units of electricity per month for 10 years and the long term residents in the affected villagers will receive annuity payment out of revenue generated out of sale of 1% free power provided to the State Government by project entity.
(ii)

1
1. Satluj Jal Vidyut Nigam (SJVN) a Central Public Sector Undertaking (CPSU) under the Ministry of Power, Government of India (GOI) is a joint venture between the GOI and Government of Himachal Pradesh (GOHP). The Rampur Hydro Electric Project (RHEP) has been constructed on the bank of river Satluj in District Kullu and Shimla in Himachal Pradesh. The execution of the project was started in the year 2007 for which 29 hectares of private land has been acquired from 167 land owners in District Shimla and Kullu. These 167 land owners comprise of 139 Project Affected Families (PAFs), out of these, 19 are physically displaced and 57 became landless after acquisition of their lands.
2. It is a hard fact that a well knitted socio economic structure gets disrupted by involuntary displacement of the local communities due to construction of any project. SJVN being a responsible corporate citizen is highly concerned of this fact and therefore, is committed to improve or at least restore their lost socio-economic status in the post impact period and enable them to cope-up with the new scenario of socio economic condition. With this view SJVN besides duly compensating the affected families for their lost land and assets, has also formulated and adopted a Resettlement & Rehabilitation (R&R) Plan which included a community development plan also with a budget outlay of Rs. 53.84 crores. The R&R Plan was approved by Board of Directors (BOD) in its meeting dated 16th March, 2006 and since then it is under implementat ion. The main provis ions envisaged in the R&R Plan for the PAFs are house plot for houseless families, rehabilitation grant for landless families, support for income generation, health care services, education facility, technical education for capacity building, drinking water, infrastructure works in the area etc. In order to mitigate any adverse impacts on the livelihoods and other social and economic fabric of the societies, SJVN implemented R & R plan for project affected
Chapter 1
Introduction
families along with various community development initiatives. After the completion of RHEP, the efficacy of such measures has to be evaluated and the present study is an attempt in this direction.
3. The R&R implementation in RHEP has been started in year 2006 and a midterm impact evaluation was carried out by an external agency SMEC, New Delhi. However, as per provision of R&R strategy as stipulated under Para 5.63 of Resettlement Action Plan (RAP) final evaluation is required to be carried out to review the R&R implementation progress and undertake verification and consultation with affected people and submit the evaluation report. Hence, present study on Final Impact Evaluation of Implementation of R&R Plan and Community Development Activities, Rampur Hydro Electric Project (HP) – 412 MW has been under taken with the purpose of:
1.1 Purpose of the study
4. The purpose of the study is:
lTo evaluate the impact of implementation outcome of RAP, Community Development Plan and LADA Plan implementation on PAFs and local communities in RHEP and to contribute to the justification of its implementation in the future projects of SJVN.
lTo assess the impact of compensation and assistance provided to the affected people in improving their living standards and contribution of community development programs for local area development.
1.2 Objective of the study
5. The object ive of th is study is to independently evaluate the impact of R&R implementation on the PAFs and local communities residing in the vicinity of the project. Further, the objective is to access whether capacity development and institutional changes as well as other pre-requisites for

2
sustainability have been attained as a part of impact of R&R implementation. More specifically, the study has following objectives:
a) Evaluation of the social impact of R&R implementation and related interventions wi th regard to educat ion, heal th, community development, cultural practices etc. like scholarship scheme, technical education scheme, mobile health van, infrastructural facilities to schools, grants for promotion of cultural practices.
b) Evaluation of economic impact of R&R implementation and related intervention with regard to changes in living standards in te rms o f i ncome, occupa t ion , consumption, ownership of assets (land and land based as well as households), yields, housing conditions, savings and indebtedness etc.
c) Evaluation of the broader impact of R&R implementation and related interventions with regard to capacity development and socio political institutional changes as a part of the pre-requisites for sustainable development.
d) Evaluation of the impact of infrastructural development works with regard to the easement felt by the local communities.
1.3 Scope of the study
6. The present study covered RAP, Community D e v e l o p m e n t P l a n a n d L A D A P l a n implementation on PAFs and local communities in RHEP and related interventions carried out in RHEP from the year 2006 onwards. The main focus of the evaluation is on extending R&R benefits to the PAFs and local communities under R&R Plan of RHEP and impact thereof. The impact evaluation has been done with the present condition of the PAFs and local community's vis-à-vis the condition prevailing at the time of acquisition of the land as well socio-economic condition of controlled population of similar socio-economic background. Both
positive and negative impact has been measured in both quantitative and qualitative way. Perception of PAFs and local community regarding impact felt by them are studied.
7. The main areas of impact analysis carried out include: occupation and income, housing, household and agricultural/livestock assets, investment and consumption patterns and impact of support provided by the project to welfare schemes and local infrastructure development.
8. The key indicators measured in the study include: changes in per capita income, occupation, housing conditions, house hold assets, consumption pattern, etc against the baseline data available in RAP.
9. The impact analysis is category wise of PAFs i.e. landless, houseless, vulnerable group, tenant, and other local residents etc. as well as overall impact on the whole affected community. The scope of the study also includes identification of the key outstanding implementation actions and proposes any remedial measures that are necessary to achieve the intended objectives of R&R and community development activities.
1.4 Structure of the report
10. The present study has been divided into seven chapters. The subject matter of the first chapter is introducing the problems and presents the objectives of the study. The second chapter highlights the approach and methodology adopted for the study and classification of the sample etc. In the third chapter Socio-Economic Impact of R&R Interventions have been presented. Status of R&R Interventions has been presented in fourth c h a p t e r a n d I m p a c t o f C o m m u n i t y Development Activities is the subject matter of fifth chapter. The Public Consultations and Community Perceptions have been presented in sixth chapter. Seventh chapter highlights the conclusions and recommendations of the study.

3
2.1 Approach and Sample
11. The main objective of the study is to
evaluate the final impact of R&R activities on
PAFs. This has been done by comparing the
current values of relevant parameter with same
during the base line study (2005) and also with
the controlled sample households. Hence, 'with
and without' and 'after and before' approaches
have been used in the present study. The
scope of the study required the primary and
secondary data to be collected on selected
indicators in respect of persons living in the
project vicinity who will be directly or indirectly
affected as a result of project activities. The
project affected families were located in villages
Bayal, Koyal, Averi and Duttnagar. The 92
project affected families residing in these four
villages were census surveyed along with a
control sample of 80 households located in
four project affected and also in villages Brow
and Randal. The distribution of sample of
pro ject a f fected and contro l sample
households, has been presented in Table-2.1.
In addition to household survey, the study also
relies on focused group discussions with
village leaders, Panchayat officials and other
key stakeholders.
2.2 Data Collection
12. A well designed schedule for data
collection has been used for the study. The
Table-2.1: Classification of Sampled Households
Village PAFs Controlled HH Total
Bayal 62 3 65
Koyal 22 18 40
Averi 1 11 12
Duttnagar 6 17 23
Brow 0 1 1
Randal 1 30 31
Total 92 80 172
Chapter 2
Approach and Methodology
data has been collected by personal interview
method by employing the trained investigators.
The sample survey has been supplemented
with community meetings involving the
community leaders and other influential
persons to evaluate their aspirations and
perceptions about accomplishment and
impacts. These meetings have been convened
in each of the selected vil lages and
simultaneously, public consultations have been
done in which all interested persons were
allowed to participate. The public consultations
have the objective of evaluation of public
opinion at large about the project's social
impact.
13. The data on amount of various grant and
compensation distributed to the affected
families, community works carried out under
the project have been obtained from the RHEP
website. Besides, the study has also referred
the following documents:
lThe list of compensation recipients as per
Award announced by Land Acquisition
Collectors.
lThe list of PAFs supplied by Deputy
Commissioner (Kul lu) and Deputy
Commissioner (Shimla).
lThe Resettlement and Rehabilitation Plan
and Community Development Plan of
RHEP.

4
l
by SJVN and Govt. of HP.
lMonitoring reports prepared by AERC, HP
University.
lMid Term SIE report submitted by SMEC.
lRampur Hydro Power Project Land
Acquisition, Resettlement, Community
Development Practices by World Bank.
R&R Scheme of RHEP as mutually agreed 2.3 Data Analysis
14. The data has been analyzed with simple
tabular analysis for arriving at the results of
study. The results of the study were also
presented through Pie and Bar diagrams. The
data was collected during the period December
29, 2014 to January 4, 2015 by team of seven
experienced field investigators.

5
15. This chapter presents the comparative
background of project affected households
during current and baseline periods. The
situation of control sample has also been
presented along with wherever required. This
forms the background for evaluation of
economic impact with respect to relevant
parameters like income, occupation, housing
conditions, asset ownership pattern and
consumption etc., as a result of implementation
of R&R policies. The results have been
summarized in Table 3.1 and details can be
referred to from annexure 3.1 to 3.28. All the
households surveyed belonged to Hindu
religion and had Hindi as their mother tongue.
3.1. Demographic Profile
16. There are no significant changes in the
demographic profile of the sample, the
percentage of male being about 51 per cent
during current evaluation as compared to
about 49 per cent during base period. Family
size and sex ratio declined in current period as
compared to base year (Fig. 1 and 2).
17. The dependency ratio increased marginally
to 0.67 from 0.66 during base period but this
situation is far better than the control sample
which has a dependency ratio of 1.16, Fig. 3.
Chapter 3
Socio-Economic Impact of R&R Interventions
3.2. Educational Profile
18. The percentage of illiterates has gone down
from about 17 per cent to about 12 per cent
during current period. There is appreciable
increase in the percentage of persons have
qualification of Senior Secondary level and
above. As such the literacy level among males
has increased from 91 per cent to 92.14 per
cent whereas in case of females it has
increased from 76 to 83 per cent from base
period, Table 3.3. Combined together the
literacy level increased to more than 88 per
cent from 83 per cent during base period (Fig.
4).
4.21
4.55
4.5
4
4.1
4.2
4.3
4.4
4.5
4.6
2014 2005 Control
Fig. 1: Changes in Family Size in Project Area (Persons / Family)
Fig. 2: Changes in Sex Ratio in Project Area (Females / 1000 Males)
Fig. 3: Changes in Dependency Ratio in Project Area (Non Worker / Worker)
1013
1037
922
860
880
900
920
940
960
980
1000
1020
1040
1060
2014 2005 Control
0.67 0.66
1.16
0
0.2
0.4
0.6
0.8
1
1.2
1.4
2014 2005 Control

6
Fig. 4: Changes in Literacy in Project Area (%)
Fig. 5: Changes in Occupation Pattern of Workers in Project Area (% of workers)
Fig. 6: Changes in Level of Annual Income in Project Area (Rs/hh)
92
8388
91
768385
69
77
0
10
20
30
40
50
60
70
80
90
100
Male Female Total
2014 2005 Control
3.3. Occupation Profile
19. Agriculture is the main occupation of
workers. The percentage of male workers
engaged in agriculture declined by about 3 per
cent whereas the percentage of female workers
increased from about 71 percent to 92 percent.
This scenario is the result of alternate and
comparatively higher paying job opportunities
made available mainly by RHEP. Women had
to compensate the labour requirements by
working on farms. There were about 3 percent
workers working as agriculture labor which
occupation is now completely absent. The
percentage of workers engaged in non-
agriculture labor, service, business and rural
artisans witnessed an increase during the
evaluation period (Fig. 5).
2014 2005 Control
66
5
19
9
60
4
16
6
48
20
26
6
0
10
20
30
40
50
60
70
Agriculture Non-Agriculture
Labour
Service Business
3.4. Changes in Income Patterns
20. Agriculture still remained main source of income for majority of households but the percentage of such households declined from about 90 percent to 63 percent. The percentage of households deriving income from wage labor declined significantly from about 41 percent to 10 percent.
21. Level of Income: The current income level of PAPs has increased by 54% over baseline income at current level and this is 88% higher compared to controlled population. Thus, the project interventions have made major impacts among the PAPs. The current average annual income is INR 3,87,204 compared to INR 2,07,257 of controlled population and INR 2,51,472 of baseline income at current level (Fig. 6).
387204
251472
207257
0
50000
100000
150000
200000
250000
300000
350000
400000
450000
2014 2005 Control
22. Changes in Income Level at Individual Family Levels: When the income levels are compared at individual family adjusting to current levels, it is observed that 79 of 91 families (87%) have improved incomes when compared with real baseline income levels. Further, analysis indicates that 32% of 91 families have improved their income by more than 100% as high as 425% in one of the family. Another 19% have improved their income between 50-100% and only in case of 13% there is marginal decrease in the income levels. The detail are provided below and individual families income changes are shown in Annexures 3.29.

7
Increase in income at current levels % Number Percentage Remarks
More than 100% 29 31.86 Significant improvement
Between 51-99% 17 18.68 High Improvement
Between 26-50% 13 14.28 Improved
Upto 25% 20 21.98 Marginal Improvement
Decrease income 12 13.20 Marginal decrease
TOTAL 91* 100.00
* One family did not report his income.
23. Income from business: The percentage of
households running some sort of business
declined from 11.72 percent during base
period to 9.78 per cent currently. No
household had any outstanding loans during
current evaluation which amount averaged at
Rs. 81 thousand during base period. The
number of households having shops remained
unchanged but in percentage terms it
increased from 6.21 to 9.78 percent. About half
the shops were general stores followed by
provision store. Most prevalent commercial
asset remained to be shops but some of the
households had taxies, pickup vans etc. also.
24. The number of taxies declined from 7 to 2
over this period whereas number of pickup
vans increased from 1 to 3, one household also
having a truck. The average monthly income
declined by about 45 percent in comparison to
base period due to decline in number of taxies
and income from pickup vans increased by 120
percent. There was also a significant increase
in income from general store and auto repair
shops.
3.5. Changes in Housing Conditions
25. All the sampled households had houses
during the current survey but during the base
period only 95 percent households owned the
houses. There is significant improvement in
the type of houses as the percentage of
households having pucca houses was about
98 percent during current period in comparison
to only about 35 percent households having
pucca houses during base period. All the
sampled households now had separate kitchen
and toilet, during base period only about 79
and 68 percent households had these
amenities (Fig. 7). About 80 percent of the
households now had separate animal shed
whereas about 71 percent households had
separate animal sheds during the year 2005.
Fig. 7: Changes in Level of Residential Building in Project Area (% of hh)
Fig. 8: Changes in average number of residential rooms in Project Area (No./hh)
95
7973
91
6873
0
10
20
30
40
50
60
70
80
90
100
2014 2005 Control
Separate Kitchen Separate Toilet
0
1
2
3
4
5
6
7
8
2014
6.85
2005
3.7
Control
4.33

8
New constructed house
Old house acquired
The average number of residential rooms per
household has increased during the period
under study (Fig. 8). The average size of the
houses is 985 sq.ft. (70% higher as compared
with baseline and 175% higher to control
households) compared to 578 sq.ft. during
baseline and only 358 sq.ft. for the controlled
population.
3.6 Ownership of Assets
26. The number of households having
television increased from about 72 percent
during base period to almost 95 percent during
current evaluation compared to 81 for
controlled population. Similarly, the percentage
of households owning refrigerators increased
from about 46 to 80 percent and that owning
LPG connections from about 81 to 95 percent.
The analysis has been further extended to
include the total number of modern durables
with the sampled households. It is indicated
that the number of televisions were slightly
more than one in each household, Fig. 9.
When compared with controlled population.
The PAPs are better off in respect to all types of
assets owned by them.
3.7 Changes Land Ownership and Cropping
Pattern
27. Land ownership: Per household land with
sampled households during current survey
average at 0.45 hectare which declined from
0.83 hectare during the year 2005 but still
better than control households (Fig. 10). The
per household land holding with control
sample was still smaller at 0.30 hectare. This
indicates that the average land holding
declined by about 46 percent over the year
Fig. 9: Changes in ownership of modern durables in Project Area (% of hh)
Fig. 10: Changes in Size of Land Holding in Project Area (ha/hh)
95
46
80
95
72
8281
54
80
0
10
20
30
40
50
60
70
80
90
100
TV Refrigerator LPG
2014 2005 Control
0.45
0.83
0.3
0
0.1
0.2
0.3
0.4
0.5
0.6
0.7
0.8
0.9
2014 2005 Control

9
2005. This decline was about 48 percent in
case of agriculture land and 43 per cent in case
of horticultural land.
28. Cropping Pattern: There has been a
change in number of households cultivating
different crops. The percentage of households
cultivating maize decline from about 29 percent
during the year 2005 to 15 percent during
current survey. Similar decline was observed in
case of wheat also the respective figures being
about 72 and 64 percent. The percentage of
households cultivating paddy remained almost
constant at about 64 percent. There was
signif icant decl ined in percentage of
households cultivating different vegetables. It
is also indicated that larger number of
households have opted cultivation of apples
and pears instead of almonds.
Fig. 11: Changes in Productivity of Major Crops in Project Area (kg/ha)
Fig. 12: Changes in Value Productivity of Land in Project Area (Rs / ha)
2632
1900
3495
1792 1900
3137
1460
1750
3150
0
500
1000
1500
2000
2500
3000
3500
4000
Yield of Wheat Yield of Maize Yield of Paddy
2014 2005 Control
29. The total cropped area, per household, was
0.63 hectare a decline of about 47 per cent in
comparison to base year. There was significant
decline in area under crops like maize, paddy,
wheat and barley. The area under pulses and
vegetables formed a negligible proportion in
aggregate cropping pattern during current
survey. The analysis reveals that the yield of
wheat and paddy on PAFs has increased while
it was stagnant in case of maize. The level of
yield of major crops is presented in Fig. 11.
30. Crop Production Pattern: The value of
crop output has increased from 1.21 lakh per
hectare in base year to 2.42 lakh per hectare in
current period, Fig. 12.
242340
121328
41050
0
50000
100000
150000
200000
250000
300000
2014 2005 Control
3.8. Animal Husbandry
31. There is appreciable decline in number of
households keeping draught animals for
agricultural purposes. During the base period
about 28 per cent households had draught
animals which declined to about 4 per cent.
There was also a declined in number in
households keeping milch animals, from about
74 percent to 68 percent currently. There was
a marginal increase in number of households
keeping sheep and goats.
32. There was 78 percent decline in number of
draught animals per household whereas this
decline was about 19 percent in case of milch
animals. In total there was a decline of about
39 percent in livestock holding of the sampled
households. The main reason for this decline is
the shift in focus from agriculture and animal
husbandry to business and service as the main
source of income generation. It was found that
about half of the households having draught
animals owned cross breeds of these animals
whereas about 32 per cent of the owning
households had cross breed milch animals.
The average numbers of livestock are shown in
Fig. 13.

10
Fig. 13: Changes in Livestock Holding in Project Area (No. / hh)
Fig. 14: Changes in Consumption Expenditure in Project Area (Rs. / hh)
1.46
2.12
1.43
0
0.5
1
1.5
2
2.5
2014 2005 Control
3.9 Household Expenditure and
Consumption Pattern
33. The quantity of rice, wheat and pulses
consumed have increased whereas that of
maize, vegetables, fruits, milk and sugar have
declined in comparison to base period. But the
expenditure on these items has increased
indicating that each household's expenditure
has increased by about 55 percent over the
base period. The consumption expenditure on
non-food items was higher by about 137 per
cent over the base period indicating that the
total monthly consumption expenditure has
more than doubled in comparison to base
period. The increase in consumption
expenditure on non-food items was the result of
55 per cent increase in income in real terms.
The average monthly consumption expenditure
is shown in Fig. 14.
3.10 Impact on Overall Living Standards
34. The overall living standards of PAPs in term of key socio-economic indicators has improved considerably when compared with baseline and controlled, as summarized in Table 3.1. The average income is increased by 54% compared to baseline and 87% to controlled population. In terms of individual income, 87%families reported higher income at current prices in comparison to baseline period. Among the remaining 13% families, the changes in asset ownership was examined, where in 11 out of 12 families showed improvement in term of ownership of assets. Thus, 99% have improved their living standards when compared with real incomes or asset ownership (Annexure 3.30). This situation is also reflected from the perceptions expressed by the people when asked about the changes in their overall living standards compared to before project implementation, where 74% have mentioned their living standards are improved and another 24% mentioned that their living standards are more or less same as before (Annexure 3.31). In terms of employment, the proportion of employees in business and service increased from baseline, but the proportion of those in service is lower as compared to the controlled population. The average size of house is also increased by 70% over baseline and 175% bigger than controlled population. The basic facilities such as kitchen, bath and use of LPG are also improved compared to baseline situation and controlled population. The ownership of assets shows that ownership of four-wheeler increased from 12% to 42% and there is also increase in terms of proportion of those owning TV and refrigerator over baseline and controlled population. The average consumption on food and non food items also increased by 15% and 44% for food and non- food item at the current price levels and is higher than controlled population. Thus, it is concluded that the compensation and other assistance received from the project has considerable impact in terms of improving the overall living standards. The details are presented in Table 3.1 and additional data on socio-economic data is presented in Annexures.
6116
5302 5150
3572
2473 2575
0
1000
2000
3000
4000
5000
6000
7000
2014 2005 Control
Food Items Non Food Items

11
Table 3.1: Changes in Key Socio Economic Key indicators
No Indicator Baseline
( 2005)
N=143
Current
( 2014)
N=92
Control
( 2014)
N= 80
1 Literacy (%) 83.00 88.00 77.00
2 Proportion of Wage labour (%) 4.32 4.65 20.22
3 Proportion of those in business (%) 5.60 8.96 6.01
4 Proportion of those in service (%) 15.52 19.35 26.32
5 Average annual Income at current levels (INR) 2,51,472 3,87,204 2,07,257
6 % of families earning more income than base line at current level (%)
NA 87.00 NA
7 Average house size (sq. ft.) 578 985 358
8 % of household living in Pucca houses 35.00 98.00 69.00
9 % of families having separate Kitchens 79.00 100.00 73.00
10 % of families having separate toilet 68.00 62.00
11 % families having TV 72.00 100.00
100.00
81.00
12 % families owning Refrigerator 46.00 100.00 54.00
13 % families using LPG 82.00 95.00 80.00
14 % families owning four wheeler 12.03 42.00 12.50
15 Average Land holding ( ha) 0.83 0.45 0.30
16 Average number of livestock 2.37 1.46 1.43
17 Consumption of food item in Rs/year (at current price level)
5,302 6,116 5,150
18 Consumption of non-food items in Rs/year (at current price level)
2,473 3,572 2,575

12
Chapter 4
Status of R&R Interventions
37. These enhanced rates became basis for acquisition of additional private land acquired during the project implementation and made this subsequent land acquisition easier and faster. The valuation of structures was undertaken through a third party, an approved valuer of the State Government, who used the item rate method, namely the Himachal Pradesh PWD schedule of rates and the prevailing market premium on these rates.
4.2 Resettlement Assistance
38. The people who were render landless were paid rehabilitation grants based on the land lost and the total amount paid on this account was Rs. 130 lakh. In addition, 51 vulnerable families were paid additional cash support. In addition, vehicles were hired from 59 families who have received monthly income from this activity. In addition, local people also received petty contacts and employment under the contractors. The Key land acquisition and resettlement activities implemented under this project are summarized below.
35. The present chapter deals with various interventions like compensation and cash grants paid to the project affected people.
4.1 Compensation to Landless and Homeless Families
36. At the time of land acquisition, the compensation offered was as per the Land Acquisition Act, based on prevailing land rates in 2005, classified by type and ranged between Rs. 30,000 to 60,000 per bigha, approximately 10 times lower than the rates in the adjoining villages. Thus, these rates were not accepted by the land owners. In order to overcome this dissatisfaction, a District Level Committee was constituted in December 2005 with the Deputy Commissioner as chairman and senior r e p r e s e n t a t i v e s o f k e y g o v e r n m e n t departments including the public works department (PWD), forests, agriculture, and horticulture. This committee finally fixed compensation rates varying between Rs. 5,80,000 to 6,00,000 per bigha which is much higher than the original rate.
Table 4.1: Implementation Progress of Land Acquisition and Resettlement Activities
Sl. No.
Activities Target Progress Remarks
1 Private land acquisition (ha) 29.86 29.86
(100%)
(includes 0.76 ha of land purchased through direct negotiations)
2 Payment of Compensation to Land owners (Nos.)
167 167
(100%)
(Rs. 2550 lakh paid). Includes 6 land owners who have been paid through direct purchase
3 Disbursement of Rehabilitation Grant to landless families (Nos.)
57 57
(100%)
(Rs. 130 lakh paid)
3 Allotment of house plots
to displaced families (Nos.)
19 18
(95%)
Includes 4 families who were offered cash in lieu of plot. One PAF has filed case in the court
4 Financial assistance to vulnerable families
51 51
(100%)
6 Hiring of taxies from local people (in vehicle months)
600 3871
(645%)
7 Petty contracts awarded to local people by SJVNL
50 33 7.70
(675%)
In addition, Rs. 10691 lakh worth works have been awarded by the contractors.
8 Sponsorship to Technical Education (Nos.)
155 195
(125%)
Out of 195 students, 174 (89.2%) have completed the courses.
Note: The figures in parentheses indicate percentages

13
4.3 Blast Damage Compensation
39. The study conducted by Central Institute of Mining & Fuel Research, Dhanbad found that the vibrations caused by the blast were of safe level for the structures located in the vicinity of the project. The drilling and blasting patterns were of correct design based on latest developments in explosive and initiation technology reflecting a high degree of safety consciousness with minimum impact on environment. The study also concluded that in majority of the cases the cracking/damage to houses was mainly due to ground/foundation settlement. The villagers attributed the damage to blasting mainly due to perceptible levels of vibrations and sound which caused fear psychosis among project affected population. According the report such insignificant level of vibrations could not cause damage to the structure and they concluded that the blasting practices followed by RHEP was safe and could not cause structural damage as alleged by the villagers. Despite this, RHEP decided to settle the issue amicably by releasing the blast damage compensation of Rs.507.30 lacs was assessed and released to 5283 families in district Kullu and Shimla. In district Kullu a compensation of Rs.469.50 lacs was released to 4673 families and in district Shimla, a sum of Rs.37.80 lacs was released as compensation to 610 families.
4.4 Crop Damage Compensation
40. RHEP has been cautious in minimizing the dust pollution as a result of project activities. It incurred an expenditure of Rs.212 lacs for water sprinkling to arrest the dust pollution. But the farmers of the area thought that the dust pollution was adversely affecting their farm productivity. In order to resolve the issue, Ch. Sarvan Kumar Krishi Vishva Vidyalaya, Palampur, Himachal Pradesh was requested to conduct a study highlighting the impact of project activity on local farm economy. The study was conducted during the year 2008 concluded that dust pollution was not responsible for decline in the farm productivity but was the result of poor farm management practices adopted by the farmers. These findings were not acceptable to farmers who
raised the issue in LADA meeting and the chairman of the meeting constituted a committee to assess the possibility of monetary assistance. RHEP, in order to settle the issue and maintaining good relations with farming community, decided to pay crop damage compensation to farmers. During the year 2008-09 a compensation of Rs. 299.80 lacs was assessed and released to 4022 beneficiaries whose crop was damaged due to project activities. In district Kullu the compensation paid was Rs.153.20 lacs paid to 3571 beneficiaries whereas in district Shimla 451 beneficiaries received a compensation of Rs.146.60 lacs. During the next year i.e. the year 2009-10, the total compensation assessed and released for crop damage was Rs.403.60 lacs paid to 3751 beneficiaries of district Kullu.
4.5 Assistance to Non-title Holders
41. There was only one encroacher who was paid a rehabilitation grant of Rs.34000 including two times shifting allowance and 12 months rental allowance @ of Rs.2000 per month. The rehabilitation grant was also paid to two tenants who received Rs.22000 including three months rental allowance @ Rs.2000 and shifting allowance.
4.6 Support to Local Schools
42. In order to protect the environment, first grant of Rs.2.65 lacs was released for plantation work in and around the schools during December 2007. This was to not only have positive impact on environment but would inculcate this habit among the younger
Support to Local School
14
population. After this, second grant of Rs. 46 lacs was released to 49 schools for purchasing infrastructure and equipment's etc.
4.7 Promotion of Fairs and Festivals
43. Facilitating the local fair and festivals is an effective way of earning the goodwill of locals. RHEP, therefore, decided to provide grants for various fairs and festivals. The amount of grant kept on varying from year to year and during 2012-13, Rs.2.50 lacs were released under this programme. So far, Rs. 24.23 lakhs have been granted under the programme.
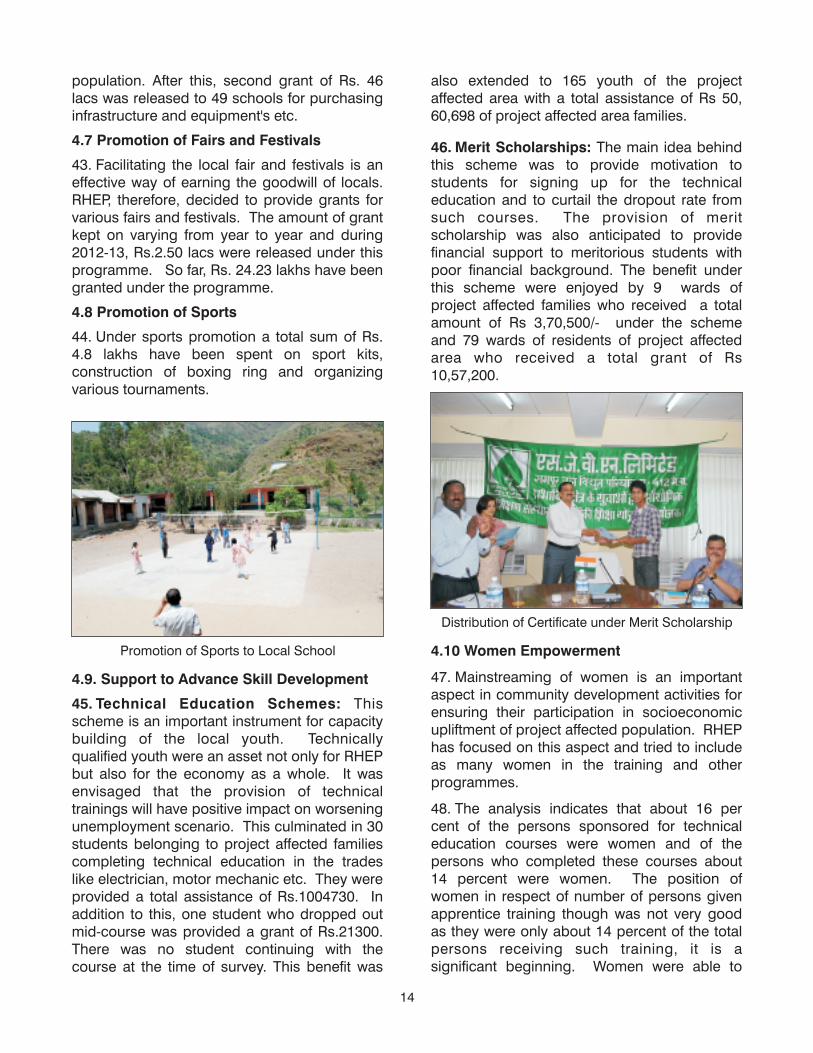
4.8 Promotion of Sports
44. Under sports promotion a total sum of Rs. 4.8 lakhs have been spent on sport kits, construction of boxing ring and organizing various tournaments.
Promotion of Sports to Local School
Distribution of Certificate under Merit Scholarship
4.9. Support to Advance Skill Development
45. Technical Education Schemes: This scheme is an important instrument for capacity building of the local youth. Technically qualified youth were an asset not only for RHEP but also for the economy as a whole. It was envisaged that the provision of technical trainings will have positive impact on worsening unemployment scenario. This culminated in 30 students belonging to project affected families completing technical education in the trades like electrician, motor mechanic etc. They were provided a total assistance of Rs.1004730. In addition to this, one student who dropped out mid-course was provided a grant of Rs.21300. There was no student continuing with the course at the time of survey. This benefit was
also extended to 165 youth of the project affected area with a total assistance of Rs 50, 60,698 of project affected area families.
46. Merit Scholarships: The main idea behind this scheme was to provide motivation to students for signing up for the technical education and to curtail the dropout rate from such courses. The provision of merit scholarship was also anticipated to provide financial support to meritorious students with poor financial background. The benefit under this scheme were enjoyed by 9 wards of project affected families who received a total amount of Rs 3,70,500/- under the scheme and 79 wards of residents of project affected area who received a total grant of Rs 10,57,200.
4.10 Women Empowerment
47. Mainstreaming of women is an important aspect in community development activities for ensuring their participation in socioeconomic upliftment of project affected population. RHEP has focused on this aspect and tried to include as many women in the training and other programmes.
48. The analysis indicates that about 16 per cent of the persons sponsored for technical education courses were women and of the persons who completed these courses about 14 percent were women. The position of women in respect of number of persons given apprentice training though was not very good as they were only about 14 percent of the total persons receiving such training, it is a significant beginning. Women were able to

15
corner 29 per cent of the scholarships. No registered women contractors were available and hence no work could be awarded to them under petty contracts indicating a need of concerted efforts in enabling women to venture in this field. The contractors were not very fair in hiring the women work force as only about 9 percent of their total work force was of women. The main reason forwarded in defense was that the nature of work (working in tunnels and works requiring heavy physical efforts) discouraged the women to take up these assignments. This is also reflected in the number of days of employment under contractors; of the total work days, about 14 per cent were contributed by women. It is apparent from the analysis that women could not avail the benefits of various schemes of RHEP to desired level; present initiative is a welcome intervention in women empowerment. The detailed trade wise analysis indicates that women have made a desired beginning in availing the benefits. The women were sponsored for two trades viz COPA and cutting & sewing. Thus, 31 women were sponsored under technical education of which 25 completed their trainings and 11 were also successful in getting employment. This, of course, is a healthy beginning.
4.11 Distribution of Pressure Cookers
49. RHEP felt concerned about the women drudgery and therefore, decided to provide pressure cookers to all 139 project affected families free of cost. It was anticipated that this programme would reduce the dependence on forests and all the environmental benefits
Distribution of Pressure Cooker to PAF Farmers Training Camp at Bayal
would accrue automatically. All the families were also issued identity cards for facilitating the availing of benefits being provided by RHEP, from time to time.
4.12 Employment Opportunities to Local People
50. One PAF has been given permanent employment in RHEP, SJVN as Pharmacist. In addition to that, employment was generated for 95 persons belonging to Himachal Pradesh through HIMPESCO. This included 4 each supervisors and armed guards, 65 security guards, 10 data entry operators, 1 junior officer, 6 cooks and 5 helpers. In addition to this RHEP created jobs for 444 persons belonging to project affected families and area. These jobs were of supervisors and work men.
4.13 Farmer Training Camps
51. A number of farmer training camps have been conducted by AERC Shimla in order to provide latest technical knowledge relating to production and marketing of agricultural commodities. This was accomplished by inviting various experts who made the farmers aware of the latest trends and techniques. These camps were attended by both males and females of project affected families and areas, women participation in these camps was significantly higher than that of men. During all these camps some farm equipment like pruning scissors etc. were provided as an incentive. These training camps have proved to be quite effective and in fact the beneficiaries demanded that more such camps be organized more frequently and should cover other related

16
topics as well. The technical knowledge provided in these camps helped farmers to increase crop yields.
4.14 Health Improvement Initiatives
52. Mobile Health Van (MHV) service was inaugurated on 26th January 2005 and has been providing valuable health service ever since. The MHV visits 8 project affected panchayats for 4 days each week. In total, 101380 patients were treated through mobile health van and dispensary at Bayal. Out of these 44376 patients were treated through mobile health van and rest 57004 through dispensary at Bayal. The number of referred cases for higher treatment was 246 from mobile health van and 822 from dispensary. RHEP also conducted 46 health camps which benefited 6240 persons. Further, in order to check the dust pollution, an expenditure of Rs.212 lacs was made on sprinkling water to check dust pollution more effectively to protect health of persons.
Mobile Health Van Public Information Centre at Bayal
Medical Checkup
4.15 Impact on Women
53. RHEP has undertaken various activities to women in the areas of education, training, employment, health care, etc. Some of them are discussed below.
54. Sponsorship for Technical Education and Apprenticeship: SJVN has sponsored 31 females (16%) in computer operating and programming assistant, sewing and cutting trades, resulting in jobs for fourteen females. About 30% of 89 people who received scholarships were females. Similarly, 14% of 57 who received apprentice training were females and 9% of 444 local people employed by the contractors were females. In addition, the project has also organized skill upgrading training programs exclusively for women in 2014 – This includes a 3 month computer training, 3 month cutting and tailoring and 2 month beautician program which have benefitted more than 50 women.
55. Employment with RHEP: Two out of four professional staff (50%) working on community d e v e l o p m e n t a n d r e s e t t l e m e n t a n d rehabilitation aspects are females and the head of the public information center (PIC) is also a female. In addition, the project provided a regular employment to a female pharmacist at Bayal dispensary under the resettlement and rehabilitation scheme.
56. Public Information Centre: The Public Information Centre (PIC) operationalized at Bayal since 2005 to provide information to villagers on resettlement and rehabilitation, community development, employment

17
opportunities and grievance redressal. This centre is also a source of all project related documents and villagers can easily access documents like resettlement action plan, social impact assessment, environmental impact assessment, and environmental management plan, etc.
57. Benefits received by PAPs from the Project: When asked about the direct benefits received from the project, the responses from sample households is summarized below and more details are provided in Annex 5.6.
4.16 Conclusion
58. The above discussion reveal that the project has undertaken several initiatives to assist the project affected people during the transition period and also provide opportunity for employment and skill upgrading and support the children of the local people through support in sponsoring them to technical education and scholarship. All this support has all-round impact on the living conditions of project affected people as well as local people.
No Type of Benefit No. of families benefited
Proportion of women beneficiaries
1 Merit Scholarship 5 40%
2 Technical Education 15 20%
3 Employment related ( under contactors or Apprenticeship)
32 33%
4 Rental incom e 3 –
5 Small Contract 3 –
6 Vehicle hire 1 –

18
Chapter 5
Impact of Community Development Activities
59. Various developmental activities aimed at
socioeconomic development of the project
affected area and population, have been
carried out by RHEP. The focus of these
activities is the infrastructural development and
have been initiated depending upon the
relevance, demand and requirements. These
have been presented in following text.
5.1 Status of Community Development
Works
60. At the time of preparation of RAP, a
community development plan was also
prepared. As part of this plan, 2212 community
development works were taken up by RHEP
which have been completed (Annexure 5.2).
These works relate to construction of pucca
paths, kuhls, street lighting, playground and
foot-bridge etc. In order to execute these
works a total expenditure of Rs.130.20 lakh has
been made. At the request of District
administration additional five works related to
construction of pucca paths, kuhls, street
lighting, playground and foot-bridge etc. were
also taken up (Annexure 5.1).
Details of Community Works (Amount in Rs. lakh)
No Nature of Work
1 Access Roa ds
2 Irrigation Channels 3 16.63 3 13.4 2
3 Street Lighting 3 7.38
4 Play grounds 5 36.8 11 42.5 0
5 Foot Bridges
6 Class Rooms
7 Toilet se ats
8 Retaining w all
9 Drinking water
10 Renovation of temples
11 Burial Ground
12 Drainage
13 Renovation of Community Hall
14 Sport activities 2 7.32
15 Construction of toilets
TOTAL 2212
By RHEP By District Administration
Number Amount Number Amount
6 31.89 43 134.03
– –
1 2.3 3 89.7 1
1 4.17 1 12.0 0
2191 23.71 – –
– – 5 10.39
– – 2 7.00
– – 14 58.30
– – 1 4.00
– – 1 1.00
– – 1 1.00
– –
– – 1 2.62
130.20 86 375.97
61. During 2008, the State Government has
adopted a Local Area Development Agency
(LADA) as part of its state Hydro policy. As a
result of this, the community developed works
were transfer to state Government for
implementation since 2009. It has been
reported that the work execution became
slower after these works were transferred to

19
LADA. As many as 86 works with a cost of Rs.
375.97lakh were taken up till now. The details
are provided in Annexure 5.3 and 5.4 and are
summarized above.
5.2 Impact of Community Development
Works
62. The basic objective of undertaking the
community development works is to provide
various amenities/facilities to the project
affected population, which is bound to have
positive social and economic benefits. The
present analysis has been carried out in order
to evaluate this impact and to document the
problems reported by the end users and
suggestions made by them for further
streamlining these efforts and to increase their
efficacy. As the community development works
are of different types they have been evaluated
separately and presented below.
63. Health Impact: The main work under this
activity was introduction of a mobile health van
and construction of hospital aimed at providing
health facilities almost at the doorstep of
project affected population with perceived
benefits of easy consultations and free
medicines etc. The social impact of this
activity, as reported by the respondents was in
the form of better health, low illness periods
and generating a sense of overall wellbeing.
On the economic side of it, it was reported that
the work efficiency of workers has improved.
No problem in this regard was reported.
64. Drinking Water: Improvement in existing
and provision of new pipe lines and storage
tanks were the main activities aimed at
improving the existing water supply for
improving the water availability. The social
impact of this activity has been some
improvement in living standards and on
economic side benefits like time saving,
reduction in incidence of water borne diseases
and most importantly, reduction in drudgery
faced by women have been reported.
65. Sanitation: The distribution of toilet seats
and other materials were the activity
components aimed at improving the sanitary
conditions and to inculcate the habit of
cleanliness with the perceived benefits of clean
surroundings and there by bringing about
improvement in the health conditions. As a
result of this activity there has been some
improvement in the habit of cleanliness and
there has also been some improvement in the
sanitary conditions. This has also been able to
save the time and to some extent reduce the
incidence of diseases.
66. Street Lighting: Street lighting has been
provided in village Bayal with a purpose of
ensuring easy and safe movement during night
hours and to have some protection against
crime. This has also made possible to have
longer working hour.
67. Connectivity: In order to ensure easy and
safe movement of persons and goods, foot
paths and foot bridges have been constructed.
This has resulted in efficient transportation of
goods and farm produce lowering the
transportation cost. Though, no problems were
reported.
68. Community Center: Community centers
were constructed to facilitate the public
meetings and provide platform for community
interactions. This could also be used for public
functions and family celebrations. This has not
only improved the status of village but has
facilitated the social interactions leading to
formulation of strategies for taking care of
development issues and providing useful hints
about latest farm production technologies.
69. Mahila and Yuvak Mandal Buildings: The
purpose of constructing these building was
overall development of women and youth of the
area. It was perceived that this institution will
make possible the introduction of various
income generation activities and they will be
able to have constructive use of their free time.

20
This has been able to develop as meeting point
where exchange of ideas and information has
been possible and the trainings and
demonstrations are also facilitated. But for all
these, lack of funds was reported to be a
bottleneck.
70. Irrigation: Irrigation is an important input
for improving the crop productivity and hence
the activity of construction and repair of kuhls
was undertaken to reduce irrigation water
losses. This has not only been able to shift the
cropping pattern towards high pay off cash
crops but ensured the crop productivity also.
This has led to some improvement in living
standards of beneficiary farmers. It was
suggested that new water sources should be
tapped to improve the irrigation water supply to
existing areas and to make it possible to
include other un-irrigated areas.
71. Temples: Respecting the rel igious
sent iments of v i l lagers, construct ion/
r epa i r / improvemen t o f t emp les was
undertaken. This activity resulted in better
aesthetics and long life of temples. This greatly
satisfied the religious sentiments, people
wanted more temples to be covered under this
scheme.
72. Playgrounds: This activity included
construction, improvements and/or fencing.
This was aimed at promotion of sports in the
area and villagers were greatly satisfied with
this activity which would result in healthy and
efficient workers, better equipped schools and
hence better performance in tournaments.
People had no problems with creation of this
infrastructure but wanted simultaneous
provision of sport kits and other equipment.
73. The above discussion clearly revels that
various works undertaken by the project has
contributed to sustainable development around
the project neighborhood.

21
Chapter 6
Consultations and Community Perceptions
increased financial assistance to Mahila Mandal
and about 60 per cent to Yuvak Mandals. The
key officials of these institutions should be
made aware about the methodologies for
taking care of local issues and problems and
ensuring the percolation of knowledge to
masses. The Yuvak Mandals were important for
social and cultural development of the local
communities.
79. Effectiveness of Development Works by
RHEP: About 70 per cent persons were
satisfied with the effectiveness of development
works of RHEP. About 60 per cent persons felt
that the project activities have helped in
increasing the public awareness and to make
outlook of villagers positive about the
development initiatives.
80. Capacity Building: This is one of the most
important aspects of sustainable development.
It helps to build the capacity of the local
population to carry on the development works,
on their own, in future. It is also instrumental in
posi t ively assimi lat ing the impact of
development interventions. A large majority of
about 76 per cent felt the improvement in
capacity of local population as a result of
initiatives on the part of RHEP. According to
about 40 per cent persons it was due to
awareness camps organized by RHEP and
about 36 per cent attributed it to introduction of
income generation activities. About half of the
r e s p o n d e n t s a t t r i b u t e d i t t o t h e
educational/awareness tours. Organizing sport
meets and further strengthening of village
institutions was a way to further improve the
capacity building, according to about 45 per
cent respondents.
6.2 Perceptions of Project Impacts
81. The existence of project itself and various
activities undertaken by it for the development
6.1 Outcome of Consultations
74. The public consultations designed to
capture the macro view of project affected
population regarding the development issues
and impact of interventions made were carried
out in four villages (Bayal, Koyal, Averi and
Duttnagar), representing about three percent of
the total population. The persons present
included ordinary farmers, members of Yuvak
and Mahila Mandals, panchayat members etc.
During consultations, the persons were
exposed to a variety of issues which were
openly debated. Key issues discussed and the
community perceptions have been summarized
below.
75. Adequacy of Scholarships: About 64 per
cent of the persons present were satisfied with
adequacy of scholarships. About half of the
rest wanted the scholarship to be made
available to larger number of students and 40
per cent wanted the amount of the scholarship
to be enhanced.
76. Adequacy of Medical Facilities: About 62
per cent respondents were satisfied with the
medical facilities being provided in the form of
mobile health van and more importantly the
facility of dispensaries and hospital.
77. Appropriate School Conditions: This is
one of the aspects where large degree of
satisfaction was apparent. More than 90 per
cent made their satisfaction about school
conditions very clear. They felt that this is
probably one of the best in whole of rural
Himachal Pradesh. Despite this almost
everybody present wanted that playgrounds
with appropriate facilities should be developed,
not only for the schools, but all the villages.
78. Assistance to Mahila and Yuvak Mandals:
About 65 per cent persons felt a need for

22
of PAP and others also, have made significant
impacts which can be categorized as social,
environmental and political etc impacts. The
views expressed by the persons present
formed the public perceptions in this regard,
detailed below.
82. Social Impacts: The exposure of PAP to
the influx of diverse group of persons in the
form of project officers, officials and workers
etc has impacted them in a significant manner
by exposing them to wide variety of cultures,
attitudes, habits and ways of life etc. Due to
these factors, in the view of about 55 per cent
persons the public awareness of villagers has
greatly increased. As a result now they have
m o r e p o s i t i v e o u t l o o k t o w a r d s t h e
developmental initiatives, about half of the
persons feeling this. More than 80 per cent
now feel the importance of formal education for
ensuring the better life for their children. Not
only this, the increased awareness has been
instrumental in complete change in the outlook
for agriculture for about 30 per cent persons.
They have now commercial considerations in
agriculture reorienting their agricultural
operations and objectives from subsistence
levels. Apart from these positive impacts, on
the flip side, about 30 per cent persons opined
that the increased exposure has brought in
awareness about fashions which was not good
for the society. The food habits are now on the
change with increasing likings for junk food (25
per cent) and increase in the crime rates (15
per cent). The use of narcotics and other
psychotropic substances is on the rise, in the
view of about 40 per cent persons, was
detrimental for the well-being of the society.
The main reason quoted for this scenario was
the influx of different types of population during
construction activities of the project.
83. Political Impacts: Increased social
awareness and exposure of locals with people
of diverse political likings and affiliations along
with the escalation in political activism in the
area, has impacted the local population with
more and more people being drawn towards
political groups providing them a platform for
redressal of their problems and demands.
About 20 per cent of the persons felt that the
political affiliations of locals have now
increased. This has resulted in increased
number of agitations; about 80 per cent of the
persons present, thought this.
84. The above discussion reveal that the level
of satisfaction with various service provided by
the project to the local people. A large
proportion of people have expressed their
satisfaction with various services in the areas
of health and education and large number of
them (70%) have expressed satisfaction with
various development work undertaken by the
project and said that the project activities have
contributed to their awareness and thinking
positive about the development.

23
Chapter 7
Conclusions
85. Based on the review it is concluded that all land acquis i t ion and reset t lement and rehabilitation activities planned under this project are fully completed and there are no outstanding act iv i t ies now. As regards, community development works, due to change in the implementation arrangements, the original amount has been increased from 17.50 crores to 30.71 crores (1.5% of the project costs) and the district administration has taken up the implementation of the works. These works will continue for some time and the main action pending is the integrated drinking water scheme for all the affected villages. The outcome of feedback f rom househo ld survey and consultations on the Implementation of RAP and community development works is summarized below.
86. The data collected from the sample PAFs clearly shows that the overall living standard of the families has improved due to RHEP project implementation. Following changes are noteworthy.
a) There is improvement in level of education and literacy rate among PAFs. The literacy level among males has increased from 91 per cent to 92.14 per cent whereas in case of females it has increased from 76 to 83 per cent from base period, the technical educational schemes implemented by RHEP have attracted PAFs and number of technical educated persons increased in current year. Merit scholarship was provided to nine persons belonging to PAF and 79 of PAA.
b) There has been increase in full-time employment in the villages due to RHEP activities. Encouraged by RHEP, the contractors working with it also employ local workers as much as possible. Permanent employment was provided to one member of project affected family and in addition to that employment has been provided to 425 persons through contractors of RHEP.
c) There is significant increase in the proportion of workers in the regular employment, with public and private sector. About 19 per cent persons were working as private and government servants, an increase of about 25 per cent over 2005 and 26 per cent higher in comparison to control group.
d) Diversification of income and employment avenues through various technical education, training, income generation schemes, towards business and other self-employment activities, is taking place.
e) There have been positive impacts on income and employment pattern of project affected families. During the base line period, main occupation was agriculture with 59.80 per cent workers reporting it, which figure increased to 66.31 per cent during the current survey, an increase of about 11 per cent. The increase in number of persons reporting agriculture as main occupation is the fact that more stress is now given on fruit and vegetable cultivation which are labor intensive ventures.
f) The current average income of PAPs is Rs. 3,87,204 which is 54% more than beeline income at current level and 87% higher than of controlled population. As regards in income changes among individual families as many as 79 families (87%) have reported increased income compared to baseline income at current level.
g) There is improvement in the residential facilities of the affected families as compared to their own earlier situation and as compared to the condition of non-affected families in the project area. The number of pucca houses increased by 180 percent over the base period and the percentage of houses having separate kitchen and toilet increased by about 27 and 47 per cent respectively over base period and 89 and 61 per cent respectively in comparison to control sample.
h) There has been improvement in living standards of PAFs and number of households having modern durables such as TV, refrigerator, LPG connection by about 17, 50 and 19 per cent in comparison to control sample households having these durables.
i) There has been improvement in consumption pattern (towards more nutrition, protein, fruits & vegetables) of the project affected families. The consumption expenditure of food items is 15.35 per cent over base year and there is simultaneous increase of about 44 per cent in the consumption of non-food items.

24
j) The land holding has declined but the yield of major crops on PAFs farms has increases and value productivity of land was significantly (100 %) higher in current year as compared to base year.
k) Compensation rates given to the PAFs were adequate as expressed by them. PAFs have received full compensation from RHEP. During final evaluation 18 percent of households had invested in land purchase, 62 per cent households making investments in the form of fixed deposits in banks and Mutual funds.
l) The RHEP has taken measures to strengthen the existing infrastructure facilities, including health facilities, education, irrigation, drinking water, sanitation, street lights and roads which are providing immense benefits to the PAFs in the project area. RHEP has undertaken and completed seven different works of distribution of toilet seats and essential materials to the residents of Project affected panchayats. There were 79 works completed by LADA and 47 road/pucca path related works.
87. People's Perceptions: The project affected population has been exposed to variety of people due to influx of workers, significantly impacting their social, cultural and economic life. The people have become greatly aware of the development scenario and now have positive outlook towards development interventions like R&R activities. The people now understand the importance of education for securing the future of their wards. More and more people now have commercial considerations in agricultural production which in future will help them in providing secure and sustainable livelihoods. Political awareness has significantly increased and political forum are increasingly taken as a platform of grievances redressal. The public opinion was quite favorable in respect of facilities like provision of merit scholarships, improvement in conditions of schools, assistance to Yuvak and Mahila Mandals etc. The training and awareness camps have been an effective tool for capacity building of PAP and also to make them aware about new opportunities in income generation or to improve upon the existing livelihood strategies.
88. I m p a c t o f R & R a n d C o m m u n i t y Development Works: The implementation of majority of R&R components have largely
progressed as per laid down time schedule. However, some of the development works got delayed after the transfer of works to LADC particularly the integrated drinking water scheme. The activities like provision of medical facilities, merit scholarship, hiring of vehicles from PAF and provision of awarding petty contracts to PAF have played a significant role in promoting the socio economic well-being of PAF. Such facilities have been appreciated by the people. The developmental activities like foot bridges, village paths, provision of drinking water etc. have made PAFs life better. The support services like farmers' training camps have been appreciated and demanded for income generation activities. The dissent to decisions and policies of R&R, often are not genuine and are due to political influence and raised aspirations of PAF. In the light of above it is indicated that R&R and LADC have been able to fulfill their objectives to a large extent. It is also noted that some of the LADA activities are still pending especially the integrated drinking water scheme which will have significant impact in the living standards once it is completed. Despite this, a few suggestions have emerged for making the LADC more effective. It was suggested that the frequency of LADC meeting should be increased so that all the agenda items are discussed in depth and there should be review of actions taken and progress achieved. Many people wanted that there should be a fixed time limit for execution of LADC decisions. This will help in avoiding cost overruns and achieving the PAPs satisfaction. It was also suggested that LADC should have greater focus on income generation activities including introduction of new activities and sharpening the skills for ongoing activities.
89. Post Commissioning Support: During the post commissioning stage, the project affected families will receive 100 units of electricity per month for 10 years and the long term residents in the affected villages will receive annuity payment out of revenue generated out of sale of 1% free power provided to the state Government by project entity during life of the project. The RHEP is finalizing the modalities for extending the electricity supply and the state Government in the process of finalizing the list of eligible people for annuity payments. Thus, there is a sustainable efforts from the project entity and State Government to support the project affected and local people beyond the project implementation.

25
ANNEXURES
Annex-3.1: Demographic Profile
Particulars Number Percentage
2014 2005 Control 2014 2005 Control
Total population 467 660 396 100.00 100.00 100.00
Male 232 324 206 50.96 49.09 52.02
Female 235 336 190 49.04 50.91 47.98
Family size 4.21 4.55 4.5 – – –
Sex ratio 1013 1037 922 – – –
Marital statues 272 363 237 100.00 100.00 100.00
Married male 136 177 117 50.00 48.76 49.36
Married female 136 186 120 50.00 51.23 50.64
Annex-3.2: Educational Profile
Particulars Number Percentage
2014 2005 Control 2014 2005 Control
Illiterate 52 110 82 11.81 16.90 22.53
Primary 71 125 69 16.14 19.20 18.95
Middle 62 114 58 14.09 17.51 15.93
Matriculation 75 127 80 17.04 19.51 21.98
Senior secondary 72 73 45 16.36 11.21 12.36
Graduate 59 66 20 13.40 10.14 5.49
Post Graduate 26 24 6 5.90 3.69 1.65
Tech Diploma 23 12 4 5.23 1.84 1.10
Total 440 651 364 100.00 100.00 100.00
Annex-3.3: Literacy Level (Percentage)
Particulars Periods
2014 2005 Control
Male 92.14 91 84.97
Female 82.94 76 69.00
Total 88.19 83 77.47

26
Annex-3.4: Ownership of Immovable Assets
Particulars Number Percentage
2014 2005 Control 2014 2005 Control
Only Land 0 20 0 0 13.79 0
Only House 20 4 11 21.74 2.76 13.75
Only Shop 0 1 0 0 0.69 0
Land & house 61 115 59 67.30 79.31 73.75
Shop, Land, house 11 5 10 11.96 3.45 12.50
Total Household 92 145 80 100.00 100.00 100.00
Annex-3.5: Workers & Non-workers
Particulars Number Percentage
2014 2005 Control 2014 2005 Control
Total population 467 660 396 100.00 100.00 100.00
Male 238 324 206 50.96 49.09 52.02
Female 229 336 190 49.04 50.91 47.98
Workers 279 393 183 59.53 59.55 46.21
Male 154 189 117 32.98 28.63 29.54
Female 125 204 66 26.55 30.91 16.67
Non-workers 188 258 213 40.25 39.09 53.78
Male 78 130 89 17.98 19.70 22.47
Female 110 128 124 22.48 19.39 31.31
Dependency ratio 0.67 0.66 1.16 – – –

27
Annex- 3.6: Occupational Pattern of Workers
Particulars Number Percentage
2014 2005 Control 2014 2005 Control
Agriculture 185 235 87 66.31 59.80 47.54
Male 70 91 32 45.45 48.15 27.35
Female 115 144 55 92.00 70.59 83.33
Agriculture labour 12 0 0 3.05 0
Male 7 0 0 3.70 0
Female 5 0 0 2.45 0
Non-agri. labour 13 17 37 4.65 4.32 20.22
Male 13 13 29 8.44 6.88 24.78
Female 0 4 8 0 1.96 12.12
Service 54 61 48 19.35 15.52 26.23
Male 44 54 46 28.57 28.57 39.32
Female 10 7 2 8.00 3.43 3.03
Business 25 22 11 8.96 5.60 6.01
Male 25 20 10 16.23 10.58 8.55
Female 0 2 1 0 0.98 1.51
Rural Artisan 2 2 0 0.72 0.51 0
Male 0 2 0 1.30 1.06 0
Female 0 0 0 0 0 0
Main Workers 279 393 183 100.00 100.00 100.00
Male 154 189 117 100.00 100.00 100.00
Female 125 204 66 100.00 100.00 100.00
Annex-3.7: Source of Income
Source Number of H.H. Percentage
2014 2005 Control 2014 2005 Control
Service 35 54 38 38.04 37.24 47.50
Agriculture 58 130 75 63.04 89.65 93.75
Business 12 17 10 13.04 11.72 12.50
Wage labour 9 60 0 9.78 41.38 0
Other 2 4 44 2.17 2.76 55.00
No. of households 92 145 80 100.00 100.00 100.00

28
Annex-3.8: Level of Income
Source Rs/H.H. Change over
2014 2005 Control 2005 Control
Service 149673 45488 93456 229.04 60.15
Agriculture 122136 46420 32301 163.11 278.11
Business 82652 11880 34037 595.72 488.82
Wage labour 8445 14621 21415 (-)422.41 (-) 60.56
Other 24298 2230 26048 989.60 (-)6.72
Total income 387204 120639 207257 220.96 86.82
Annex-3.9: House Ownership Pattern
Particulars Number of H.H. Percentage
2014 2005 Control 2014 2005 Control
Families owning house 92 138 77 100.00 95.17 96.25
Average size of house Sq.ft 985 578.28 358.13 – – –
Household having
Pucca house 90 51 55 97.83 35.17 68.75
Kutcha house 2 63 22 2.17 43.44 27.5
Semi pucca house 0 24 0 0 16.55 0
Household with separate
Kitchen 92 114 42 100 78.62 73.00
Toilet 92 99 50 100 68.27 73.00
Animal shed 74 103 45 80.43 71.03 56.25
Average no. of rooms 6.85 3.7 4.33
No. of H.H. 92 145 80 100.00 100.00 100.00

29
Annex-3.10: Business Details
Particulars Number/amount Percentage
2014 2005 Control 2014 2005 Control
No. of Household having business 9 17 10 9.78 11.72 12.5
Average investment 36434 104312 7225
Own source 36434 89135 7225
Loan 0 11765 0 0 29.41 0
Other source 0 2353 0
Total 36434 104312 7225
No. of families having outstanding loan 0 5 0
Average amount of outstanding loan 0 81000 0
Source of loan 0 0
Banks 0 4 0
Relatives 0 1 0
Money lender 0 0 0
Net profit from business 0 103824 0
Total H.H. 92 145 80
Annex-3.11: Particulars of Shops
Particulars Number/Amount Percentage
2014 2005 Control 2014 2005 Control
No. of Household having Shop 9 9 4 9.78 6.21 5.00
Area of shops (ft2) 1363 222 980
Av. investment(Rs) 36434 64778 7725
Type of shop
Tailoring 1 2 0 11.11 22.22 0
Workshop 1 1 0 11.11 11.11 0
Provision store 2 2 2 22.22 22.22 50.00
General store 5 4 2 55.55 44.45 50.00
Electrical 1 0 0 11.11 0 0

30
Annex-3.12: Number of Households having Commercial Assets
Assets Number Percentage
2014 2005 Control 2014 2005 Control
Taxi 2 7 2 2.17 4.83 2.5
Pick up van 3 1 2 3.26 0.69 2.5
Truck 1 1 1.08 1.25
Photostat 0 1 0 1.25
STD booth 0 0 0 00
0
0
0
0
0
0
0
0
0
0
0
Tea stall 0 1 0 1.25
Dhaba 0 0 0 0
General store 4 3 2 4.34 2.07 2.50
Guest house 0 0 0 0
Vegetable shop 0 0 0 0
Commission Agent 1 0 1.08 0
Auto repair shop 1 1 0 1.08 0.68 0
Medical Store 1 0 1.08 0
Cloth’s shop 1 1 1.08 1.25
Hardware 1 0 1.08 0
Other 0 6 0 0
Total H.H. 92 145 80 100.00 100.00 100.00
Annex-3.13: Number of Commercial Assets
Assets Number Percentage
2014 2005 Control 2014 2005 Control
Taxi 2 7 2 14.29 53.84 13.33
Pick up van 3 1 2 21.43 7.69 13.33
Truck 1 0 1 7.14 0 6.67
Tea stall 0 0 1 0 0 6.67
General store 5 4 2 35.71 30.77 13.33
Auto repair shop 1 1 0 7.14 7.69 0
Medical Store 1 0 0 7.14 0 0
Cloth’s shop 1 0 1 7.14 0 6.67
Hardware 1 0 0 7.14 0 0
Other 0 0 6 0 0 40.00
Total assets 14 13 15 100.00 100.00 100.00

Annex-3.14: Average Monthly Income from Commercial Assets (Rs. Per household)
Assets Number Change over
2014 2005 Control 2005 Control
Taxi 7826 14333 7525 (-)45.40 4.00
Pick up van 22000 10000 20500 120.00 7.32
Truck 13043 0 11000 0 18.57
Tea stall 0 0 6000 0 0
General store 20043 9833 18000 103.83 11.35
Auto repair shop 9885 5000 0 97.70 0
Medical Store 12185 0 0 0 0
Cloth’s shop 10190 0 8895 0 14.56
Hardware 8895 0 0 0 0
Other 0 0 3913 0 0
Annex-3.15: Number of Households having Modern Durables
Durables Number Percentage
2014 2005 Control 2014 2005 Control
TV 87 105 65 94.56 72.41 81.25
VCD 14 15 7 15.22 10.34 8.75
Refrigerator 74 67 43 80.43 46.21 53.75
M. Cycle 6 7 1 6.52 4.83 1.25
Car 39 17 10 42.39 11.72 12.50
LPG 87 118 64 94.56 81.38 80.00
Bio gas 0 1 0 0 0.69 0
Other(Cell Phone) 90 3 74 97.83 2.07 92.50
Total H.H. 92 145 80 100.00 100.00 100.00
Annex-3.16: Number of Modern Durables
Durables Number Percentage
2014 2005 Control 2014 2005 Control
TV 91 109 69 15.77 31.41 19.66
VCD 14 15 7 2.43 4.32 1.9933
Refrigerator 92 70 60 100 20.17 75.00
M. Cycle 6 7 1 1.04 2.02 0.28
Car 39 19 10 6.76 5.47 2.85
LPG 87 123 68 15.08 35.45 19.37
Bio gas 0 1 0 0 0.29 0
Other(Cell Phone) 264 3 149 45.75 0.86 42.45
Total 577 347 351 100.00 100.00 100.00
31
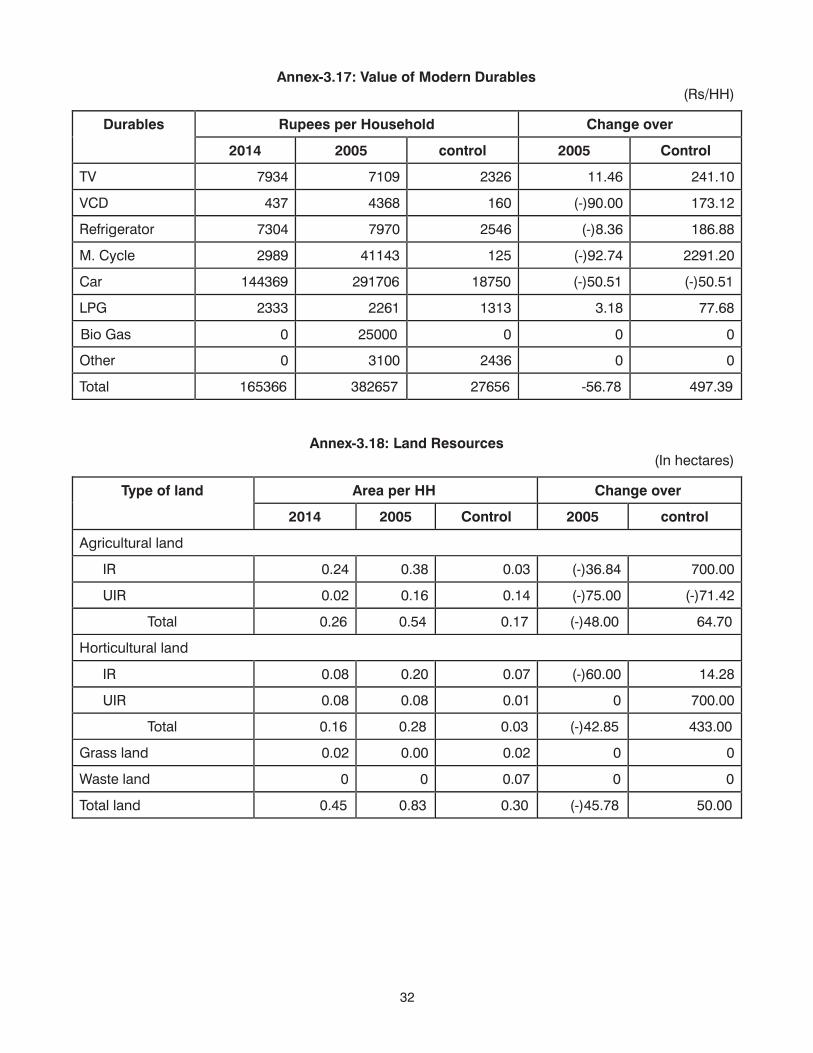
Annex-3.17: Value of Modern Durables (Rs/HH)
Durables Rupees per Household Change over
2014 2005 control 2005 Control
TV 7934 7109 2326 11.46 241.10
VCD 437 4368 160 (-)90.00 173.12
Refrigerator 7304 7970 2546 (-)8.36 186.88
M. Cycle 2989 41143 125 (-)92.74 2291.20
Car 144369 291706 18750 (-)50.51 (-)50.51
LPG 2333 2261 1313 3.18 77.68
0 0 0025000
Other 0 3100 2436 0 0
Total 165366 382657 27656 -56.78 497.39
Annex-3.18: Land Resources (In hectares)
Type of land Area per HH Change over
2014 2005 Control 2005 control
Agricultural land
IR 0.24 0.38 0.03 (-)36.84 700.00
UIR 0.02 0.16 0.14 (-)75.00 (-)71.42
Total 0.26 0.54 0.17 (-)48.00 64.70
Horticultural land
IR 0.08 0.20 0.07 (-)60.00 14.28
UIR 0.08 0.08 0.01 0 700.00
Total 0.16 0.28 0.03 (-)42.85 433.00
Grass land 0.02 0.00 0.02 0 0
Waste land 0 0 0.07 0 0
Total land 0.45 0.83 0.30 (-)45.78 50.00
Bio Gas
32

Annex-3.19: Number of Households Growing Different Crops
Crops No. of HH Percentage
2014 2005 Control 2014 2005 Control
Maize 14 42 32 15.12 28.96 40.00
Paddy 59 93 9 63.72 64.41 11.25
Wheat 60 105 35 64.80 72.41 43.75
Barley 2 7 4 2.16 4.82 5.00
Pulses 5 14 13 5.40 9.65 16.25
Cabbage 2 37 3 2.16 25.51 3.75
Peas 0 4 0 0 2.76 0
Tomato 1 21 4 1.08 14.48 5.00
Potato 2 7 1 2.16 4.82 1.25
Apples 23 25 5 24.84 17.24 6.25
Almond 7 35 8 7.56 24.13 10.00
Pears 6 3 0 6.48 2.07 0
Plum 1 0 14 1.08 0 17.50
Others 0 19 0 0 13.10 0
Total HH 92 145 80 100.00 100.00 100.00
Annex-3.20: Cropping Pattern
(In hectares)
Crops Area per HH Change over
2014 2005 Control 2005 Control
Maize 0.02 0.09 0.08 (-)77.78 (-)75.00
Paddy 0.22 0.36 0.02 (-)38.88 1000.00
Wheat 0.22 0.38 0.10 (-)42.10 120.00
Barley 0.006 0.009 0.006 (-)33.33 0
Pulses Neg. 0.01 0.02 0 0
Cabbage Neg. 0.03 0.003 0 0
Peas Neg. 0.002 0 0 0
Tomato Neg. 0.01 Neg. 0 0
Potato Neg. 0.003 Neg. 0 0
Apples 0.12 0.13 0.008 (-)7.69 1400.00
Almond 0.01 0.07 0.01 (-)85.71 0
Pears 0.03 0.004 0 650.00 0
Plum 0 0 0.02 0 0
Other 0 0.11 0 0 0
Total cropped area 0.63 1.18 0.30 (-)46.61 110.00
33

Annex-3.21: Production Pattern (Qtls. / HH)
Crops Quantity per HH Change over
2014 2005 Control 2005 Control
Maize 0.25 1.71 1.40 (-)77.78 (-)82.14
Paddy 7.69 11.22 0.63 (-)31.46 1120.63
Wheat 5.79 6.81 1.45 (-)14.98 299.31
Barley 0.04 0.06 0.04 (-)33.33 0
Pulses 0.15 0.39 0.08 (-)61.54 (-)81.25
Cabbage 0.07 5.36 0.13 (-)98.69 (-)46.15
Peas 0 0.44 0 0 0
Tomato 0.13 1.88 0.05 (-)93.09 160.00
Potato 0.03 0.61 0.03 (-)95.08 0
Apples 24.04 20.3 1.50 18.42 1502.67
Almond 0.30 5.02 0.12 (-)94.02 150.00
Pears 0.92 0.63 0 46.03 0
Plum 0.33 0 1.34 0 (-075.37
Others 0 32.89 0 0 0
Annex-3.22: Value of Crop Output (Rs. / H.H.)
Crops Value per HH Change over
2014 2005 Control 2005 control
Maize 1400 1037 1960 35.00 (-)28.57
Paddy 9228 7089 756 30.17 1120.63
Wheat 8396 4316 2102 94.53 299.43
Barley 60 28 60 114.78 0
Pulses 750 124 400 504.83 87.50
Cabbage 84 2269 156 (-)96.20 (-)46.15
Peas 0 276 0 0 0
Tomato 195 1260 75 (-)84.52 160.00
Potato 36 365 36 (-)90.13 0
Apples 84140 16905 5250 397.72 1502.67
Almond 1500 6321 180 (-)76.27 733.33
Pears 920 63 0 1360.31 0
Plum 330 8255 1340 (-096.00 (-)75.37
All Crops 109053 48314 12315 125.72 785.53
34

Annex-3.23: Number of Households having Livestock
Type of Livestock Number of HH Percentage
2014 2005 Control 2014 2005 Control
Draught Animals 4 40 3 4.32 27.58 3.75
Milch Animals 63 107 43 68.04 73.79 53.75
Young stock 3 70 17 3.24 48.27 21.25
Sheep & goats 1 1 2 1.08 0.68 2.50
Total HH 92 145 80 100.00 100.00 100.00
Annex-3.24: Number of Livestock Owned
Type of Livestock Number per Household Change over
2014 2005 Control 2005 Control
Draught Animals 0.11 0.50 0.04 (-)78.00 175.00
Milch Animals 0.86 1.06 0.95 (-)18.86 (-)9.47
Young stock 0.24 0.64 0.39 (-)62.50 (-)38.46
Sheep & goats 0.25 0.17 0.05 47.05 400.00
Total 1.46 2.37 1.43 (-)38.39 2.10
Annex-3.25: Value of Livestock Owned
Type of Livestock Rs./ Farm Change over
2014 2005 Control 2005 Control
Draught Animals 1136 680 318.0 67.05 257.23
Milch Animals 12104 5623 13525 53.54 (-)10.51
Young stock 774 737 1581 5.02 (-)51.04
Sheep & goats 663 207 250 220.29 165.20
Total 14737 7247 15674 103.35 (-)5.98
Annex-3.26: Number of Households Owning Crossbred Livestock
Type of Livestock Percentage of HH Percentage
2014 2005 Control 2014 2005 Control
Draught Animals 50.00 15.00 66.67 2.16 10.34 2.50
Milch Animals 31.75 61.68 76.74 21.60 42.54 41.25
Young stock 66.67 60.00 76.47 2.16 41.38 16.25
Sheep & goats 0 0 50.00 0 0 0
Total Households 92 145 80 100.00 100.00 100.00
35

Annex-3.27: Monthly Household Consumption Pattern (Kg. /HH)
Items Quantity Change over
2014 2005 Control 2005 Control
Rice 35.0 32.71 32.4 7.00 8.02
Wheat 39.95 31.92 33.5 25.15 19.25
Maize 0.89 14.25 0.7 (-)93.75 27.14
Barley 0 13.44 0 0 0
Pulses 5.93 4.82 4.8 23.03 23.54
Vegetables 14.64 24.28 13.5 (-)39.70 8.44
Fruit 6.65 16.25 4.5 (-)59.08 47.77
Edible oil 3.44 3.09 3.9 11.32 (-)11.79
Milk 15.85 51.88 26.3 (-)69.45 (-)39.73
Sugar 3.98 5.23 3.5 (-)23.90 13.70
Salt 1.68 1.67 1.6 0.59 5.00
Tea 0.55 0.38 0.41 44.74 34.15
Annex-3.28: Monthly Consumption Expenditure
(Rs./Month/HH)
Items Value/HH Change over
2014 2005 Control 2005 Control
Rice 1565.87 391.7 1190.45 299.76 31.54
Wheat 867.61 295.2 898.83 193.90 (-)3.47
Maize 10.05 89.39 14.84 (-)88.75 (-)32.28
Barley 0 250.0 0 0 0
Pulses 327.72 140.88 331.28 136.62 (-)1.07
Vegetables 509.27 209.24 457.12 143.39 11.41
Mutton 523.47 231.29 364.95 126.32 43.44
Fruit 328.2 193.86 198.03 69.29 65.73
Edible oil 426.14 185.50 300.32 129.72 41.90
Milk 681.41 545.65 807.80 24.88 (-)15.65
Sugar 119.79 104.66 124.98 14.45 (-)4.15
Salt 21.46 18.52 28.60 15.87 (-)24.97
Tea 210.32 65.88 170.63 219.24 23.26
Tobacco 256.35 251.49 128.76 1.93 99.09
Liquor 267.93 259.53 133.41 3.23 100.83
Sub. Total 6115.6 3232.8 5150 89.17 18.76
Clothes 638.76 399.0 513.57 60.09 24.38
Footwear 448.45 209.33 409.04 114.23 9.63
Education 1015.22 478.95 913.27 111.96 11.16
Medicines 332.00 181.21 385.07 83.21 (-)13.78
Marriage etc. 1137.11 239.26 354.05 375.26 221.17
Sub. Total 3571.54 1507.75 2575 136.87 38.70
Total 9687.13 4740.54 7725 104.34 25.40
36
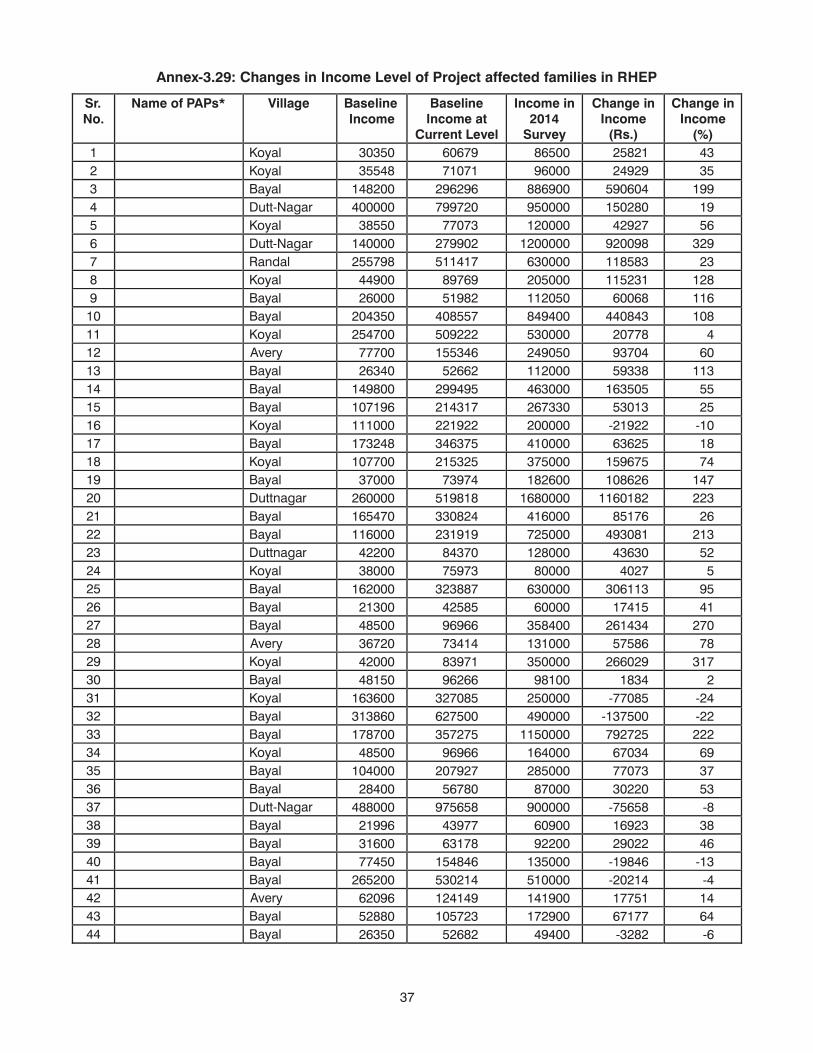
Annex-3.29: Changes in Income Level of Project affected families in RHEP
Sr. No.
Name of PAPs* Village Baseline Income
Baseline Income at
Current Level
Income in 2014
Survey
Change in Income
(Rs.)
Change in Income
(%)
1 Koyal
2 Koyal
3 Bayal
4 Dutt-Nagar
5 Koyal
6 Dutt-Nagar
7 Randal
8 Koyal
9 Bayal
10 Bayal
11 Koyal
12 Avery
13 Bayal
14 Bayal
15 Bayal
16 Koyal
17 Bayal
18 Koyal
19 Bayal
20 Duttnagar
21 Bayal
22 Bayal
23 Duttnagar
24 Koyal
25 Bayal
26 Bayal
27 Bayal
28 Avery
29 Koyal
30 Bayal
31 Koyal
32 Bayal
33 Bayal
34 Koyal
35 Bayal
36 Bayal
37 Dutt-Nagar
38 Bayal
39 Bayal
40 Bayal
41 Bayal
42 Avery
43 Bayal
44 Bayal
30350
35548
148200
400000
38550
140000
255798
44900
26000
204350
254700
77700
26340
149800
107196
111000
173248
107700
37000
260000
165470
116000
42200
38000
162000
21300
48500
36720
42000
48150
163600
313860
178700
48500
104000
28400
488000
21996
31600
77450
265200
62096
52880
26350
60679
71071
296296
799720
77073
279902
511417
89769
51982
408557
509222
155346
52662
299495
214317
221922
346375
215325
73974
519818
330824
231919
84370
75973
323887
42585
96966
73414
83971
96266
327085
627500
357275
96966
207927
56780
975658
43977
63178
154846
530214
124149
105723
52682
86500
96000
886900
950000
120000
1200000
630000
205000
112050
849400
530000
249050
112000
463000
267330
200000
410000
375000
182600
1680000
416000
725000
128000
80000
630000
60000
358400
131000
350000
98100
250000
490000
1150000
164000
285000
87000
900000
60900
92200
135000
510000
141900
172900
49400
25821
24929
590604
150280
42927
920098
118583
115231
60068
440843
20778
93704
59338
163505
53013
-21922
63625
159675
108626
1160182
85176
493081
43630
4027
306113
17415
261434
57586
266029
1834
-77085
-137500
792725
67034
77073
30220
-75658
16923
29022
-19846
-20214
17751
67177
-3282
43
35
199
19
56
329
23
128
116
108
4
60
113
55
25
-10
18
74
147
223
26
213
52
5
95
41
270
78
317
2
-24
-22
222
69
37
53
-8
38
46
-13
-4
14
64
-6
37

45 Bayal
46 Bayal
47 Bayal
48 Koyal
49 Koyal
50 Koyal
51 Koyal
52 Bayal
53 Bayal
54 Duttnagar
55 Duttnagar
56 Bayal
57 Koyal
58 Bayal
59 Bayal
60 Bayal
61 Bayal
62 Koyal
63 Bayal
64 Koyal
65 Bayal
66 Bayal
67 Duttnagar
68 Bayal
69 Bayal
70 Dutt-Nagar
71 Bayal
72 Koyal
73 Bayal
74 Bayal
75 Bayal
76 Bayal
77 Koyal
78 Bayal
79 Koyal
80 Bayal
81 Bayal
82 Bayal
83 Dutt-Nagar
84 Avery
85 Bayal
86 Bayal
87 Koyal
88 Averi
89 Bayal
90 Dutt-Nagar
91 Bayal
*Note: The names of the individual head of families are excluded to ensure confidentiality.
100000
122000
34500
236000
41000
22500
96000
104500
95850
160400
51200
34400
11200
270900
7600
146500
31500
135600
33000
83200
65520
82000
101500
40960
168300
693998
51000
33000
121548
62000
60910
86000
96800
72500
278400
60000
12350
172900
249999
20400
212500
228300
38300
26500
51000
340000
197248
199930
243915
68976
471835
81971
44984
191933
208927
191633
320688
102364
68776
22392
541610
15195
292897
62978
271105
65977
166342
130994
163943
202929
81891
336482
1387510
101964
65977
243011
123957
121777
171940
193532
144949
556605
119958
24691
345679
499823
40786
424851
456440
76573
52981
101964
679762
394358
210000
400000
265000
1650000
121000
70000
250500
238400
196500
300000
120000
142000
29000
1150000
25000
1075000
85000
340000
92450
320000
297000
175000
200000
127500
380000
1650000
383450
77000
550800
250000
125600
467000
192500
250000
626000
258900
50500
327950
950000
214000
393700
945000
154500
64500
244000
862000
869200
10070
156085
196024
1178165
39029
25016
58567
29473
4867
-20688
17636
73224
6608
608390
9805
782103
22022
68895
26473
153658
166006
11057
-2929
45609
43518
262490
281486
11023
307789
126043
3823
295060
-1032
105051
69395
138942
25809
-17729
450177
173214
-31151
488560
77927
11519
142036
182238
474842
5
64
284
250
48
56
31
14
3
-6
17
106
30
112
65
267
35
25
40
92
127
7
-1
56
13
19
276
17
127
102
3
172
-1
72
12
116
105
-5
90
425
-7
107
102
22
139
27
120
38

Annex-3.30: Changes in Asset Ownership among those whose Real Incomes are declined
No. Sr. No. as in Annex-3.29
Name of PAPs* Village Number of Assets
Owned at Baseline (2005)
Number of Assets Owned during Impact
Evaluation (2014)
Increase in Asset
Ownership (in %)
1
2
3
4
5
6
7
8
9
10
11
12
*Note: The names of the individual head of families is excluded to ensure confidentiality. List of Assets Owned: Television; Refrigerator; Two Wheeler; Four Wheeler; Cooking Gas, Washing Machine; Computer; and 8 cell phone
Annex-3.31: PAPs Perception on Changes in Living Standards
No Level of Perception Number Percentage
1 Significantly improved 35 38.04%
2 Improved 33 35.89%
3 More or less same 22 23.91%
4 Declin ed 0 0.00%
5 No respon se 2 2.16%
Total 92 100.00
Koyal
Koyal
Bayal
Dutt-Nagar
Bayal
Bayal
Bayal
Dutt Nagar
Dutt Nagar
Koyal
Bayal
Bayal
16
31
32
37
40
41
44
54
67
77
82
85
3
4
4
3
5
2
3
3
3
1
1
2
7
6
5
4
4
4
4
6
7
5
4
7
133.3
50.0
25.0
33.3
-20.0
100.0
33.3
100.0
133.3
400.0
300.0
250.0
39

Annex-5.1: Details of works completed in affected area under R&R plan of RHEP
S.No. Activities Achievement
Physical (no. of works / PAFs
etc.)
Financial (Expenditure
incurred-Rs. in lacs)
1 Construction of Providing of Streetlight in Bayal village, Panchayat Gadej. 1 7
2 Construction / Renovation of masonry channel (Kuhl) at village Bayal at a length of 800-1400 meter.
1 4.9
3 Providing and fencing of CGI Sheets roofing in community hall at Bayal. 1 0.7
4 Construction of Playground of Middle school by providing of dozer Panchayat Gadej.
1 2.07
5 Providing of streetlight in Bayal village near community centre Panchayat Gadej. 1 0.08
6 Construction / Renovation of masonry channel (kuhl) at village Bayal at a length of 0-800 meter, Panchayat Gadej.
1 4.79
7 Repair / construction of intake of kuhl at Bayal Panchayat Gadej 1 6.94
8 C/o pucca path / steps from village Koyal to cremation ground of village Koyal Panchayat Gadej.
1 7.6
9 Construction of pucca path / steps from road Kunni to Kazo near Jullah to village Badari Panchayat Kushwa.
1 5.37
10 C/o pucca path / steps from village Upper Badhari to existing path at village lower Badhari 523.4m long at Panchayat Kushwa.
1 3.38
11 C/o playground and P/F of chain link fencing around Govt. Primary School Bandthana Panchayat Kushwa.
1 5.17
12 Repair of foot bridge to Samej across the river Satluj near Nathpa Jhkari Power House at Jhakri.
1 2.27
13 Pucca Path / Steps from kunni bridge to village Bakhan Panchayat Kharga. 1 3.94
14 C/o playground and providing of chain link fencing around playground at GPS Nal Panchayat Kharga.
1 7.37
15 C/o pucca path / steps from vill. Damahali to vill. Bari Panchayat Bari. 1 6.05
16 Providing & fixing of street light at village Brow Gram Panchayat Poshana. 1 0.3
17 C/o class room & fencing at Govt. Primary School Brow Panchayat Poshana. 1 4.17
18 C/o playground & P/F chain link fencing at Govt. Primary School Chatti Panchayat Tunan.
1 18.02
19 C/o Basket Ball Court, Badminton Court and stores in Sr. Secondary School Duttnagar Panchayat Duttnagar.
1 5.82
20 C/o retaining wall & P/F chain link fencing around the playground of Govt. Primary School Nirsu Panchayat Duttnagar.
1 4.17
21 Providing Cricket Kits to Panchayats falling under Rampur H.E.P 1 1.5
22 Providing of fund for Boddhi Diwali fair at Nirmand. 1 2.15
23 Providing of fund for Rajmata Shanti Devi Memorial volleyball tournament at Nirmand.
1 1.75
24 Providing of funds to SDM Anni for promoting sports activities in schools at Distt level.
1 2
25 Conduction of workshop on RTI Act 2005 104 participants 6
26 Distribution of toilet seats and essential materials to the residents of Project affected panchayat of RHEP
2191 villagers 23.71
27 Construction of village road & Pacca path / steps from vill. to cremation place vill. Averi Panchayat Bahawa
1 5.55
TOTAL 204.77
40
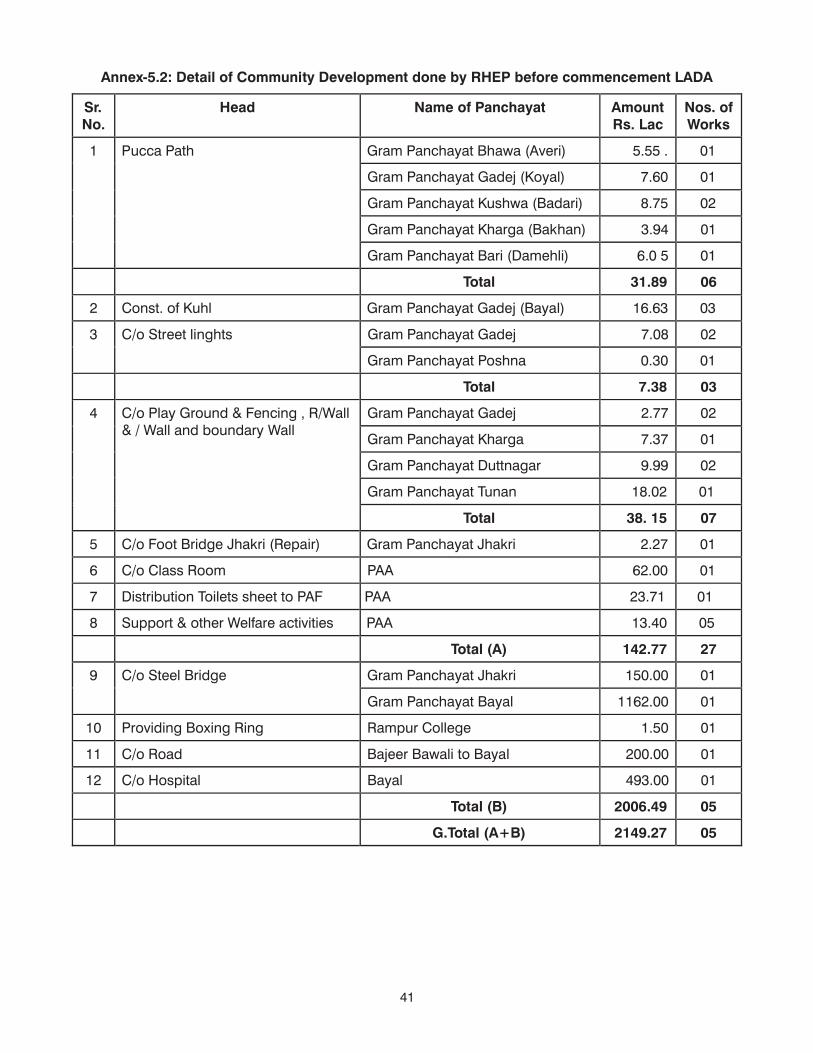
Annex-5.2: Detail of Community Development done by RHEP before commencement LADA
Sr. No.
Head Name of Panchayat Amount Rs. Lac
Nos. of Works
1 Pucca Path Gram Panchayat Bhawa (Averi) 5.55 . 01
Gram Panchayat Gadej (Koyal) 7.60 01
Gram Panchayat Kushwa (Badari) 8.75 02
Gram Panchayat Kharga (Bakhan) 3.94 01
Gram Panchayat Bari (Damehli) 6.0 5 01
Total 31.89 06
2 Const. of Kuhl Gram Panchayat Gadej (Bayal) 16.63 03
3 C/o Street linghts Gram Panchayat Gadej 7.08 02
Gram Panchayat Poshna 0.30 01
Total 7.38 03
4 C/o Play Ground & Fencing , R/Wall & / Wall and boundary Wall
Gram Panchayat Gadej 2.77 02
Gram Panchayat Kharga 7.37 01
Gram Panchayat Duttnagar 9.99 02
Gram Panchayat Tunan 18.02 01
Total 38. 15 07
5 C/o Foot Bridge Jhakri (Repair) Gram Panchayat Jhakri 2.27 01
6 C/o Class Room PAA 62.00 01
7 Distribution Toilets sheet to PAF PAA 23.71 01
8 Support & other Welfare activities PAA 13.40 05
Total (A) 142.77 27
9 C/o Steel Bridge Gram Panchayat Jhakri 150.00 01
Gram Panchayat Bayal 1162.00 01
10 Providing Boxing Ring Rampur College 1.50 01
11 C/o Road Bajeer Bawali to Bayal 200.00 01
12 C/o Hospital Bayal 493.00 01
Total (B) 2006.49 05
G.Total (A+B) 2149.27 05
41

Annex-5.3: Detail of Expenditure of Works Sanctioned under LADA Scheme in district Kullu
Sr. No
Head Name of Panchayat Amount in Rs
No. of works
1 Pucca Path Gram Panchayat Bari 600000 03
Gram Panchayat Bahawa 603000 03
Gram Panchayat Gadej 3812000 09
Gram Panchayat Kharga 2600000 05
Gram Panchayat Poshna 2090000 09
Gram Panchayat Tunan 1260000 03
Total 11303000 32
2 Const. of Kuhl Gram Panchayat Gadej 1342000 03
3 Retaining Wall & Boundary Wall Gram Panchayat Bari 200000 01
Gram Panchayat Tunan 289000 02
Gram Panchayat Gadej 500000 01
Total 989000 04
4 Const of Play Ground and Fencing & Stadium
Gram Panchayat Bari 200000 01
Gram Panchayat Bahawa 800000 02
Gram Panchayat Kharga 400000 01
Gram PanchayatTunan 200000 01
Total 1600000 05
5 C/o Road Gram Panchayat Bahawa 500000 01
6 C/o drinking water line and Tank Gram Panchayat Bahawa 200000 01
Gram Panchayat Tunan 500000 02
Total 700000 03
7 Const. & Repair Building & Temples Gram Panchayat Bahawa 580000 02
Gram Panchayat Gadej 900000 02
Gram Panchayat Kharga 850000 02
Gram Panchayat Poshna 2600000 05
Gram Panchayat Tunan 300000 01
Total 5230000 12
8 C/o Foot Bridge Gram Panchayat Gadej 475000 01
Gram Panchayat Kushwa 5996000 01
Gram Panchayat Tunan 2500000 01
Total 8971000 03
9 Const. of Toilets Gram Panchayat Gadej 262000 01
10 Const. of Shamshan Ghat Gram Panchayat Poshna 400000 01
Total (A) 31297000 64
42

Annex 5.4: Detail of Expenditure of Works sanctioned under LADA Scheme in district Shimla
Sr. No
Head Name of Panchayat Amount
Rs
Nos. of works
1 C/O Rooms Gram Panchayat Duttnagar 1200000 01
2 C/O Fencing & Play ground -do- 2650000 06
3 C/O Pucca Path -do- 900000 08
4 Repair of Nirsu Temple -do- 600000 02
5 C/O Road -do- 700000 02
6 C/O Drainage -do- 100000 01
7 C/O Brest Wall -do- .50000 01
8 C/O Community Bhawan -do- 100000 01
Total 6300000 22
Annex 5.5: Impact of Community Development Works carried out by RHEP since 2009
Activity Activity components
Purpose Perceived benefits
Activity impact
Social Economic
Health Construction of hospital
Provision of health facilities
Easy consultations, free medicines
Better health, low period of illness, sense of wellbeing
Improved work efficiency
Drinking water Pipe lines, storage tanks
Improve water supply
Higher availability Improved standard of living
Time saving, low incidence of water borne diseases, reduction of drudgery for women
Sanitation Distribution of toilet seats and other materials
To improve the sanitation and inculcate the habit of cleanliness
Clean surroundings,
Improved health
Habit of cleanliness and improved sanitation
Time savings, low incidence of diseases
Street lighting Providing street light at Bayal
Easy and safe movement, protection against crimes
Satisfaction of villagers
Low crime rate, safer villages
Long working hours possible
Connectivity Foot paths, foot bridges etc
Easy and safe movement of persons and goods
Efficient carriage/ transportation
Easy and safe movement, cleanliness
Time saving, lower transportation cost
Community centre
Construction of buildings
Facilitate public meetings and provide platform for interactions
Public functions, household celebrations will be facilitated
Improved status of village, facilities for social functions
Community interactions for taking care of local developmental issues
Mahila and Yuvak Mandal buildings
Construction of buildings
Overall development of women and youth
Introduction of income generation activities, constructive use of free time
Meeting point facilitating interactions, exchange of ideas and information
Training and demonstrations
Irrigation Construction and repair of kuhls
To reduce water losses and to augment irrigated area
Improved crop productivity
Higher standard of living
Shift in cropping pattern toward cash crops, higher returns
Temples Construction, repair and improvements
To respect religious sentiments of villagers
Satisfaction of villagers
Religious satisfaction, improved safety
Better aesthetics, long life
Play grounds Construction, improvements, fencing
Promotion of sports, safety
Development of sportsman spirit, better performance in tournaments
Satisfaction of villagers, better equipped schools and villages
Healthy and efficient workers
43

Annex-5.6: Benefits received by Sampled PAF
Benefits Gender Category Total
Landless Land Land & House
Merit scholarship Males 0 3 0 3
Females 1 1 0 2
Technical Education Males 2 7 3 12
Females 0 3 0 3
Income Generation scheme Males 4 16 4 24
Females 4 3 1 8
House on rent Males 2 0 1 3
Females 0 0 0 0
Contractor Males 0 3 0 3
Females 0 0 0 0
Vehicle hire Males 0 1 0 1
Females 0 0 0 0
Total 13 37 9 79
44

About the Authors
Dr. Ranveer Singh is Officer Incharge/Head at Agro-Economic Research Centre, Himachal
Pradesh University, Shimla. He has worked as Principal Investigator for the projects financed by
World Bank, ICIMOD, GTZ, USAID, Ministry of Agriculture, Government of India and
government of Himachal Pradesh. His research and consulting interests focus on agriculture and
rural development policies, agricultural marketing, natural resources management, project
evaluation and studies of resettlement and rehabilitation of displaced people under hydro electric
projects. He nominated as member of various state level Committees and presently Member of
External Committee of Experts constituted by the SJVNL for Undertaking impact study of
Corporate Social Responsibility (CSR) & Sustainable Development (SD) Projects. He is author of
two books and 70 research papers published in reputed national and international journals. He has
completed about 60 research projects for national and international organizations. He has guided
fifteen students of Ph. D and M. Phil in Agricultural Economics.
Dr. C.S. Vaidya is a senior economist working with the Agro Economic Research Centre of
Himachal Pradesh University, Shimla for last 32 years and has very good knowledge of diverse
agro-climatic and cultural conditions of mountainous areas. He has been instrumental in
successful completion of many studies conducted for international agencies like ICIMOD, USAID,
GTZ, FAO and World Bank, etc. Dr. Vaidya has conducted numerous studies for Government of
Himachal Pradesh and Ministry of Agriculture, GOI on such diverse issues such as livelihood
strategies, cost of production, marketing management, project impact evaluation etc. His research
focuses on evaluation and monitoring of development interventions and resettlement and
rehabilitation policies of project affected population, predominantly hydropower projects. He is an
expert in conducting cost of cultivation studies for field and horticultural crops, project evaluation,
impact studies and studies on policy analysis and has deep interest in organic farming and has
worked on national level studies on this subject. Dr. Vaidya's work in this field has led to
publication of a book on environmental and economic aspect of organic farming. Conducting field
studies in marginalized communities is one of his strong points. He has number of research reports,
research articles published in national and international journals to his credit. He is also guiding
Ph.D. and M.Phil. students of department of Economics of Himachal Pradesh University.

AGRO-ECONOMIC RESEARCH CENTRE HIMACHAL PRADESH UNIVERSITY
SHIMLA-171005 (INDIA)