experiments decomposition and soil co2 emission - teaching
TRANSCRIPT
TIEE Teaching Issues and Experiments in Ecology - Volume 6, February 2009
EXPERIMENTS
Decomposition and Soil CO2 Emission Jeffrey A. Simmons Science Department Mount St. Mary's University Emmitsburg, MD 21727 [email protected]
Table of Contents: ABSTRACT AND KEYWORD DESCRIPTORS...........................................................2 SYNOPSIS OF THE LAB ACTIVITY............................................................................4 DESCRIPTION OF THE EXPERIMENT
Introduction..............................................................................................................6 Materials and Methods...........................................................................................10 Questions for Further Thought and Discussion......................................................13 References and Links.............................................................................................14 Tools for Assessment of Student Learning Outcomes...........................................16 Tools for Formative Evaluation of This Experiment.........…...................................16
NOTES TO FACULTY.................................................................................................17 STUDENT COLLECTED DATA……………………………………………….………..…23 COPYRIGHT AND DISCLAIMER................................................................................24 CITATION: Jeffrey A. Simmons. February 2009, posting date. Decomposition and Soil CO2 Emission. Teaching
Issues and Experiments in Ecology, Vol. 6: Experiment #2 [online]. http://tiee.ecoed.net/vol/v6/experiments/soil_respiration/abstract.html
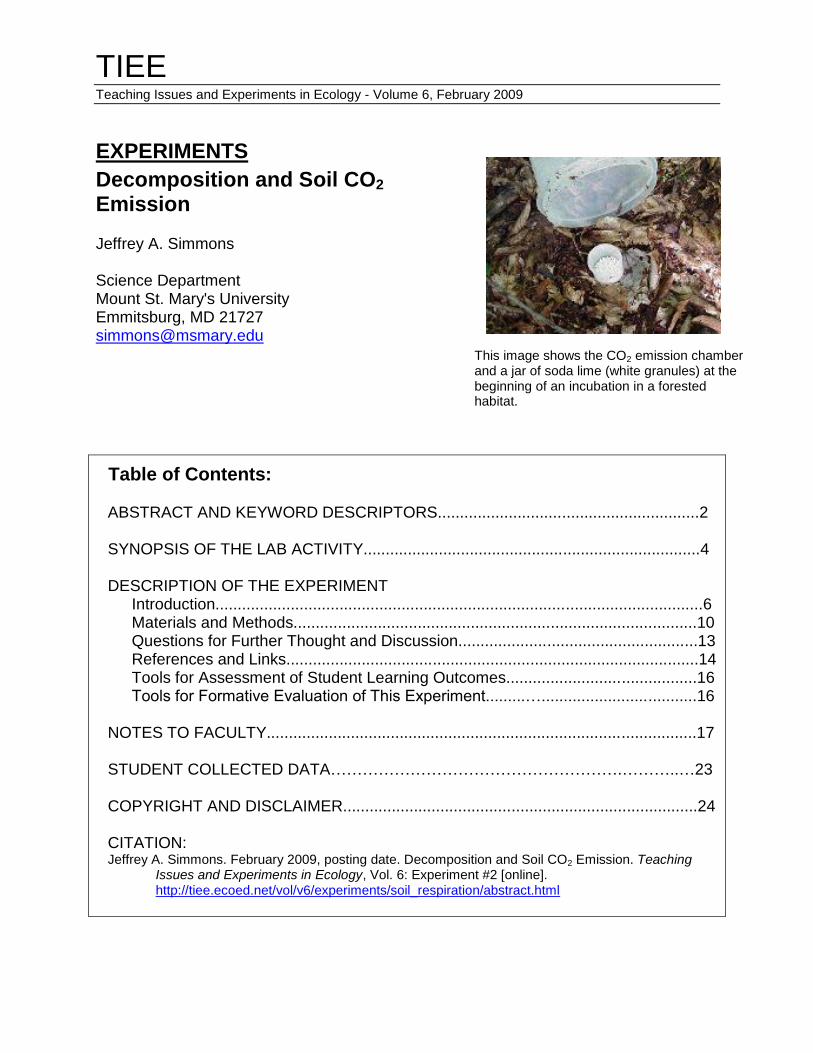
This image shows the CO2 emission chamber and a jar of soda lime (white granules) at the beginning of an incubation in a forested habitat.
page 2 Jeffrey A. Simmons TIEE Volume 6, February 2009
ABSTRACT Students investigate the factors that control the rate at which CO2 is emitted from soil using simple soil chambers and soda lime in a field experiment. Students in small groups design and conduct their own experiments to investigate the effects of soil and microclimate factors on CO2 emission. The projects are typically conducted over two consecutive lab periods. During the first session students design their experiment and initiate their incubations. The incubation is ended after 24 to 48 hours and during the following lab period the final results are collected, the data are statistically analyzed, and a lab report is written as homework.
KEYWORD DESCRIPTORS
Ecological Topic Keywords: carbon dioxide, abiotic factors, biogeochemical cycles, biophysical ecology, biotic factors, carbon cycle, climate change, decomposition, ecological services, ecosystems, ecosystem function, forest ecology, grasslands, greenhouse effect, global warming, microorganisms, slope effects, soil carbon, temperature
Science Methodological Skills Keywords: collecting and presenting data, data analysis, experimental design, field work, formulating hypotheses, graphing data, hypothesis generation and testing, identify biotic-abiotic interactions, library research, quantitative data analysis, quantitative sampling, scientific writing, soil moisture analysis, statistics, use of primary literature, use of spreadsheets, writing lab reports
Pedagogical Methods Keywords: bounded inquiry, cooperative learning, formal groupwork, group work assessment, guided inquiry, inquiry, open-ended inquiry, peer evaluation, project-based teaching, rubric, prime trait assessment
CLASS TIME Two three-hour lab sessions (plus, possibly, one lecture period).
OUTSIDE OF CLASS TIME Students will spend 4 to 6 hours, primarily writing up the associated draft and final lab reports. STUDENT PRODUCTS Group Experimental Design (1-2 pages) Lab report (8-12 pages, 2 drafts) SETTING This experiment was originally designed for forested ecosystems but is easily adapted to grassland or other terrestrial environments. Very steep or rocky terrain can be problematic for the incubation chambers. In cold weather or in waterlogged soils the
page 3 Jeffrey A. Simmons TIEE Volume 6, February 2009
emission of CO2 is usually too low to be detectable by this method. In these circumstances a modified version of the experiment can be conducted indoors or in a greenhouse. COURSE CONTEXT This experiment has been used successfully in a freshman-level introductory Biology course (3-4 sections of 24 students each) and in an upper-level Ecology course (up to 18 students). INSTITUTION Four-year, private, small, liberal arts, primarily undergraduate institution. TRANSFERABILITY This experiment is very flexible and is easily translatable to larger or smaller class sizes and to non-majors classes. It can be adapted for use in meadows, gardens, lawns, and construction sites. Users just need to be sure to remove any plants from under the chambers as they will absorb CO2. It can be used indoors or in a greenhouse by creating artificial soils in a plant tray or bin. The indoor setting gives experimenters greater control over environmental variables and allows them to manipulate the soil composition. ACKNOWLEDGEMENTS I learned this technique from Dr. Joseph Yavitt and Dr. Timothy Fahey as a graduate student at Cornell University. Funding for development and testing of the exercise was provided through a 2003 award from the National Science Foundation’s Course, Curriculum and Laboratory Improvement Program (#DUE-0410577) as part of the Collaboration through Appalachian Watershed Studies (CAWS) project.
page 4 Jeffrey A. Simmons TIEE Volume 6, February 2009
SYNOPSIS OF THE EXPERIMENT
Principal Ecological Question Addressed How do environmental factors influence the rate of CO2 emission from soil? What Happens Before the lab meets, students read about decomposition, the global carbon cycle, and how the experimental chambers work. At the first lab session in small groups they collaboratively design their own experiment that will examine the influence of a single environmental factor on the rate of CO2 emission from soil. They then conduct the experiment (which involves a 24 to 48 hour incubation in the field). The following week in lab students measure final weights of soda lime, they use a t-test to statistically analyze their results, and as homework write a draft lab report and then a final lab report. Experiment Objectives At the end of this lab exercise students will be able to:
1. Explain how environmental factors, such as soil characteristics and microclimate, can affect soil CO2 emission
2. Use the scientific method appropriately to answer a question, including
generating hypotheses, designing an experiment, and statistically analyzing data.
3. Clearly communicate scientific results in writing and in the appropriate format Equipment/ Logistics Required
Drying oven (105ºC)
Analytical balance (reads to 0.001 g)
30 small glass jars with lids (40 to 100 mL)
Desiccator
Soda lime
Aluminum weighing dishes
Clipboards
20 to 40 RubbermaidTM 3-L Cylinders or 2-L Bowls
Soil thermometers (or digital thermometers with metal probes)
pH meter (optional)
An experimental site where chambers can be left out overnight where they won’t be disturbed or vandalized

page 5 Jeffrey A. Simmons TIEE Volume 6, February 2009
Summary of What is Due
An Experimental Design written by student groups
A formal, 8 to 12 page Lab Report (2 drafts) written by individuals
page 6 Jeffrey A. Simmons TIEE Volume 6, February 2009
Respiration
Atmospheric CO2
Organic Carbon
Soil Organic Carbon
Photosynthesis
CO2 Emission
SYNOPSIS OF THE EXPERIMENT
Introduction (written for students) Every good gardener knows that the key to healthy plants is a fertile soil. Plants get water and nutrients from soil and it is the inherent characteristics of the soil in combination with environmental factors that determine soil fertility. Soils are complex and dynamic ecosystems with communities of organisms. Like all ecosystems they have a food web that may include bacteria, fungi, algae, protists, insects, worms, plant roots and burrowing animals. Soils also carry out essential ecosystem functions like water storage and filtration and, perhaps most importantly, decomposition.
Decomposition in soils is a key ecosystem function that in part determines the productivity and health of the plants growing there. Decomposers feed on dead organic matter and in the process break it down into its simplest components: carbon dioxide, water and nutrients (organic matter consists of material or molecules produced by living organisms). The process of decomposition releases large quantities of essential nutrients to the soil solution, thereby making them available to plant roots. In northern hardwood forests, for example, about 85% of a tree’s nitrogen comes from decomposition (Bormann and Likens 1979). Thus, if decomposition of a forest is impaired by drought, acid rain or some other stress, the vegetation may experience nutrient deficiencies.
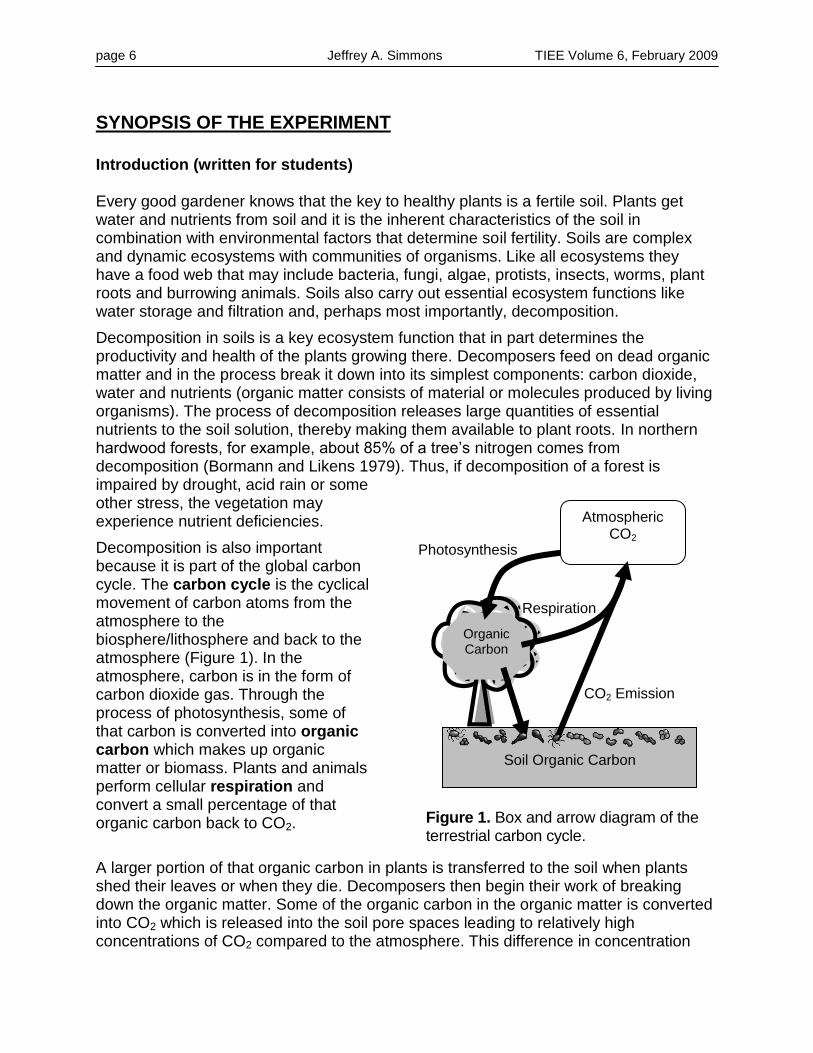
Decomposition is also important because it is part of the global carbon cycle. The carbon cycle is the cyclical movement of carbon atoms from the atmosphere to the biosphere/lithosphere and back to the atmosphere (Figure 1). In the atmosphere, carbon is in the form of carbon dioxide gas. Through the process of photosynthesis, some of that carbon is converted into organic carbon which makes up organic matter or biomass. Plants and animals perform cellular respiration and convert a small percentage of that organic carbon back to CO2.
A larger portion of that organic carbon in plants is transferred to the soil when plants shed their leaves or when they die. Decomposers then begin their work of breaking down the organic matter. Some of the organic carbon in the organic matter is converted into CO2 which is released into the soil pore spaces leading to relatively high concentrations of CO2 compared to the atmosphere. This difference in concentration
Figure 1. Box and arrow diagram of the terrestrial carbon cycle.
page 7 Jeffrey A. Simmons TIEE Volume 6, February 2009
causes CO2 to diffuse from the soil to the atmosphere. This movement or flux of CO2 is known as CO2 emission (Figure 1).
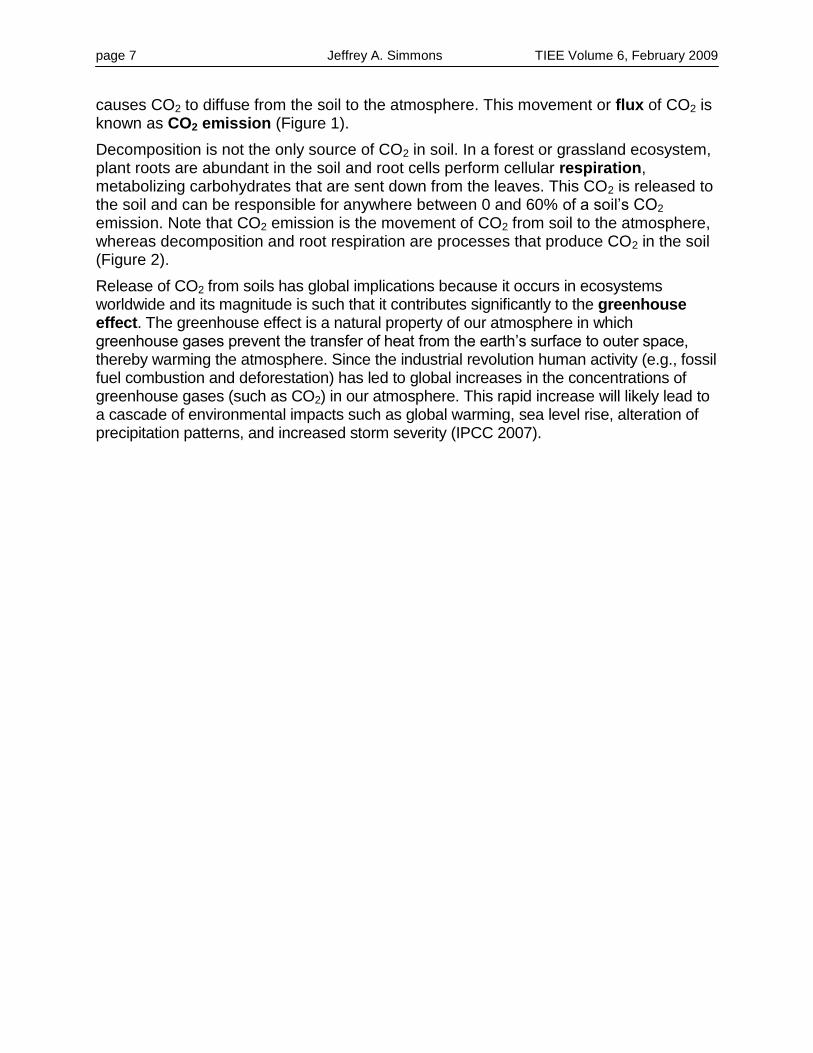
Decomposition is not the only source of CO2 in soil. In a forest or grassland ecosystem, plant roots are abundant in the soil and root cells perform cellular respiration, metabolizing carbohydrates that are sent down from the leaves. This CO2 is released to the soil and can be responsible for anywhere between 0 and 60% of a soil’s CO2 emission. Note that CO2 emission is the movement of CO2 from soil to the atmosphere, whereas decomposition and root respiration are processes that produce CO2 in the soil (Figure 2).
Release of CO2 from soils has global implications because it occurs in ecosystems worldwide and its magnitude is such that it contributes significantly to the greenhouse effect. The greenhouse effect is a natural property of our atmosphere in which greenhouse gases prevent the transfer of heat from the earth’s surface to outer space, thereby warming the atmosphere. Since the industrial revolution human activity (e.g., fossil fuel combustion and deforestation) has led to global increases in the concentrations of greenhouse gases (such as CO2) in our atmosphere. This rapid increase will likely lead to a cascade of environmental impacts such as global warming, sea level rise, alteration of precipitation patterns, and increased storm severity (IPCC 2007).
page 8 Jeffrey A. Simmons TIEE Volume 6, February 2009
A great deal of research money and effort has been invested in studies of soil CO2 emission in recent years because of the potential impacts of this process on the greenhouse effect (Schlesinger and Andrews 2000). The amount of organic carbon stored in soils worldwide is about 1600 gigatons (Gt) compared to 750 Gt in the atmosphere mostly in the form of CO2 (Rustad et al. 2000). Thus, if soil respiration increased slightly so that just 10% of the soil carbon pool was converted to CO2, atmospheric CO2 concentrations in the atmosphere could increase by one-fifth! Several environmental factors control the rates of decomposition and root respiration and therefore, the rate of CO2 emission from soils. Since decomposition is an enzyme-mediated biological process carried out by bacteria and fungi, it is very sensitive to
temperature. In most soils, the decomposition rate peaks at about 25 C and declines as temperature varies from this maximum. Soil moisture also affects the activity of microorganisms. Very dry or very wet (flooded) conditions tend to reduce decomposition
Figure 2. Flow diagram showing the pathway from organic carbon and roots in soil to atmospheric CO2. Boxes represent amounts of carbon (mass) and arrows represent fluxes (mass per unit area per unit time). The italicized terms indicate environmental factors that control the fluxes.
CO2 Emission
Dead Organic Carbon
Soil CO2
Atmospheric CO2
Decomposition
Temperature Moisture pH Substrate Quality
Soil moisture Soil texture
Roots Root Respiration
Temperature
page 9 Jeffrey A. Simmons TIEE Volume 6, February 2009
rates (Hanson et al. 1993). A history of acid deposition can also lower the pH of soils thereby inhibiting decomposers. Respiration rates will also depend on how fast CO2 molecules can diffuse to the soil surface. Diffusion will be affected by soil moisture (how much of the pore space is filled with water) and soil texture (the size distribution of soil particles). Thus, it is likely that soil temperature, moisture, pH, density and texture will all influence soil respiration rates. In this exercise, you will investigate the effects of these (and perhaps other) environmental factors on CO2 emission (Figure 2). One of the most common methods for measuring soil respiration, the soda-lime method, is remarkably easy and does not require expensive equipment. As a result scientists all over the world have employed it (Grogan 1998). Soda lime is a variable mixture of sodium hydroxide (NaOH) and calcium hydroxide (Ca(OH)2) in granular form. It’scommonly used in laboratories as a desiccant because it readily absorbs water vapor from the air. Because of its alkaline properties soda lime also removes carbon dioxide very efficiently from the atmosphere according to these reactions: 2NaOH (s) + CO2 (g) Na2CO3 (s) + H2O (ads) [1]
Ca(OH)2 (s) + CO2 (g) CaCO3 (s) + H2O (ads) [2]
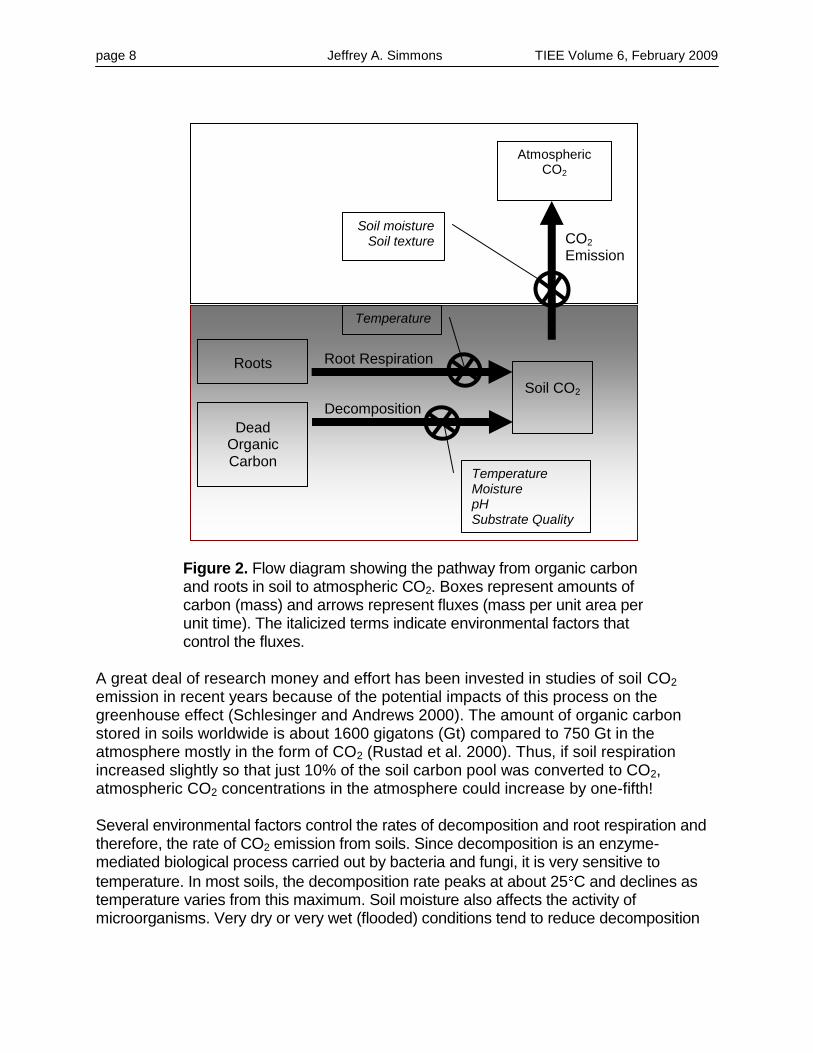
Note that for every molecule of CO2 adsorbed, a molecule of water is created. These water molecules remain temporarily adsorbed (ads) to the soda lime but can be evaporated off at boiling temperatures. The soda lime method involves placing a pre-weighed, open dish of soda lime on the ground and covering it with a chamber of known diameter (Figure 3). As the soil CO2 diffuses into the chamber it is quickly absorbed by the soda lime (along with water vapor). After 24 hours, the chamber is removed and the soda lime is dried at
105 C to evaporate the water and then weighed. The increase in mass of the soda lime is attributable to CO2 (Edwards 1982, as modified by Grogan 1998).
Figure 3. Schematic diagram of the soil respiration chambers. CO2 diffuses from the soil into the chamber air space. It is then absorbed by the soda lime.
CO2 Soda Lime
Chamber

page 10 Jeffrey A. Simmons TIEE Volume 6, February 2009
Materials and Methods Study Site(s) With your Instructor, choose appropriate study sites that are relatively flat and are not extremely stony. You need to be able to place an 18 cm (7.1 in) diameter chamber on the ground where there are no living plants and no large stones. Depending on your experimental question you may want two contrasting sites like conifer site vs. hardwood site, north slope vs. south slope, or dry vs. wet. Overview of Data Collection and Analysis Methods
1 to 2 Days Before Lab Session 1:
Label glass jars (40- to 100-mL glass jar with screw top) with a piece of tape and permanent marker. Add approximately 8 grams of soda lime to each jar. Place the jars with soda lime in an oven at 105°C for at least 24 hours to evaporate the water from the granules. You will need 8 - 10 jars per group plus one extra that the whole class can use for the blank.
Lab Session 1: 1. Remove jars from the oven (use gloves or tongs!) and place in a desiccator to
cool for 2-5 minutes. Remove jars from desiccator one at a time, weigh to the nearest milligram (0.001 g) or tenth-milligram (0.0001g) and cover immediately. Record the mass as the initial mass in Table 1 (Excel file).
2. Take the jars, chambers, thermometers and sampling equipment and go out
to your field site. Take a few minutes to note the variations in microclimate and microtopography within the forest.
3. In small groups design your experiment. You will be comparing the rate of soil
CO2 emission of two sites with different microclimates and/or soil characteristics. As a group, decide on the sites or the microclimates you would like to compare. Here are some suggestions but you are encouraged to think of your own:
Conifer site vs. hardwood site Sun vs. shade Ridgetop vs. valley bottom With leaf layer vs. without leaf layer (i.e., the layer of dead leaves on the soil surface is removed)
4. As a group write out your Experimental Design according to the handout,
Experimental Design Requirements. Show it to your Instructor for approval
page 11 Jeffrey A. Simmons TIEE Volume 6, February 2009
before proceeding. As homework type up your answers to the questions on the handout.
5. Place a chamber upside down on a relatively flat area of the soil. The entire
rim of the chamber must be inserted at least 1 cm into the soil so as to minimize gas exchange with the atmosphere. So, carefully remove twigs and small rocks that lie under the rim without disturbing the leaves and soil surface under the chamber. Remove any green plants by pinching or cutting them at soil level. It is essential that the soil be disturbed as little as possible!
6. Slowly and carefully push down while rotating the chamber back and forth to
force the edges about 1 – 2 cm into the soil surface. If there are subsurface roots or rocks in the way, you may need to move to another location. The key here is to get a good seal all along the edge of the chamber so there are no gaps.
7. Obtain a jar containing soda lime. Remove the cap and place the jar under
the chamber so that it rests on the soil surface. Make sure it is not likely to tip over.
8. Replace the chamber and place a weight on it (like a fist-sized rock or a thick
branch) to maintain pressure and keep it from blowing away or tipping over.
9. Record the number of the soda lime jar and the number and location of the chamber. Repeat these steps for each of the chambers at each site.
10. At one of the sites used by the class, place an opened jar of soda lime in an
upright chamber and seal the chamber with a lid. This will serve as a blank to document the amount of CO2 absorbed from the air in the chamber and during the opening and closing of the jars. Only one blank is needed for all of the groups.
11. Let all chambers incubate for 24 (+ 4) hours. If the ambient daytime air
temperature is below 16ºC, then incubate the chambers for 48 (+ 4) hours.
12. Before leaving the site quantify the differences in environmental factors between your two sampling sites. You may measure any or all of the following. Your Instructor may have additional parameters for you to measure. Click here for instructions on measuring these variables.
Soil temperature Soil moisture Soil pH
page 12 Jeffrey A. Simmons TIEE Volume 6, February 2009
1 or 2 Days After Lab Session 1:
1. Return to the field site after the designated time has elapsed. Remove the chambers and cap the soda lime jars. Return all materials to the lab. Uncover the soda lime jars and place them in the drying oven at 105ºC.
Lab Session 2:
1. Remove the dry soda lime from the oven and place in a desiccator to cool for 5 minutes. Remove jars one at a time from the desiccator, weigh to the nearest milligram (0.001 g) or tenth-milligram (0.0001 g). Record this as the final mass (which includes the mass of the jar) in Table 1 (Excel file).
2. Calculate the mg of soil CO2 absorbed by the soda lime in each chamber:
Change in Mass of Blank (g) = Mb = (Final Mass of Blank – Initial Mass of Blank)
Soil CO2 Absorbed (g) = Final Mass – Initial Mass – Mb
3. Calculate the CO2 Emission Rate (E) for each chamber:
Ac = Area of ground covered by chamber (m2)
E (g CO2 m
-2 d-1) = (Soil CO2 Absorbed * 1.69) / Ac / Days of Incubation
[The 1.69 in the equation above is used to correct for the water molecule that is lost when a molecule of CO2 is adsorbed.]
Click here for a data sheet in EXCEL format.
4. Perform a Student’s t-Test on the CO2 Emission Rates to test for significant
differences between the two experimental treatments. Click here for a step-by-step procedure.
5. With help from the Instructor summarize your environmental variables and
create a table in the proper format to present these data. Homework: Write a lab report using the proper format. Click here for report guidelines. Your Instructor will assign a due date for the first draft of the report and for the final draft of the report.
page 13 Jeffrey A. Simmons TIEE Volume 6, February 2009
Questions for Further Thought and Discussion
1. How did your two sampling sites differ in terms of temperature, moisture, pH or other characteristics? Could these differences explain the differences you observed in CO2 emission rate?
2. The soil under your chambers probably contained plant roots. How might these
plant roots have affected your CO2 emission rates? Explain. Design an experiment using these chambers that would allow you to determine what proportion of the CO2 emitted came from roots and what proportion came from decomposition.
3. Explain how decomposition in soils is linked to the greenhouse effect.
4. If just 5% of the world’s soil organic carbon pool was decomposed, how many
tons of carbon would be released?
5. Calculate the average CO2 emission rate and standard deviations for each sample location (or perform a statistical test). Put these values in a table. Then write two to three paragraphs describing and interpreting the results of your experiment.
6. The temperature and moisture data you collected represent point-in-time
measurements. Do you think the temperatures and soil moisture values are representative of the microclimate during the entire incubation period? What would be a more accurate way to quantify the microclimate during the incubation period?
7. Are there other environmental or site factors that you did not measure that could
explain the differing rates of CO2 Emission between your sampling locations? Explain how they would affect the emission rate.
8. CO2 Emission varies with geographic location and with season. Conduct a
literature search for soil CO2 emission values from around the world. Try to find some from your area. Some key words that will aid you in your search are: soil respiration, soil CO2, soil carbon, carbon emissions, CO2 emissions, soda lime, carbon cycle. What range of values can you find? Where are the values the highest? Where are they the lowest? How does your area compare? [Note: make sure when you compare values from different studies that you convert all the values to the same units!]
9. Because decomposition is a temperature-dependent process, it is expected to be
affected by global warming. Write down one or two predictions about how decomposition in soil will change and how those changes will affect plants. Then conduct a literature search to find out what the experts are predicting. Were your predictions correct? If not, why not? What other predictions have the experts
page 14 Jeffrey A. Simmons TIEE Volume 6, February 2009
made? Some search phrases that will aid you in your search are: soil CO2, CO2 emissions, soil respiration, global warming soil carbon, tundra soils, global warming positive feedback, soil respiration temperature, decomposition temperature.
References and Links References Bormann, F.H. and G.E. Likens. 1979. Pattern and Process in a Forested Ecosystem.
Springer-Verlag, New York, NY. Buchman, N. 2000. Biotic and abiotic factors controlling soil respiration rates in Picea
abies stands. Soil Biology and Biochemistry 32:1625-1635. Edwards, N.T. 1982. The use of soda-lime for measuring respiration rates in terrestrial
systems. Pedobiologia 23:321-330. Grogan, P. 1998. CO2 flux measurement using soda lime: correction for water formed
during CO2 adsorption. Ecology 79:1467-1468. Hanson, P.J., S.D. Wullschleger, S.A. Bohlman, and D.E. Todd. 1993. Seasonal and
topographic patterns of forest floor CO2 efflux from an upland oak forest. Tree Physiology 13:1-15.
Hogberg, P., A. Nordgren, N. Buchmann, A.F. Taylor, A. Ekblad, M.N. Hogberg, G.
Nyberg, M. Ottosson-Lofvenius, D.J. Read. 2001. Large scale forest girdling shows that current photosynthesis drives soil respiration. Nature 411:789-92.
IPCC, 2007: Climate Change 2007: The Physical Science Basis. Contribution of
Working Group I to the Fourth Assessment Report of the Intergovernmental Panel on Climate Change [Solomon, S., D. Qin, M. Manning, Z. Chen, M. Marquis, K.B. Averyt, M. Tignor and H.L. Miller (eds.)]. Cambridge University Press, Cambridge, United Kingdom and New York, NY, USA, 996 pp.
Raich, J.W., and W.H. Schlesinger. 1992. The global carbon dioxide flux in soil
respiration and its relationship to vegetation and climate. Tellus 44B:81-99. Rustad, L.E., T.G. Huntington, R.D. Boone. 2000. Controls on soil respiration:
Implications for climate change. Biogeochemistry 48:1-6. Schlesinger, W.H., and J.A. Andrews. 2000. Soil respiration and the global carbon
cycle. Biogeochemistry. 48:7-20.
page 15 Jeffrey A. Simmons TIEE Volume 6, February 2009
Simmons, J.A., I.J. Fernandez, R.D. Briggs and M.D. Delaney. 1996. Forest floor carbon pools and fluxes along a regional climate gradient in Maine, USA. Forest Ecology and Management 84:81-95.
Toland, D.E., and D.R. Zak. 1994. Seasonal patterns of soil respiration in intact and
clear-cut northern hardwood forests. Canadian Journal of Forest Research 24:1711-1716.
Links Caprette, D.R. 2005. Student’s t-Test (for independent samples).
(http://www.ruf.rice.edu/~bioslabs/tools/stats/ttest.html, accessed 4 December 2007)
Davidson, E. 2006. Soil respiration, temperature and moisture.
(http://harvardforest.fas.harvard.edu/data/p00/hf006/hf006.html, accessed 12 December 2007)
Dolphin, W.R. 1997. Writing Lab Reports and Scientific Papers.
(http://www.mhhe.com/biosci/genbio/maderinquiry/writing.html, accessed 13 December 2007)
Environmental Literacy Council. 2006. Soil and the Carbon Cycle.
(http://www.enviroliteracy.org/article.php/700.html, accessed 4 December 2007) Harmon, M. 2003. LIDET: Long-term intersite decomposition experiment team.
(http://www.fsl.orst.edu/lter/research/intersite/lidet.htm, accessed 13 December 2007)
Rice, C.W. 2005 (posting date). What is the carbon cycle? (http://soilcarboncenter.k-
state.edu/carbcycle.html, accessed 4 December 2007) Roche, J. 2007. How to write a lab report. (http://inpp.ohiou.edu/~roche/371_fall07/how_to_write_a_lab_report.pdf, accessed
10 December 2007) Trochim, W.M.K. 2006. The t-test. (http://www.socialresearchmethods.net/kb/stat_t.php,
accessed 13 December 2007) United States Geological Survey. 2006. Assessing carbon stocks in soil.
(http://edcintl.cr.usgs.gov/carbon_cycle/carbonstocks.html, accessed 11 December 2007)
Woods Hole Research Center. 2005. Soil Respiration.
(http://www.whrc.org/new_england/Howland_Forest/soil_respiration.htm, accessed 5 December 2007)

page 16 Jeffrey A. Simmons TIEE Volume 6, February 2009
Tools for Assessment of Student Learning Outcomes: Assessment You will be assessed on two aspects of this project - the experimental design and the written lab report. The experimental design will be used to assess your ability to use the scientific method appropriately to answer a question. The lab report will be used to test your comprehension of the principles behind soil respiration and your ability to communicate in writing in proper scientific format. Experimental Design Guidelines
Lab Report Guidelines
Rubrics
Experimental Design Rubric Lab Report Prime Trait Assessment (EXCEL file and WORD file)
Sample Exam Questions
Q. The process that converts atmospheric CO2 into organic C in plants is_________. A. Photosynthesis Q. If global warming were to lead to warmer soil temperatures and therefore faster decomposition worldwide, what would you expect to happen to the levels of CO2 in the atmosphere (all else being equal)? Explain. A. Faster decomposition would lead to greater CO2 emission rates which would lead to an increase in atmospheric CO2 concentration. Q. Acid deposition tends to inhibit soil microbial populations and lead to slower decomposition. What effect, if any, will this have on the vegetation? Explain. A. Plants obtain most of their nutrients from the decomposition process. If decomposition is slowed, plants may become nutrient deficient or their growth will be slowed .
page 17 Jeffrey A. Simmons TIEE Volume 6, February 2009
NOTES TO FACULTY Challenges to Anticipate and Solve:
1. Free-riders: In a group setting, it is common for some students (especially weaker students and quiet or shy students) to step back and let the other group members do the work and contribute answers. One solution is to make that person the recorder or notetaker. Step in and say something like, “Make sure you have someone recording your data. Mike, why don’t you do that,” and hand him the clipboard. That gives that person an active role to play and sometimes it even becomes a leadership position. 2. Statistical Guidance: I have my students run a t-test on their results using EXCELTM (Microsoft, Inc.). Most of our students have been exposed to the t-test before but they usually still need some guidance so I make sure they do this procedure in lab while I am around. This step is optional and some faculty may not want to bother with it. I include a handout with step-by-step instructions for performing the t-test (click here for t-test instructions).
Experiment Description Introducing the Experiment to Your Students Typically I cover much of the introductory material (decomposition and the carbon cycle) in lecture before the lab activity, so students are somewhat familiar with it. In lab we begin indoors where I review the concepts briefly. I show them the incubation chambers and review how soda lime works. Finally I tell them that they will be working in groups to design their own experiment to determine how environmental factors affect soil respiration.
Then we head outside to a nearby forest on campus. I have found that students need some guidance in knowing what to look for. I point out differences in soil type, leaf litter types and amounts, sunlight, slope, and topography and ask them how the microclimate might differ in each case. I give them 15 – 20 minutes to walk around, observe, and as a group come up with an idea for an experiment. They write out their experimental design while outside and then type it up as homework before turning it in. An option for an upper level class is to give them less information about the environmental factors (i.e., edit the Introduction section to omit these), let them generate their hypotheses “from scratch” and run their experiments. This option will likely require more time for discussion.
page 18 Jeffrey A. Simmons TIEE Volume 6, February 2009
Data Collection and Analysis Methods Used in the Experiment A forest setting works best because the herbaceous vegetation is sparse and the soil organic matter content is high. Any green plant in the chamber may remove CO2 through photosynthesis, so it is important to remove or avoid all plants (unless you want to measure photosynthesis). Even a small stand of trees is adequate. However, I have also used the technique successfully in grasslands, gardens and lawns. When herbs are present they can be removed by pinching or cutting them off at ground level. In a lawn or grassland you can treat small patches with herbicide several days ahead of time. Note that when a plant is killed, the rapid decomposition of its roots will create a spike in decomposition between 2 and 5 days later. So soil respiration must be measured immediately after cutting the plant or after 5 days have elapsed. Weather is an important consideration. When soil temperatures are above 16ºC, a 24-hour incubation period is usually adequate. At cooler temperatures, a 48- to 96-hr incubation period may be required. Avoid rainy days or waterlogged soils. Excessive moisture as during a rain storm will turn the soda lime to mush. Flooded conditions also inhibit CO2 diffusion from soil.
You can expect a mass change in the soda lime of about 0.01 to 0.3 g so a 0.001 g balance should work fine. A 0.0001 g balance will give better precision but is not necessary in most cases. It may be difficult for all the students to get out to the site after the 24 or 48 hour incubation period. If my lecture falls on that day, I will take them out during the lecture period to collect the soda lime. This step in the procedure does not take much time. Another option is to ask for just a few student volunteers to do the collection for everybody. Because the chambers will be sitting out unattended for one or more nights, it is important to consider the problem of vandalism. It is best to place chambers away from trails, high-traffic areas, or places where people may congregate. If they must be set out in public view then it is best to post a small sign explaining that this is an experiment and “please do not disturb”. Don’t forget to contact your Physical Plant or Groundskeeper or they may pick up the chambers thinking that they are litter (I learned this the hard way)!
Questions for Further Thought
1. Instructors may need to help students summarize their environmental
measurements and to figure out exactly what they mean. For example, students may not immediately grasp the idea that a south-facing slope gets more direct sunlight than a north-facing slope and that this could effect soil temperature and moisture.

page 19 Jeffrey A. Simmons TIEE Volume 6, February 2009
2. It is important for students to recognize that plant roots can contribute to soil respiration as well as microorganisms.
3. Students can be referred to the Introduction section of the lab exercise or to the
internet to find answers to this question. 4. The world’s soil organic carbon pool mass can be found in the Introduction
section or students could be assigned to research several estimates. 5. Students may need assistance properly formatting a table (they often want to
include raw values instead of summary data like means, for example). Instructors can find a sample table and formatting requirements in the Lab Report Guidelines document [click here] or they can develop their own.
6. With some leading questions Instructors can get students to realize that soil
temperature probably changes from day to night and that soil moisture may change over a 24 – 96 hour incubation period.
7. Based on discussions held during the first lab session, students should have
some ideas for these already. I will usually point them to some pages in their textbook about microclimate and microtopography or supply some references for them related to slope, aspect, soil bulk density, vegetation, etc.
8. I have found students often have difficulty coming up with good key words for
internet searches because they are unfamiliar with the “jargon” of a particular field, so I usually will supply them with some. They may also need training on how to find and use search engines. Library staff can be very helpful here.
9. Same comments as for #8 above.
Assessment of Student Learning Outcomes The use of a Prime Trait Assessment (PTA) has been extremely useful to me over the years because it speeds up my grading process, makes my grading more consistent and objective, and, by using it in several classes, allows me to compare lab reports among classes and over time for departmental assessment purposes. Because it is in spreadsheet form, it can be filled in electronically without having to resort to paper (the spreadsheet also automatically adds up the points!) The PTA is a form of rubric that assesses student performance relative to certain “prime traits”. Because the PTA is so long and detailed there is a bit of learning curve for new users but after a few uses it becomes a time-saver. My suggestion is to read through the lab report and make your normal comments and corrections in the text and margins. Then go through the rubric and check all the errors that were found in the paper. Assign points for each category (as described below) and total them up for the score.

page 20 Jeffrey A. Simmons TIEE Volume 6, February 2009
Here’s how the scoring works: Let’s say in the Introduction section of the lab report you find two incorrect statements and that the significance of the research was unclear and the hypotheses were missing. You would put two X’s in the “Incorrect or contradictory statements” box, an X in the “significance of the research was unclear” box, an X in the “three or more of the above errors” box (because of the previous three X’s), and an X in the “No statement of hypotheses” box. The score for the Introduction section would be 3 points out of a possible 10 because that was the lowest score of all the boxes that were checked. This is where the grading rationale of the PTA is somewhat unconventional. Instead of losing points for each infraction and accumulating those deductions, the student is graded based on his/her most egregious error. This tends to highlight those errors and shows students what aspects are most important (the prime traits) in a report. Notes on scoring: Students at first are a little shell-shocked when they receive their numeric grades because the bell-curve is shifted to the left with this rubric. A grade of 50 – 60% is common for a first draft lab report and scores of 95% or more are very rare. I make sure to convert their numeric grade to a letter grade. They feel a little better when they see that a 61% is comparable to a B-. By filling in the PTA electronically and using it in several classes including a sophomore class and senior class, I have been able to track the progress of individual students through the curriculum with respect to writing lab reports. I also have a long-term time series accumulated that shows trends over time.
page 21 Jeffrey A. Simmons TIEE Volume 6, February 2009
Comments on Formative Evaluation of this Experiment I have used three types of formative evaluation in this exercise. The question I ask myself (and the students) is: how can I help students achieve the three learning objectives? The first type of formative evaluation is already imbedded in the exercise and that is the Experimental Design assignment. As I grade that assignment I can evaluate and provide feedback to the students on two aspects of learning objectives 1 and 3: writing hypotheses and writing a methods section. During Session 2 we go over this graded assignment and that gives students a chance to correct mistakes and ask questions. The second formative evaluation is a Quiz/Survey given at the beginning of Lab Session 2. It is intended to assess the degree to which they have achieved learning objective 2 and also to identify any problem areas. The quiz portion contains five objective questions to assess content knowledge. The survey portion contains two questions asking students about 1) anything that is not clear, 2) the hardest part of the activity so far. No grade was associated with the quiz in my courses but an instructor could use it as a graded assignment. I instituted the Quiz/Survey the last time I conducted this exercise and found it helpful. The quiz portion showed the poorest performance on the soda lime technique question. The survey showed that students were not sure how the environmental variables were going to be incorporated. As a result I was able to go over those topics in lecture immediately following Lab Session 2. I also revised the Introduction by adding more detail about the soda lime technique, including Figure 3. Finally I spent time during Lab Session 2 helping students summarize and interpret their environmental measurement data. The third formative evaluation is already embedded in the exercise: students turn in two drafts of their lab report. The first draft is graded and returned to them with comments and the PTA spreadsheet. They then have 1 week to revise the report and submit a final draft which is graded with the same PTA spreadsheet. This simple procedure transforms the lab report assignment from a “shot in the dark” at a grade to a learning experience. Comments on Translating the Activity to Other Institutional Scales or Locations: The experiment can be adapted for indoors when the weather does not cooperate. Plant trays or plastic bins containing 2 to 4 cm of soil material set up in a lab or greenhouse make suitable substrates. Students can compare CO2 emission rates among contrasting soil types, amounts of organic matter, soil depths, soil temperatures (using a plant germination heating mat), or moisture levels. The indoor setting would also be more suitable for students with physical disabilities.
page 22 Jeffrey A. Simmons TIEE Volume 6, February 2009
I have also used the technique successfully in grasslands, gardens and lawns. When herbs are present they can be removed by pinching or cutting them off at ground level. In a lawn or grassland you can treat small patches with herbicide several days ahead of time. Note that when a plant is killed the rapid decomposition of its roots will create a spike in decomposition between 2 and 5 days later. So soil respiration must be measured immediately after cutting the plant or after 5 days have elapsed. An alternative that greatly speeds up the experiment but requires more expensive equipment is to use CO2 detectors to measure CO2 accumulation in the headspace of the chambers instead of soda lime. The incubation time is reduced from 24 hours to 5 minutes with this technique. For example, relatively inexpensive detectors that can be connected to portable computers or handhelds can be obtained from Vernier, Inc.(www.vernier.com). In this situation CO2 concentration in the chamber headspace is monitored for 5 minutes and the rate of CO2 emission is calculated.
Because of the inexpensive materials and simple techniques needed for this
experiment, it is well-suited for junior high or high school classes.
page 23 Jeffrey A. Simmons TIEE Volume 6, February 2009
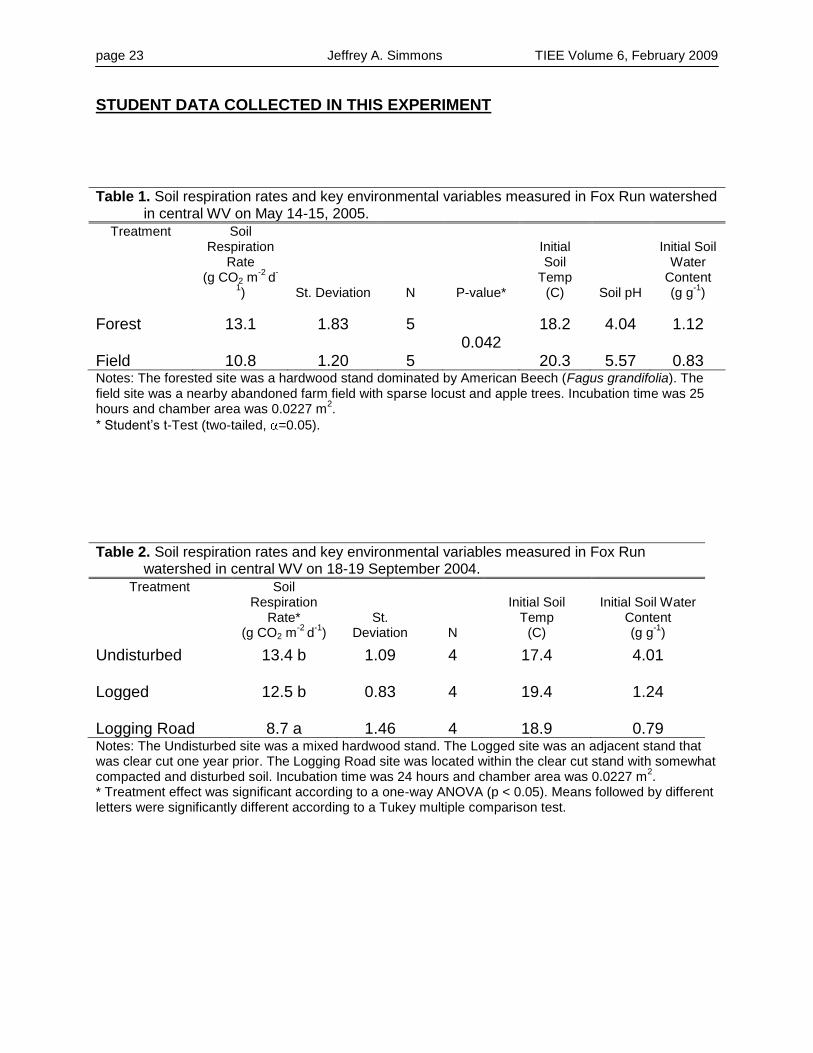
STUDENT DATA COLLECTED IN THIS EXPERIMENT Table 1. Soil respiration rates and key environmental variables measured in Fox Run watershed
in central WV on May 14-15, 2005.
Treatment Soil Respiration
Rate (g CO2 m
-2 d
-
1) St. Deviation N P-value*
Initial Soil
Temp (C) Soil pH
Initial Soil Water
Content (g g
-1)
Forest 13.1 1.83 5 18.2 4.04 1.12 0.042 Field 10.8 1.20 5 20.3 5.57 0.83 Notes: The forested site was a hardwood stand dominated by American Beech (Fagus grandifolia). The field site was a nearby abandoned farm field with sparse locust and apple trees. Incubation time was 25 hours and chamber area was 0.0227 m
2.
* Student’s t-Test (two-tailed, =0.05).
Table 2. Soil respiration rates and key environmental variables measured in Fox Run
watershed in central WV on 18-19 September 2004.
Treatment Soil Respiration
Rate* (g CO2 m
-2 d
-1)
St. Deviation N
Initial Soil Temp
(C)
Initial Soil Water Content (g g
-1)
Undisturbed 13.4 b 1.09 4 17.4 4.01 Logged 12.5 b 0.83 4 19.4 1.24 Logging Road 8.7 a 1.46 4 18.9 0.79 Notes: The Undisturbed site was a mixed hardwood stand. The Logged site was an adjacent stand that was clear cut one year prior. The Logging Road site was located within the clear cut stand with somewhat compacted and disturbed soil. Incubation time was 24 hours and chamber area was 0.0227 m
2.
* Treatment effect was significant according to a one-way ANOVA (p < 0.05). Means followed by different letters were significantly different according to a Tukey multiple comparison test.

page 24 Jeffrey A. Simmons TIEE Volume 6, February 2009
COPYRIGHT STATEMENT
The Ecological Society of America (ESA) holds the copyright for TIEE Volume 6, and the authors retain the copyright for the content of individual contributions (although some text, figures, and data sets may bear further copyright notice). No part of this publication may be reproduced, stored in a retrieval system, or transmitted, in any form or by any means, electronic, mechanical, photocopying, recording, or otherwise, without the prior written permission of the copyright owner. Use solely at one's own institution with no intent for profit is excluded from the preceding copyright restriction, unless otherwise noted. Proper credit to this publication must be included in your lecture or laboratory course materials (print, electronic, or other means of reproduction) for each use.
To reiterate, you are welcome to download some or all of the material posted at this site for your use in your course(s), which does not include commercial uses for profit. Also, please be aware of the legal restrictions on copyright use for published materials posted at this site. We have obtained permission to use all copyrighted materials, data, figures, tables, images, etc. posted at this site solely for the uses described in the TIEE site.
Lastly, we request that you return your students' and your comments on this activity to the TIEE Managing Editor ([email protected]), for posting at this site.
GENERIC DISCLAIMER
Adult supervision is recommended when performing this lab activity. We also recommend that common sense and proper safety precautions be followed by all participants. No responsibility is implied or taken by the contributing author, the editors of this Volume, nor anyone associated with maintaining the TIEE web site, nor by their academic employers, nor by the Ecological Society of America for anyone who sustains injuries as a result of using the materials or ideas, or performing the procedures put forth at the TIEE web site, or in any printed materials that derive therefrom.