final report acoustic beam-forming -...
TRANSCRIPT

Final Year Project 2005 – Acoustic Beam-Forming Page 1
Project Supervisor - Prof. Minyue Fu Marcus C. Gadsby
Final Report
Acoustic Beam-Forming
Marcus C. Gadsby Supervisor: Prof. Minyue Fu
Final Year Project - June 2005
Abstract: Highly directional sound has been termed as the final frontier in Acoustics. Some fairly
recent commercial developments, which have resulted from the study of Non-Linear
Acoustics, are able to achieve tight acoustic beam-forming with a 45cm diameter ultrasonic
transducer array. They make use of sum and difference frequencies in air which are due to the
effect of air non-linearity. These devices are called parametric arrays.
This thesis documents a project to build a parametric array. It looks at how these systems
operate and the steps taken to implement a basic device for the purposes of testing and
demonstration. A combination of research and experimentation in simulation and hardware
forms its content.
Seventy seven ultrasonic transducers used to make an acoustic beam-forming speaker, and a
single side band amplitude modulation drive circuit have been combined to produce a basic
parametric array. An audible directional beam of sound can be produced with this system and
it can effectively demonstrate the formation of a ‘virtual speaker’ on a flat inert surface
towards which the array is directed.
While there is still much scope for development and improvement of this project, it
successfully takes a good preliminary look at the parametric array and provides a system for
demonstration and measurement of tones resulting from air non-linearity.

Final Year Project 2005 – Acoustic Beam-Forming Page 2
Project Supervisor - Prof. Minyue Fu Marcus C. Gadsby
CONTENTS
Acknowledgements .................................................................................................. 3
1. Introduction
A. Preface ...................................................................................................... 4
B. Purpose and Objectives .......................................................................... 5
2. Project Outcomes and Main Contributions .................................................... 6
3. Fundamental Principles and Background Information
A. Basis Information .................................................................................... 7
B. Prior Art ................................................................................................. 18
C. Parametric Loudspeaker Facts and Limits ......................................... 22
4. Project Development
A. Transducer Array ................................................................................... 23
B. Beam-Forming ....................................................................................... 26
i) Simulation
1) One Dimensional transducer distance change
a) Isotropic
b) Realistic
2) Directivity Enhancement
a) Rotation
b) Phase Delay
3) Two Dimensional Array
C. Transducer Array Driver Circuit ......................................................... 33
D. Signal Processing ................................................................................... 34
E. Parametric Array Test and Measurement ........................................... 37
i) Two transducer test
ii) Square wave driver and audible harmonics
F. Predistortion .......................................................................................... 38
5. Planned Further Development Prior to Demonstration ............................ 39
6. Areas for future development ........................................................................ 40
7. Conclusion ........................................................................................................ 41
Bibliography ............................................................................................................. 42

Final Year Project 2005 – Acoustic Beam-Forming Page 3
Project Supervisor - Prof. Minyue Fu Marcus C. Gadsby
ACKNOWLEDGEMENTS
I wish to acknowledge the invaluable help and input of these people who were all so willing
to share their knowledge, understanding and time, and without whom I would not have
gotten as far as I have with this project.
Professor Minyue Fu Supervisor
Gunilla Burrows Course coordinator
Steve Mitchell Technical advice
Peter Turner Administration and lab access
Ray Palmer Technical and project advice
Ian Powell Protel DXP PCB design and production. Technical advice
Roy Murcott Technical advice
Nick Hawryluk Acquisition of transducers and store room assistance
Robert Alley Transducer array PCB housing
Chris Jones Lab desk and equipment. Parts acquisition and administration
Debbie Booth Engineering librarian. Research tutorial
Peter McLauchlan Technical logistics
Andrew Fleming Technical advice
Erich Schulz Technical advice
Wendy Hilder Proof reading
Michelle Gadsby My wife - for her loving support, encouragement, and valuable insight
I give thanks to my redeemer, the faithful and true witness, the ruler of God’s creation, the one who will judge the world with justice.
(Note: Bible - Romans 3:10-24)

Final Year Project 2005 – Acoustic Beam-Forming Page 4
Project Supervisor - Prof. Minyue Fu Marcus C. Gadsby
INTRODUCTION
A. Preface
Imagine having a speaker that projected sound only directly in front of it. You could ‘shine’
music around a room like you would the light from a focused torch beam. Just like we have
spotlights to light up a well-defined area, we could also have spot-sounds to deliver audible
information to a specific region. Imagine walking through a silent art museum when out of
nowhere you hear an audio commentary about the sculpture you wandered up to. Picture a
car which allows each seat to have its own sound-spot so each traveller can have their own
music playing. (Think about the arguments that could be avoided over which CD goes in the
player!) Most passenger aeroplanes have personal light and air conditioning sources, with this
type of technology they could have personal sound sources as well; while people on either
side of you sleep you can be listening to your favourite heavy metal band without the need for
headphones!
The list of applications for such systems are many, but is it possible? The wavelength of
acoustic sound varies between forty millimetres and half a meter. To have any sort of
effective beam-formation we would need a large speaker or a large horn in front of the
speaker. I’m sure you can see that this would be impractical and expensive in most
applications. If only there were some other way to focus sound into a beam economically
both in size and cost then the world of sound, as we know it, would change dramatically.
Well there is another way! When two ultrasonic frequencies are coupled into the air the sum
and difference frequencies also appear in the air. This occurs because the air is a nonlinear
medium. Since ultrasonic frequencies have a wavelength of around eight millimetres it is
possible to create very tight beams of ultrasonic sound. This beam-formation of ultrasonic
sounds has already been exploited in medical imaging and therapy. With these two principles
we have the makings of an acoustic beam-forming speaker capable of focusing sound into a
tight column. Perhaps the future of sound is not so far away.

Final Year Project 2005 – Acoustic Beam-Forming Page 5
Project Supervisor - Prof. Minyue Fu Marcus C. Gadsby
B. Purpose and Objectives
This document is submitted as one of the final requirements for a degree in Electrical
Engineering at the University of Newcastle, Australia. It is the culmination of a semester of
full time research and manufacture in the course ELEC4800 - Final Year Project.
The objectives for this project as proposed by Professor Minyue Fu are as follows:
• To manufacture an acoustic beam-former; i.e. to exploit the properties of air
nonlinearity and ultrasonic wavelengths to create a tight beam of ultrasonic sound
into which an audio signal has been appropriately modulated.
This will involve simulation, experimentation, circuit design, testing and
measurement
• To investigate optimal beam-forming techniques using arrays of ultrasonic
transducers with regard to separation distance, phase control and rotation and to
implement these techniques into hardware.
• To consider predistortion algorithms based on the way in which demodulation
occurs in air and apply these algorithms to the system.
This will involve whole system analysis and appropriate software to manipulate an
audio signal. Alternatively this could be done in hardware.

Final Year Project 2005 – Acoustic Beam-Forming Page 6
Project Supervisor - Prof. Minyue Fu Marcus C. Gadsby
PROJECT OUTCOMES
Realisation of Project Objectives
A parametric array consisting of seventy-seven wide band transducers has been built
complete with an aluminium housing. A printed circuit board (PCB) was designed in Protel
DXP and manufactured at the university by a milling machine. The circuit tracks are thinner
than necessary but sufficient for the task. The PCB was tested, repaired where some tracks
were broken, and populated. It was then manually retested and partially plugged into the
system yielding a positive result. The manufacture of an aluminium housing for the PCB was
outsourced to Mr Robert Alley and under final construction at the time of this report and
thus waits full and final testing.
This array is driven by a circuit design that exists on a breadboard. For testing purposes and
demonstration of air demodulation and beam-forming this is adequate but ideally this circuit
would be optimised and implemented on a PCB. The signal processing and drive circuitry is
achieved in a mostly analogue way and a better more stable implementation would run on a
digital signal processing (DSP) chip or multiple DSP chips.
Extensive experimental simulation has been done to determine optimal beam-forming
conditions and these results have only been partially implemented in the final hardware
design. It was found that ideally the ultrasonic sources would have a separation distance of
one half-wave length. Unfortunately this was not possible due to the physical dimensions of
the individual devices. Simulations showed that having the transducers as close as possible,
was the optimum way to achieve a strong main lobe in this system. Simulations also showed
that implementing a circular phase delay across the array would deliver up to 50%
improvement in beam width. This feature was not included in the final hardware due to the
large number of components needed to implement it.
Only a very simple predistortion technique was used in the final implementation, that of
taking the square root of an audio signal. A computer was sufficient as a sound source for the
modulation circuitry. It was then fairly straight forward to take the square root of an audio
clip using Matlab and output the result to the sound card. Much more extensive predistortion
could be done in this way and would then ideally be implemented in real time using an
embedded DSP system.
Main Contributions
• Simulation
• Beam-Formation techniques
• Manufacture of a transducer array
• Circuit design
• Testing and measurement

Final Year Project 2005 – Acoustic Beam-Forming Page 7
Project Supervisor - Prof. Minyue Fu Marcus C. Gadsby
FUNDAMENTAL PRINCIPLES AND BACKGROUND INFORMATION
Material in this chapter only is reprinted from American Technology Corporation’s (ATC)
website. ATC is ‘Shaping the future of sound through revolutionary concepts in directional
acoustic beam-forming and next generation intelligibility’ - www.atcsd.com
Particularly I include the content from a whitepaper available on their website entitled,
"Theory, History, and the Advancement of Parametric Loudspeakers - A TECHNOLOGY
OVERVIEW”. This document is freely available at the time of this report from ATC’s
website - http://www.atcsd.com/pdf/HSSWHTPAPERRevE.pdf
I include its main points as they relate to my own research for completeness as an overview
of parametric array technology and development.
A. Basis Information
Non-Linear Acoustics
A paper by Helmholtz titled, “On Combination Tones”, provides a theory that is not currently
accepted in the non-linear acoustics arena, but it is worth a brief look. In this paper, Helmholtz
introduces his novel theory on how combination tones (sum & difference) are generated by a non-
linear restoring force on a displaced molecule. These were not subjective tones (a product of
psychoacoustics, as were so-called “Tartini Tones”), but ones that actually existed in the air. He
surmised that the ‘springs’ that keep air molecules spaced apart exhibit a non-linear restoring force
characteristic that manifests itself at higher displacement amplitudes. Helmholtz’s theory and
formulas predicted results that initially seem to match what Helmholtz had measured.
Since two primary frequencies (in our case, ultrasonic ones) are generating new frequencies in the
air, the shape of the primary wave must change as it propagates. Fourier tells us that any wave can
be described with a series of sines and cosines. If one emits two high-amplitude sine waves, as in the
Helmholtz example above, new frequency terms appear, and the shape of the wavetrain changes. The
accepted mechanism for this “propagation distortion” is explained by A.L. Thuras, R.T. Jenkins,
and H.T. O’Neil of Bell Labs in a 1934 paper called Extraneous Frequencies Generated in Air
Carrying Intense Sound Waves, J. Acoust. Soc. Am. 6:173-180 (1935). The following
explanation is taken from this paper, and from a similar paper by L.J. Black, A Physical Analysis
of Distortion Produced by the Non-Linearity of the Medium, J. Acoust. Soc. Am. 12:266 (1940).
It turns out that if equal positive and negative increments of pressure are impressed on a mass of air,

Final Year Project 2005 – Acoustic Beam-Forming Page 8
Project Supervisor - Prof. Minyue Fu Marcus C. Gadsby
the changes in the volume of the mass will not be equal. The volume change for the positive pressure
will be less than the volume change for the equal negative pressure.
This phenomena may be unfamiliar to those in the relatively linear acoustics field of audio. The
wave equation which is customarily used in the solution to acoustical problems is valid for small
signal propagation only. The assumption involved in the derivation of the small signal wave equation
is that the maximum displacement of the air particles, x, be small compared to the wavelength λ;
x < λ. In other words, the pressure fluctuations are so small that the specific volume appears to be a
linear function of pressure. When this is not satisfied, a plane wave or even a spherical wave
propagated in the medium will not preserve its shape. As a result, the magnitude of the fundamental
decreases and the magnitude of the distortion increases with propagation distance. A simple
explanation of this phenomenon is given by L.J. Black. It goes as follows:
Each part of the wave travels with a velocity that is the sum of the small signal velocity and the
particle velocity.
The maximum condensation in a wave is at the point of maximum pressure and this portion of the
wave has the greatest phase velocity. The fact that the phase velocity is greater at the peak of the wave
than at the trough results in a wave whose shape changes continuously as it is propagated.
Assuming the normal small signal velocity of c = 344m/s and working through the equations
with a sound pressure level of 140dB (re. 20µ Pa) signal, gives a result of c ≈ 344.8m/s at the
pressure peak of a wave.
This figure is only 0.24% higher than the small signal speed of sound. However, it says that the
peak will travel 80cm further than the ambient part of the wave in only one second. That’s a lot
considering the wavelength for a 40kHz signal is only 8.6mm. In a 40kHz sinewave, the peak
begins propagating only 2.15mm behind the ambient (zero crossing), so for a 140dB signal it only
takes 0.0027s, or about 1 meter of propagation for the peak to catch up to the zero crossing.
It should be noted that along with a travelling pressure wave, there are associated density and
temperature waves too. In other words, the density and temperature at a point in space also varies
with time at the same frequency as the pressure wave.
The following chart shows the shape of a wave which has been distorted by the mechanism
explained above. The blue line represents a pure sinewave (a single-frequency signal); the red line
represents the shape of the same wave after it has propagated through the non-linear medium for a
time.

Final Year Project 2005 – Acoustic Beam-Forming Page 9
Project Supervisor - Prof. Minyue Fu Marcus C. Gadsby
The values used for the graph above are as follows:
SPL of the pure sinewave: 140dB (re. 20µ Pa)
Frequency: 40.0kHz
Propagation time: 0.0013 sec.
It can be seen that a high-amplitude sinewave tends to form into a sawtooth wave as it travels. The
sawtooth wave contains odd and even harmonics. The 2nd harmonic is fully half the amplitude of the
fundamental. This means that strong harmonics are created during the propagation of a high-
intensity tone. Things get more interesting when there is more than one primary, or fundamental,
tone. In the two-tone case, f1 & f2, it can be shown that the harmonics of each will appear, as will
the sum and difference frequencies, f1+f2 and |f1-f2|. This is the most simple case of a parametric
acoustic array.
Audio Modulation Theory
In late December of 1962, a Physics Professor from Brown University, Peter Westervelt,
submitted a paper called Parametric Acoustic Array, J. Acoust. Soc. Am. 35 (4):535-537
(1963). Westervelt considered primary waves interacting within a given volume and calculated the
scattered pressure field due to the non-linearity’s within a small portion of this common volume in the
medium. He goes on to describe the generation of a difference frequency tone along the collimated
beam of a two-frequency signal. Many simplifying assumptions were made, such as: no attenuation of
the difference frequency, a perfectly collimated primary signal beam, the two primary signals attenuate
at exactly the same rate, etc. His was not as complete as the currently accepted theory, but it was
close.
In 1965, H.O. Berktay published the first paper that gave an accurate and more complete
theoretical explanation of the parametric acoustic array: Possible Exploitation of Non-Linear

Final Year Project 2005 – Acoustic Beam-Forming Page 10
Project Supervisor - Prof. Minyue Fu Marcus C. Gadsby
Acoustics in Underwater Transmitting Applications, J. Sound Vib. 2 (4):435-461 (1965). His
analysis was more general and more complete. He covers cases where the primary signals are
expanding cylindrically or spherically, as well as the collimated plane wave case we are interested in.
He also did not limit the analysis to the two-tone primary case. Rather, he uses the concept of the
modulation “envelope”. This is very powerful because a parametric loudspeaker isn’t usually limited
to making one tone at a time. The envelope analysis allows us to look at any primary signal
spectrum. It turns out that the demodulated signals (the ones we are ultimately interested in) depend
on this envelope function.
[Insert by Gadsby] The dependence of the demodulated signals on the envelope is a fairly
straight forward concept to understand. When two ultrasonic frequencies are propagated
through the air, the difference frequency will appear as a result of the mediums non linearity
as was discussed above. Double side band (DSB) amplitude modulation (AM) gives a clear
implementation of shifting an audio signal up to surround a carrier (40kHz). There will be
inherent distortion as is discussed below, but it is intuitive that the underlying audio will
appear as the demodulated signal in air.
To summarize the Berktay solution - the demodulated signal in a parametric array is proportional
to the second time-derivative of the envelope squared:
This is called “Berktay’s Far-Field Solution” because he assumes we are far enough away from the
source to ignore the presence of any ultrasound (or primary frequencies). The solution is valid for the
near-field, but the ultrasonic primaries co-exist with the demodulated signals. This is the
fundamental expression for the output of parametric acoustic arrays.
[Insert by Gadsby] Predistortion techniques are primarily based on this solution. Taking the
square root of an audio signal and then performing a double integration on the result before
passing it to the modulator, means that the demodulated audio in air out of the parametric
array will be differentiated twice, and then squared, yielding the original audio signal.
Ignoring the linear frequency response for the moment and using the Berktay solution to derive the
non-linear result of inputting a single 2kHz tone into a double sideband amplitude modulator we get
an output that shows that two pure tones result from this envelope, and they both have the same

Final Year Project 2005 – Acoustic Beam-Forming Page 11
Project Supervisor - Prof. Minyue Fu Marcus C. Gadsby
amplitude. The 2nd harmonic, 4kHz, has the same amplitude as the 2kHz fundamental. This is
equivalent to 100% THD.
[Insert by Gadsby] This is a good example. When a 2kHz tone is passed into a DSB AM
system with centre frequency 40kHz, a signal containing three frequencies at 38kHz, 40kHz
and 42kHz results. Considering the difference frequencies that will be present in the
parametric array; we have 40-38 = 2kHz and 42-38 = 4kHz. This small experiment
immediately shows that a single side band (SSB) AM technique would be desirable to remove
this distortion.
It is clear that raw AM (amplitude modulation with a carrier) does not give the desired results.
The envelope must either change its frequency content or its offset. First, lets maintain the 2kHz
envelope, but increase its offset by increasing the carrier amplitude by a factor of five. This results in a
decreased modulation percent. The earlier case was 100% modulated, where this case is only at
20%. Now the desired 2kHz fundamental frequency dominates. It is 10.5 times greater in
amplitude than the 2nd harmonic. This is ≈ 19% THD. The distortion has been reduced by a
factor of five, but the carrier level had to be increased by the same factor. The audio level has also
increased by a factor of 5.25. Had the modulation percentage been maintained while the power was
increased by a factor of five, the audio level would have increased by a factor of 25. By reducing the
modulation index we are giving up conversion efficiency for a cleaner signal. While the THD is
reduced, it still isn’t very good and our efficiency is poor with this method.
A Closer Look at Amplitude Modulation
In order to convert the audio source to ultrasonic signals, a modulation scheme is required. In
addition, error correction is needed if distortion is to be reduced without loss of efficiency. The goal, of
course, is to produce the audio in the most efficient manner while maintaining acceptably low
distortion levels.
We know that, for a DSB system, the modulation index can be reduced to decrease distortion, but
this comes with a cost of reduced conversion efficiency. The other choice that has been explored is so-
called “square-rooting” of the audio before modulation. This gives the proper envelope for a DSB
system and allows for a high modulation index, but it requires large bandwidths when implemented
properly. In fact, since the lower sidebands extend out so far below the carrier, the carrier frequency
needs to be pushed much higher in order to keep sidebands out of the audio range. On the upper
sideband, ultrasonic absorption, among other impediments, limits the ability to produce the desired

Final Year Project 2005 – Acoustic Beam-Forming Page 12
Project Supervisor - Prof. Minyue Fu Marcus C. Gadsby
bandwidth. But, a high carrier frequency is also less efficient for parametric conversion than a lower
one.
Since there is a direct relationship between the modulation index and the resulting conversion
efficiency, a high modulation index is desirable. So how can we achieve low distortion without a high
bandwidth requirement? If square-rooting were the only option, ideal distortion reduction of a full
band audio signal would be very difficult to achieve. Remember, Berktay’s solution says that the
audio signal will be proportional to the envelope, not the spectrum. While each spectrum has only one
envelope, fortunately, there is more than one spectrum that can be used to achieve the ideal envelope
shape. How this can be turned into an advantage will be explored below.
In the prior art parametric loudspeakers, two basic approaches have been utilized; double sideband
amplitude modulation and double sideband amplitude modulation with square root preprocessing
(always with a carrier when used for parametric conversion).
In terms of general approaches to amplitude modulation for non-parametric uses, there is another
scheme called Single Sideband (SSB) amplitude modulation. Assuming Berktay’s Far-Field
solution for the nonlinear wave equation is valid, it turns out that a single-sideband amplitude
modulation scheme holds some interesting and important advantages over a double-sideband AM
scheme.
The ideal envelope shape can be determined quite easily. It is simply the square-root of the desired
audio output, plus any equalization factors. The goal of any modulation scheme should be to generate
a modulation envelope that matches as closely as possible this ideal envelope. It is instructive to
compare the modulation schemes and their resulting envelopes with the ideal envelope. For each test
case evaluated below, a 40kHz carrier will be used for simplicity. The maximum modulation index
will also be used (because the differences between the modulation schemes are less dramatic at low
modulation indexes). Note: The two time derivative operations in Berktay’s solution translates to a
12dB/octave high pass slope in the parametric audio output. This will be ignored for now since it
can be corrected independent of the modulation scheme.
For DSB, the resulting spectrum is simple, being just two equal-amplitude sidebands at 38kHz
and 42kHz, centred around the 40kHz carrier. It will be assumed that the envelope function is
proportional to (or the same as) the modulation signal shape. To achieve this, the DC off-set
modulation signal is simply multiplied by the carrier. For example, a 2kHz audio signal (used as
the modulation signal) would result in a 2kHz sinewave envelope. The following is the time-domain
signal of these three frequencies, 38kHz, 40kHz, and 42kHz:

Final Year Project 2005 – Acoustic Beam-Forming Page 13
Project Supervisor - Prof. Minyue Fu Marcus C. Gadsby
When this envelope is squared by the process in the medium of air, the 2nd harmonic ends up with
the same amplitude as the fundamental or 100% THD as was mentioned earlier.
For SSB, it will be assumed that the incoming audio signals will be frequency “up-shifted” by the
carrier value. For example, a 2kHz audio tone will be up-shifted by 40kHz, resulting in an upper
sideband frequency of 42kHz (in addition to the ever-present carrier). For the single audio tone case
(40kHz carrier, 2kHz audio input) the resulting spectrum will be simply two equal-amplitude
sinewaves at 40kHz and 42kHz. The following plot shows the time-domain signal of these two
frequencies in green, and the resulting envelope in magenta.
When this signal is squared by the process in the medium of air, you get back your original audio
frequency of 2kHz, with zero distortion because no other frequencies are present. In other words, for
a single-tone case, SSB gives a distortion-free signal with no pre-processing or additional signal
conditioning. So in the case of no preprocessing, SSB is vastly superior to DSB. It has half the
bandwidth requirement and no distortion compared to 100% THD.
As disclosed by the Japanese papers from the 1980s, the DSB signal can be pre-processed to
eliminate distortion by running the audio signal through a square-root processor before it is utilized
to modulate the carrier. This makes the envelope into a square-rooted sinewave. This comes with a

Final Year Project 2005 – Acoustic Beam-Forming Page 14
Project Supervisor - Prof. Minyue Fu Marcus C. Gadsby
price, though: bandwidth, in fact, theoretically, infinite bandwidth in both the upper and lower
sidebands. Lets look at a square-rooted DSB signal and an uncorrected SSB signal in the time
domain:
The blue DSB line lies on top of the red line when their values are the same, so when only the
blue line can be seen, the red trace is underneath it. Both of these methods give the same envelope that
will demodulate into a single, distortion-free audio signal (in this case, 2kHz).
However, the spectrums required to generate these two envelopes are vastly different. Lets look at
them. Here is the SSB spectrum with two frequencies:
For a 2kHz audio signal, only 2kHz of ultrasonic bandwidth is required.
Here is the DSB spectrum:

Final Year Project 2005 – Acoustic Beam-Forming Page 15
Project Supervisor - Prof. Minyue Fu Marcus C. Gadsby
More than 30kHz of bandwidth is required to get the same ideal envelope to reproduce a mere
2kHz signal. For a 20kHz audio tone, the square rooted DSB method requires some serious
bandwidth that can’t be realized in practice. In fact with a 20kHz signal the ideal DSB method
would not only require an upper sideband of over 150kHz of bandwidth above the carrier, which is
very difficult to realize, the least of which is building a wideband transducer. What is particularly
problematic about this approach is the lower sideband would require distortion correction terms down
into the audible range which would then become very audible as non-harmonically related distortion.
The distortion correction terms themselves become distortion! A clear catch-22.
Fortunately, an effective square-rooted DSB system can still be made reasonably effective by
truncating the bandwidth of the correction terms, even to the extent of not allowing any of the
correction terms to fall inside the audio bandwidth. Theoretically, this would incur substantial
distortion penalties and with equal amplitude signals it does. But, due to the nature of real world
signals, the peak amplitudes of the audio spectrum will tend to fall in level for frequencies above 2 to
4kHz. Also, due to the inherent 12dB/octave high pass characteristic of the parametric output,
substantial equalization will normally be used, at least down to some low frequency limit, and this
will further reduce the high frequency output compared to the lower frequencies. These two things
contribute to a very low modulation index for all high frequencies and therefore reduced distortion for
those same high frequencies. Even so, the distortion is still greater than what and ideal bandwidth
could achieve and the single sideband system will always have less than half of the basic bandwidth of
the processed double sideband approach.
So, let’s look at some examples of the error terms that do occur when complex signals are used with
a SSB system and how they can be suppressed. First, is a 40kHz carrier modulated to make
7kHz and 9kHz audio tones. SSB provides two upper sidebands with frequencies of 47kHz and
49kHz. The time domain signal looks like this:

Final Year Project 2005 – Acoustic Beam-Forming Page 16
Project Supervisor - Prof. Minyue Fu Marcus C. Gadsby
Next, the ideal envelope (square-rooted audio) for equal-amplitude 7kHz and 9kHz signals is
shown on the same plot as the uncorrected SSB envelope:
It is apparent that these two functions are similar, but not the same. The resulting error spectrum
(between the two envelopes) is shown below:
You can see that the only error term is at 2kHz. It can be proven mathematically that the only
error term that results in the SSB envelope is in fact the 2kHz signal shown. However, if a 2kHz
“correction term” (with the proper phase and amplitude) is injected into the modulator, the unwanted
2kHz error term can be suppressed completely.
Thus, a third sideband is added at 42kHz (in addition to the original 47kHz and 49kHz
sidebands that normally occur) What follows is that the 2kHz error term is gone, but a new one at
9kHz has appeared. However, the new error term is approximately 10dB lower in amplitude than
the original 2kHz error term was. If a 9kHz correction term (ultimately resulting in a modified
49kHz sideband) is inserted, with the proper phase and amplitude, into the modulator (in addition
to the 2kHz, 7kHz, and 9kHz terms), the 9kHz error term can be suppressed completely, but a
new term at 5kHz will appear at an even lower SPL. This suggests that by utilizing a recursive
scheme we can correct a SSB envelope without requiring any additional bandwidth. Note, as opposed
to DSB, all of the correction sidebands fall within the bandwidth of the original audio input signal.

Final Year Project 2005 – Acoustic Beam-Forming Page 17
Project Supervisor - Prof. Minyue Fu Marcus C. Gadsby
Also, as can be seen, the amount of error occurrence, as a percent, falls with each recursive correction
step used.
It is worth mentioning that a third modulation type has also been explored. We call this approach
truncated double sideband. In this scheme a DSB multiplier is used and the lower sidebands are
truncated with a filter and/or the transducer. This gives a hybrid between DSB and SSB. It allows
for a simple multiplier but substantially retains the limited bandwidth of SSB. Moreover, it gives a
controlled measure of self equalization to the demodulated audio.
For example, a DSB system with carrier at 30kHz could be high pass filtered at 28kHz so that
it operated with a full 20kHz upper sideband but a truncated, 2kHz lower sideband. A 500Hz
audio tone would result in upper and lower sidebands both being created equally around the carrier
(for a high modulation index). A 5kHz tone would result in a strong upper sideband and a very
weak lower sideband so the modulation index would be lower (the spectrum looks very similar to
SSB). This lower modulation index results in a lower audio level for the upper frequencies. This
serves to inherently equalize the audio for flatter response at lower frequencies.
The truncated DSB system can be used effectively with a recursive error correction scheme to
eliminate distortion in the same way that the SSB scheme does.

Final Year Project 2005 – Acoustic Beam-Forming Page 18
Project Supervisor - Prof. Minyue Fu Marcus C. Gadsby
B. Prior Art
In a paper called The Audio Spotlight: An application of nonlinear interaction of sound waves to
a new type of loudspeaker design, J. Acoust. Soc. Am. 73 (5), May 1983: pp1532-1536,
Yoneyama, et al, makes an attempt at reasonable performance with off-the-shelf components. The
authors built a large hexagonal array of PZT bimorph emitters (547 pieces) that operate at around
40kHz, with a secondary peak just below 60kHz (typical of this type of emitter). In order to
overcome the 12dB/octave frequency response slope predicted by Berktay, they propose that they
should equalize their incoming audio signal before modulating the carrier with double sideband AM.
This gives the desired frequency response (over a limited range) by decreasing the modulation index
for higher audio frequencies. For a double sideband AM case with one audio frequency input, the
demodulated audio signal amplitude will be proportional to m, the modulation index. The second
harmonic amplitude is proportional to m2. In order to achieve low distortion with DSB AM, m
must be made as small as possible, at the expense of efficiency. This is done to minimize “cross
interaction” between the upper and lower sidebands, they say. Since 12dB/octave is a severe slope
and the audio band is wide, a high modulation index must be used for the lower audio frequencies.
A high amount of distortion would result for these frequencies.
In the actual experiment, they simply use the peak of the emitters frequency response to equalize
the audio signal. They achieve a flat response from about 1.5kHz to about 7kHz. They also show
sharp directivity for all audio frequencies. However, their experiments show that the directivity
decreases for lower audio frequencies.
At the end of the paper, they state that such a system could be used in a museum without sound
barriers between exhibits.
The next paper was from 1984, and it was presented at the 10th International Symposium on
Nonlinear Acoustics. It’s called Developments of Parametric Loudspeaker for Practical Use
(1984). They attack three problems. The optimum carrier frequency, distortion correction, and
insulating the listener from the ultrasound.
They state that the carrier frequency needs to be as low as possible, but not so low as to cause beam
spreading. They recommend a frequency between 30kHz to 70kHz. In order to correct for
distortion, they introduce the concept of square-rooting the modulation signal which makes a lot of
sense based on the Berktay far field solution stating that the envelope is squared by the air. They
quickly discover that this will require additional bandwidth.
Their experimental device in this work consists of 581 PZT bimorphs arranged in a square
package. They were able to show that for a few input cases, the second harmonic output can be

Final Year Project 2005 – Acoustic Beam-Forming Page 19
Project Supervisor - Prof. Minyue Fu Marcus C. Gadsby
greatly reduced while using square rooting. Finally, to minimize ultrasonic output, they propose an
acoustic filter to attenuate the ultrasound at some arbitrary distance from the emitter.
The next paper is called A Study for the realization of a parametric loudspeaker, J. Acoust. Soc.
Japan, June 1985. Again, they look at a few problems. First, the low conversion rate (from electrical
to audio). They revisit distortion correction and safety again too. In order to improve efficiency, they
suggest a lower carrier frequency to make the array longer. Towards the end of the paper, they suggest
30kHz as a good trade-off between beam length, spreading, and safety. They also reiterate that a
higher ultrasonic SPL level increases gain, not just output, but they do not account for saturation
effects. They do discuss how increasing the aperture size can be traded for a lower primary SPL.
This is very important.
On the distortion front, they speak in terms of a single frequency audio signal. There are two ways
to clean this up. One is square rooting, which results in many sidebands. The other is by using two
discreet primary tones (which is SSB) so the “interaction of two sidebands” is eliminated. They don’t
realize that the envelope in each case is the same, they only talk about removing the sideband
interaction.
For more complex signals, they admit that SSB distortion results from “non-linear interaction of
the sideband itself”. This means that for complex signals, only square rooting with DSB will work,
but with the bandwidth penalty.
Finally, they use some packing material (a 4 wide by 5 feet long piece) to absorb the ultrasound
before the instrumentation (the mic). Unfortunately, this reduces the audible sound levels too.
The next work they published appeared in Acustica: Suitable Modulation of the Carrier
Ultrasound for a Parametric Loudspeaker, Acustica, Vol. 73, 1991, pp215-217. This is a short
paper, and it deals with reducing the radiation power requirement. Specifically, they discuss reducing
the carrier level when there is no sound or when there is little volume needed. We call this a dynamic
carrier. Where the envelope will be flat, the carrier is suppressed altogether. This can save a lot of
power, but does introduce additional nonlinearity.
For the experimental portion, they use an even larger array of 2000 bimorphs resonating at
28kHz. They used a speech for the tests (84 seconds of a male news announcer). It is claimed, that
without degradation of the demodulated signal, they were able to reduce the power requirements by
more than 64% (390 watts average power to 140 watts average power for the dynamic carrier
version). Impressive results.
Next is their paper called Parametric Loudspeaker— Characteristics of Acoustic Field and
Suitable Modulation of Carrier Ultrasound, Electronics and Communications in Japan, Part 3,

Final Year Project 2005 – Acoustic Beam-Forming Page 20
Project Supervisor - Prof. Minyue Fu Marcus C. Gadsby
Vol. 74, No. 9, 1991, pp76-81. There isn’t much new ground broken here. They use a large array
(1.4ft dia.) of 1410 emitters working at 27kHz and 30kHz to create a 3kHz audio tone.
The main item of note in this work is an assertion (based on Merklinger’s earlier work, Improved
Efficiency in the Parametric Transmitting Array, J. Acoust. Soc. Am. 58 pp. 784-787 (1975))
that for smaller signal levels, the demodulated signal is proportional to the envelope squared
(Berktay). With high amplitudes, they state that the audio signal becomes proportional to the
envelope itself. They go so far as to say that this occurs around 130dB.
This would mean that square-rooting requirements for distortion correction would go away with
primary signal levels over 130dB. We have tried to verify this in our lab with no success. The single
tone SSB signal sounds cleaner at all signal levels, even above 140dB. Also, in response to our
inquiry, Dr. Blackstock has given this some thought and he isn’t willing to say that they are correct.
Next up is a paper called Parametric Sound Radiation from a Rectangular Aperture Source,
Acustica, Vol. 80, 1994, pp332-338. The main point of the paper is to compare the results of
their experiment using a 24cm x 44cm (9.4in x 17.3in) device generating 25kHz and 30kHz,
with the KZK (Khok-hlov-Zabolotskaya-Kuznetsov) non-linear parabolic equation. The KZK
equation combines non-linearity, dissipation, and diffraction in beams. It is a successive
approximation method. It covers the generation of harmonics from single-tone primaries. The KZK
equation has been shown to have good agreement with experimental results when circular apertures
were used, but the authors wanted to try a rectangular source. They concluded that in the far-field,
the rectangular source gave roughly the same results as a circular source of equal area would have.
For the experiment, they used 1102 small piezo bimorphs. They were driven via a two-frequency
signal as mentioned above. The source pressure was only 116dB, so little difference tone level is
expected. However, they did get a 79dB 5kHz signal at 3.5m (which was the best distance for this
setup). When they went to a 128dB source level, they got more than 100dB of 5kHz at 3.5m. They
do say that the harmonics (distortion) predicted with a rectangular source are lower than those
predicted for a circular source. Finally, they complain of the computation time for far-field KZK
analysis.
A final paper was published by the Japanese group called A Parametric Loudspeaker—Applied
Examples, Electronics and Communications in Japan, Part 3, Vol. 77, No. 1, 1994, pp64-73.
As the title implies, the authors tried out some actual applications to see where the technology can be
used successfully. They also do some theoretical work using a transformed beam equation that is
solved by “using an implicit backward finite difference scheme based on the Richtmyer method.” They
attempt first to make a compact emitter array (so as to be practical) so they must consider the best
possible carrier frequency to maximize the ultrasound to audio conversion. As they did previously, it
Final Year Project 2005 – Acoustic Beam-Forming Page 21
Project Supervisor - Prof. Minyue Fu Marcus C. Gadsby
is stated that lowering the carrier makes for a longer beam, but spreading begins to increase if the
carrier is lowered too far.
They compare the audio generated by 25kHz and 30kHz primaries with the audio generated by
50kHz and 55kHz primaries. Not only is the difference tone slightly stronger (in the near field)
from the lower frequency primaries, but the harmonic distortion is lower too. In the far field, the
difference tone is stronger yet for the low frequency case.
They state that the optimal carrier frequency is about 35kHz, but that higher frequency primaries
may be safer to humans. They then construct an array of 91 piezo bimorphs (1cm in dia. each). The
overall size was 11cm in diameter, and they drove it with 30Vpp. The two primaries are 38.5 and
41.5kHz for a difference of 3kHz. They estimate a 134.5dB source level, and a 90dB difference
level at about 0.5 meters. They then generated bird chirping sounds (similar to a crosswalk signal)
and used less than 100dB of ultrasound.
Finally, they compared a larger array (2208 small piezo bimorphs) against a horn loudspeaker of
similar aperture in a reverberant tunnel to check for speech articulation. The tunnel was long
(1777m) and had 52dB of background noise (78dB when there are idling engines). They also filled
part of the tunnel with cars and trucks. They cite a subjective intelligibility scale of which the
parametric speaker wins in monosyllable tests and three-syllable tests (the margin in the monosyllable
test was close, they blame the modulator).
They did say that in the noisy condition, the output was too low. But in the quiet, the parametric
speaker communicated better.

Final Year Project 2005 – Acoustic Beam-Forming Page 22
Project Supervisor - Prof. Minyue Fu Marcus C. Gadsby
C. Parametric Loudspeaker Facts and Limits
• Maximum parametric output throughout the audio range is always slightly less than the maximum volume velocity of the emitter at the carrier frequency. i.e. 12 dB reduction per descending octave in output relative to primary, ultrasonic frequency output
• Parametric output is proportional to the area of the ultrasonic column
• When used below saturation, the parametric output increase is proportional to the square of the increase in carrier level
• Ultrasonic directivity is based directly on emitter diameter
• Parametric directivity is based indirectly on the ultrasonic directivity and directly on the length of the ultrasonic column or virtual endfired array
• Lower modulation index reduces distortion
• Greater modulation index increases parametric gain
• Single Sideband envelope is equal to square rooted envelope for a single tone
• Emitter linear errors (ultrasonic amplitude response) can translate to parametric non-linear errors in any error correction scheme
• Square root correction is needed less for high frequencies in real world program material due to:
o Spectral power attenuation above 2kHz causing lower modulation index and therefore lower inherent distortion
o Harmonic distortion for signals above 7 to 10kHz tend to be inaudible
• Saturation sets in at levels 6 dB lower for each octave of increased ultrasonic operation
• Output volume velocity is decreased 12 dB for each octave of increased ultrasonic operation
• Human Factors:
o Studies of intense airborne ultrasound exposure so far have found that any noticeable effects of ultrasonic outputs have been due to the unwanted high-frequency audible signals that can accompany ultrasonic equipment and not the ultrasonic signals themselves. The unwanted audio frequencies can be essentially eliminated with zero bandwidth correction schemes combined with using emitters that do not generate sub-harmonics.
� For any heating effects to occur, the parametric systems would have to operate at more than ten times the power output of an effective parametric loudspeaker.
o For ultrasonic levels above 135 dB, at 40 kHz, saturation of the air creates diminishing returns relative to the effectiveness of any further increase in ultrasonic level achieving significant increases in parametric output

Final Year Project 2005 – Acoustic Beam-Forming Page 23
Project Supervisor - Prof. Minyue Fu Marcus C. Gadsby
PROJECT DEVELOPMENT
A. Transducer Array
Transducer Selection and Beam Angle
It is evident from the theory that a wideband transducer is advantageous for maintaining
adequate signal strength across a bandwidth equivalent to the audio bandwidth, beginning at
the carrier frequency for single side band (SSB) amplitude modulation (AM), or centred on
the carrier for double side band (DSB) AM. However, any inherent mechanical filtering of the
lower side band of a DSB AM signal will be beneficial in this system for reducing distortion
produced by the interaction of the two side bands. It would therefore be beneficial to place
the carrier at the beginning of the useable bandwidth of the transducer and be aiming for a
SSB AM system.
The carrier frequency should be kept low without impeding on the audible range. It should
be both high enough to not cause non-harmonically related distortion where modulated tones
enter the audible range, and low enough to maximise use of air non-linearity for
demodulation.
One other factor to be considered is the sound pressure level (SPL) of the transducer over
the transmitting frequency range. Obviously the greater the SPL the better. However we saw
from the theory that saturation of the air at higher SPLs decreases the demodulation effect.
The situational limitations of this project regarding the acquisition of a suitable transducer
include: a limited range of suppliers for these types of devices; no specialist manufacturers in
Australia for ultrasonic transducers; and low demand for wideband transducers. Common
applications for ultrasonic transducers include distance measurement, proximity detection and
cavitation applications all of which only require a single resonant frequency and no
bandwidth.
These limitations made it quite difficult to locate a device sufficient to the task. After much
research into the available options, without success, a solution was found in the discoveries of
a Final Year Project group from Singapore PSB Academy who completed there project at the
end of 2004 on acoustic beam-forming. The problem faced was that all the transducers found
had good centre frequencies of 40kHz but only ever 2kHz to 5kHz of effective bandwidth.
The group from Singapore was able to source transducers from a company called Prowave
in Taiwan. They purchased two types, a model with a 40kHz resonance and about 3kHz of
bandwidth, and a wide band model with a 44kHz centre and about 10kHz of bandwidth.
There testing prompted them to choose the lower bandwidth model. In the three areas for
consideration, bandwidth, centre frequency and SPL, it was decided that the wide bandwidth
Final Year Project 2005 – Acoustic Beam-Forming Page 24
Project Supervisor - Prof. Minyue Fu Marcus C. Gadsby
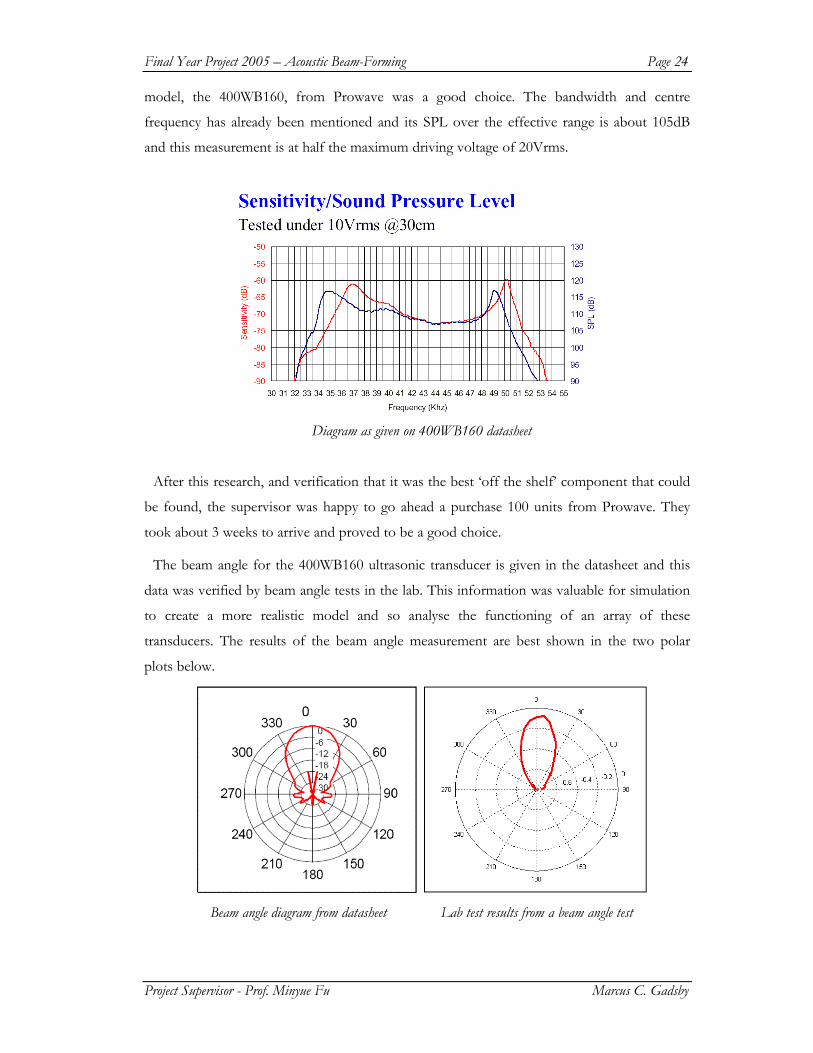
model, the 400WB160, from Prowave was a good choice. The bandwidth and centre
frequency has already been mentioned and its SPL over the effective range is about 105dB
and this measurement is at half the maximum driving voltage of 20Vrms.
Diagram as given on 400WB160 datasheet
After this research, and verification that it was the best ‘off the shelf’ component that could
be found, the supervisor was happy to go ahead a purchase 100 units from Prowave. They
took about 3 weeks to arrive and proved to be a good choice.
The beam angle for the 400WB160 ultrasonic transducer is given in the datasheet and this
data was verified by beam angle tests in the lab. This information was valuable for simulation
to create a more realistic model and so analyse the functioning of an array of these
transducers. The results of the beam angle measurement are best shown in the two polar
plots below.
Beam angle diagram from datasheet Lab test results from a beam angle test

Final Year Project 2005 – Acoustic Beam-Forming Page 25
Project Supervisor - Prof. Minyue Fu Marcus C. Gadsby
Transducer Array Design
Simulations showed that having more than nine transducers in a line did not significantly
improve the beam divergence of the array, and so for reasons only based on beam-forming
and not tests related to effects on demodulation, and also because there was a limit on how
many transducers there were to work with, it was decided to have a ‘nine by nine’ 77
transducer array, where the array starts with a row of 9 and then a row of 8, then 9, then 8
and so on. (See image from Protel DXP at the bottom of this page)
Simulated beams for 15, 9 and 5 transducers respectively
The design of the dual layer PCB was done in Protel DXP and the Engineering technical
staff at the University were able to manufacture it with their milling machine. The track width
is unnecessarily small due to error in design, but it is still sufficient to handle the necessary
current. Ideally the board would have been manufactured outside the University but time was
limited and it was cheaper to have it done at the University.

Final Year Project 2005 – Acoustic Beam-Forming Page 26
Project Supervisor - Prof. Minyue Fu Marcus C. Gadsby
After a few track repairs the board was populated with the transducers and header sockets.
The making of an aluminium housing was ordered for the array to protect the circuit and
produce a more professional looking device. This is still under construction at the time of this
report. Pictured below is the populated PCB.
B. Beam-Forming
i) Simulation
The logical place to start to gain a more in depth understanding of the interaction of
mechanical waves is in simulation. The mathematics is mostly straight forward and much can
be learned and verified visually, quickly and cheaply using this method of investigation and
experimentation.
The basic arrangement of a one dimensional beam-forming array, is a line of transducers all
transmitting the same signal which will be some AM scheme centred at frequency, f, between
30kHz and 60kHz. There will be a set number of transducers, N, and they will be a set
distance apart, d, from each of there neighbours. It is assumed that the velocity of mechanical
waves in air to be 340m.s-1.
1 2 N . . . 4 3
d One Dimensional Transducer Array

Final Year Project 2005 – Acoustic Beam-Forming Page 27
Project Supervisor - Prof. Minyue Fu Marcus C. Gadsby
It will also be assumed for now that each source radiates isotropically, to find a broad
solution, and then a beam angle will be applied to each source to model a more realistic
solution.
Calculation is made for a set of points surrounding the source array as the sum of sines
transmitted from each source, with respect to the distance they have travelled to each point,
and thus their cumulative amplitudes at each point. The following images are produced where
shades of grey represent the cumulative amplitude at each point.
Transducer array interference diagrams with isotropic sources. e) d = λ and f) d = λ/2

Final Year Project 2005 – Acoustic Beam-Forming Page 28
Project Supervisor - Prof. Minyue Fu Marcus C. Gadsby
It is quite amazing to see the formation of a strong main lobe as the distance d is decreased
to a half wave length. Even though this was an expected result it still seemed to be a fairly
non-intuitive outcome.
If the isotropic sources are now replaced with a more realistic model of the 400WB160
transducers by giving each transducer a beam angle then the following images result.
Transducer array interference diagrams with realistic sources. e) d = λ and f) d = λ/2
Final Year Project 2005 – Acoustic Beam-Forming Page 29
Project Supervisor - Prof. Minyue Fu Marcus C. Gadsby
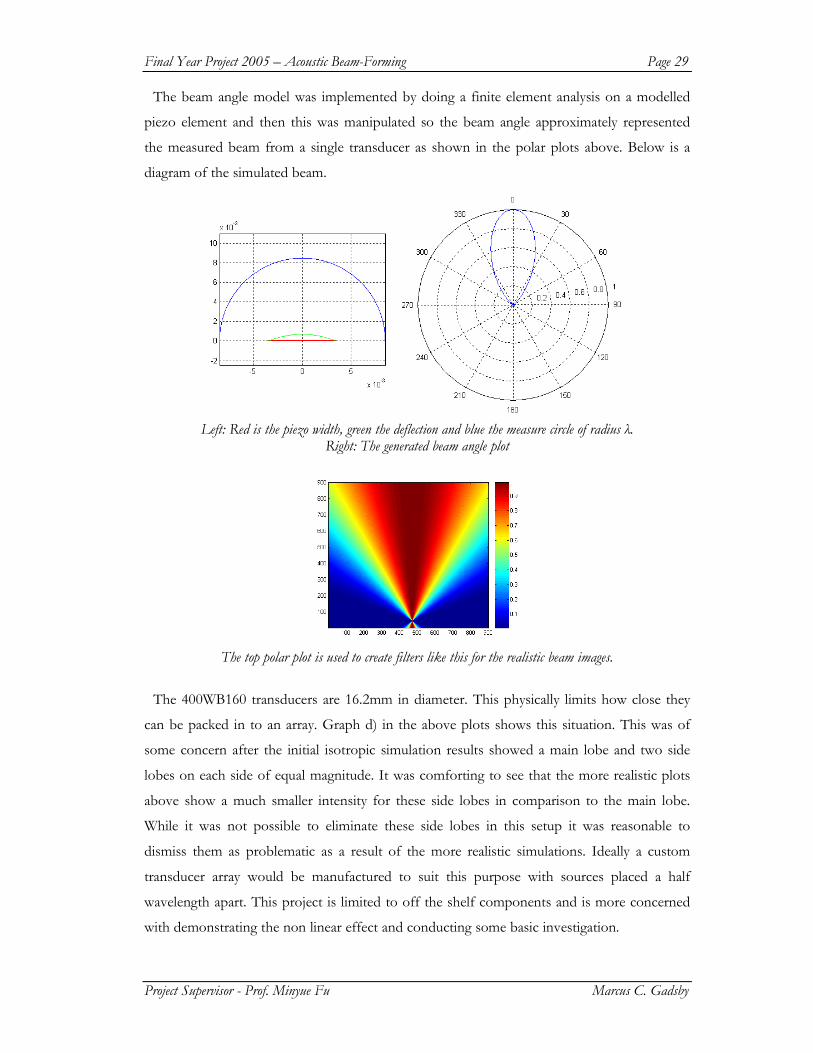
The beam angle model was implemented by doing a finite element analysis on a modelled
piezo element and then this was manipulated so the beam angle approximately represented
the measured beam from a single transducer as shown in the polar plots above. Below is a
diagram of the simulated beam.
Left: Red is the piezo width, green the deflection and blue the measure circle of radius λ.
Right: The generated beam angle plot
The top polar plot is used to create filters like this for the realistic beam images.
The 400WB160 transducers are 16.2mm in diameter. This physically limits how close they
can be packed in to an array. Graph d) in the above plots shows this situation. This was of
some concern after the initial isotropic simulation results showed a main lobe and two side
lobes on each side of equal magnitude. It was comforting to see that the more realistic plots
above show a much smaller intensity for these side lobes in comparison to the main lobe.
While it was not possible to eliminate these side lobes in this setup it was reasonable to
dismiss them as problematic as a result of the more realistic simulations. Ideally a custom
transducer array would be manufactured to suit this purpose with sources placed a half
wavelength apart. This project is limited to off the shelf components and is more concerned
with demonstrating the non linear effect and conducting some basic investigation.

Final Year Project 2005 – Acoustic Beam-Forming Page 30
Project Supervisor - Prof. Minyue Fu Marcus C. Gadsby
Directivity Enhancement
Two methods were experimented with in simulation to enhance the directivity of the 1D
transducer array. They were rotation of the sources and phase delay in each source across the
array. Rotation effects yielded no beneficial change in directivity and this is en expected result
given that the amounts of rotation in each device are so small for a focal point
implementation. Phase delay however gave very pleasing results as follows.
If we wish to guarantee constructive interference at a focal point along the main lobe of the
array, we need to alter the phase of each source so that the signals from each source are all in
phase at the focal point. This is most conveniently implemented as a circular delay. This could
be implemented physically by placing each transducer on the arc of a circle and the centre of
that circle would be a point where all signals would be in phase. However this same effect can
also be achieved by implementing a phase delay into a linear array of transducers.
Each transducer in the linear array waits to transmit its sound to emulate what would come out of the circular array. This is achieved by controlling the phase of each transducer

Final Year Project 2005 – Acoustic Beam-Forming Page 31
Project Supervisor - Prof. Minyue Fu Marcus C. Gadsby
The image above shows the isotropic beam-formation of the array with a circular delay and
focal point at one meter out from the array. As you can see this gives some improvement to
the directivity of the linear array.
To implement a phase delay in the transducer output we can use the Pade approximation of
a time delay which is implemented as the opamp circuit below.
By changing the resistance R you can alter the delay. However if this method were to be
implemented for a 77 transducer array a very large number of components would be needed
and the cost would be prohibitive. This enhancement ideally belongs to a full DSP
implementation of this system.
Two Dimensional Array
Without doing more simulation, some educated assumptions may be made about the
function of a two dimensional array where the circular transducers are packed as tightly as
they can be into a square.
The one dimensional array creates a focused beam in its transverse axis. This beam could
reasonable be assumed to look like the following diagram where the transducer array is the
black rectangle.

Final Year Project 2005 – Acoustic Beam-Forming Page 32
Project Supervisor - Prof. Minyue Fu Marcus C. Gadsby
If another line of transducers were placed in the transverse axis of the beam and linear array
then the beam could be expected to form into a column. If the gaps are then filled with more
transducers as in the square above it could be expected to shape a tight beam at all angles thus
forming a cylindrical beam.
Beam angle measurements for the linear 9 transducer array and the square 77 transducer
array are still to be done at the time of writing this report and will be attached at a later date.
Top View
Side View Side viewed from
Top viewed from

Final Year Project 2005 – Acoustic Beam-Forming Page 33
Project Supervisor - Prof. Minyue Fu Marcus C. Gadsby
C. Transducer Array Driver Circuit
The main aim was to drive the transducers as hard as possible without damaging them so as
to maximise the output power. The datasheet for the 400WB160 states that the maximum
driving voltage is 20Vrms. This translates to about a 56V peak to peak continuous signal. This
was the first and primary aim with regards to a transducer drive circuit. A 30W opamp was
found, the LM4700TF, which has a peak to peak maximum voltage supply range of 66V and
normal operational range of 56V peak to peak.
The typical slew rate for the LM4700TF is given as 18V/us. The half period of a 40kHz
square wave is about 12us and travels a distance of 56V on transition through this amplifier.
This transition will then take about 3us yielding the following output:
Black: Driving 40kHz square wave, Red: Output from opamp LM4700TF
Will this waveform adversely affect the response of the transducers? Because the
transducers so drastically mechanically filter the drive signal supplied to them, the only
significant output from driving a 400WB160 with a 40kHz square, triangle or sine, is a 40kHz
sinusoid. In an experiment documented further below to show and prove the action of a
parametric array, two transducers are separately driven with 40kHz and 44kHz respectively.
This results in a demodulated tone in air of 4kHz. The point to make here is that when the
driving frequencies were changed in shape on the function generators between square,
triangle and sine, no noticeable change occurred in the demodulated audio signal in air. This
principle makes the circuitry required to drive the transducers somewhat simpler since there is
no need to produce a perfect sinusoid or even a perfect square wave. Within reason
(regarding duty cycle), as long as there is an oscillation at 40kHz the primary output will be
sinusoidal at 40kHz.
More time needs to be spent on developing an optimum drive method for capacitive loads
which are obviously reactive in their power use. This implementation simply gives the array
access to large amounts of power. The LM4700TF gives the voltage swing and is also capable
of supplying a peak current of 3 amps.
~12us ~3us

Final Year Project 2005 – Acoustic Beam-Forming Page 34
Project Supervisor - Prof. Minyue Fu Marcus C. Gadsby
If this current limit is not enough to drive the 77 transducer array when it is tested, a class B
amplifier will be implemented in conjunction with the LM4700TF to boost current supply to
the load.
Class B amplifier design to provide more current to the load
http://www.allaboutcircuits.com/vol_6/chpt_6/10.html
D. Signal Processing
At the heart of this implementation is an AM system based around the CD4066BC quad
bilateral switch chip. The CD4066BC is an excellent multiplier and after experimenting with
opamp power supply modulation and nonlinear output filtering it was the best solution of the
lot. The signal processing hardware as a block diagram looks like this:
The CD4066BC is used in this basic configuration:
40kHz Square wave
Oscillator
Pass Through Buffer and
Inverter
Audio Signal Computer
Pass Through Buffer and
Inverter
4066 Switcher
AM
Modulator
Signal Input
Output

Final Year Project 2005 – Acoustic Beam-Forming Page 35
Project Supervisor - Prof. Minyue Fu Marcus C. Gadsby
By switching the control signal with a 40kHz square wave and feeding Vis with a DC offset
audio signal we obtain very good amplitude modulation as represented by the diagram below:
To generate a DSB AM signal a second switcher is used and the inverse of the above
waveform is made and then the two outputs are added yielding:
Based on this chip then a square wave oscillator circuit made from two BJT transistors and
an output transistor feeds two opamps. One is a buffer amp and the other is an inverting
buffer amp. The output from these opamps drive the control lines of the first two switches in
the CD4066BC switcher chip.
In like fashion the audio signal is buffered and inverted and these two signals feed the
inputs of the first two switches in the CD4066BC switcher chip.
The outputs from the two switch’s are added and fed into the driver amplifier for the
transducer array.

Final Year Project 2005 – Acoustic Beam-Forming Page 36
Project Supervisor - Prof. Minyue Fu Marcus C. Gadsby
Bread Board Circuit Implementation
±5V Supply 40kHz adjustable square wave oscillator ±30V Supply
CD4066BC quad bilateral switch chip
Stereo audio input from computer and DC offset ±15V Supply
LM4700TF 30W Amp And Heatsink

Final Year Project 2005 – Acoustic Beam-Forming Page 37
Project Supervisor - Prof. Minyue Fu Marcus C. Gadsby
E. Parametric Array Test and Measurements
i) Two transducer test
This experiment was carried out to verify that the demodulation of a difference frequency in
air did indeed occur as a result of two purely ultrasonic primary driving signals.
Two function generators were used in conjunction with two LM4700TF 30W amplifiers to
drive two 400WB160 ultrasonic transducers separately with 40kHz and 44kHz respectively.
The results were that when only T1 was transmitting, no audible sound could be observed
in the wave interaction region and likewise for when only T2 was transmitting. However
when both T1 and T2 were transmitting a clear 4kHz tone could be observed in the wave
interaction region.
A piece of card was also used to cover up either T1 or T2 while they were both transmitting
and the same result was observed. When T1 or T2 were covered no sound could be heard.
This simple experiment shows clearly that the air is behaving in a non-linear way since no
sound would be heard if the ultrasonic frequencies were transmitted through a linear medium.
This experiment also discounts any notion that the transducers or drive system are
producing audible harmonics accounting for the tone produced. Both transducers operate
individually, and by themselves produce no audible tone. It is clearly the interaction in air of
the two primary frequencies that is producing an audible tone.
ii) Square wave driver and audible harmonics
A very straight forward perception test was done to show that driving the transducers with a
square wave produced no significant audible tone in the array.
An array of 9 transducers was driven with a 50V peak to peak 40kHz square wave. The
array produced a very small tone that was barely perceivable. A 2kHz tone was modulated
into this system and a very much larger audible tone at 2kHz was produced.
This is an approximate way to show that harmonic distortion is practically inaudible in a
parametric array and that using a square wave source is acceptable.
30W AMP 30W AMP
40kHz 44kHz
Wave Interaction Region
T2 T1
Final Year Project 2005 – Acoustic Beam-Forming Page 38
Project Supervisor - Prof. Minyue Fu Marcus C. Gadsby
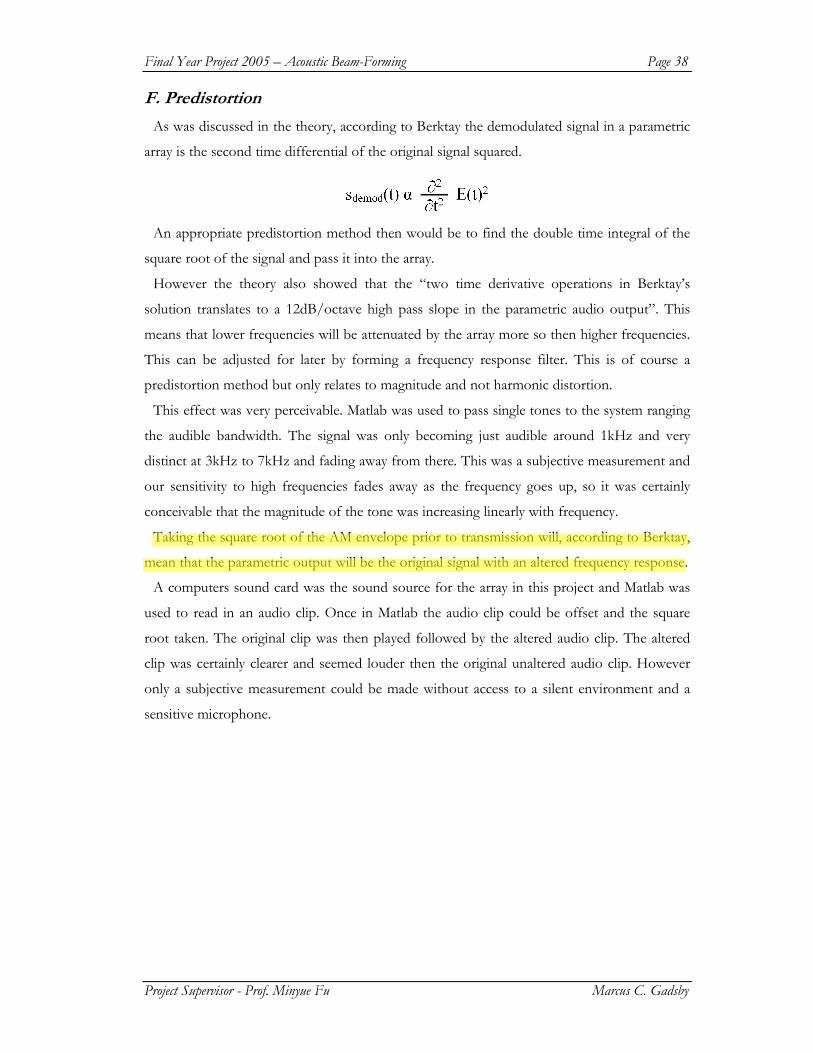
F. Predistortion
As was discussed in the theory, according to Berktay the demodulated signal in a parametric
array is the second time differential of the original signal squared.
An appropriate predistortion method then would be to find the double time integral of the
square root of the signal and pass it into the array.
However the theory also showed that the “two time derivative operations in Berktay’s
solution translates to a 12dB/octave high pass slope in the parametric audio output”. This
means that lower frequencies will be attenuated by the array more so then higher frequencies.
This can be adjusted for later by forming a frequency response filter. This is of course a
predistortion method but only relates to magnitude and not harmonic distortion.
This effect was very perceivable. Matlab was used to pass single tones to the system ranging
the audible bandwidth. The signal was only becoming just audible around 1kHz and very
distinct at 3kHz to 7kHz and fading away from there. This was a subjective measurement and
our sensitivity to high frequencies fades away as the frequency goes up, so it was certainly
conceivable that the magnitude of the tone was increasing linearly with frequency.
Taking the square root of the AM envelope prior to transmission will, according to Berktay,
mean that the parametric output will be the original signal with an altered frequency response.
A computers sound card was the sound source for the array in this project and Matlab was
used to read in an audio clip. Once in Matlab the audio clip could be offset and the square
root taken. The original clip was then played followed by the altered audio clip. The altered
clip was certainly clearer and seemed louder then the original unaltered audio clip. However
only a subjective measurement could be made without access to a silent environment and a
sensitive microphone.

Final Year Project 2005 – Acoustic Beam-Forming Page 39
Project Supervisor - Prof. Minyue Fu Marcus C. Gadsby
PLANNED FURTHER DEVELOPMENT PRIOR TO DEMONSTRATION
At the time of writing this report there are still a few minor enhancements and
measurements to be made prior to demonstration. These include full testing of the 77
transducer array, assessment and possible implementation of a B class amplifier as the
transducer drive circuit, refining and testing of the system as a SSB system, and some basic
distortion measurement using the large array.
It is intended to perform a two dimensional beam test on a linear 9 transducer array and the
same test on the 77 two dimensional array to determine actual beam-formation by the arrays.
This will be done using an 400WB160 ultrasonic transducer as a receiver placed in front of
the array. The array will then be rotated around two axes and magnitude measurements made.
If the full parametric array is loud enough then audio range beam tests will also be done.
If the full array is in need of more current then available from the existing drive circuit I will
implement a class B amplifier circuit as the drive output as discussed above.
The system presently is a DSB AM system and with minor changes and some
experimentation will be easily converted to an SSB AM system.
Measurement of audio distortion in the parametric array has been difficult without access to
more sensitive microphones and silent environments since the audible output is quite low and
the background noise is relatively high. It is thought that the larger array will increase the
audio output intensity to levels high enough to measure with the microphones available.
Final Year Project 2005 – Acoustic Beam-Forming Page 40
Project Supervisor - Prof. Minyue Fu Marcus C. Gadsby
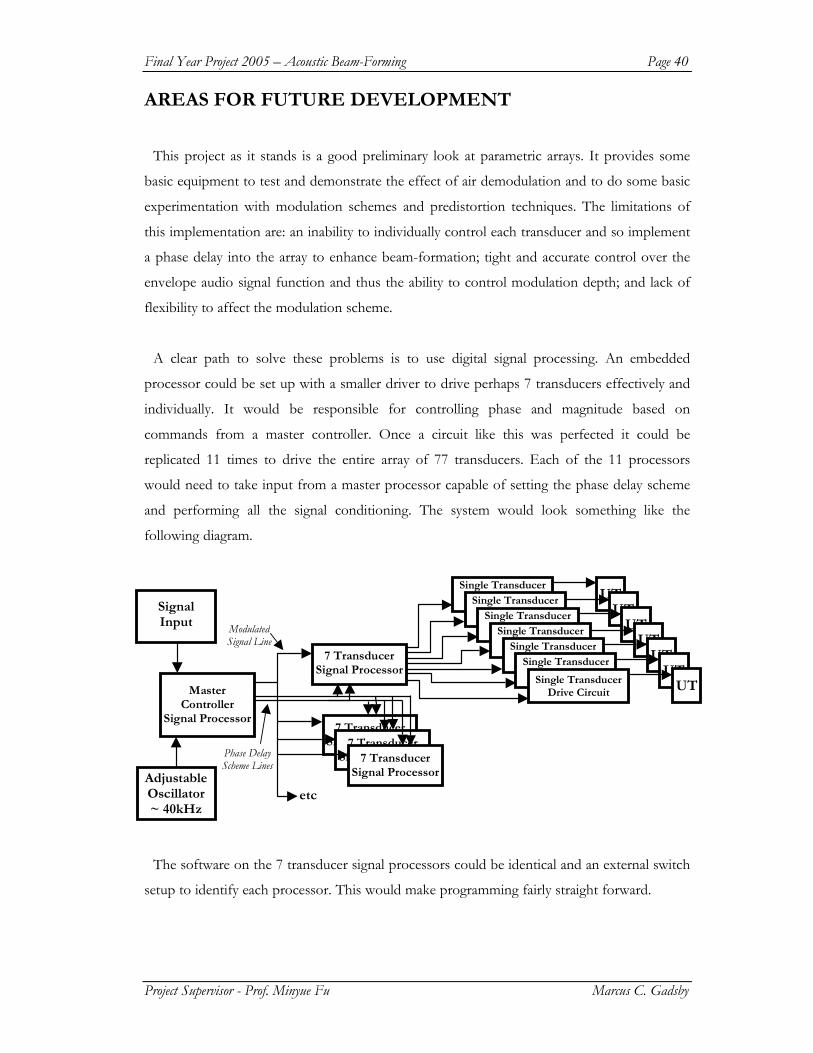
AREAS FOR FUTURE DEVELOPMENT
This project as it stands is a good preliminary look at parametric arrays. It provides some
basic equipment to test and demonstrate the effect of air demodulation and to do some basic
experimentation with modulation schemes and predistortion techniques. The limitations of
this implementation are: an inability to individually control each transducer and so implement
a phase delay into the array to enhance beam-formation; tight and accurate control over the
envelope audio signal function and thus the ability to control modulation depth; and lack of
flexibility to affect the modulation scheme.
A clear path to solve these problems is to use digital signal processing. An embedded
processor could be set up with a smaller driver to drive perhaps 7 transducers effectively and
individually. It would be responsible for controlling phase and magnitude based on
commands from a master controller. Once a circuit like this was perfected it could be
replicated 11 times to drive the entire array of 77 transducers. Each of the 11 processors
would need to take input from a master processor capable of setting the phase delay scheme
and performing all the signal conditioning. The system would look something like the
following diagram.
The software on the 7 transducer signal processors could be identical and an external switch
setup to identify each processor. This would make programming fairly straight forward.
7 Transducer Signal Processor
Single Transducer Drive Circuit Single Transducer
Drive Circuit Single Transducer Drive Circuit Single Transducer
Drive Circuit Single Transducer Drive Circuit Single Transducer
Drive Circuit
Single Transducer Drive Circuit
UT UT
UT UT
UT UT
UT
Master Controller
Signal Processor
7 Transducer Signal Processor
7 Transducer Signal Processor
7 Transducer Signal Processor
etc
Modulated Signal Line
Phase Delay Scheme Lines
Adjustable Oscillator ~ 40kHz
Signal Input

Final Year Project 2005 – Acoustic Beam-Forming Page 41
Project Supervisor - Prof. Minyue Fu Marcus C. Gadsby
The other area for development is effective predistortion. While implementing a SSB AM
system will eliminate all side band interaction distortion, there will still exist an amount of
intra-band distortion when operating with complex signals. For example feeding a SSB AM
system, modulation frequency 40kHz, with a 2kHz and 7kHz mixed signal, results in three
frequencies at 40kHz, 42kHz and 47kHz. These tones will demodulate in the parametric array
as 2kHz, 5kHz and 7kHz. The 5kHz is the distortion that needs to be dealt with. (See the end
of the section entitled “Fundamental Principles and Background Information - A. Basis
Information” for more detail on the problem of distortion)
A computer could still be used to produce a predistorted signal to begin with, and then that
predistortion technique could be implemented in hardware to eliminate the need for a
computer system.
CONCLUSION
The area of acoustic beam-forming is an exciting new area in sound engineering and has
been termed by some as ‘the final frontier’ in sound research. It can only be expected that
more time and resources will be put into this technology. Perhaps there will be more
extensive commercialisation of it in the next ten to fifteen years. However the most obvious
conclusion is that sound sources will never be the same again.

Final Year Project 2005 – Acoustic Beam-Forming Page 42
Project Supervisor - Prof. Minyue Fu Marcus C. Gadsby
BIBLIOGRAPHY
1. Westervelt, P.J., Parametric Acoustic Array. The Journal of the Acoustical Society of
America, 1963. 35(4): p. 535-537.
2. Yoneyama, M., et al., The Audio Spotlight: An application of nonlinear interaction of sound
waves to a new type of loudspeaker design. The Journal of the Acoustical Society of America,
1983. 73(5): p. 1532-1536.
3. Merklinger, H.M., Improved efficiency in the parametric transmitting array. The Journal of the
Acoustical Society of America, 1975. 58(4): p. 784-787.
4. Schwartz, E.I., The Sound War, in Technology Review. 2004. p. 50-54.
5. Croft, J.J., Whitepaper: Theory, History, and the Advancement of Parametric Loudspeakers, J.O.
Norris, Editor. 2000, American Technology Corporation.
6. National, Datasheet: Duel Op Amp - CLC428.
7. Hong, A.T.K., Acoustic Beamforming using Ultrasonic Transmitters, in Discipline of Electrical
and Computer Engineering. 2004, PSB Academy: Singapore. p. 86.
8. Berktay, H.O., Possible Exploitation of Nonlinear Acoustics in Underwater Transmitting
Applications. Journal of Sound and Vibration, 1965. 2(4): p. 435-461.
9. Kim, Y.w. and S.i. Kim. Novel Preprocessing Technique to Improve Harmonic Distortion in
Airborne Parametric Array. in ICSP. 2002.