influence of an enteric infection on the intestinal...
TRANSCRIPT

Influence of an enteric infection on the intestinal epithelial
barrier function of severely malnourished mice
Thesis by
Emma Onverwagt
S2411865
In partial fulfilment of the requirements for the degree of
MSc Geneeskunde, Rijksuniversiteit Groningen
Supervisor: R.H.J. Bandsma, MD, PhD
Department of Physiology and Experimental Medicine
The Hospital for Sick Children, Toronto, Canada
April 2017

2
ABSTRACT
Severe acute malnutrition (SAM) is a global problem that is associated with a high mortality
rate in children. Even after hospitalization, up to 35% of SAM patients do not survive.
Mortality is linked to the development of diarrhea indicating intestinal dysfunction. Intestinal
pathogens are frequently found but the pathophysiology of the intestinal dysfunction during
enteric infection in the context of SAM is not well understood. In this study, several pilot
experiments were performed to develop a murine model of SAM and enteric infection. It
focused on the effects of this double insult on intestinal histology and intestinal epithelial
barrier function. A model was developed in which mice received a diet containing 1% protein
and were given a seven-day infection with 10⁷ CFU C. rodentium. The combined results of
the pilot projects revealed that enteric infection caused a higher infection load in
malnourished mice compared to control mice associated with more diarrhea, epithelial cell
damage and an attenuated distribution of claudin 3, a marker of epithelial barrier function. It
had no influence on the distribution of claudin 7, another marker of epithelial barrier function,
and the amount of claudin 3 and claudin 7. Furthermore, enteric infection caused weight loss,
crypt hyperplasia and goblet cell loss. In future, this murine model could be used to test novel
interventions against SAM and hence lower its case fatality rate.
SAMENVATTING
Ernstige acute ondervoeding is een globaal probleem dat wordt geassocieerd met een hoge
kindersterfte. Zelfs na ziekenhuisopname overleeft 35% van de ernstig ondervoede kinderen
het niet. Sterfte is gerelateerd aan het ontstaan van diarree wat duidt op darmdisfunctie. Er
worden vaak darmbacteriën gevonden, maar de precieze pathofysiologie van de
darmdisfunctie tijdens gastro-intestinale infectie en ernstige ondervoeding is onbekend. In dit
onderzoek zijn verschillende proefexperimenten verricht om een diermodel van ernstige
ondervoeding en gastro-intestinale infectie te ontwikkelen. Ook de invloed van deze dubbele
belasting op de morfometrie en epitheliale barrière van de darm werd onderzocht. Er werd een
diermodel ontwikkeld waarin muizen een dieet met 1% eiwit kregen en een 7-daagse infectie
met 10⁷ CFU C. rodentium. De gecombineerde resultaten van de proefexperimenten lieten
zien dat gastro-intestinale infectie een hogere infectiebelasting veroorzaakte in ondervoede
muizen dan in controle muizen. Dit werd geassocieerd met meer diarree, epitheliale cel
beschadiging en een veranderde verdeling van claudin 3, een marker van darmdisfunctie.
Verder resulteerde gastro-intestinale infectie in gewichtsverlies, crypt hyperplasie en
slijmbekercel verlies. Het had geen invloed op de verdeling van claudin 7, een andere marker
van darmdisdisfunctie, en de hoeveelheid claudin 3 en claudin 7. In de toekomst kan dit
diermodel verder worden ontwikkeld en gebruikt worden om nieuwe interventies tegen
ernstige ondervoeding te testen en hierdoor de lethaliteit te verlagen.

3
TABLE OF CONTENTS
Introduction p. 4-8
Materials and methods p. 9-11
Results p. 12-19
Discussion p. 20-24
Conclusion p. 25
Acknowledgements p. 26
Bibliography p. 27-30
Appendix I p. 31

4
INTRODUCTION
Severe acute malnutrition and enteric infection:
Severe acute malnutrition (SAM) is a global problem with a high mortality rate. Its under-five
mortality rate is estimated to be more than half a million child deaths per year (1), an amount
that is even expected to increase in future (2). SAM can present itself as two distinct
phenotypes or as a combination of both. It can present itself as marasmus, which is defined by
a weight-for-height score of three standard deviations below the median or as kwashiorkor
what is characterized by bilateral nutritional edema (3). Despite following WHO guidelines,
the inpatient mortality of SAM remains as high as up to 35% (4), showing that current
guidelines are often insufficient. Even though standardized WHO guidelines have greatly
improved child mortality in SAM, most guidelines are solely based on expert opinion and the
scientific evidence is weak (4,5). Further research on SAM and its underlying
pathophysiological mechanisms is essential to improve treatment and thereby lower inpatient
mortality.
There is growing recognition that enteric infection is involved in the pathogenesis and high
inpatient mortality of SAM. SAM’s etiology is complex and is not only caused by an overall
diminished energy intake or a protein-deficient diet, but likely also involves exposure to
microbes and subsequent repeated enteric infections (6). Many children in low- and middle-
income countries have poor sanitation and hygiene what can result in an incompletely defined
syndrome called environmental enteric dysfunction (EED) (8). This poorly understood
disorder is characterized by intestinal inflammation, reduced absorptive capacity and reduced
intestinal epithelial barrier function (10). It can be accompanied with weight loss or altered
stool consistency, but patients often do not have clear signs of illness (6). EED is likely
caused by continuous exposure to entero-pathogens (11) and is thought to be a reason why
current therapeutic interventions in severely malnourished children often fail (11).
Malnutrition and enteric infection can form a vicious circle eventually leading to severe
malnutrition and death (5,8,9; figure 1). Malnutrition weakens the immune system which
causes greater susceptibility to infections and infections cause anorexia, reduced nutrient
absorption and nutrient loss which in turn worsens malnutrition (7). Research shows that
death amongst children with SAM is mostly a result of an infection on top of SAM with an
enteric infection being the most prominent one (7,9).
Figure 1. The vicious cycle of malnutrition and enteric infection, obtained from (12)

5
In addition to increasing knowledge on the role of enteric infection, there is also increasing
knowledge on the intestinal microbiome during malnutrition. The intestinal microbiome refers
to the genetic material of all commensal, symbiotic and pathogenic microorganisms that can
be found in one’s gut. Several studies have shown that the microbiome of malnourished
children differs from non-malnourished children because it is more immature (13,14). This
underscores the influence of microbes and enteric pathogens on the development and clinical
presentation of SAM.
The intestinal epithelial barrier:
The intestinal epithelial barrier forms the luminal surface of the intestine and consists of a
single layer of intestinal epithelial cells (IECs) shielded from the lumen by a thick layer of
mucus (15). Its two main functions are protection against harmful substances and facilitation
of transport of water, nutrients and ions. Apart from IECs, the intestinal epithelium also
consists of several specialized cells such as goblet cells that produce mucus and thereby form
a protective mucus layer (16).
The IECs of the intestinal epithelium are connected by tight junctions to keep out endotoxins,
inflammatory cells and other unwanted substances (15). Tight junctions (TJs) connect IECs at
the apical side (17) and consist amongst others of claudin proteins, that are considered to be
the backbone of TJs (13, figure 2). These transmembrane proteins are anchored to the cellular
skeleton by Zonulin-1, a scaffolding tight junction protein (15). Besides TJs, IECs are also
connected by adherens junctions and desmosomes that provide additional strength to keep the
cells together (18).
Figure 2. Overview of cell junctions, adapted from (19).
There are three different mechanisms that cause dysfunction of the intestinal epithelial barrier
during disease (figure 3). Two of these are dependent on TJs: the leak pathway and the pore
pathway (18). The leak pathway consists of TJs that seal the paracellular space and the pore
pathway consist of TJs that form pores and thereby regulate paracellular transport.
Furthermore, there is also a mechanisms that is independent of TJs and is characterized by
epithelial damage (18). A decrease in TJs of the leak pathway or a disruption of TJs increases
paracellular transport and thereby compromises the intestinal epithelial barrier (20). The pore

6
pathway is more complex as both an increased and decreased amount of TJs can increase
paracellular transport by respectively pore formation and the formation of gaps (18). During
tight junction disruption, there are relatively more TJs in the cytosol and less on the epithelial
membrane because the transport of TJs to the cell membrane is distorted (21). An increase in
paracellular transport and hence intestinal permeability has been found to be a major
contributor to diarrhea and malnutrition (17).
Figure 3. Possible mechanisms of epithelial barrier dysfunction during disease
Severe acute malnutrition, enteric infection and the intestinal epithelial barrier:
Previous, unpublished research conducted by dr. Bandsma’s lab examined the changes in
epithelial barrier function in mice with severe acute malnutrition. Compared to control mice,
malnourished mice suffered weight loss, decreased length, villous blunting, crypt hypoplasia
and colonic goblet cell loss. Malnourished mice also had an increased permeability of the
epithelial barrier and a decreased expression of the tight junction proteins claudin 3 and
claudin 7 in the colon. Similar morphometry (10,22–26) as well as an increase in intestinal
permeability (24,27–29) has been found previously in children with severe acute malnutrition.
A study by Demehri et al also found a decrease in TJ expression in an animal model of
malnutrition per se (30).
The pathophysiology of intestinal epithelial barrier dysfunction during the double insult of
enteric infection and SAM is not well understood. Chronic enteric infection, such as
environmental enteric dysfunction (EED), has been characterized by small intestinal villous
atrophy, crypt hyperplasia and lymphocytic infiltration of the small intestinal lamina propria
(7,8,11,31). Moreover, there is data to suggest that enteric infection alone or in combination
with malnutrition contributes to an increase in intestinal permeability in children (24,27–29).
Lastly, a study by Brown et al. (32) found an increased or decreased expression of several
tight junctions during moderate acute malnutrition (MAM) in combination with an enteric
infection.
Animal model: To further examine the effects of enteric infection on intestinal dysfunction during severe
acute malnutrition, an animal model can be used. An animal model can also potentially be
used for future mechanistic studies testing novel interventions against SAM. In the 1960s and
1970s, human studies have been used to study intestinal dysfunction during malnutrition and
EED (24,26), but they are currently deemed unethical because of the need of invasive
procedures such as intestinal biopsies. To date, there has been a scarcity of studies making use
of animal models to study the interaction between malnutrition, intestinal infections and
intestinal function. In a previously mentioned animal model of Brown et al. (32) an enteric
infection with Bacteroidales species and E. coli was studied (32). Another pathogen that is
considered a golden standard to induce enteric infection in mice is Citrobacter rodentium. C.

7
rodentium is a gram negative bacterial pathogen closely related to the human pathogens
enteropathogenic E. Coli and enterohemorrhagic E. Coli (33). It first attaches to the caecum
and later spreads towards the distal colon (34). It causes epithelial cell death and an increase
in proliferation and loss of differentiation resulting in crypt hyperplasia and goblet cell loss
(35, figure 4). Furthermore, it causes weight loss (36,37) as well as a disruption of tight
junction proteins (21). Tight junction disruption has also been seen during EHEC and EPEC
infections (38–40).
Figure 4. The colonic intestinal epithelial barrier in healthy mice and mice with a C. rodentium infection,
adapted from (41).
Aims:
This study aims to develop an animal model of severe acute malnutrition (SAM) and enteric
infection. Such model will enable greater understanding of the pathophysiology of intestinal
dysfunction during enteric infection in the context of SAM. Consequently, mechanistic
studies could be conducted to find novel interventions against SAM which will hopefully lead
to human trials and eventually to lower mortality. This study also aims to characterize the
intestinal dysfunction during the dual insult of enteric infection and SAM. As animal model a
previously developed murine model of SAM will be used and an enteric infection with C.
rodentium will be added.
My research questions are as follows:
1) What are a suitable infectious dose and infection length to induce an enteric infection
with C. rodentium in severely malnourished mice?
A dose and length are considered suitable if
o C. rodentium can be detected in stool at the end of the experiment
o clinical symptoms such as weight loss or diarrhea can be seen
o the infection is not lethal during the experiment
2) What is the influence of enteric infection on intestinal morphometry and the intestinal
epithelial barrier function and are malnourished mice more affected than control mice?

8
I hypothesize that a suitable infectious dose will be 10⁸ CFU and a suitable infection length 10
days. These correspond to respectively the minimum infectious dose mentioned in previous
studies (42) and the height of infection. Furthermore, I expect that the enteric infection will
cause villous blunting, crypt hyperplasia, goblet cell loss and epithelial cell damage and that it
will lower tight junction protein expression and attenuate tight junction distribution. Finally, I
postulate that changes will be greater in malnourished than control mice.

9
MATERIALS AND METHODS
Animal model:
Male C57BL/6 mice were weaned after 21 days and put on either a protein deficient or
control diet. The protein deficient diet contained 1% protein and the isocaloric control diet
contained 18% protein. An overview of the nutritional composition of the mice’ diets can be
found in Appendix I. During the experiment mice had free access to water and their assigned
diet and their weight was determined regularly. Four days after weaning, the mice were either
infected with C. rodentium or not infected and eight and eleven days after weaning stool was
collected. 11 or 14 days after weaning, the mice were sacrificed through carbon dioxide
inhalation and their tissue and feces were harvested for further analysis. All mice were held in
an environment with a light: dark cycle of 14: 10, humidity between 50 and 60 % and a
temperature between 23 and 25 °C. The animal handling was done according to the Canadian
Council on Animal Care guidelines and approval was given by the Animal Care Committee of
SickKids.
C. rodentium infection:
C. rodentium from a frozen stock obtained from Dr. Kim’s lab (SickKids, Canada) was plated
on Luria-Bertani (LB) agar to obtain single colonies. A single colony was then inoculated into
10 ml of LB broth and grown statically for 16 hours at 37 °C. Afterwards, the concentration
of C. rodentium was measured using a Nanodrop 2000c spectrophotometer and adapted until
the OD₆₀₀ was 0.7 ± 0.02 nm corresponding to a C. rodentium concentration of 10¹⁰ CFU/ 100
μl. The solution of C. rodentium was diluted 100 or 1000 times in phosphate-buffered saline
(PBS) to obtain concentrations of respectively 10⁸ CFU/ 100 μl and 10⁷ CFU/ 100 μl. In
previous studies, mostly a C. rodentium concentration between 10⁸ and 10⁹ CFU was used to
induce an enteric infection (36,37,43,44). Since the mice in our study were younger than the
mice used in aforementioned studies, as start dose 10⁸ CFU C. rodentium has been chosen.
Furthermore, it has been reported that the infection plateaus at day 7 and starts to clear 3 days
later (34) and that colonic hyperplasia can be seen between 6 and 20 days post-infection (45).
Due to these characteristic as a start an infection duration of 10 days was chosen. During the
fourth day post-weaning the mice that were assigned to be infected with C. rodentium were
orogastrically infected with 100 μl / 10 gram of the C. rodentium solution of 10⁸ CFU/ 100 μl
or 10⁷ CFU/ 100 μl. The other mice were orogastrically inoculated with 100 μl / 10 gram of
sterile PBS. After inoculation, the mice were monitored daily before sacrifice on day 11 or 14.
C. rodentium colonization:
Of the mice that were infected with C. rodentium, fecal pellets were collected on day 4, day 7
and during sacrifice (for the mice of pilot project 1 and 2) and on day 4 and during sacrifice
(for the mice of pilot project 3). Of the mice that were not infected by C. rodentium, fecal
pellets were collected during sacrifice. All fecal pellets were stored at -80 °C until further
analysis. The relative amount of C. rodentium in the fecal pellets was determined by a real
time qPCR using an espB primer, which measures a virulence protein that is specific for C.
rodentium (46).
Firstly, bacterial RNA was extracted using a Direct-zol RNA miniprep plus kit (Zymo
research). The concentration and purity (A260/A280 ratio) of isolated RNA were measured
using a Nanodrop 2000c spectrophotometer. Hereafter, cDNA was created by using qScript
supermix (Quanta Biosciences, MA, USA). A RT qPCR was performed using a CFX96
C1000 Thermal Cycler (BioRad). C. rodentium was quantified relative to total bacteria using
an universal eubacteria primer (47). This quantification method has been described in a recent

10
paper by Sherman et al (48). For the rest of the analyses, only mice that were infected with C.
rodentium according to above mentioned analysis were included.
Histology:
Histology was done to examine villous height in the jejunum and crypt depth and goblet cell
density in the colon. After tissue harvesting, the proximal end of the jejunum and the distal
end of the colon were cut off and fixed in formalin overnight at 4 °C. Afterwards, tissue was
dehydrated, embedded in paraffin and sectioned at 5 µm. The sections were deparaffinized
and hydrated through xylene and graded alcohols. The jejunum sections were stained with
Hematoxylin and Eosin staining and the colon sections with Periodic Acid Schiff staining
(Skytek, UT, USA). Stained tissue was visualized and scanned under a light microscope.
Scans were examined by using Pannoramic Viewer 1.15.4. Villous height was measured from
the top of the villous to the start of the crypt; 20 measurements per section were done. Crypt
depth was measured from the top of the crypt to the submucosal layer; 30 measurements per
section were done. Goblet cells were counted per crypt for the colon; 30 measurements per
section were done. Goblet cell counts were expressed as the mean number of goblet cells per
50 µm of crypt.
Immunofluorescence:
Immunofluorescence was done to visualize the distribution and amount of several tight
junction proteins in the jejunum and colon. Deparaffinized and hydrated colon tissue sections
were obtained as described above. Antigens were retrieved with a sodium citrate buffer. As
primary antibodies claudin 3 (Abcam, MA, USA) and claudin 7 (Abcam, MA, USA) were
used in dilutions of respectively 1:40 and 1:200. They were incubated overnight at 4 °C.
Afterwards, a fluorescently labelled secondary antibody (in a dilution of 1: 10,000) and DAPI
(nucleus staining) were incubated for one hour. The slides were visualized using an Eclipse
Ni-U Upright microscope (Nikon).
Western blotting:
Western blotting was done to quantify the relative concentrations of several tight junction
proteins in the colon. After tissue harvesting, the medial section of the colon was cut off,
rinsed with ice cold PBS and stored at -80 °C until further analysis. The mucosal layer of the
colon was scraped off from the muscle layer with the blunt side of a razor blade. Tissue
extraction buffer (Invitrogen, CA, USA) mixed with Protease Inhibitor Single-USE cocktail
(Sigma, MO, USA) was added in an amount of 200 μl per 20 μg tissue. Proteins were isolated
from the mucosal layer by sonicating each sample three times 10 seconds. The samples were
spun down, supernatant was transferred and the protein concentrations in the supernatant were
determined by a Bicinchoninic Acid (BCA) Protein Assay (Thermo Scientific, IL, USA).
After this, the samples were diluted to a protein concentration of 20 mg/ml and proteins were
denatured by heating them up to 95 °C for 5 minutes. Protein samples were loaded on a
NuPAGE 4% - 12% Bis Tris gel and separated by electrophoresis. Afterwards, protein was
transferred to a PVDF membrane. The membrane was first blocked with milk (consisting of
dry milk and 1xTBST) and then incubated with the following primary antibodies: β-actin
(Sigma, MI, USA), claudin 3 (Abcam, MA, USA) and claudin 7 (Abcam, MA, USA). The
dilutions of aforementioned antibodies were all 1:2000. Afterwards secondary antibodies were
added in a dilution of 1:10,000. The membrane was made immunodetectable by using an ECL
Plus Kit (Invitrogen, CA, USA). Protein expression levels were detected by an Odyssey
scanner (LI-COR Biosciences, LI, USA) and quantified by using Image Studio 5.0.

11
Statistical analysis:
Statistical analyses were performed using Excel 2016 and GraphPad Prism Software 6.00.
Unless stated otherwise, all results are expressed as the mean ± standard error of the means
(SEM). Comparisons between two groups were made using unpaired two-tailed Student’s t-
tests and comparisons between more than two groups were made by using a two-way analysis
of variance (ANOVA). P values <0.05 were considered statistically significant. In all figures,
one asterisk corresponds to a p value <0.05, two asterisks correspond to a p value <0.01 and
three asterisks correspond to a p value <0.001.

12
RESULTS
Pilot projects 1 and 2
First pilot project 1 was performed to determine if a concentration of C. rodentium of 10⁸
CFU was adequate to induce enteric infection (figure 5). This dose was recommended as
minimum dose in previous studies (42). For this pilot project four malnourished mice,
receiving a diet containing 1% protein, were inoculated with 10⁸ CFU of C. rodentium. All
mice reached a humane endpoint before the end of the experiment. They lost more than 20%
of their initial weight (figure 6).
Consequently, for pilot project 2 the given dose of C. rodentium was lowered to 10⁷ CFU.
Four malnourished and three control mice were inoculated with 10⁷ CFU of C. rodentium.
During this pilot project, also a substantial amount, three out of four malnourished mice,
reached a humane endpoint before the end of the experiment. The two mice that reached a
humane endpoint on day 12 and day 13 were still included in the analyses because we only
found out during sacrifice that they did. In total the data of three infected malnourished mice
were used for the rest of the analyses.
Figure 5. Pilot projects 1 and 2
Figure 6. Survival of malnourished mice that were infected with doses of respectively 10⁸ and 10⁷ CFU of C.
rodentium. Survival is defined as the number of mice that did not reach a humane endpoint. n=4 for both graphs
All mice that were inoculated with 10⁷ CFU C. rodentium had detectable bacteria in their
stool. After inoculation with the same dose of C. rodentium, malnourished mice, who were
given a 1% protein diet, had a higher fecal infection load than control mice, who were given
an 18% protein diet (figure 7). In both malnourished and control mice, the infection load
increased up to day 7 post-infection after which it further increased in malnourished mice and
0
20
40
60
80
100
120
0 1 2 3 4 5 6 7 8 9 10 11 12 13 14
Per
cen
tage
(%
)
Day
Survival (10⁸ CFU)
0
20
40
60
80
100
120
0 1 2 3 4 5 6 7 8 9 10 11 12 13 14
Per
cen
tage
(%
)
Day
Survival (10⁷ CFU)

13
slightly decreased in control mice. To make sure that the enteric infection was in the same
phase in malnourished and control mice and because too many animals reached a humane
endpoint during pilot project 2, for pilot project 3 we choose to shorten the infection to seven
days and to shorten the overall duration of the experiment to eleven days.
Figure 7. Infection load of C. rodentium in feces. Relative expressions have been calculated with qPCR analysis
and have been normalized to the total amount of bacteria with a universal eubacteria primer. n=3 for all groups.
The effect of C. rodentium infection on weight loss and diarrhea in malnourished and
control mice. Over the course of 14 days all malnourished mice lost weight and all control mice gained
weight. In figure 8A and 8B, weight loss is represented as weight loss post-infection or in
other words weight loss between day 4 and day 14 of the experiment. Malnourished mice that
were infected with C. rodentium lost most weight. They lost on average 24% of their weight
after they were infected with C. rodentium. Malnourished mice that were not infected lost less
weight during this period, on average 11%, a statistically significant difference (p<0.001).
Control mice that were infected with C. rodentium gained on average 16% of their weight
after they were infected. Control mice that were not infected gained more weight, on average
43%. This difference in weight loss was also significant (p<0.01). When comparing
malnourished and control mice, control mice lost relatively more weight after a C. rodentium
infection than malnourished mice, 19% compared to 14%. However, the euthanized mouse is
not included and therefore the weight loss of 14% of malnourished mice is likely an
underestimation.
Apart from weight loss, also stool consistency was studied. During the experiment, feces were
sampled at several time points: on day 4, 7 and during sacrifice. Malnourished mice proved to
be more prone to diarrhea than control mice. All infected, malnourished mice had diarrhea at
the end of the experiment compared to 33% of infected, control mice (figure 8C).
0
0,0005
0,001
0,0015
0,002
0,0025
0,003
0,0035
0,004
4 7 10
Rel
ativ
e ex
pre
ssio
n
Days post-infection
C. rodentium in feces
1% + C. rod
18% + C. rod
Control

14
Figure 8. Weight change and change in stool consistency after an enteric infection. (A) weight change, presented
as the ratio of weight change post-infection. Error bars represent the SEM, n= 25 (18%), n=3 (18% + C. rod)
n=30 (1%), n=3 (1% + C. rod). (B) ratio of weight change on day 10 post-infection. Significance has been
calculated with a student’s t-test whereby ** corresponds to p<0.01 and *** to p<0.001. (C) stool consistency,
presented as the percentage of mice with diarrhea, n=3 for both groups. Diarrhea was defined as watery, loose
stool that did not form a fecal pellet.
The effect of C. rodentium infection on crypt hyperplasia and goblet cell loss in
malnourished and control mice.
After sacrifice, colon tissue was collected, dehydrated, paraffinized, sectioned, stained and
scanned. Histological slides of infected mice were compared to slides of non-infected mice
that were obtained earlier by another investigator of Dr. Bandsma’s lab. The data of the other
student showed that malnutrition caused crypt hypoplasia (p<0.01) and goblet cell loss
(p<0.001; figure 9). Contradictory to malnutrition, the enteric infection caused crypt
hyperplasia. In control mice, the average crypt depth increased 134 μm to 194 μm (p<0.01)
and in malnourished mice from 92 μm to 147 μm (p<0.05). Furthermore, the enteric infection
caused goblet cell loss. The average amount of goblet cells decreased from 7.76 cells/50 μm
to 4.63 cells/50 μm in control mice (p<0.01) and from 4.71 cells/50 μm to 3.78 cells/50 μm in
malnourished mice (p<0.05). Lastly, in non-infected mice and in infected, control mice there
was only some epithelial damage, whereas in infected, malnourished mice, the epithelial
damage was substantial. This epithelial damage may have caused that the average crypt depth
of malnourished, infected mice has been underestimated.
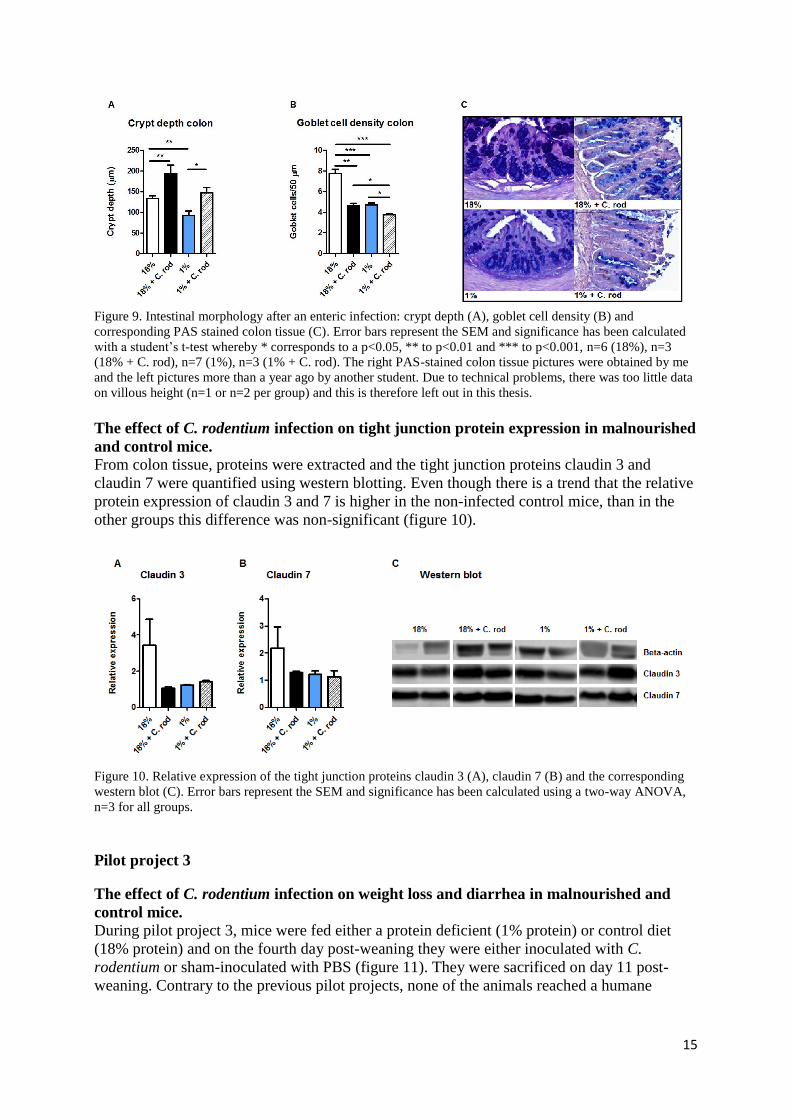
15
Figure 9. Intestinal morphology after an enteric infection: crypt depth (A), goblet cell density (B) and
corresponding PAS stained colon tissue (C). Error bars represent the SEM and significance has been calculated
with a student’s t-test whereby * corresponds to a p<0.05, ** to p<0.01 and *** to p<0.001, n=6 (18%), n=3
(18% + C. rod), n=7 (1%), n=3 (1% + C. rod). The right PAS-stained colon tissue pictures were obtained by me
and the left pictures more than a year ago by another student. Due to technical problems, there was too little data
on villous height (n=1 or n=2 per group) and this is therefore left out in this thesis.
The effect of C. rodentium infection on tight junction protein expression in malnourished
and control mice. From colon tissue, proteins were extracted and the tight junction proteins claudin 3 and
claudin 7 were quantified using western blotting. Even though there is a trend that the relative
protein expression of claudin 3 and 7 is higher in the non-infected control mice, than in the
other groups this difference was non-significant (figure 10).
Figure 10. Relative expression of the tight junction proteins claudin 3 (A), claudin 7 (B) and the corresponding
western blot (C). Error bars represent the SEM and significance has been calculated using a two-way ANOVA,
n=3 for all groups.
Pilot project 3
The effect of C. rodentium infection on weight loss and diarrhea in malnourished and
control mice.
During pilot project 3, mice were fed either a protein deficient (1% protein) or control diet
(18% protein) and on the fourth day post-weaning they were either inoculated with C.
rodentium or sham-inoculated with PBS (figure 11). They were sacrificed on day 11 post-
weaning. Contrary to the previous pilot projects, none of the animals reached a humane
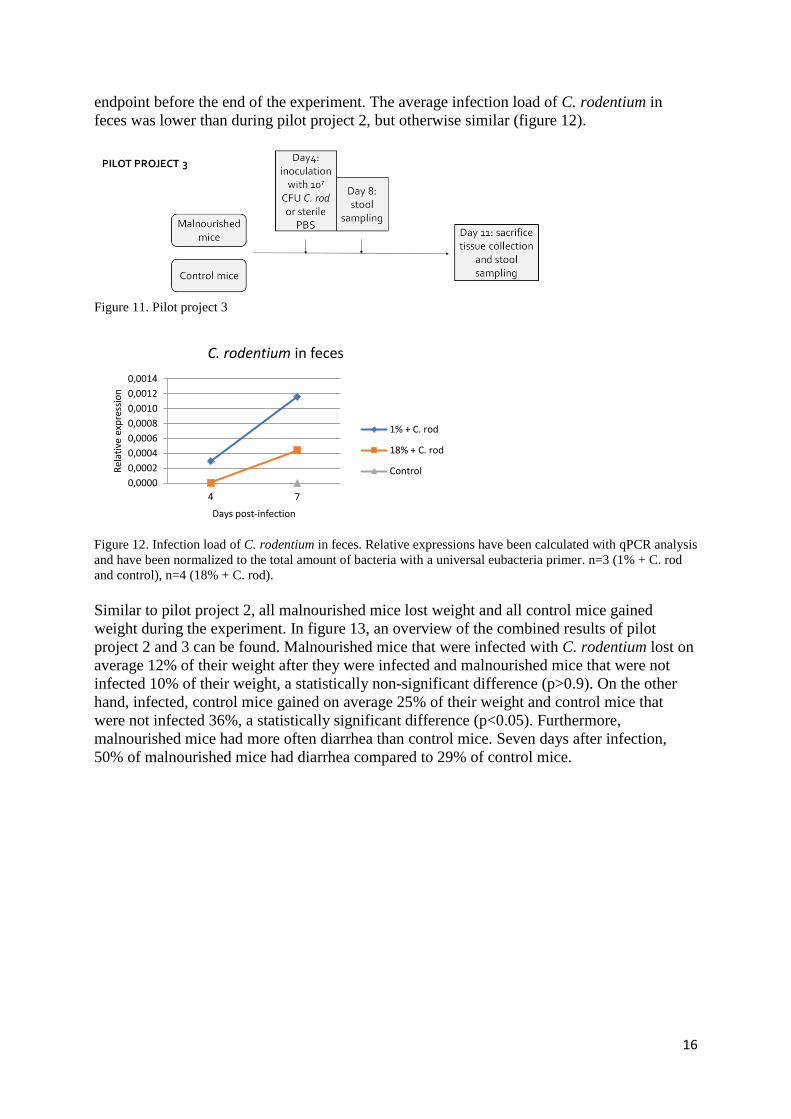
16
endpoint before the end of the experiment. The average infection load of C. rodentium in
feces was lower than during pilot project 2, but otherwise similar (figure 12).
Figure 11. Pilot project 3
Figure 12. Infection load of C. rodentium in feces. Relative expressions have been calculated with qPCR analysis
and have been normalized to the total amount of bacteria with a universal eubacteria primer. n=3 (1% + C. rod
and control), n=4 (18% + C. rod).
Similar to pilot project 2, all malnourished mice lost weight and all control mice gained
weight during the experiment. In figure 13, an overview of the combined results of pilot
project 2 and 3 can be found. Malnourished mice that were infected with C. rodentium lost on
average 12% of their weight after they were infected and malnourished mice that were not
infected 10% of their weight, a statistically non-significant difference (p>0.9). On the other
hand, infected, control mice gained on average 25% of their weight and control mice that
were not infected 36%, a statistically significant difference (p<0.05). Furthermore,
malnourished mice had more often diarrhea than control mice. Seven days after infection,
50% of malnourished mice had diarrhea compared to 29% of control mice.
0,0000
0,0002
0,0004
0,0006
0,0008
0,0010
0,0012
0,0014
4 7
Rel
ativ
e ex
pre
ssio
n
Days post-infection
C. rodentium in feces
1% + C. rod
18% + C. rod
Control

17
Figure 13. Weight change and change in stool consistency after an enteric infection. These are the combined
results of pilot project 2 and 3. (A) weight change, presented as the ratio of weight change post-infection. Error
bars represent the SEM, n= 30 (18%), n=7 (18% + C. rod) n=34 (1%), n=7 (1% + C. rod). (B) ratio of weight
change on day 10 post-infection. Significance has been calculated with a student’s t-test whereby * corresponds
to a p<0.05 and *** to p<0.001. (C) stool consistency, presented as the percentage of mice with diarrhea, n=7
(18% + C. rod), n=6 (1% + C. rod).
The effect of C. rodentium infection on crypt hyperplasia and goblet cell loss in
malnourished and control mice. After sacrifice, jejunum and colon tissue have been
collected, dehydrated, paraffinized, sectioned, stained and scanned. The jejunal villi of
malnourished mice were shorter than the villi of control mice (p<0.05, figure 14), they were
on average respectively 241 μm and 313 μm. The enteric infection did not have an influence
on villous height. Similarly to the results of pilot project 2, malnourished mice had crypt
hypoplasia (p<0.05) and goblet cell loss (p<0.05). Furthermore, the enteric infection caused
crypt hyperplasia in malnourished mice (p<0.05). The average crypt depth was 136 μm in
non-infected malnourished mice and 170 μm in infected, malnourished mice. In control mice,
the enteric infection also caused slight crypt hyperplasia. The average crypt depth went from
176 μm to 204 μm, but this was not significant. Apart from crypt hyperplasia, the enteric
infection caused slight goblet cell loss in both malnourished and control mice, but these
differences were again not significant. The average goblet cell count went from 5.06 cells/50
μm to 4.80 cells/50 μm in malnourished mice and from 3.80 cells/50 μm to 3.36 cells/50 μm
in control mice.

18
Figure 14. Intestinal morphology after an enteric infection: villous height (A) crypt depth (C), goblet cell density
(D) and corresponding H&E stained jejunum tissue (B) and PAS stained colon tissue (E). Error bars represent
the SEM and significance has been calculated with a student’s t-test whereby * corresponds to a p<0.05 and **
to p<0.01. n=5 (18%), n=4 (18% + C. rod), n=4 (1%), n=3 (1% + C. rod).
The effect of C. rodentium infection on tight junction protein expression in malnourished
and control mice. After sacrifice, colon tissue has been collected, dehydrated, paraffinized
and sectioned. Two tight junction proteins, claudin 3 and claudin 7, have been visualized
using immunofluorescence. A representative picture of the expression and distribution of
claudin 3 and claudin 7 in all groups of mice is shown below (figure 15). The color intensity
represents the amount of tight junction protein. The intensity of claudin 3, and thereby the
amount of claudin 3, seemed lower in infected, malnourished mice than in the other groups.
Besides this, there were no clear differences in amount of claudin 3 and claudin 7. In healthy
animals, most tight junction proteins were present in the cell membranes. In
immunofluorescence this can be seen as a so-called chicken wire pattern (21). Claudin 3’
distribution was normal in non-infected malnourished mice and in both groups of control
mice. Only in infected malnourished mice the distribution of claudin 3 is altered. Here, the so-
called chicken wire pattern cannot be seen, claudin 3 is distributed more evenly in the crypts
and is thus relatively more present in the cytosol and less present in the cell membrane.
Claudins 7’ distribution, on the other hand, did not appear to be influenced by malnutrition or
enteric infection.

19
Figure 15. Expression and distribution of the tight junction proteins claudin 3 (A) and claudin 7 (B) in colon
tissue, 40x magnification, n=5 (18%), n=4 (18% + C. rod, 1%), n=3 (1% + C. rod).
From colon tissue, proteins were extracted and the tight junction proteins claudin 3 and
claudin 7 have been quantified using western blotting. There were no significant differences
between malnourished and control mice as well as between infected and non-infected mice
(figure 16).
Figure 16. Relative expression of the tight junction proteins claudin 3 (A), claudin 7 (B) and the corresponding
western blot (C). Error bars represent the SEM and significance has been calculated using a two-way ANOVA,
n=5 (18%), n = 4 (18% + C. rod, 1%), n=3 (1% + C. rod).

20
DISCUSSION
Overview of results:
During the first two pilot projects, many mice reached a humane endpoint before the end of
the experiment. Due to this, the dose of the enteric pathogen given to the animals had to be
lowered to 10⁷ CFU, the length of the infection shortened to 7 days and the overall length of
the experiment shortened to 11 days. After C. rodentium infection, malnourished mice had a
higher infection load than control mice which was associated with more diarrhea, epithelial
cell damage and an attenuated distribution of claudin 3. C. rodentium infection furthermore
caused weight loss, crypt hyperplasia and goblet cell loss. After seven days weight loss was
significant in control mice and crypt hyperplasia in malnourished mice and after ten days
weight loss, crypt hyperplasia and goblet cell loss were all significant in both malnourished
and control mice. The enteric infection had no influence on the distribution of claudin 7 and
on the amount of claudin 3 and claudin 7.
Animal model:
The main challenge in the development of the animal model appeared to be the severity of the
proteindeficient diet that was given to the animals. Most malnourished mice lost so much
weight that they approached a humane endpoint at the end of the study, meaning that there
was little space for extra weight loss due to the enteric infection. The protein content of the
protein deficient diet could not be increased, because previous data of Dr. Bandsma’s lab
showed that during a 2% protein diet, changes in intestinal morphometry as well as liver
steatosis could not be observed.
To stay within the boundaries of the animal use protocol, the dose of the enteric pathogen
given to the animals had to be lowered to 10⁷ CFU, a dose lower than the dose described in
previous studies, where the dose was between 10⁸ and 10⁹ CFU (36,37,43,44). Even though,
in a previous study mice did not get infected after this dose (49), in our study mice did. An
explanation why a lower dose of C. rodentium could be used is that the mice used in this
study were only three weeks old, whereas mice used in other studies were adult mice and
likely had better defense against pathogens.
Apart from lowering the infection, the length of the infection had to be shortened from 10 to 7
days. Initially was chosen for a 10-day infection, because the height of infection is between 7
and 10 days (34) and because the effects of the infection on the intestine, such as crypt
hyperplasia, start after 6 days and increase up to 14 days (45). 10 days thus represents the
height of infection and by this time effects on the intestine must be clearly visible. After
analyzing the infection load in malnourished mice and control mice, I found that up to 7 days
the infection load increased in both malnourished and control mice, but that after 7 days this
changed and the infection load kept increasing in malnourished mice, but started to decrease
in control mice. Since I was comparing the effects of the enteric infection on malnourished
and control mice, I concluded it would be optimal if the infection was in the same phase in
both groups of mice. At ten days this is doubtful, therefore it was decided to shorten the
infection. Since most animals reached a humane endpoint around day 11 of the experiment,
the infection was shortened to 7 days and the overall experiment to 11 days.
Infection load:
The infection load was higher in malnourished mice than in control mice. This means that,
when compared to the total amount of bacteria, there are relatively more C. rodentium
bacteria in the stool of malnourished mice than in the stool of control mice and hence that C.
rodentium multiplies itself faster in malnourished than control mice. One explanation could be
that the immune system of malnourished mice is impaired (50) and hence C. rodentium is less

21
restrained to reproduce itself. Another explanation could be that the microbiota of
malnourished mice differs from the microbiota of control mice (34,51) and that the microbiota
of malnourished mice is less able to compete with pathogens (52).
The infection load of malnourished mice was approximately three times higher during pilot
project 2 than during pilot project 3. Just as the longer infection duration, this could have
contributed to the results being significant during pilot project 2 and not during pilot project 3.
It is hard to measure the exact concentration of C. rodentium and it likely varies a little bit
every time a C. rodentium dilution is made. To reduce the influence of this variation on our
results, in both pilot project 2 and pilot project 3 we inoculated all malnourished and control
mice at the same time to make sure the administered dose was equal among both groups.
Clinical symptoms and intestinal morphology: The difference in infection load between malnourished and control mice did not translate to a
similar difference in weight loss. In both groups, the enteric infection with C. rodentium
caused weight loss. This has also been seen before in previous studies about C. rodentium
(36,37). It is difficult to explain why there was significant weight loss in control mice after 7
days, but not in malnourished mice. One explanation might be that there are not many animals
included and that it is mostly variation in weight change between animals instead of an actual
difference. Furthermore, one infected, malnourished mouse has been euthanized and excluded
because of too much weight loss. The weight loss in the infected malnourished group is thus
underestimated. Lastly, malnutrition weakens the immune system resulting in less cytokine
release (53,54). This could diminish systemic effects such as weight loss (55), but this is not
sufficiently supported in literature. Even though the difference in infection load was not
associated with a similar difference in weight loss, it was associated with a difference in stool
consistency between malnourished and control mice. Malnourished mice were more prone to
diarrhea than control mice.
Apart from measuring clinical symptoms, we also characterized the influence of the enteric
infection on intestinal morphology. The enteric infection did not influence villous height.
Villous blunting is a typical symptom of environmental enteric dysfunction (EED), a
syndrome of chronic intestinal inflammation caused by repeated enteric infections (8,11). Our
enteric infection therefore did not resemble EED. As far as I could find, no previous research
has been done on the influence of a C. rodentium infection on villous height. Furthermore, the
enteric infection caused crypt hyperplasia and goblet cell loss after 10 days of infection. After
7 days only crypt hyperplasia was significant and only in malnourished mice. However, these
were pilot experiments and not adequately powered to detect significant differences. Several
other studies also demonstrated crypt hyperplasia and goblet cell loss as a characteristic of
enteric infection (34,35,41). It seems that the enteric infection influences the morphometry of
the colon, where the infection takes place, but does not seem to have an influence on the small
intestine as can be seen during chronic enteric infection such as EED.
Epithelial barrier dysfunction:
This study examined the influence of enteric infection on epithelial cell damage and the
distribution and amount of two tight junction proteins, claudin 3 and claudin 7. Both epithelial
cell damage and an altered distribution or decreased amount of these tight junction proteins
contribute to increased paracellular flux and hence epithelial barrier dysfunction (15,56). The
difference in infection load between malnourished and control mice, as discussed earlier, was
also associated with a difference in epithelial cell damage between infected malnourished and
the other groups of mice. The enteric infection caused substantial epithelial cell damage in

22
malnourished mice, that was not seen in control mice. This epithelial cell damage is
associated with an increased paracellular flux and decreased epithelial barrier (18).
The difference in infection load was also associated with a difference in claudin 3 distribution.
In infected malnourished mice claudin 3 showed a relatively lower expression on the cell
membrane than in the other groups. The normal chicken wire pattern that is usually seen
during immunofluorescence of tight junction proteins (21) disappeared. Proteins were more
evenly distributed. In previous studies a similar alteration in claudin 3 distribution after an
enteric infection has been found (57). This alteration in distribution suggests that there is
fewer claudin 3 transported to the cell membrane where it exerts its function by sealing the
paracellular space (15). Fewer claudin 3 on the cell membrane would likely result in increased
paracellular flux and hence decreased barrier function. Contrary to claudin 3, the distribution
of claudin 7 was not altered by the enteric infection. To my knowledge, the distribution of this
tight junction protein has not been studied before in relation to enteric infection.
In this study, no significant difference was found in the relative protein expression of claudin
3 and claudin 7. This contradicts with earlier obtained unpublished data of Bandsma’s lab. In
those data, a significant decreased protein expression of claudin 3 and claudin 7 was found in
malnourished mice when compared to control mice. Our pilot projects were carried out in
small numbers of animals and might therefore have been underpowered to detect significant
differences. Another possible explanation could be an inadequate loading control during
western blotting. Contrary to pilot project 2, during pilot project 3, there was no trend of
decreased tight junction expression in malnourished mice compared to control mice. A
possible explanation could be that the amount of tight junctions only start to decrease after the
mice have been malnourished for some time. During pilot project 2, mice were given a
malnourished diet for 14 days, while during pilot project 3 this was 11 days. It could be that
11 days is too short to see an effect on the amount of tight junction proteins. A possible
explanation why there are less tight junctions during malnutrition is because there is a general
lack protein and thus not enough proteins for all tight junctions to form.
There are several other studies on tight junction proteins during malnutrition and enteric
infection. In a study by Brown et al (32), malnourished mice with an enteric infection had a
decreased expression of the sealing tight junctions zonulin 1 and claudin 4 and an increased
expression of the pore-forming TJ claudin 2. An increased expression of claudin 2 was also
found in mice with solely enteric infection in a study by Prasad et al (57) and in rats with
enteric infection in a study by Fernandez-Blanco et al (58). In this last study, also a decrease
in claudin 3 and occluding was found. In a study by Demehri et al, malnourished mice had a
lower expression of claudin 5 and claudin 8 (30). In other studies on enteric infection with the
enteric pathogens C. rodentium, EHEC and EPEC, no decreased amount of tight junction
proteins was found (21,38–40).
Limitations:
The experiments in this study were pilot projects that were not adequately powered to detect
differences in quantitative outcomes. Due to this, in some analyses only a trend but no
significance could be seen. Another limitation of this study is that the epithelial barrier
function has only been characterized by epithelial cell damage and the expression and
distribution of claudin 3 and claudin 7. A more direct measurement of epithelial barrier
function, such as epithelial permeability is lacking. Epithelial permeability can be measured
with a FITC Dextran Assay. Hereby fluorescent sugar is orogastrically administered and its
concentration in blood is measured 1.5 hours later. Other, still unpublished data of dr.

23
Bandsma’s lab showed that epithelial permeability was increased 2.5-fold in malnourished
mice when compared to control mice. It is expected that enteric infection also increases
epithelial permeability and that this effect is greatest in malnourished mice. It would have
been insightful when this hypothesis could have been tested. In these pilot projects a FITC
Dextran Assay has not been done because FITC and immunofluorescence cannot be
combined due to interfering fluorescent dyes. We chose to perform immunofluorescence as
this is a non-quantitative tool and therefore a reasonable choice for pilot experiments to get a
visual sense of the effect of the enteric infection.
There are some limitations related to the techniques used. During pilot project 2, the crypt
depths and goblet cell densities of infected mice were compared to previously obtained crypt
depths and goblet cell densities of non-infected mice. The analyses thus have been done by
different investigators which could have led to inconsistencies in the results. Also, the staining
protocol has been changed in between, which could have also led to inconsistencies. All
analyses of pilot project 3 have been done by me, so in this pilot there is no inter investigator
or staining inconsistency. When comparing the results of pilot project 2 and 3 some
inconsistencies can be seen. In pilot project 2 the goblet cell density of control mice is around
8 cells/50μm whereas in pilot project 3 this is around 5 cells/50μm. Since it is very unlikely
that the goblet cell count increases that much in three days, this is probably because of a
combination of inter-animal variation, inter-investigator inconsistency and inconsistency in
staining. The histology results of pilot project 2, especially the goblet cell density, should thus
be interpreted with caution. Apart from histology, also immunofluorescence could have been
improved. In this study, an epifluorescence microscope has been used. A confocal
microscope, however, would have created clearer images that better visualize protein
distribution.
As said earlier, an explanation for the contradiction between the western blot results in this
study and previous literature could be because of an inadequate loading control. As loading
control beta-actin has been used, a protein involved in a cell’s cytoskeleton. As can be seen in
the western blot results in this study, the protein concentrations of beta-actin are very variable,
a variability that cannot be explained by loading mistakes. Several other studies have also
found that beta-actin is variable in intestinal tissue and therefore not an adequate loading
control (59–61). It is a bit unclear what is the best substitute, in studies by Kouadjo et al and
Wang et al a few alternatives are listed (60,61). Another explanation is related to technical
irregularity. For western blot preparation, intestinal tissue must be lysed. It could be that I
lysed the tissue not long enough, so that only the tight junctions in the cytosol became free
and only part of the beta-actin which is in the cytoskeleton and cell nucleus and part of the
tight junctions in the cell membrane.
Future directions:
Several pilot experiments were carried out to develop an animal model of SAM and enteric
infection. A main challenge appeared to be to stay within the boundaries of ethical animal use
and hence the infection could not be too harsh or too long. For future purposes, I would
recommend using a C. rodentium dose of 10⁷ CFU and an infection length of 7 days. After
this dose and length, the enteric pathogen could be detected in feces, the infection was in the
same phase in malnourished and control mice, changes in intestinal morphology and epithelial
barrier function could be seen and the infection was not lethal. Not all changes in morphology
and barrier function were significant after this dose and length, but these were pilot projects
that were not adequately powered to detect quantitative differences.

24
During pilot project 3, we decided to shorten the overall duration of the experiment from 14 to
11 days. We did this because we were afraid that when we would adhere to a 14-day
experiment we would have to euthanize too many animals. During pilot project 3, mice
generally lost less weight than during pilot project 2. Based on the combined results of pilot
project 2 and 3, it seems that shortening the overall duration of the experiment from 14 to 11
days is not an absolute necessity. Since all data of non-infected mice for a 14-day experiment
have already been collected, including data on intestinal permeability, it might be better to
adhere to the 14-day experiment for our future mice model.
As said before, some techniques should be improved in future. Measuring villous height,
crypt depth and goblet cell density should be done in a more consistent manner. Furthermore,
one must find out if changed tissue lysis time or a changed loading control can form a
constant control for western blotting. Measuring intestinal epithelial permeability provides
more insight in the epithelial barrier function and hence should be implemented. Also,
assessing proliferation, differentiation and cell death could improve our knowledge on the
intestinal pathophysiology during enteric infection on top of SAM. With abovementioned
recommendations, improvements and additions our mice model of severe malnutrition and
enteric infection can be improved. Thereafter, it can be used to better understand the
pathogenesis of intestinal dysfunction during the double insult of SAM and enteric infection.
By better understanding the pathogenesis, possible therapeutic interventions could be
developed. Those conceivable interventions could subsequently be tested in mechanistic
animal studies and when promising in human trials. Ultimately, it could improve treatment of
malnourished children with enteric dysfunction and hence lower child mortality.

25
CONCLUSION
The first aim of this study was to develop a murine model to examine the effects of an enteric
infection on the intestinal dysfunction during SAM. As starting point an already existing
murine model of SAM was used and as enteric pathogen C. rodentium was chosen. After a
few pilot projects, a dose of 10⁷ CFU and an infection length of 7 days were considered a
suitable dose and infection length. With this dose and length, C. rodentium could be detected
in stool, part of mice developed diarrhea, control mice had significant weight loss and the
infection was not lethal during the experiment. With a higher dose (10⁸ CFU) and longer
infection (10 days), too many animals reached a humane endpoint before the end of the
experiment.
The second aim of this study was to examine the effects of an enteric infection on intestinal
morphometry and the intestinal epithelial barrier function and whether malnourished mice
were more affected than control mice. The combined results of the pilot projects revealed that
the enteric infection caused crypt hyperplasia, goblet cell loss, epithelial cell damage and an
altered distribution of the tight junction claudin 3. It did not influence villous height, the
distribution of the tight junction claudin 7 and the amount of tight junctions. Malnourished
mice had a higher infection load than control mice. This was associated with more diarrhea,
epithelial cell damage and an attenuated distribution of claudin 3. In future, this model can be
used to gain more insight in the pathophysiology of children with SAM and enteric
dysfunction, to develop new interventions and to test those.

26
ACKNOWLEDGEMENTS
This thesis would not have been possible without my supervisor, dr. Robert Bandsma. I would
like to thank him for giving me the opportunity to be part of his research team at SickKids and
for providing me with valuable and constructive feedback throughout my research internship.
Furthermore, I would like to thank all my colleagues of the Bandsma lab for their guidance
and sociability during my stay. I would especially like to thank Nathan Swain and Lijun Chi
for teaching me all necessary lab techniques and for their passionate guidance and assistance
during the experiments.

27
BIBLIOGRAPHY
1. Black RE, Victora CG, Walker SP, Bhutta ZA, Christian P, de Onis M, et al. Maternal and child
undernutrition and overweight in low-income and middle-income countries. Lancet [Internet]. 2013 Aug
3 [cited 2017 Jan 9];382(9890):427–51. Available from:
http://www.ncbi.nlm.nih.gov/pubmed/23746772
2. Niang I, Ruppel OC, Abdrabo MA, Essel A, Lennard C, Padgham J and UP. Africa. In: Climate Change
2014: Impacts, Adaptation and Vulnerability. Part B: Regional Aspects. Contribution of Working Group
II to the Fifth Assessment Report of the Intergovernmental Panel on Climate Change. [Internet]. 2014
[cited 2017 Apr 11]. Available from: https://www.ipcc.ch/pdf/assessment-report/ar5/wg2/WGIIAR5-
Chap22_FINAL.pdf
3. WHO | WHO child growth standards and the identification of severe acute malnutrition in infants and
children. WHO. 2014;
4. Lenters LM, Wazny K, Webb P, Ahmed T, Bhutta ZA. Treatment of severe and moderate acute
malnutrition in low- and middle-income settings: a systematic review, meta-analysis and Delphi process.
BMC Public Health [Internet]. 2013 [cited 2017 Jan 15];13(Suppl 3):S23. Available from:
http://www.ncbi.nlm.nih.gov/pubmed/24564235
5. Hossain M, Chisti MJ, Hossain MI, Mahfuz M, Islam MM, Ahmed T. Efficacy of World Health
Organization guideline in facility-based reduction of mortality in severely malnourished children from
low and middle income countries: A systematic review and meta-analysis. J Paediatr Child Health
[Internet]. 2017 Jan 4 [cited 2017 Jan 15]; Available from:
http://www.ncbi.nlm.nih.gov/pubmed/28052519
6. Keusch GT, Denno DM, Black RE, Duggan C, Guerrant RL, Lavery J V, et al. Environmental enteric
dysfunction: pathogenesis, diagnosis, and clinical consequences. Clin Infect Dis [Internet]. 2014 Nov 1
[cited 2017 Jan 14];59 Suppl 4(Suppl 4):S207-12. Available from:
http://www.ncbi.nlm.nih.gov/pubmed/25305288
7. Jones KDJ, Berkley JA. Severe acute malnutrition and infection. Paediatr Int Child Health [Internet].
2014 Dec [cited 2017 Jan 15];34 Suppl 1(Suppl 1):S1–29. Available from:
http://www.ncbi.nlm.nih.gov/pubmed/25475887
8. Jones KD, Thitiri J, Ngari M, Berkley JA. Childhood malnutrition: toward an understanding of
infections, inflammation, and antimicrobials. Food Nutr Bull [Internet]. 2014 Jun [cited 2017 Jan
15];35(2 Suppl):S64-70. Available from: http://www.ncbi.nlm.nih.gov/pubmed/25069296
9. Kumar R, Singh J, Joshi K, Singh HP, Bijesh S. Co-morbidities in hospitalized children with severe
acute malnutrition. Indian Pediatr [Internet]. 2014 Feb [cited 2017 Jan 15];51(2):125–7. Available from:
http://www.ncbi.nlm.nih.gov/pubmed/23999679
10. Crane RJ, Jones KDJ, Berkley JA. Environmental enteric dysfunction: an overview. Food Nutr Bull
[Internet]. 2015 Mar [cited 2017 Jan 9];36(1 Suppl):S76-87. Available from:
http://www.ncbi.nlm.nih.gov/pubmed/25902619
11. Petri WA, Naylor C, Haque R, Haque R. Environmental enteropathy and malnutrition: do we know
enough to intervene? BMC Med [Internet]. 2014 Oct 14 [cited 2017 Jan 14];12:187. Available from:
http://www.ncbi.nlm.nih.gov/pubmed/25604120
12. Environmental Enteric Dysfunction – an Overview | Community-Led Total Sanitation [Internet]. [cited
2017 Mar 17]. Available from: http://www.communityledtotalsanitation.org/resource/environmental-
enteric-dysfunction-overview
13. Blanton L V, Charbonneau MR, Salih T, Barratt MJ, Venkatesh S, Ilkaveya O, et al. Gut bacteria that
prevent growth impairments transmitted by microbiota from malnourished children. Science [Internet].
2016 Feb 19 [cited 2017 Jan 14];351(6275):aad3311-aad3311. Available from:
http://www.sciencemag.org/cgi/doi/10.1126/science.aad3311
14. Wang H-H, Wen F-Q, Wei J-R. [Research advances in the relationship between childhood malnutrition
and gut microbiota]. Zhongguo Dang Dai Er Ke Za Zhi [Internet]. 2016 Nov [cited 2017 Jan
16];18(11):1188–93. Available from: http://www.ncbi.nlm.nih.gov/pubmed/27817790
15. Suzuki T. Regulation of intestinal epithelial permeability by tight junctions. Cell Mol Life Sci [Internet].
2013 Feb 11 [cited 2017 Jan 14];70(4):631–59. Available from:
http://www.ncbi.nlm.nih.gov/pubmed/22782113
16. Corazziari ES. Intestinal Mucus Barrier in Normal and Inflamed Colon. J Pediatr Gastroenterol Nutr
[Internet]. 2009 Apr [cited 2017 Apr 11];48(Suppl 2):S54–5. Available from:
http://www.ncbi.nlm.nih.gov/pubmed/19300126
17. Liang GH, Weber CR. Molecular aspects of tight junction barrier function. Curr Opin Pharmacol
[Internet]. 2014 Dec [cited 2017 Jan 16];19:84–9. Available from:
http://www.ncbi.nlm.nih.gov/pubmed/25128899

28
18. France MM, Turner JR. The mucosal barrier at a glance. J Cell Sci [Internet]. 2017 Jan 6 [cited 2017 Jan
9];jcs.193482. Available from: http://www.ncbi.nlm.nih.gov/pubmed/28062847
19. Alcohol Research: Current Reviews | Alcohol and the Immune System [Internet]. [cited 2017 Mar 17].
Available from: https://www.arcr.niaaa.nih.gov/arcr372/toc37_2.htm
20. Lee SH. Intestinal permeability regulation by tight junction: implication on inflammatory bowel
diseases. Intest Res [Internet]. 2015 Jan [cited 2017 Jan 16];13(1):11–8. Available from:
http://www.ncbi.nlm.nih.gov/pubmed/25691839
21. Flynn AN, Buret AG. Tight junctional disruption and apoptosis in an in vitro model of Citrobacter
rodentium infection. Microb Pathog. 2008;45(2):98–104.
22. Welsh FK, Farmery SM, MacLennan K, Sheridan MB, Barclay GR, Guillou PJ, et al. Gut barrier
function in malnourished patients. Gut [Internet]. 1998 Mar [cited 2017 Jan 9];42(3):396–401. Available
from: http://www.ncbi.nlm.nih.gov/pubmed/9577348
23. Sullivan PB, Marsh MN, Mirakian R, Hill SM, Milla PJ, Neale G. Chronic diarrhea and malnutrition--
histology of the small intestinal lesion. J Pediatr Gastroenterol Nutr [Internet]. 1991 Feb [cited 2017 Jan
14];12(2):195–203. Available from: http://www.ncbi.nlm.nih.gov/pubmed/1904932
24. Galpin L, Manary MJ, Fleming K, Ou C-N, Ashorn P, Shulman RJ. Effect of Lactobacillus GG on
intestinal integrity in Malawian children at risk of tropical enteropathy. Am J Clin Nutr [Internet]. 2005
Nov [cited 2017 Jan 16];82(5):1040–5. Available from: http://www.ncbi.nlm.nih.gov/pubmed/16280436
25. Golden M. The effects of malnutrition in the metabolism of children. Trans R Soc Trop Med Hyg
[Internet]. 1988 [cited 2017 Jan 16];82(1):3–6. Available from:
http://www.ncbi.nlm.nih.gov/pubmed/3140444
26. Keusch GT. Subclinical malabsorption in Thailand. I. Intestinal absorption in Thai children. Am J Clin
Nutr [Internet]. 1972 Oct [cited 2017 Jan 16];25(10):1062–6. Available from:
http://www.ncbi.nlm.nih.gov/pubmed/4627873
27. Semba RD, Shardell M, Trehan I, Moaddel R, Maleta KM, Ordiz MI, et al. Metabolic alterations in
children with environmental enteric dysfunction. Sci Rep [Internet]. 2016 Jun 13 [cited 2017 Jan
9];6:28009. Available from: http://www.ncbi.nlm.nih.gov/pubmed/27294788
28. Campbell DI, Elia M, Lunn PG. Growth faltering in rural Gambian infants is associated with impaired
small intestinal barrier function, leading to endotoxemia and systemic inflammation. J Nutr [Internet].
2003 May [cited 2017 Jan 16];133(5):1332–8. Available from:
http://www.ncbi.nlm.nih.gov/pubmed/12730419
29. Campbell DI, Lunn PG, Elia M. Age-related association of small intestinal mucosal enteropathy with
nutritional status in rural Gambian children. Br J Nutr [Internet]. 2002 Nov 9 [cited 2017 Jan
16];88(5):499–505. Available from: http://www.journals.cambridge.org/abstract_S0007114502002088
30. Demehri FR, Krug SM, Feng Y, Lee IFM, Schulzke JD, Teitelbaum DH. Tight Junction Ultrastructure
Alterations in a Mouse Model of Enteral Nutrient Deprivation. Dig Dis Sci [Internet]. 2016 Jun 21 [cited
2017 Jan 16];61(6):1524–33. Available from: http://www.ncbi.nlm.nih.gov/pubmed/26685910
31. Korpe PS, Petri WA. Environmental enteropathy: critical implications of a poorly understood condition.
Trends Mol Med [Internet]. 2012 Jun [cited 2017 Jan 14];18(6):328–36. Available from:
http://www.ncbi.nlm.nih.gov/pubmed/22633998
32. Brown EM, Wlodarska M, Willing BP, Vonaesch P, Han J, Reynolds LA, et al. Diet and specific
microbial exposure trigger features of environmental enteropathy in a novel murine model. Nat Commun
[Internet]. 2015 Aug 4 [cited 2017 Jan 9];6:7806. Available from:
http://www.ncbi.nlm.nih.gov/pubmed/26241678
33. Bosman ES, Chan JM, Bhullar K, Vallance BA. Investigation of Host and Pathogen Contributions to
Infectious Colitis Using the Citrobacter rodentium Mouse Model of Infection. In: Methods in molecular
biology (Clifton, NJ) [Internet]. 2016 [cited 2017 Jan 9]. p. 225–41. Available from:
http://www.ncbi.nlm.nih.gov/pubmed/27246037
34. Crepin VF, Collins JW, Habibzay M, Frankel G. Citrobacter rodentium mouse model of bacterial
infection. Nat Protoc [Internet]. 2016 Sep 8 [cited 2017 Jan 9];11(10):1851–76. Available from:
http://www.ncbi.nlm.nih.gov/pubmed/27606775
35. Papapietro O, Teatero S, Thanabalasuriar A, Yuki KE, Diez E, Zhu L, et al. R-spondin 2 signalling
mediates susceptibility to fatal infectious diarrhoea. Nat Commun [Internet]. 2013 May 21 [cited 2017
Jan 15];4:1898. Available from: http://www.nature.com/doifinder/10.1038/ncomms2816
36. Gibson DL, Ma C, Rosenberger CM, Bergstrom KSB, Valdez Y, Huang JT, et al. Toll-like receptor 2
plays a critical role in maintaining mucosal integrity during Citrobacter rodentium-induced colitis. Cell
Microbiol [Internet]. 2007 Oct 2 [cited 2017 Jan 10];0(0):071003010119001–??? Available from:
http://www.ncbi.nlm.nih.gov/pubmed/17910742
37. Ryz NR, Lochner A, Bhullar K, Ma C, Huang T, Bhinder G, et al. Dietary vitamin D3 deficiency alters
intestinal mucosal defense and increases susceptibility to Citrobacter rodentium -induced colitis. Am J

29
Physiol - Gastrointest Liver Physiol [Internet]. 2015 Nov 1 [cited 2017 Jan 10];309(9):G730–42.
Available from: http://www.ncbi.nlm.nih.gov/pubmed/26336925
38. Ugalde-Silva P, Gonzalez-Lugo O, Navarro-Garcia F. Tight Junction Disruption Induced by Type 3
Secretion System Effectors Injected by Enteropathogenic and Enterohemorrhagic Escherichia coli. Front
Cell Infect Microbiol [Internet]. 2016 [cited 2017 Jan 16];6:87. Available from:
http://www.ncbi.nlm.nih.gov/pubmed/27606286
39. Guttman JA, Finlay BB. Tight junctions as targets of infectious agents. Biochim Biophys Acta -
Biomembr. 2009;1788(4):832–41.
40. Philpott DJ, McKay DM, Sherman PM, Perdue MH. Infection of T84 cells with enteropathogenic
Escherichia coli alters barrier and transport functions. Am J Physiol [Internet]. 1996 Apr [cited 2017 Jan
16];270(4 Pt 1):G634-45. Available from: http://www.ncbi.nlm.nih.gov/pubmed/8928793
41. Collins JW, Keeney KM, Crepin VF, Rathinam VAK, Fitzgerald KA, Finlay BB, et al. Citrobacter
rodentium: infection, inflammation and the microbiota. Nat Rev Microbiol [Internet]. 2014 Aug 4 [cited
2017 Jan 15];12(9):612–23. Available from: http://www.nature.com/doifinder/10.1038/nrmicro3315
42. Bhinder G, Sham HP, Chan JM, Morampudi V, Jacobson K, Vallance BA. The <em>Citrobacter
rodentium</em> Mouse Model: Studying Pathogen and Host Contributions to Infectious Colitis. J
Vis Exp [Internet]. 2013 Feb 19 [cited 2017 Apr 11];(72):e50222. Available from:
http://www.ncbi.nlm.nih.gov/pubmed/23462619
43. Kumar A, Anbazhagan AN, Coffing H, Chatterjee I, Priyamvada S, Gujral T, et al. Lactobacillus
acidophilus counteracts inhibition of NHE3 and DRA expression and alleviates diarrheal phenotype in
mice infected with Citrobacter rodentium. Am J Physiol - Gastrointest Liver Physiol [Internet]. 2016
Nov 1 [cited 2017 Jan 10];311(5):G817–26. Available from:
http://www.ncbi.nlm.nih.gov/pubmed/27634011
44. Johnson-Henry KC, Pinnell LJ, Waskow AM, Irrazabal T, Martin A, Hausner M, et al. Short-Chain
Fructo-oligosaccharide and Inulin Modulate Inflammatory Responses and Microbial Communities in
Caco2-bbe Cells and in a Mouse Model of Intestinal Injury. J Nutr [Internet]. 2014;144(11):1725–33.
Available from: http://www.ncbi.nlm.nih.gov/pubmed/25143376
45. McKeel R, Douris N, Foley PL, Feldman SH. Comparison of an espB gene fecal polymerase chain
reaction assay with bacteriologic isolation for detection of Citrobacter rodentium infection in mice.
Comp Med [Internet]. 2002 Oct [cited 2017 Jan 15];52(5):439–44. Available from:
http://www.ncbi.nlm.nih.gov/pubmed/12405637
46. Sagaidak S, Taibi A, Wen B, Comelli EM. Development of a real-time PCR assay for quantification of
Citrobacter rodentium. J Microbiol Methods [Internet]. 2016 Jul [cited 2017 Jan 16];126:76–7. Available
from: http://www.ncbi.nlm.nih.gov/pubmed/27196638
47. Gorzelak MA, Gill SK, Tasnim N, Ahmadi-Vand Z, Jay M, Gibson DL. Methods for Improving Human
Gut Microbiome Data by Reducing Variability through Sample Processing and Storage of Stool. PLoS
One [Internet]. 2015 [cited 2017 Jan 15];10(8):e0134802. Available from:
http://www.ncbi.nlm.nih.gov/pubmed/26252519
48. Sherman PM, Johnson-Henry K, Lackraj T, Barnett Foster D, Goodman SD, Segall AM. Novel
antimicrobial peptide prevents C. rodentium infection in C57BL/6 mice by enhancing acid-induced
pathogen killing. Microbiology [Internet]. 2016 Sep 1 [cited 2017 Mar 18];162(9):1641–50. Available
from: http://www.ncbi.nlm.nih.gov/pubmed/27412446
49. Tennant SM, Hartland EL, Phumoonna T, Lyras D, Rood JI, Robins-Browne RM, et al. Influence of
gastric acid on susceptibility to infection with ingested bacterial pathogens. Infect Immun [Internet].
2008 Feb [cited 2017 Apr 11];76(2):639–45. Available from:
http://www.ncbi.nlm.nih.gov/pubmed/18025100
50. Iliakis D, Kressig RW. Malnutrition und Infekte. Ther Umschau [Internet]. 2014 Jan [cited 2017 Apr
11];71(1):55–61. Available from: http://www.ncbi.nlm.nih.gov/pubmed/24394209
51. Subramanian S, Huq S, Yatsunenko T, Haque R, Mahfuz M, Alam MA, et al. Persistent gut microbiota
immaturity in malnourished Bangladeshi children. Nature [Internet]. 2014 Jun 19 [cited 2017 Apr
11];510(7505):417–21. Available from: http://www.ncbi.nlm.nih.gov/pubmed/24896187
52. Hickman D, Jones MK, Zhu S, Kirkpatrick E, Ostrov DA, Wang X, et al. The effect of malnutrition on
norovirus infection. MBio [Internet]. 2014 Mar 4 [cited 2017 Apr 11];5(2):e01032-13. Available from:
http://www.ncbi.nlm.nih.gov/pubmed/24595373
53. Anuradha R, Munisankar S, Bhootra Y, Kumar NP, Dolla C, Kumaran P, et al. Coexistent Malnutrition
Is Associated with Perturbations in Systemic and Antigen-Specific Cytokine Responses in Latent
Tuberculosis Infection. Rosenberg HF, editor. Clin Vaccine Immunol [Internet]. 2016 Apr [cited 2017
Apr 11];23(4):339–45. Available from: http://www.ncbi.nlm.nih.gov/pubmed/26865593
54. González-Torres C, González-Martínez H, Miliar A, Nájera O, Graniel J, Firo V, et al. Effect of
Malnutrition on the Expression of Cytokines Involved in Th1 Cell Differentiation. Nutrients [Internet].

30
2013 Feb 19 [cited 2017 Apr 11];5(3):579–93. Available from:
http://www.ncbi.nlm.nih.gov/pubmed/23429441
55. de Steenwinkel FDO, Hokken-Koelega ACS, de Man YA, de Rijke YB, de Ridder MAJ, Hazes JMW, et
al. Circulating maternal cytokines influence fetal growth in pregnant women with rheumatoid arthritis.
Ann Rheum Dis [Internet]. 2013 Dec [cited 2017 Apr 11];72(12):1995–2001. Available from:
http://www.ncbi.nlm.nih.gov/pubmed/23264340
56. Tanaka H, Takechi M, Kiyonari H, Shioi G, Tamura A, Tsukita S. Intestinal deletion of Claudin-7
enhances paracellular organic solute flux and initiates colonic inflammation in mice. Gut [Internet]. 2015
Oct [cited 2017 Mar 19];64(10):1529–38. Available from:
http://www.ncbi.nlm.nih.gov/pubmed/25691495
57. Prasad S, Mingrino R, Kaukinen K, Hayes KL, Powell RM, MacDonald TT, et al. Inflammatory
processes have differential effects on claudins 2, 3 and 4 in colonic epithelial cells. Lab Invest [Internet].
2005 Sep 11 [cited 2017 Mar 19];85(9):1139–62. Available from:
http://www.nature.com/doifinder/10.1038/labinvest.3700316
58. Fernandez-Blanco JA, Estevez J, Shea-Donohue T, Martinez V, Vergara P. Changes in Epithelial Barrier
Function in Response to Parasitic Infection: Implications for IBD Pathogenesis. J Crohn’s Colitis
[Internet]. 2015 Jun 1 [cited 2017 Jan 9];9(6):463–76. Available from:
http://www.ncbi.nlm.nih.gov/pubmed/25820018
59. Yu S, Hwang HE, Yun N, Goldenring JR, Nam KT. The mRNA and Protein Levels of Tubulin and β-
Actin Are Greatly Reduced in the Proximal Duodenum of Mice Relative to the Rest of the Small
Intestines. Dig Dis Sci [Internet]. 2015 Sep 15 [cited 2017 Mar 11];60(9):2670–6. Available from:
http://www.ncbi.nlm.nih.gov/pubmed/25976623
60. Kouadjo KE, Nishida Y, Cadrin-Girard JF, Yoshioka M, St-Amand J. Housekeeping and tissue-specific
genes in mouse tissues. BMC Genomics [Internet]. 2007 May 22 [cited 2017 Mar 11];8:127. Available
from: http://www.ncbi.nlm.nih.gov/pubmed/17519037
61. Wang F, Wang J, Liu D, Su Y. Normalizing genes for real-time polymerase chain reaction in epithelial
and nonepithelial cells of mouse small intestine. Anal Biochem [Internet]. 2010 Apr 15 [cited 2017 Mar
11];399(2):211–7. Available from: http://www.ncbi.nlm.nih.gov/pubmed/20036209

31
APPENDIX I
Nutritional components
(g/kg)
18% protein diet 1% protein diet
Casein 207 11.5
DL-Methionine 2.70 0.36
Sucrose 350 350
Corn Starch 251.3 426.54
Maltodextrin 50 50
Corn Oil 52.60 54.2
Cellulose 41.06 60.6
Vitamin Mix, Teklad
(40060)
10 10
Ethoxyquin, antioxidant 0.01 0.01
Mineral Mix, Ca-P
deficient (79055)
13.37 13.37
Calcium Phosphate,
dibasic
17.36 22.32
Calcium Carbonate 4.6 1.1 Table 1. Nutritional composition of the mice diets