isc-test report - vlaanderen
TRANSCRIPT
This report cannot be reproduced without prior permission of the institute Page 1 of 59
Colfontaine, the 19th March 2021
ISC-Test Report
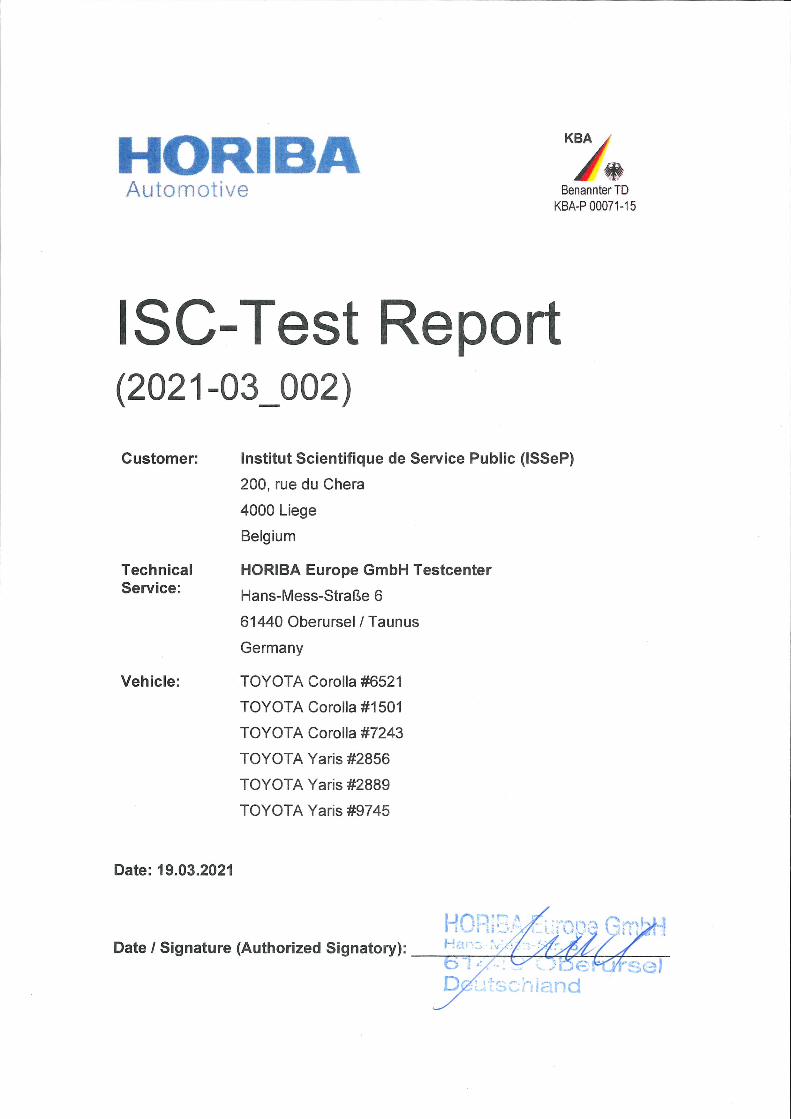
Customer: Departement Mobiliteit en Openbare Werken
Vlaams Huis voor de
Verkeersveiligheid
Koning Albert II-laan 20, bus 2
1000 Brussels, Belgium
Vehicles:
Toyota Corolla VIN : #6521
Toyota Corolla VIN : #1501
Toyota Corolla VIN : #7243
Toyota Yaris VIN : #2856
Toyota Yaris VIN : #2889
Toyota Yaris VIN : #9745
Report n° : 528/2021
This report cannot be reproduced without prior permission of the institute Page 2 of 59
Contents
1 General presentation of ISSeP .................................................................................................. 3
2 About HORIBA Technical Service ............................................................................................. 4
3 Quick overview and main conclusions of the testing campaign ................................................ 4
4 ISC testing ................................................................................................................................. 5
4.1 Vehicle sample .................................................................................................................... 5
4.2 Description of the measurement campaign ....................................................................... 10
4.2.1 Vehicle owner interview ............................................................................................. 10
4.2.2 Vehicle inspection ...................................................................................................... 10
4.2.3 PEMS installation in the vehicle ................................................................................ 11
4.2.4 Testing schedule ........................................................................................................ 12
5 Summary of Results ................................................................................................................ 14
5.1 WLTC on Chassis-Dyno (Type 1) ...................................................................................... 14
5.1.1 Toyota Corolla ........................................................................................................... 14
5.1.2 Toyota Yaris ............................................................................................................... 17
5.2 PEMS validation on Chassis-Dyno .................................................................................... 20
5.3 Real Driving Emissions (Type 1A) ..................................................................................... 22
5.3.1 RDE Testing route (characteristics and driving dynamics) ........................................ 22
5.3.2 RDE Final Emission Results ...................................................................................... 26
6 Detailed results ........................................................................................................................ 28
6.1 WTLC on chassis dyno (Type1) .................................................................................... 28
6.2 RDE (Real Driving Emissions) (Type 1A) ...................................................................... 40
7 Lessons learned during the testing campaign ......................................................................... 58
8 General information ................................................................................................................. 58
9 Report from HORIBA GmbH (24 pages) ................................................................................. 59
This report cannot be reproduced without prior permission of the institute Page 3 of 59
1 General presentation of ISSeP
The Public Service Scientific Institute (Institut Scientifique de Service Public, ISSeP) is subject to
the authority of the Walloon government, which holds the management powers therefor. Its
operational ministry is the Ministry of the Environment.
The ISSeP exercises its scientific and technical activities in the environmental sector; it is also
recognised as a reference laboratory in Wallonia.
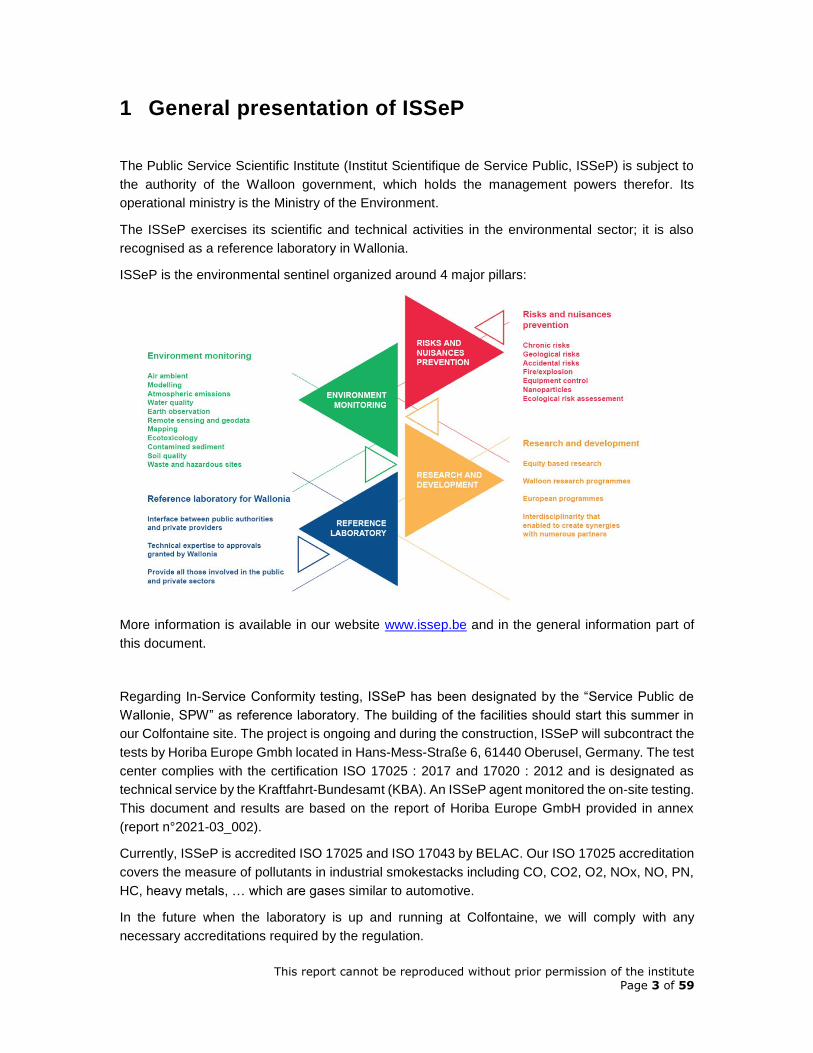
ISSeP is the environmental sentinel organized around 4 major pillars:
More information is available in our website www.issep.be and in the general information part of
this document.
Regarding In-Service Conformity testing, ISSeP has been designated by the “Service Public de
Wallonie, SPW” as reference laboratory. The building of the facilities should start this summer in
our Colfontaine site. The project is ongoing and during the construction, ISSeP will subcontract the
tests by Horiba Europe Gmbh located in Hans-Mess-Straße 6, 61440 Oberusel, Germany. The test
center complies with the certification ISO 17025 : 2017 and 17020 : 2012 and is designated as
technical service by the Kraftfahrt-Bundesamt (KBA). An ISSeP agent monitored the on-site testing.
This document and results are based on the report of Horiba Europe GmbH provided in annex
(report n°2021-03_002).
Currently, ISSeP is accredited ISO 17025 and ISO 17043 by BELAC. Our ISO 17025 accreditation
covers the measure of pollutants in industrial smokestacks including CO, CO2, O2, NOx, NO, PN,
HC, heavy metals, … which are gases similar to automotive.
In the future when the laboratory is up and running at Colfontaine, we will comply with any
necessary accreditations required by the regulation.
This report cannot be reproduced without prior permission of the institute Page 4 of 59
2 About HORIBA Technical Service
The HORIBA Europe GmbH Testcenter in 61440 Oberursel is designated as technical service
category A, B and D by the Kraftfahrt-Bundesamt (KBA) and complies with EN ISO/IEC 17025:2017
and EN ISO/IEC 17020:2012. The designation is valid from 19th December 2015.
Registration number: KBA-P 00071-15
The catalogue of designated and recognized testing methods contains emission measurement
complying to Regulation (EC) 715/2007, Regulation (EC) 2018/1832 including Regulation (EC)
692/2008, UN-R 83 Series 07 (Spark-ignition engine), UN-R 101 Series 01, UN-R 83 Series 07
(Compression-ignition engine) and fuel consumption measurement complying to UN-R 84.
3 Quick overview and main conclusions of the testing campaign
During the measurement campaign 6 vehicles from the manufacturer TOYOTA (3 Corolla Gasoline
and 3 Yaris Gasoline) has been tested within the scope of In-Service Conformity. Detailed
descriptions of the vehicles are summarized in Table 1 List of vehicles.
During the test period all vehicles performed a valid Type 1 (WLTP) as well as a valid Type 1A
(RDE) test according to ISC regulations.
The tested vehicles have fulfilled all requirements to an In-Service Conformity test and the final
emission results were below the Not-to-exceed limits given by ISC regulation.
Detailed description of the scope of testing as well as a summarization of the final results can be
found on the following pages.
This report and results only concern the 6 vehicles tested under specific conditions.
At the time of the testing, covid -19 measures were valid.
This report cannot be reproduced without prior permission of the institute Page 5 of 59
4 ISC testing
4.1 Vehicle sample
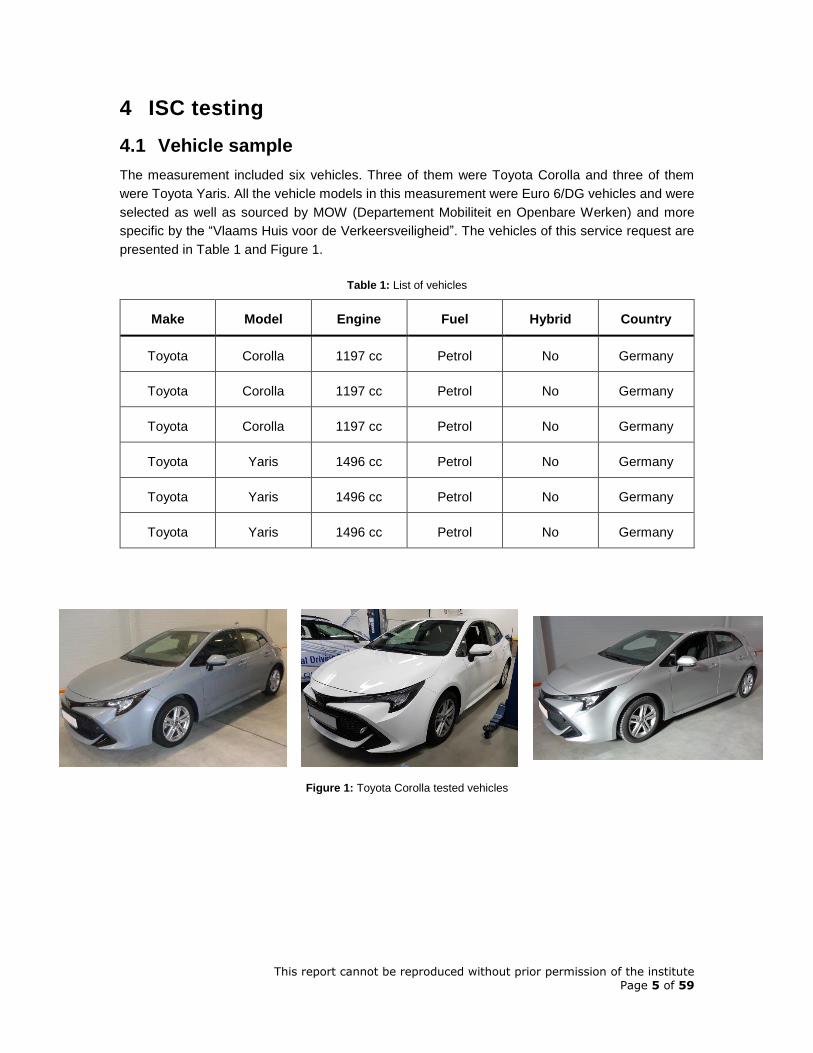
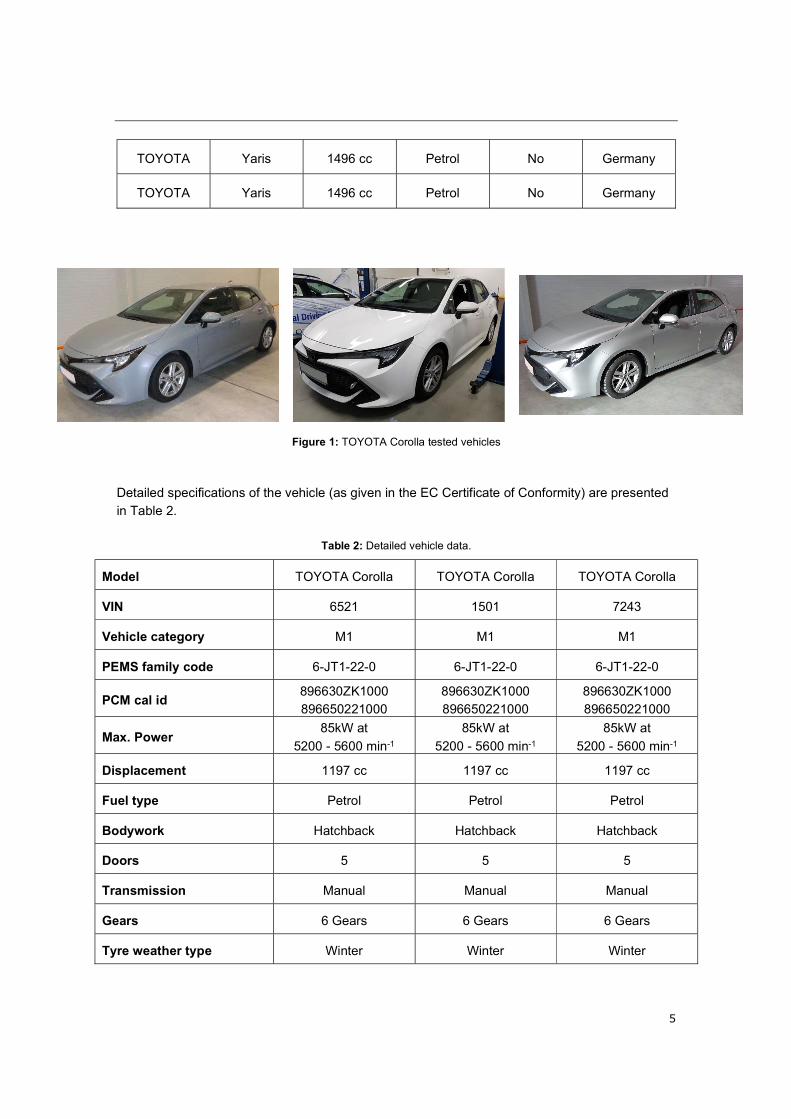
The measurement included six vehicles. Three of them were Toyota Corolla and three of them
were Toyota Yaris. All the vehicle models in this measurement were Euro 6/DG vehicles and were
selected as well as sourced by MOW (Departement Mobiliteit en Openbare Werken) and more
specific by the “Vlaams Huis voor de Verkeersveiligheid”. The vehicles of this service request are
presented in Table 1 and Figure 1.
Table 1: List of vehicles
Make Model Engine Fuel Hybrid Country
Toyota Corolla 1197 cc Petrol No Germany
Toyota Corolla 1197 cc Petrol No Germany
Toyota Corolla 1197 cc Petrol No Germany
Toyota Yaris 1496 cc Petrol No Germany
Toyota Yaris 1496 cc Petrol No Germany
Toyota Yaris 1496 cc Petrol No Germany
Figure 1: Toyota Corolla tested vehicles
This report cannot be reproduced without prior permission of the institute Page 6 of 59
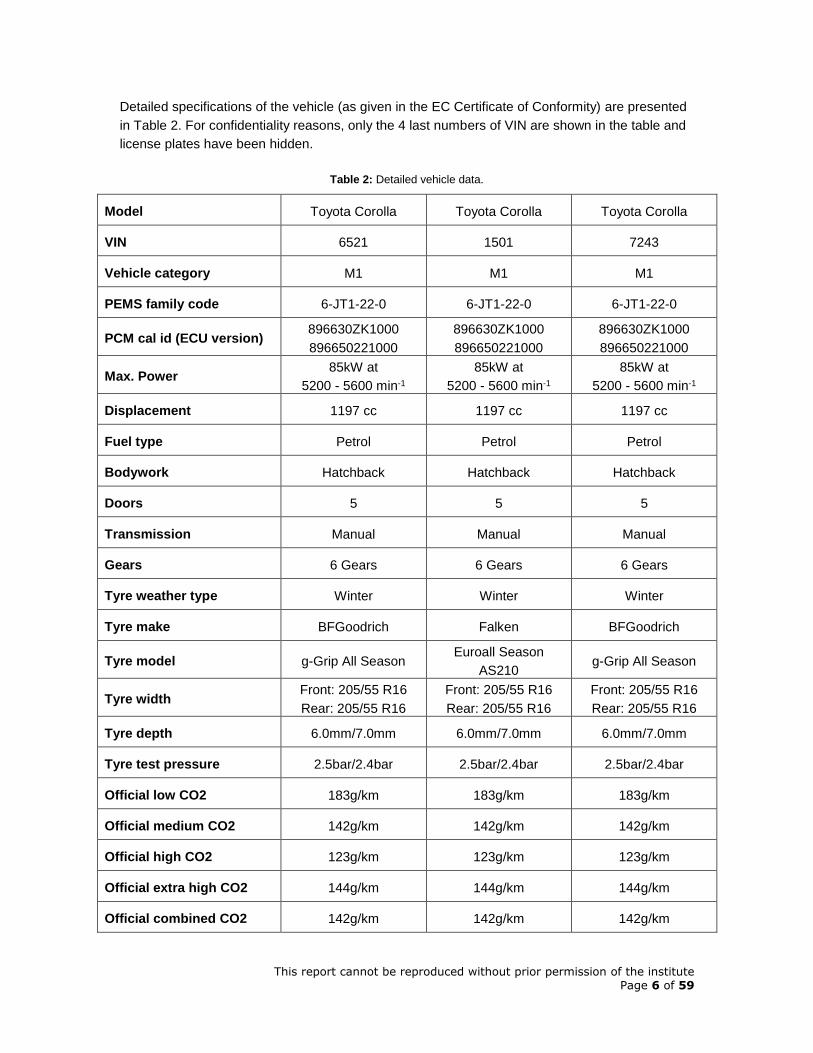
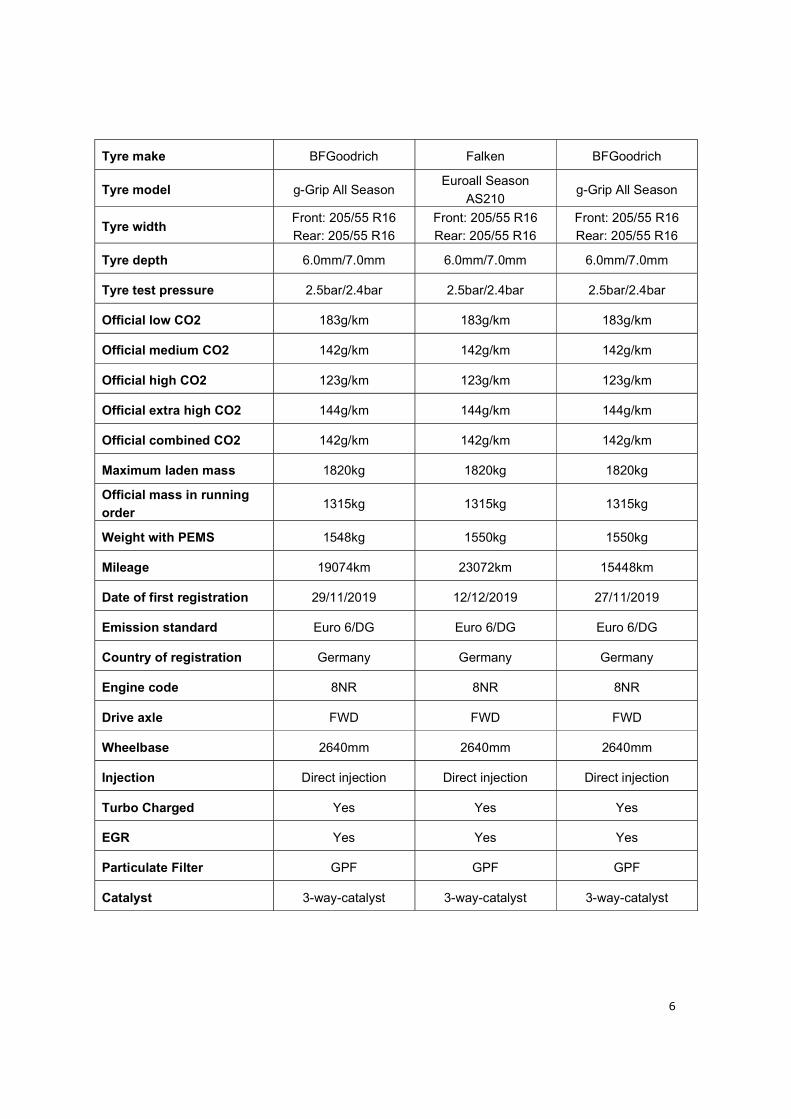
Detailed specifications of the vehicle (as given in the EC Certificate of Conformity) are presented
in Table 2. For confidentiality reasons, only the 4 last numbers of VIN are shown in the table and
license plates have been hidden.
Table 2: Detailed vehicle data.
Model Toyota Corolla Toyota Corolla Toyota Corolla
VIN 6521 1501 7243
Vehicle category M1 M1 M1
PEMS family code 6-JT1-22-0 6-JT1-22-0 6-JT1-22-0
PCM cal id (ECU version) 896630ZK1000
896650221000
896630ZK1000
896650221000
896630ZK1000
896650221000
Max. Power 85kW at
5200 - 5600 min-1
85kW at
5200 - 5600 min-1
85kW at
5200 - 5600 min-1
Displacement 1197 cc 1197 cc 1197 cc
Fuel type Petrol Petrol Petrol
Bodywork Hatchback Hatchback Hatchback
Doors 5 5 5
Transmission Manual Manual Manual
Gears 6 Gears 6 Gears 6 Gears
Tyre weather type Winter Winter Winter
Tyre make BFGoodrich Falken BFGoodrich
Tyre model g-Grip All Season Euroall Season
AS210 g-Grip All Season
Tyre width Front: 205/55 R16
Rear: 205/55 R16
Front: 205/55 R16
Rear: 205/55 R16
Front: 205/55 R16
Rear: 205/55 R16
Tyre depth 6.0mm/7.0mm 6.0mm/7.0mm 6.0mm/7.0mm
Tyre test pressure 2.5bar/2.4bar 2.5bar/2.4bar 2.5bar/2.4bar
Official low CO2 183g/km 183g/km 183g/km
Official medium CO2 142g/km 142g/km 142g/km
Official high CO2 123g/km 123g/km 123g/km
Official extra high CO2 144g/km 144g/km 144g/km
Official combined CO2 142g/km 142g/km 142g/km
This report cannot be reproduced without prior permission of the institute Page 7 of 59
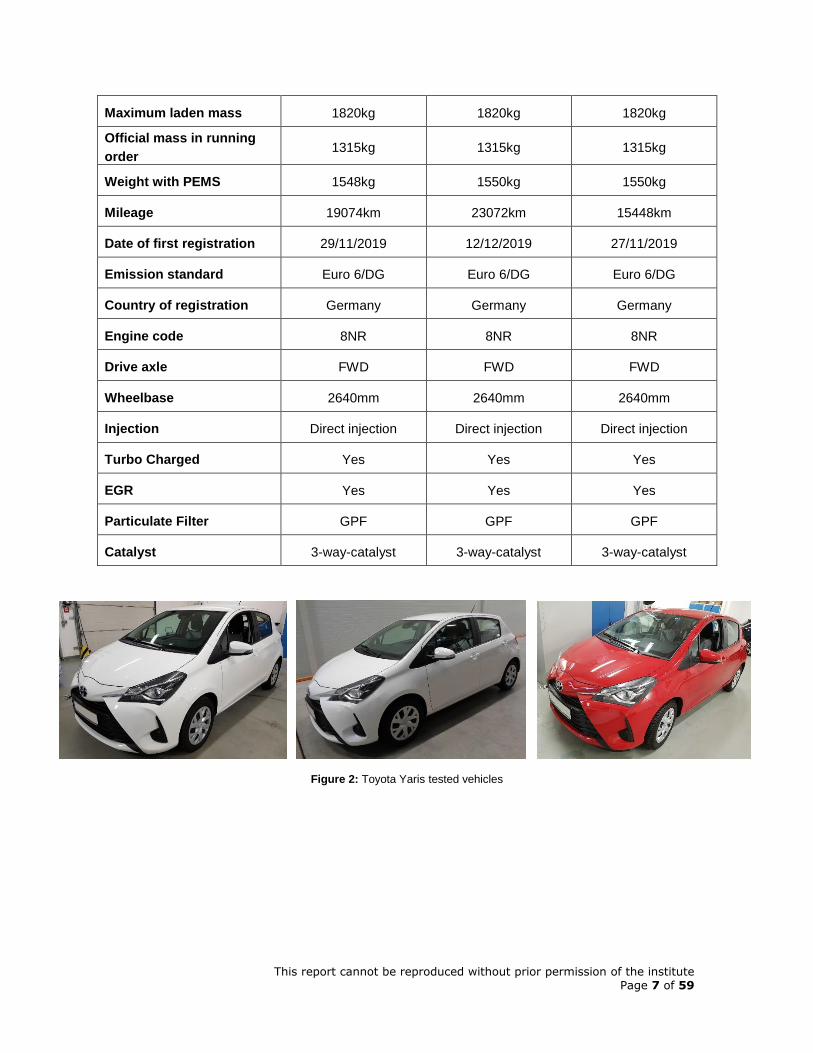
Maximum laden mass 1820kg 1820kg 1820kg
Official mass in running
order 1315kg 1315kg 1315kg
Weight with PEMS 1548kg 1550kg 1550kg
Mileage 19074km 23072km 15448km
Date of first registration 29/11/2019 12/12/2019 27/11/2019
Emission standard Euro 6/DG Euro 6/DG Euro 6/DG
Country of registration Germany Germany Germany
Engine code 8NR 8NR 8NR
Drive axle FWD FWD FWD
Wheelbase 2640mm 2640mm 2640mm
Injection Direct injection Direct injection Direct injection
Turbo Charged Yes Yes Yes
EGR Yes Yes Yes
Particulate Filter GPF GPF GPF
Catalyst 3-way-catalyst 3-way-catalyst 3-way-catalyst
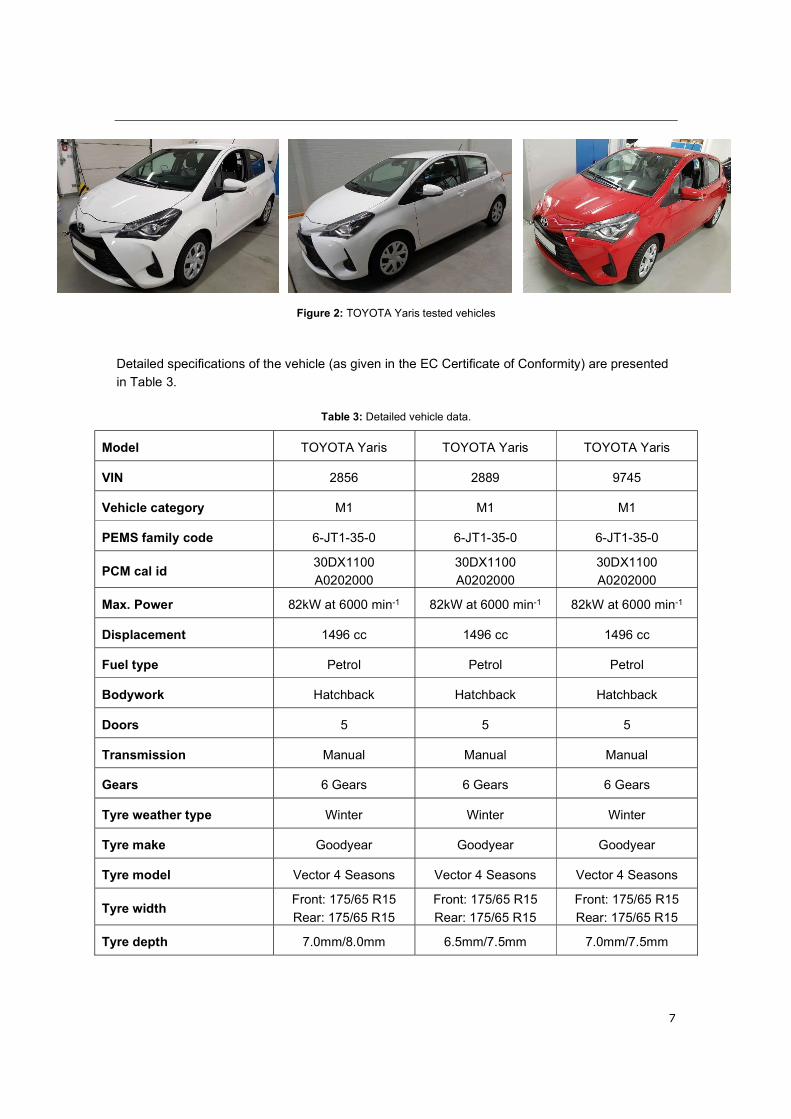
Figure 2: Toyota Yaris tested vehicles
This report cannot be reproduced without prior permission of the institute Page 8 of 59
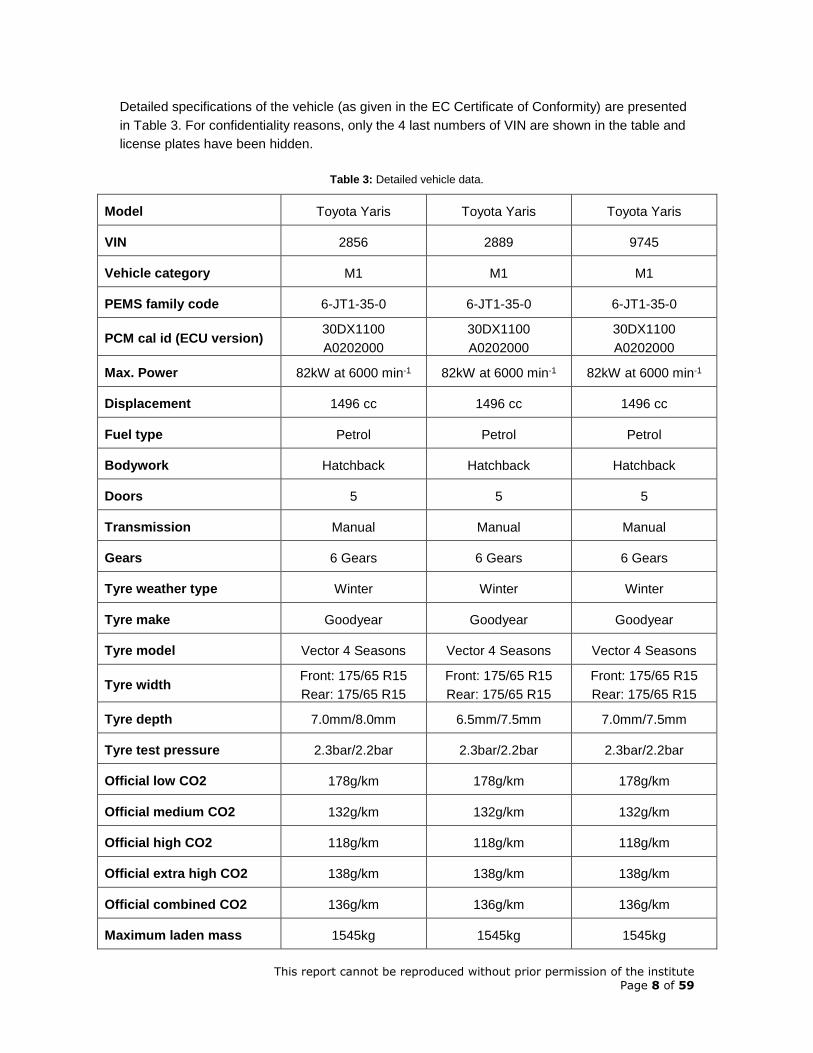
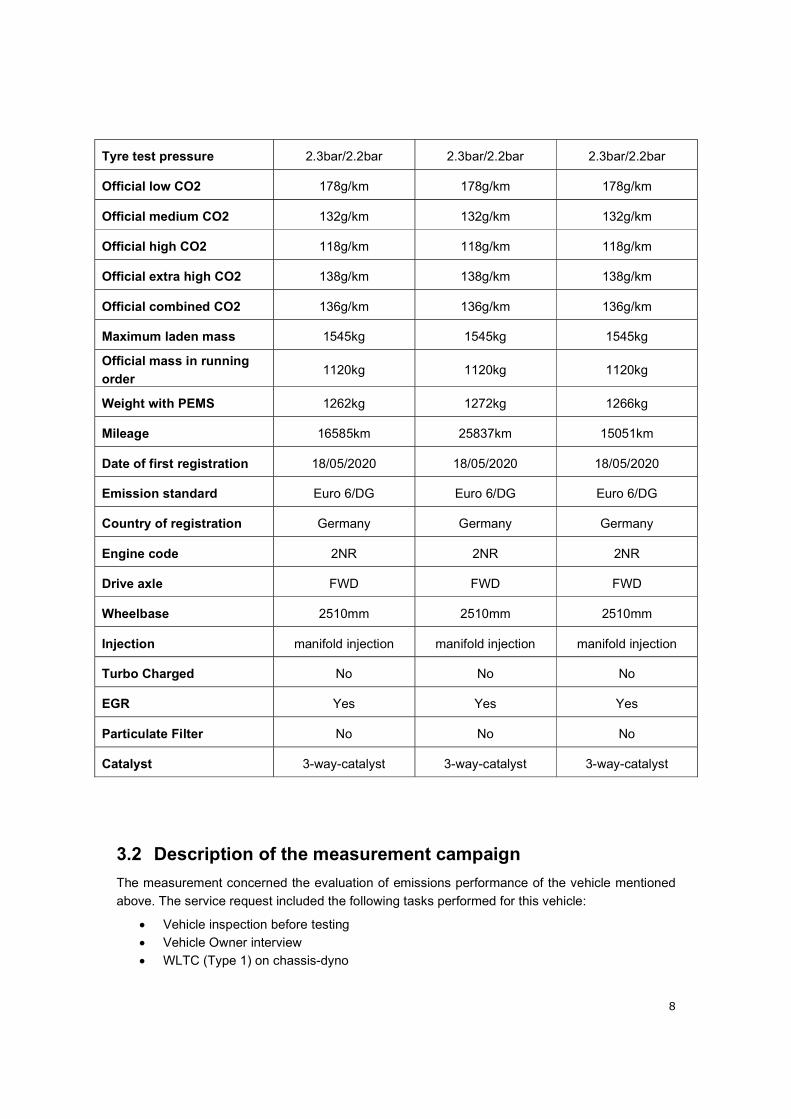
Detailed specifications of the vehicle (as given in the EC Certificate of Conformity) are presented
in Table 3. For confidentiality reasons, only the 4 last numbers of VIN are shown in the table and
license plates have been hidden.
Table 3: Detailed vehicle data.
Model Toyota Yaris Toyota Yaris Toyota Yaris
VIN 2856 2889 9745
Vehicle category M1 M1 M1
PEMS family code 6-JT1-35-0 6-JT1-35-0 6-JT1-35-0
PCM cal id (ECU version) 30DX1100
A0202000
30DX1100
A0202000
30DX1100
A0202000
Max. Power 82kW at 6000 min-1 82kW at 6000 min-1 82kW at 6000 min-1
Displacement 1496 cc 1496 cc 1496 cc
Fuel type Petrol Petrol Petrol
Bodywork Hatchback Hatchback Hatchback
Doors 5 5 5
Transmission Manual Manual Manual
Gears 6 Gears 6 Gears 6 Gears
Tyre weather type Winter Winter Winter
Tyre make Goodyear Goodyear Goodyear
Tyre model Vector 4 Seasons Vector 4 Seasons Vector 4 Seasons
Tyre width Front: 175/65 R15
Rear: 175/65 R15
Front: 175/65 R15
Rear: 175/65 R15
Front: 175/65 R15
Rear: 175/65 R15
Tyre depth 7.0mm/8.0mm 6.5mm/7.5mm 7.0mm/7.5mm
Tyre test pressure 2.3bar/2.2bar 2.3bar/2.2bar 2.3bar/2.2bar
Official low CO2 178g/km 178g/km 178g/km
Official medium CO2 132g/km 132g/km 132g/km
Official high CO2 118g/km 118g/km 118g/km
Official extra high CO2 138g/km 138g/km 138g/km
Official combined CO2 136g/km 136g/km 136g/km
Maximum laden mass 1545kg 1545kg 1545kg
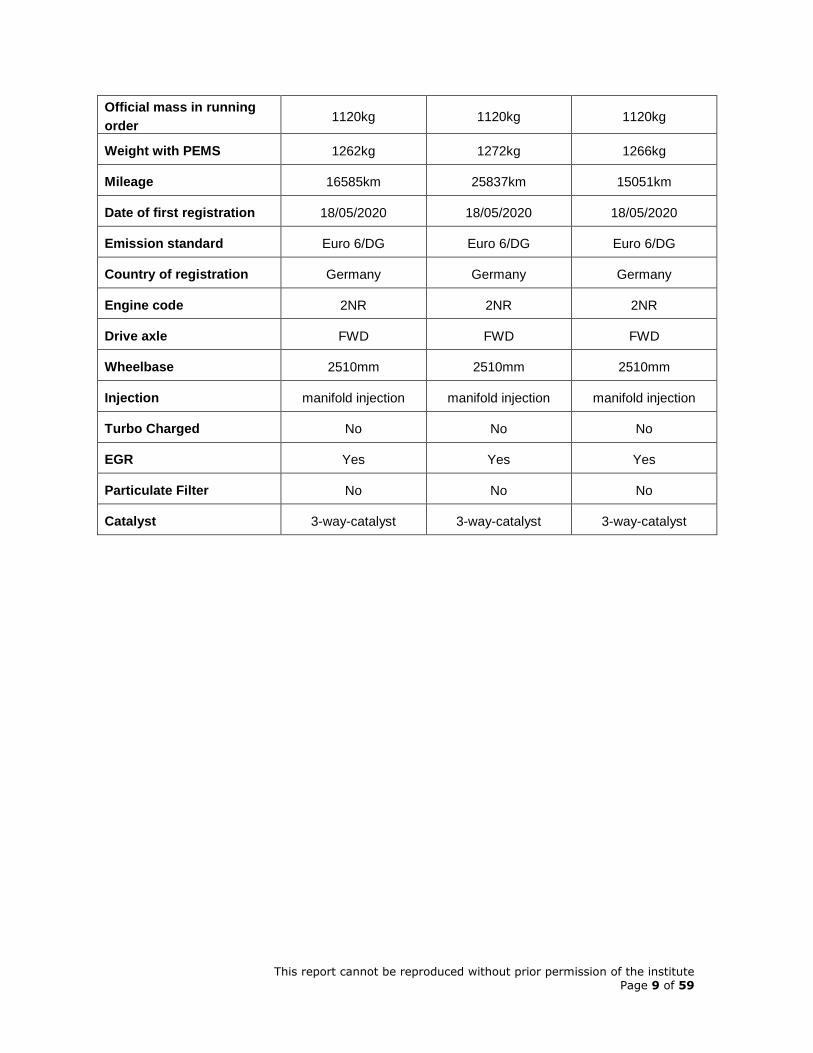
This report cannot be reproduced without prior permission of the institute Page 9 of 59
Official mass in running
order 1120kg 1120kg 1120kg
Weight with PEMS 1262kg 1272kg 1266kg
Mileage 16585km 25837km 15051km
Date of first registration 18/05/2020 18/05/2020 18/05/2020
Emission standard Euro 6/DG Euro 6/DG Euro 6/DG
Country of registration Germany Germany Germany
Engine code 2NR 2NR 2NR
Drive axle FWD FWD FWD
Wheelbase 2510mm 2510mm 2510mm
Injection manifold injection manifold injection manifold injection
Turbo Charged No No No
EGR Yes Yes Yes
Particulate Filter No No No
Catalyst 3-way-catalyst 3-way-catalyst 3-way-catalyst
This report cannot be reproduced without prior permission of the institute Page 10 of 59
4.2 Description of the measurement campaign
The measurement concerned the evaluation of emissions performance of the vehicle mentioned in
this report. The service request included the following tasks performed for each vehicle:
Vehicle Owner interview
Vehicle inspection before testing
WLTC (Type 1) on chassis-dyno
PEMS installation in the vehicle
PEMS validation
RDE testing (Type 1A)
4.2.1 Vehicle owner interview
The physical owner of each vehicle was previously interviewed by the type approval authority
(MOW) in order to understand the past usage of the vehicle under testing. The questions are taken
from RDE Regulation 2018/1832.
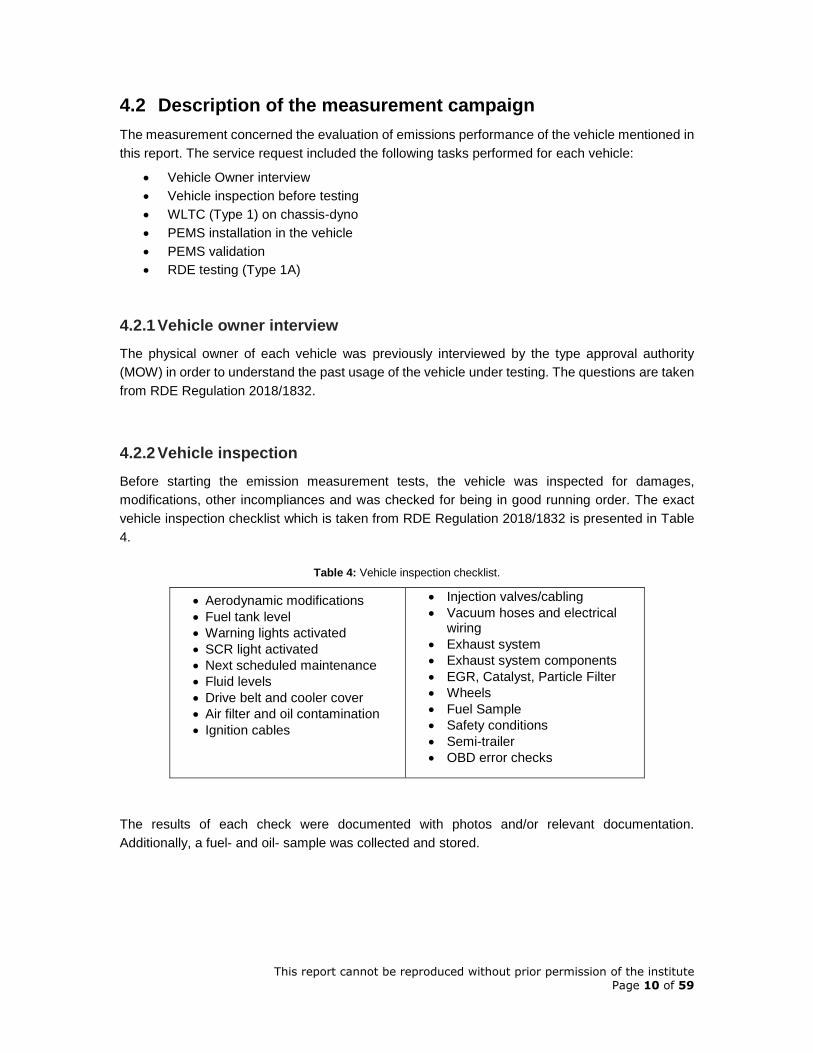
4.2.2 Vehicle inspection
Before starting the emission measurement tests, the vehicle was inspected for damages,
modifications, other incompliances and was checked for being in good running order. The exact
vehicle inspection checklist which is taken from RDE Regulation 2018/1832 is presented in Table
4.
Table 4: Vehicle inspection checklist.
Aerodynamic modifications
Fuel tank level
Warning lights activated
SCR light activated
Next scheduled maintenance
Fluid levels
Drive belt and cooler cover
Air filter and oil contamination
Ignition cables
Injection valves/cabling
Vacuum hoses and electrical wiring
Exhaust system
Exhaust system components
EGR, Catalyst, Particle Filter
Wheels
Fuel Sample
Safety conditions
Semi-trailer
OBD error checks
The results of each check were documented with photos and/or relevant documentation.
Additionally, a fuel- and oil- sample was collected and stored.
This report cannot be reproduced without prior permission of the institute Page 11 of 59
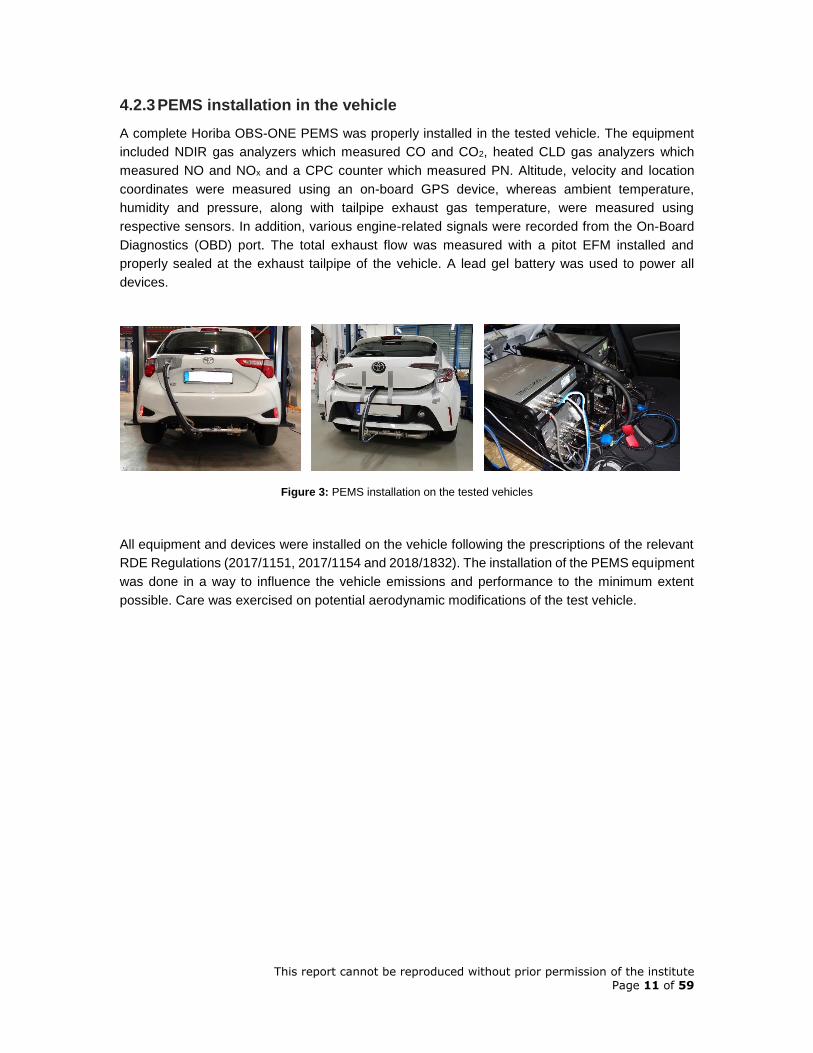
4.2.3 PEMS installation in the vehicle
A complete Horiba OBS-ONE PEMS was properly installed in the tested vehicle. The equipment
included NDIR gas analyzers which measured CO and CO2, heated CLD gas analyzers which
measured NO and NOx and a CPC counter which measured PN. Altitude, velocity and location
coordinates were measured using an on-board GPS device, whereas ambient temperature,
humidity and pressure, along with tailpipe exhaust gas temperature, were measured using
respective sensors. In addition, various engine-related signals were recorded from the On-Board
Diagnostics (OBD) port. The total exhaust flow was measured with a pitot EFM installed and
properly sealed at the exhaust tailpipe of the vehicle. A lead gel battery was used to power all
devices.
Figure 3: PEMS installation on the tested vehicles
All equipment and devices were installed on the vehicle following the prescriptions of the relevant
RDE Regulations (2017/1151, 2017/1154 and 2018/1832). The installation of the PEMS equipment
was done in a way to influence the vehicle emissions and performance to the minimum extent
possible. Care was exercised on potential aerodynamic modifications of the test vehicle.
This report cannot be reproduced without prior permission of the institute Page 12 of 59
4.2.4 Testing schedule
The vehicles were fueled with reference fuel and the tire pressure was adjusted for the road load
adjustment and the preconditioning for the WLTC emission test on chassis-dyno. After a soaking
time of at least 6 hours the WLTC emission test was performed.
Subsequently the vehicles were fueled with market fuel for the RDE emission testing, and they
were weighted on a weight bridge after the PEMS installation. Then an initial test was conducted
with each vehicle while casually driving it for about half an hour. After that initial test, a quick check
was conducted to ensure that the PEMS installation is safe and rigid, and that the PEMS is
functioning without any errors/warnings.
Then, the cold start RDE test was conducted on the RDE Oberursel route following the
prescriptions of the RDE regulation. Firstly, the vehicles were parked on a safe location to soak for
a duration between 8-15 hours. After the soaking duration, the PEMS devices were started and
warmed up for at least one hour. Then the gas analyzer system was checked for leaks with a
vacuum leak check. After this, the gas analyzers of the PEMS were calibrated with zero and span
bottled gases and the PN counter was checked for zero response. After the calibration sequence
finished, the cold start RDE test started. After finishing the test, the vehicles were returned to the
park location and a zero and span check and also a PN zero response check was done. In case
one of the tests conducted is considered invalid, according to the RDE regulation, the whole testing
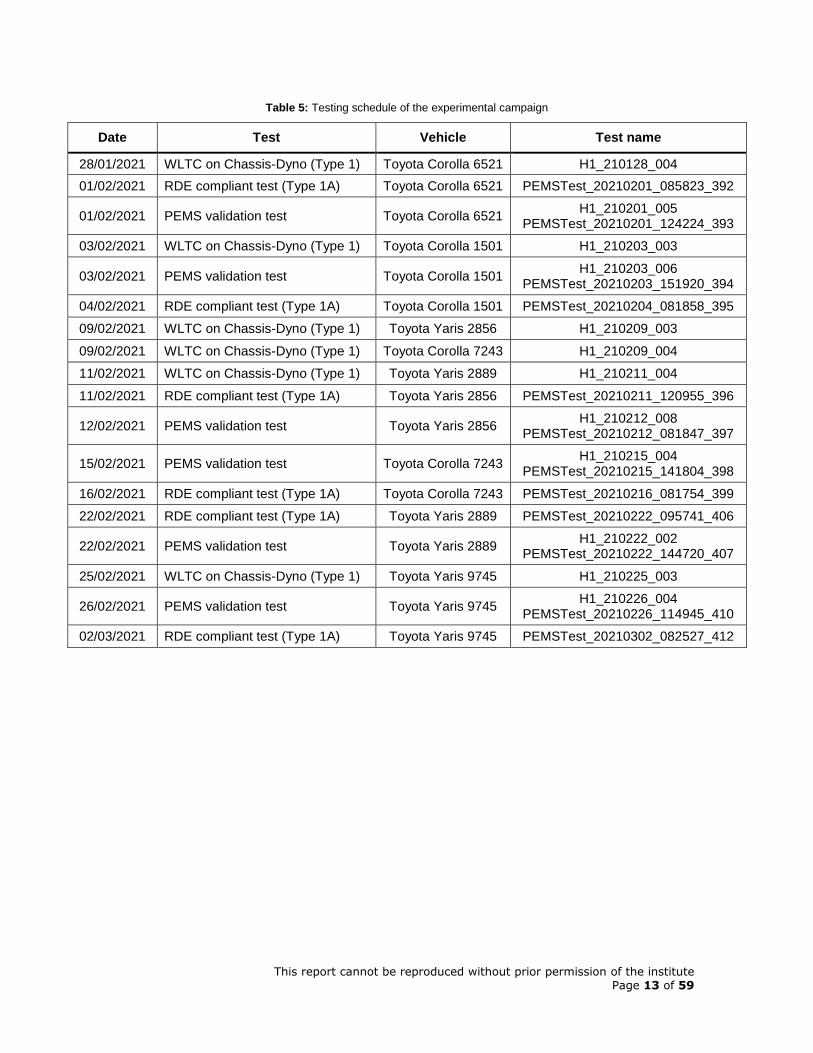
sequence is repeated. The actual testing schedule of the measurement campaign, including the
valid test and its test name is presented in Table 5.
After checking the results for validity, the PEMS was disassembled out of the vehicles.
This report cannot be reproduced without prior permission of the institute Page 13 of 59
Table 5: Testing schedule of the experimental campaign
Date Test Vehicle Test name
28/01/2021 WLTC on Chassis-Dyno (Type 1) Toyota Corolla 6521 H1_210128_004
01/02/2021 RDE compliant test (Type 1A) Toyota Corolla 6521 PEMSTest_20210201_085823_392
01/02/2021 PEMS validation test Toyota Corolla 6521 H1_210201_005
PEMSTest_20210201_124224_393
03/02/2021 WLTC on Chassis-Dyno (Type 1) Toyota Corolla 1501 H1_210203_003
03/02/2021 PEMS validation test Toyota Corolla 1501 H1_210203_006
PEMSTest_20210203_151920_394
04/02/2021 RDE compliant test (Type 1A) Toyota Corolla 1501 PEMSTest_20210204_081858_395
09/02/2021 WLTC on Chassis-Dyno (Type 1) Toyota Yaris 2856 H1_210209_003
09/02/2021 WLTC on Chassis-Dyno (Type 1) Toyota Corolla 7243 H1_210209_004
11/02/2021 WLTC on Chassis-Dyno (Type 1) Toyota Yaris 2889 H1_210211_004
11/02/2021 RDE compliant test (Type 1A) Toyota Yaris 2856 PEMSTest_20210211_120955_396
12/02/2021 PEMS validation test Toyota Yaris 2856 H1_210212_008
PEMSTest_20210212_081847_397
15/02/2021 PEMS validation test Toyota Corolla 7243 H1_210215_004
PEMSTest_20210215_141804_398
16/02/2021 RDE compliant test (Type 1A) Toyota Corolla 7243 PEMSTest_20210216_081754_399
22/02/2021 RDE compliant test (Type 1A) Toyota Yaris 2889 PEMSTest_20210222_095741_406
22/02/2021 PEMS validation test Toyota Yaris 2889 H1_210222_002
PEMSTest_20210222_144720_407
25/02/2021 WLTC on Chassis-Dyno (Type 1) Toyota Yaris 9745 H1_210225_003
26/02/2021 PEMS validation test Toyota Yaris 9745 H1_210226_004
PEMSTest_20210226_114945_410
02/03/2021 RDE compliant test (Type 1A) Toyota Yaris 9745 PEMSTest_20210302_082527_412
This report cannot be reproduced without prior permission of the institute Page 14 of 59
5 Summary of Results
Following the inspections conducted on the measured vehicle, the vehicle was found in good
condition and with all its components undamaged and unmodified. Photos and relevant documents
of the inspection procedure as well as the results of the inspection have been delivered to the type
approval authority (MOW).
5.1 WLTC on Chassis-Dyno (Type 1)
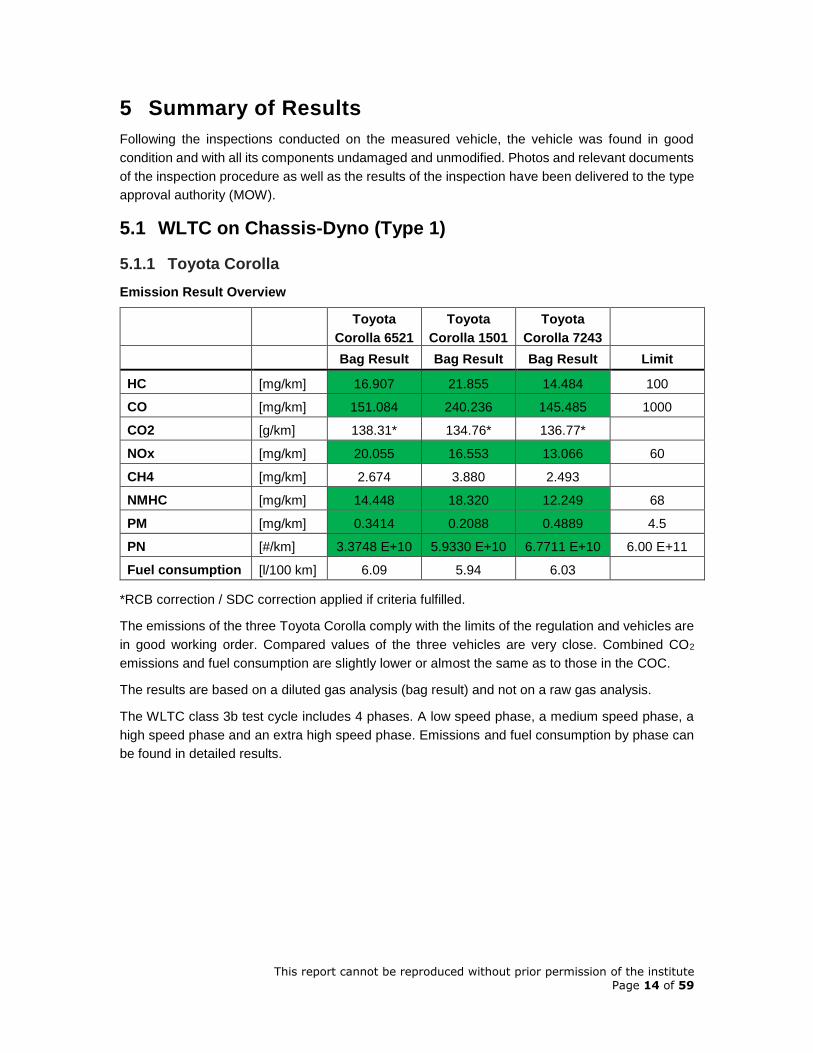
5.1.1 Toyota Corolla
Emission Result Overview
Toyota
Corolla 6521
Toyota
Corolla 1501
Toyota
Corolla 7243
Bag Result Bag Result Bag Result Limit
HC [mg/km] 16.907 21.855 14.484 100
CO [mg/km] 151.084 240.236 145.485 1000
CO2 [g/km] 138.31* 134.76* 136.77*
NOx [mg/km] 20.055 16.553 13.066 60
CH4 [mg/km] 2.674 3.880 2.493
NMHC [mg/km] 14.448 18.320 12.249 68
PM [mg/km] 0.3414 0.2088 0.4889 4.5
PN [#/km] 3.3748 E+10 5.9330 E+10 6.7711 E+10 6.00 E+11
Fuel consumption [l/100 km] 6.09 5.94 6.03
*RCB correction / SDC correction applied if criteria fulfilled.
The emissions of the three Toyota Corolla comply with the limits of the regulation and vehicles are
in good working order. Compared values of the three vehicles are very close. Combined CO2
emissions and fuel consumption are slightly lower or almost the same as to those in the COC.
The results are based on a diluted gas analysis (bag result) and not on a raw gas analysis.
The WLTC class 3b test cycle includes 4 phases. A low speed phase, a medium speed phase, a
high speed phase and an extra high speed phase. Emissions and fuel consumption by phase can
be found in detailed results.
This report cannot be reproduced without prior permission of the institute Page 15 of 59
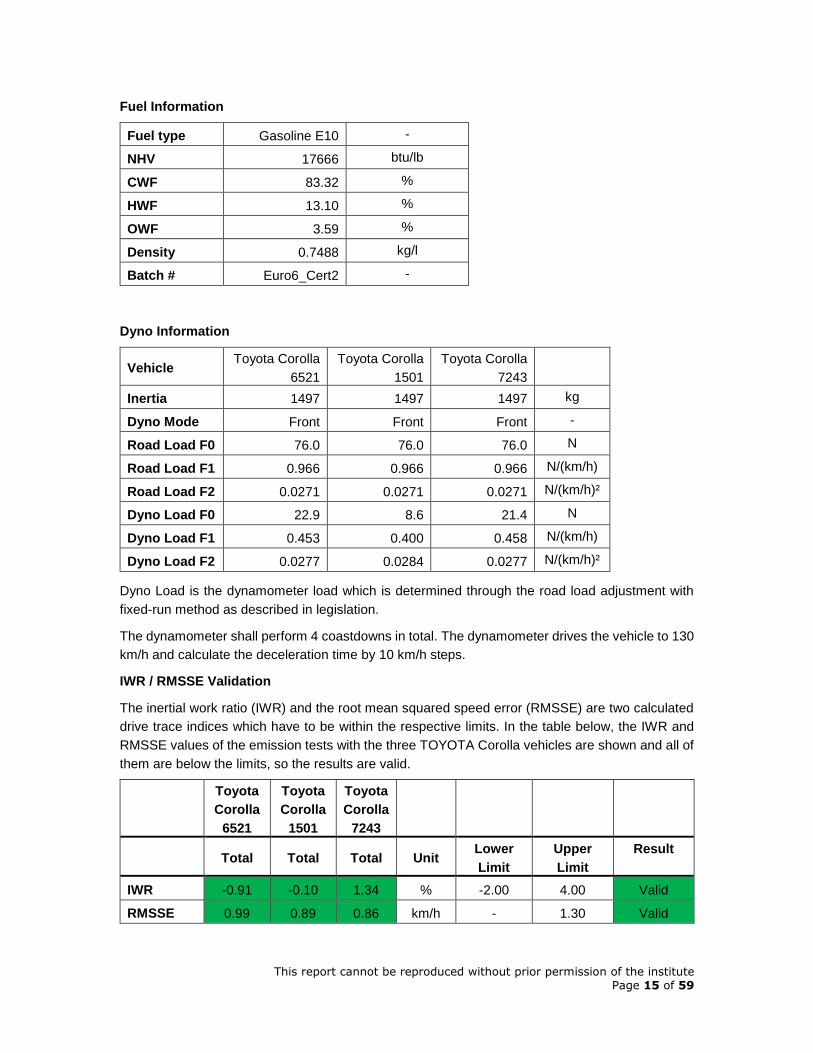
Fuel Information
Fuel type Gasoline E10 -
NHV 17666 btu/lb
CWF 83.32 %
HWF 13.10 %
OWF 3.59 %
Density 0.7488 kg/l
Batch # Euro6_Cert2 -
Dyno Information
Vehicle Toyota Corolla
6521
Toyota Corolla
1501
Toyota Corolla
7243
Inertia 1497 1497 1497 kg
Dyno Mode Front Front Front -
Road Load F0 76.0 76.0 76.0 N
Road Load F1 0.966 0.966 0.966 N/(km/h)
Road Load F2 0.0271 0.0271 0.0271 N/(km/h)²
Dyno Load F0 22.9 8.6 21.4 N
Dyno Load F1 0.453 0.400 0.458 N/(km/h)
Dyno Load F2 0.0277 0.0284 0.0277 N/(km/h)²
Dyno Load is the dynamometer load which is determined through the road load adjustment with
fixed-run method as described in legislation.
The dynamometer shall perform 4 coastdowns in total. The dynamometer drives the vehicle to 130
km/h and calculate the deceleration time by 10 km/h steps.
IWR / RMSSE Validation
The inertial work ratio (IWR) and the root mean squared speed error (RMSSE) are two calculated
drive trace indices which have to be within the respective limits. In the table below, the IWR and
RMSSE values of the emission tests with the three TOYOTA Corolla vehicles are shown and all of
them are below the limits, so the results are valid.
Toyota
Corolla
6521
Toyota
Corolla
1501
Toyota
Corolla
7243
Total Total Total Unit Lower
Limit
Upper
Limit
Result
IWR -0.91 -0.10 1.34 % -2.00 4.00 Valid
RMSSE 0.99 0.89 0.86 km/h - 1.30 Valid
This report cannot be reproduced without prior permission of the institute Page 16 of 59
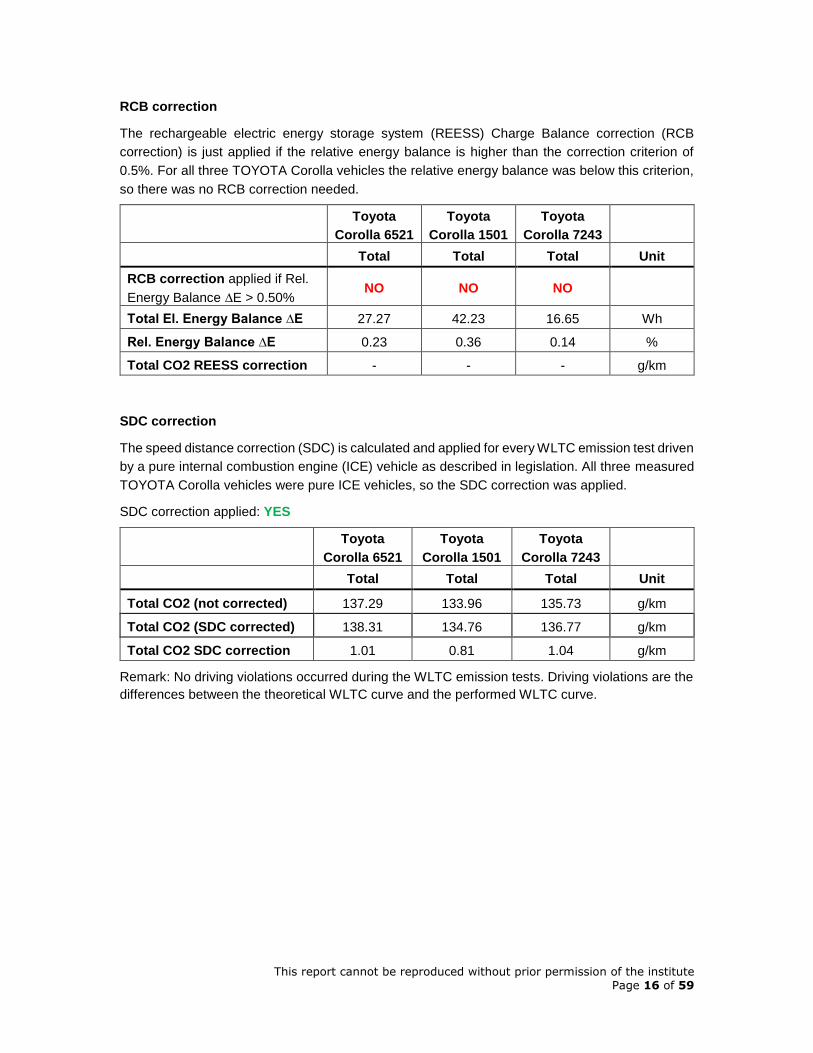
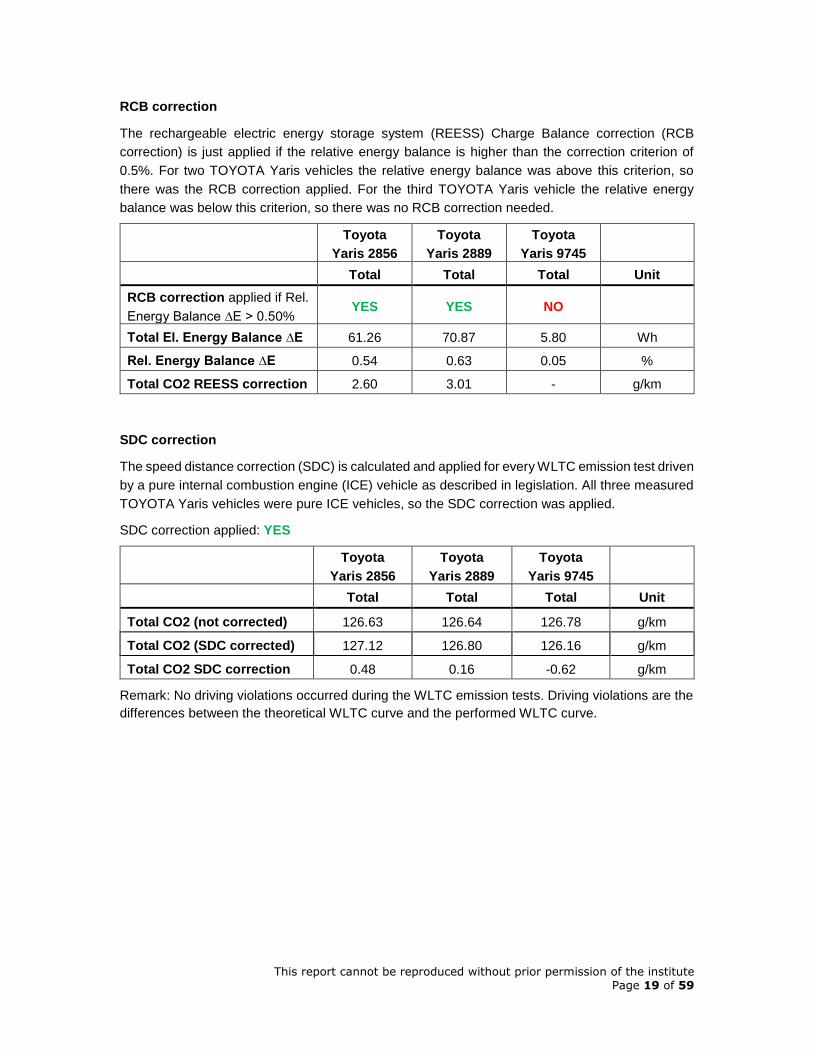
RCB correction
The rechargeable electric energy storage system (REESS) Charge Balance correction (RCB
correction) is just applied if the relative energy balance is higher than the correction criterion of
0.5%. For all three TOYOTA Corolla vehicles the relative energy balance was below this criterion,
so there was no RCB correction needed.
Toyota
Corolla 6521
Toyota
Corolla 1501
Toyota
Corolla 7243
Total Total Total Unit
RCB correction applied if Rel.
Energy Balance ∆E > 0.50% NO NO NO
Total El. Energy Balance ∆E 27.27 42.23 16.65 Wh
Rel. Energy Balance ∆E 0.23 0.36 0.14 %
Total CO2 REESS correction - - - g/km
SDC correction
The speed distance correction (SDC) is calculated and applied for every WLTC emission test driven
by a pure internal combustion engine (ICE) vehicle as described in legislation. All three measured
TOYOTA Corolla vehicles were pure ICE vehicles, so the SDC correction was applied.
SDC correction applied: YES
Toyota
Corolla 6521
Toyota
Corolla 1501
Toyota
Corolla 7243
Total Total Total Unit
Total CO2 (not corrected) 137.29 133.96 135.73 g/km
Total CO2 (SDC corrected) 138.31 134.76 136.77 g/km
Total CO2 SDC correction 1.01 0.81 1.04 g/km
Remark: No driving violations occurred during the WLTC emission tests. Driving violations are the
differences between the theoretical WLTC curve and the performed WLTC curve.
This report cannot be reproduced without prior permission of the institute Page 17 of 59
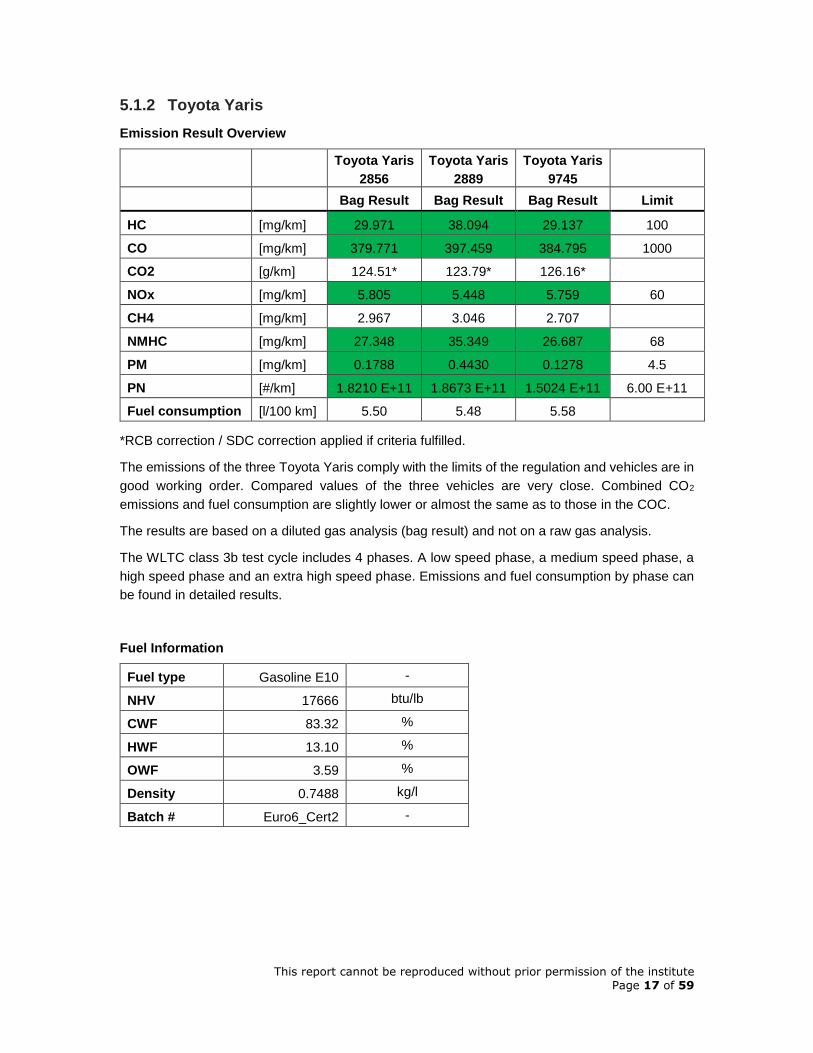
5.1.2 Toyota Yaris
Emission Result Overview
Toyota Yaris
2856
Toyota Yaris
2889
Toyota Yaris
9745
Bag Result Bag Result Bag Result Limit
HC [mg/km] 29.971 38.094 29.137 100
CO [mg/km] 379.771 397.459 384.795 1000
CO2 [g/km] 124.51* 123.79* 126.16*
NOx [mg/km] 5.805 5.448 5.759 60
CH4 [mg/km] 2.967 3.046 2.707
NMHC [mg/km] 27.348 35.349 26.687 68
PM [mg/km] 0.1788 0.4430 0.1278 4.5
PN [#/km] 1.8210 E+11 1.8673 E+11 1.5024 E+11 6.00 E+11
Fuel consumption [l/100 km] 5.50 5.48 5.58
*RCB correction / SDC correction applied if criteria fulfilled.
The emissions of the three Toyota Yaris comply with the limits of the regulation and vehicles are in
good working order. Compared values of the three vehicles are very close. Combined CO2
emissions and fuel consumption are slightly lower or almost the same as to those in the COC.
The results are based on a diluted gas analysis (bag result) and not on a raw gas analysis.
The WLTC class 3b test cycle includes 4 phases. A low speed phase, a medium speed phase, a
high speed phase and an extra high speed phase. Emissions and fuel consumption by phase can
be found in detailed results.
Fuel Information
Fuel type Gasoline E10 -
NHV 17666 btu/lb
CWF 83.32 %
HWF 13.10 %
OWF 3.59 %
Density 0.7488 kg/l
Batch # Euro6_Cert2 -
This report cannot be reproduced without prior permission of the institute Page 18 of 59
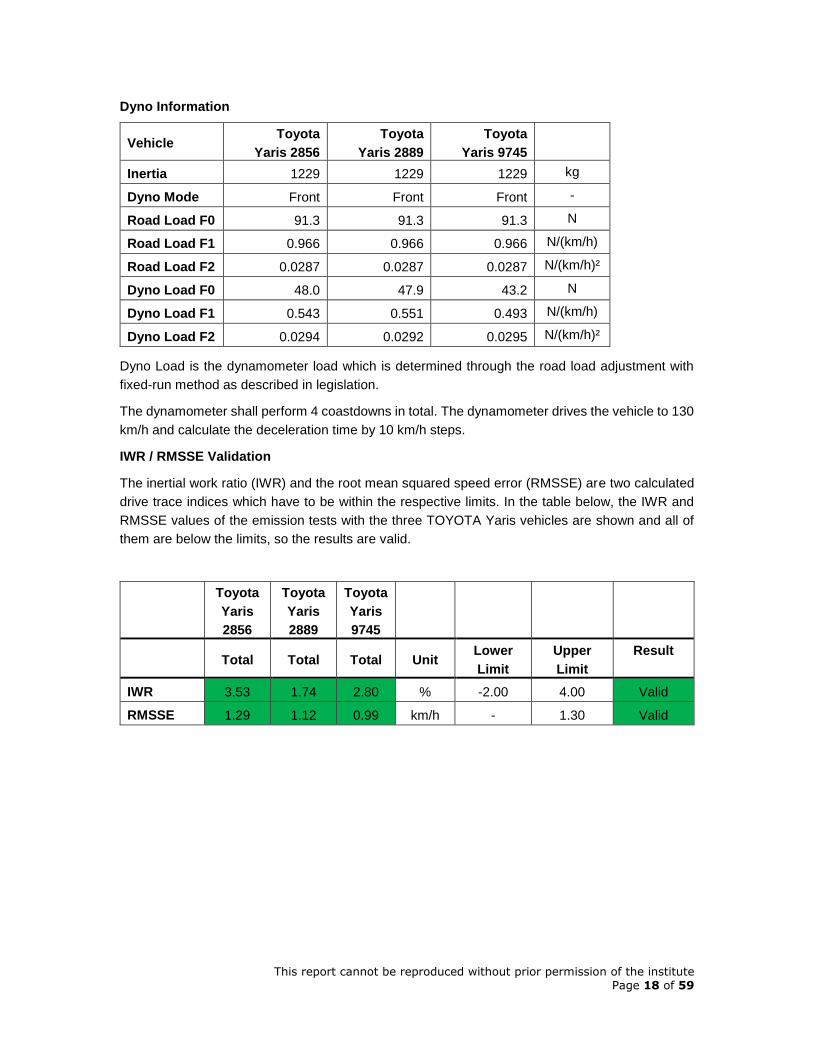
Dyno Information
Vehicle Toyota
Yaris 2856
Toyota
Yaris 2889
Toyota
Yaris 9745
Inertia 1229 1229 1229 kg
Dyno Mode Front Front Front -
Road Load F0 91.3 91.3 91.3 N
Road Load F1 0.966 0.966 0.966 N/(km/h)
Road Load F2 0.0287 0.0287 0.0287 N/(km/h)²
Dyno Load F0 48.0 47.9 43.2 N
Dyno Load F1 0.543 0.551 0.493 N/(km/h)
Dyno Load F2 0.0294 0.0292 0.0295 N/(km/h)²
Dyno Load is the dynamometer load which is determined through the road load adjustment with
fixed-run method as described in legislation.
The dynamometer shall perform 4 coastdowns in total. The dynamometer drives the vehicle to 130
km/h and calculate the deceleration time by 10 km/h steps.
IWR / RMSSE Validation
The inertial work ratio (IWR) and the root mean squared speed error (RMSSE) are two calculated
drive trace indices which have to be within the respective limits. In the table below, the IWR and
RMSSE values of the emission tests with the three TOYOTA Yaris vehicles are shown and all of
them are below the limits, so the results are valid.
Toyota
Yaris
2856
Toyota
Yaris
2889
Toyota
Yaris
9745
Total Total Total Unit Lower
Limit
Upper
Limit
Result
IWR 3.53 1.74 2.80 % -2.00 4.00 Valid
RMSSE 1.29 1.12 0.99 km/h - 1.30 Valid
This report cannot be reproduced without prior permission of the institute Page 19 of 59
RCB correction
The rechargeable electric energy storage system (REESS) Charge Balance correction (RCB
correction) is just applied if the relative energy balance is higher than the correction criterion of
0.5%. For two TOYOTA Yaris vehicles the relative energy balance was above this criterion, so
there was the RCB correction applied. For the third TOYOTA Yaris vehicle the relative energy
balance was below this criterion, so there was no RCB correction needed.
Toyota
Yaris 2856
Toyota
Yaris 2889
Toyota
Yaris 9745
Total Total Total Unit
RCB correction applied if Rel.
Energy Balance ∆E > 0.50% YES YES NO
Total El. Energy Balance ∆E 61.26 70.87 5.80 Wh
Rel. Energy Balance ∆E 0.54 0.63 0.05 %
Total CO2 REESS correction 2.60 3.01 - g/km
SDC correction
The speed distance correction (SDC) is calculated and applied for every WLTC emission test driven
by a pure internal combustion engine (ICE) vehicle as described in legislation. All three measured
TOYOTA Yaris vehicles were pure ICE vehicles, so the SDC correction was applied.
SDC correction applied: YES
Toyota
Yaris 2856
Toyota
Yaris 2889
Toyota
Yaris 9745
Total Total Total Unit
Total CO2 (not corrected) 126.63 126.64 126.78 g/km
Total CO2 (SDC corrected) 127.12 126.80 126.16 g/km
Total CO2 SDC correction 0.48 0.16 -0.62 g/km
Remark: No driving violations occurred during the WLTC emission tests. Driving violations are the
differences between the theoretical WLTC curve and the performed WLTC curve.
This report cannot be reproduced without prior permission of the institute Page 20 of 59
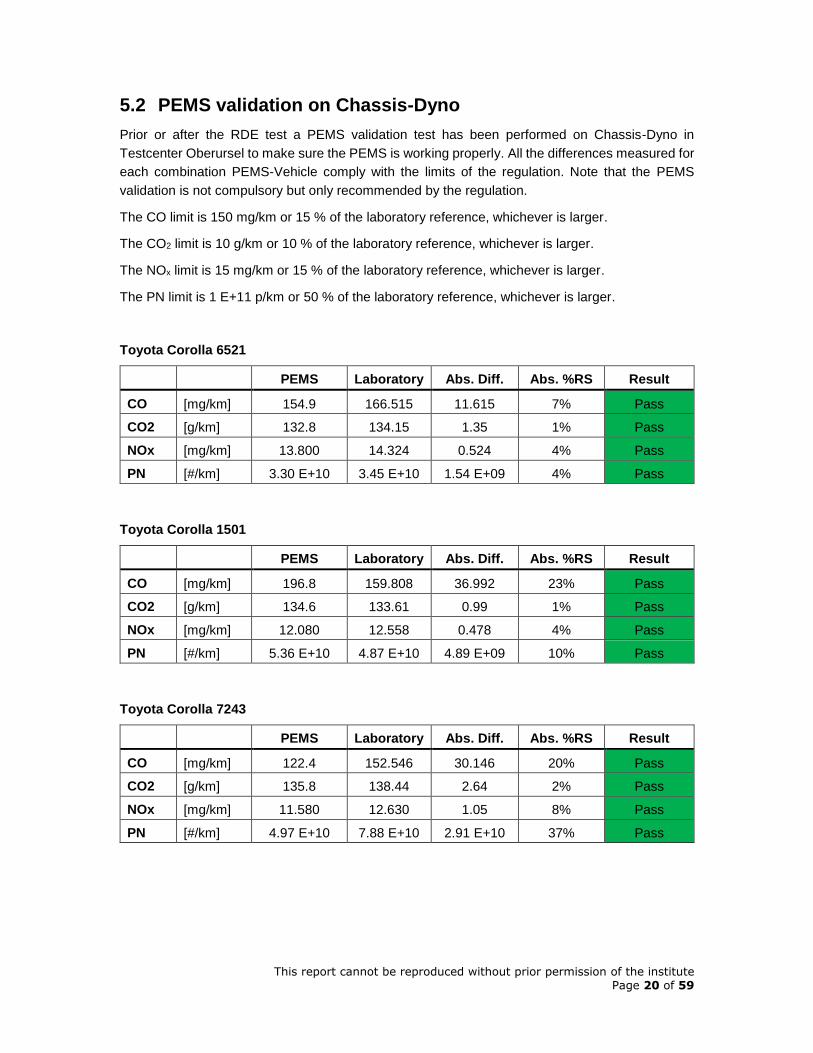
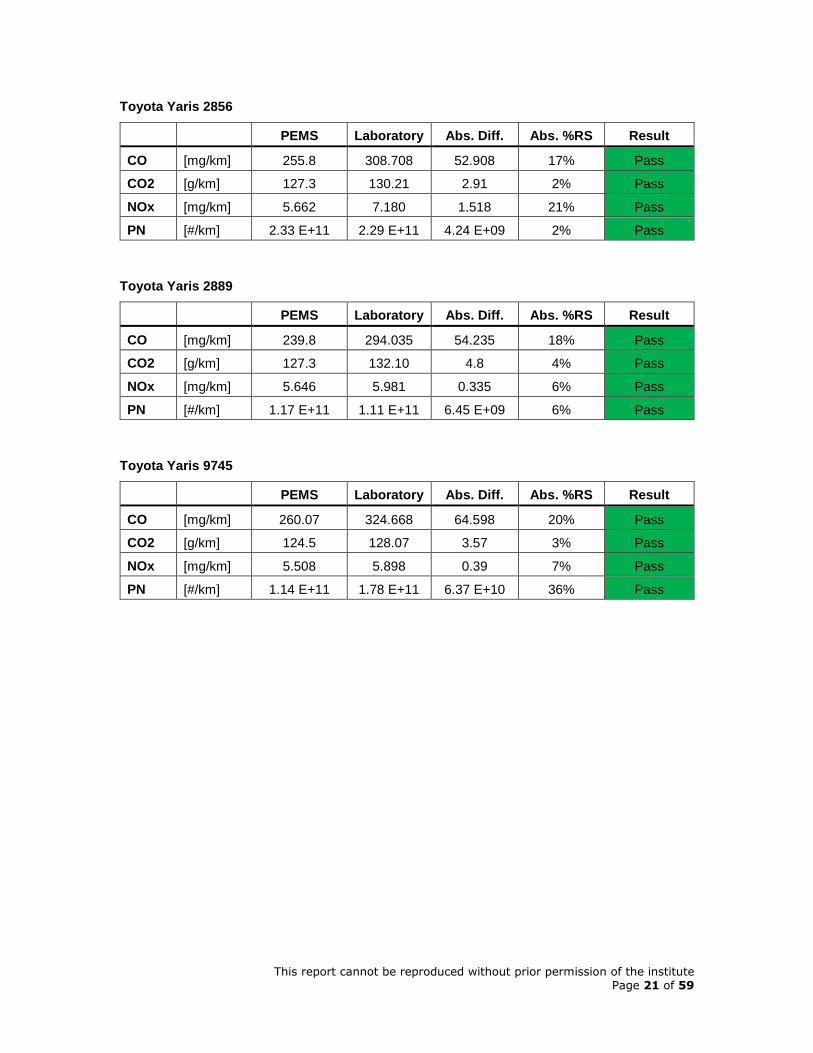
5.2 PEMS validation on Chassis-Dyno
Prior or after the RDE test a PEMS validation test has been performed on Chassis-Dyno in
Testcenter Oberursel to make sure the PEMS is working properly. All the differences measured for
each combination PEMS-Vehicle comply with the limits of the regulation. Note that the PEMS
validation is not compulsory but only recommended by the regulation.
The CO limit is 150 mg/km or 15 % of the laboratory reference, whichever is larger.
The CO2 limit is 10 g/km or 10 % of the laboratory reference, whichever is larger.
The NOx limit is 15 mg/km or 15 % of the laboratory reference, whichever is larger.
The PN limit is 1 E+11 p/km or 50 % of the laboratory reference, whichever is larger.
Toyota Corolla 6521
PEMS Laboratory Abs. Diff. Abs. %RS Result
CO [mg/km] 154.9 166.515 11.615 7% Pass
CO2 [g/km] 132.8 134.15 1.35 1% Pass
NOx [mg/km] 13.800 14.324 0.524 4% Pass
PN [#/km] 3.30 E+10 3.45 E+10 1.54 E+09 4% Pass
Toyota Corolla 1501
PEMS Laboratory Abs. Diff. Abs. %RS Result
CO [mg/km] 196.8 159.808 36.992 23% Pass
CO2 [g/km] 134.6 133.61 0.99 1% Pass
NOx [mg/km] 12.080 12.558 0.478 4% Pass
PN [#/km] 5.36 E+10 4.87 E+10 4.89 E+09 10% Pass
Toyota Corolla 7243
PEMS Laboratory Abs. Diff. Abs. %RS Result
CO [mg/km] 122.4 152.546 30.146 20% Pass
CO2 [g/km] 135.8 138.44 2.64 2% Pass
NOx [mg/km] 11.580 12.630 1.05 8% Pass
PN [#/km] 4.97 E+10 7.88 E+10 2.91 E+10 37% Pass
This report cannot be reproduced without prior permission of the institute Page 21 of 59
Toyota Yaris 2856
PEMS Laboratory Abs. Diff. Abs. %RS Result
CO [mg/km] 255.8 308.708 52.908 17% Pass
CO2 [g/km] 127.3 130.21 2.91 2% Pass
NOx [mg/km] 5.662 7.180 1.518 21% Pass
PN [#/km] 2.33 E+11 2.29 E+11 4.24 E+09 2% Pass
Toyota Yaris 2889
PEMS Laboratory Abs. Diff. Abs. %RS Result
CO [mg/km] 239.8 294.035 54.235 18% Pass
CO2 [g/km] 127.3 132.10 4.8 4% Pass
NOx [mg/km] 5.646 5.981 0.335 6% Pass
PN [#/km] 1.17 E+11 1.11 E+11 6.45 E+09 6% Pass
Toyota Yaris 9745
PEMS Laboratory Abs. Diff. Abs. %RS Result
CO [mg/km] 260.07 324.668 64.598 20% Pass
CO2 [g/km] 124.5 128.07 3.57 3% Pass
NOx [mg/km] 5.508 5.898 0.39 7% Pass
PN [#/km] 1.14 E+11 1.78 E+11 6.37 E+10 36% Pass
This report cannot be reproduced without prior permission of the institute Page 22 of 59
5.3 Real Driving Emissions (Type 1A)
The measured vehicle was tested in the RDE Oberursel route. The recorded data was processed
using an inhouse developed and validated software, in order to calculate the instantaneous
emissions mass flow, the aggregated emissions and the validity parameters as prescribed by the
EU regulation 2018/1832.
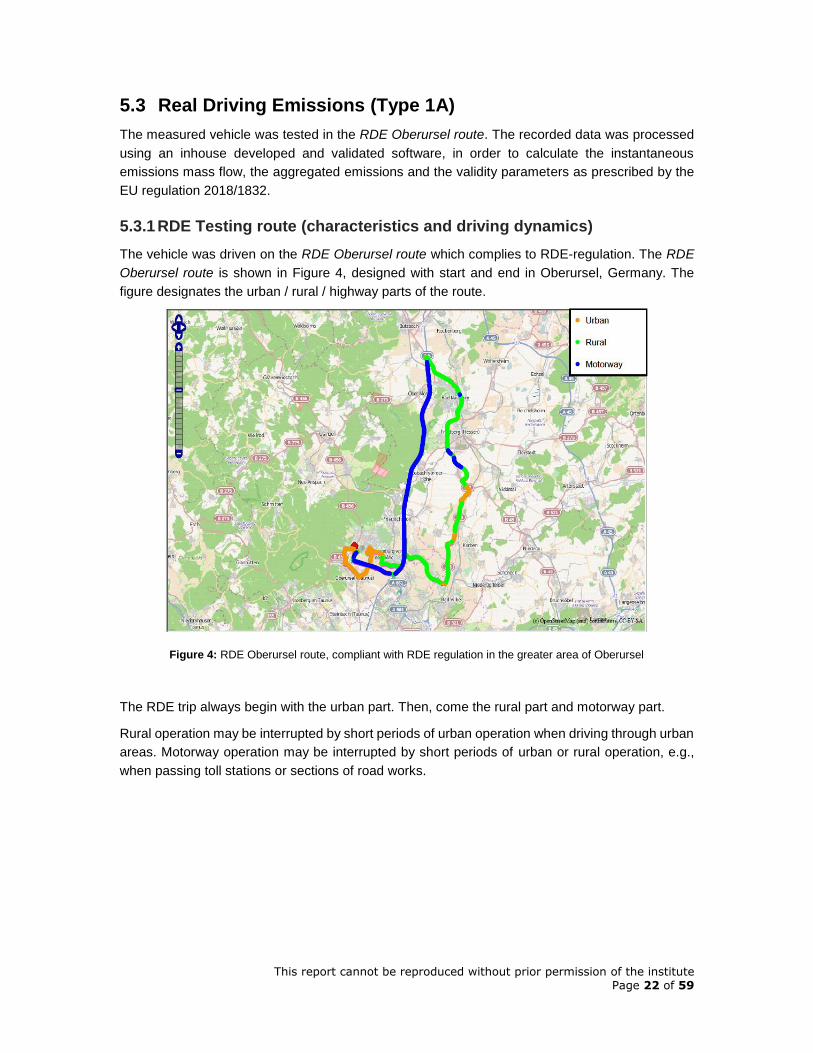
5.3.1 RDE Testing route (characteristics and driving dynamics)
The vehicle was driven on the RDE Oberursel route which complies to RDE-regulation. The RDE
Oberursel route is shown in Figure 4, designed with start and end in Oberursel, Germany. The
figure designates the urban / rural / highway parts of the route.
Figure 4: RDE Oberursel route, compliant with RDE regulation in the greater area of Oberursel
The RDE trip always begin with the urban part. Then, come the rural part and motorway part.
Rural operation may be interrupted by short periods of urban operation when driving through urban
areas. Motorway operation may be interrupted by short periods of urban or rural operation, e.g.,
when passing toll stations or sections of road works.
This report cannot be reproduced without prior permission of the institute Page 23 of 59
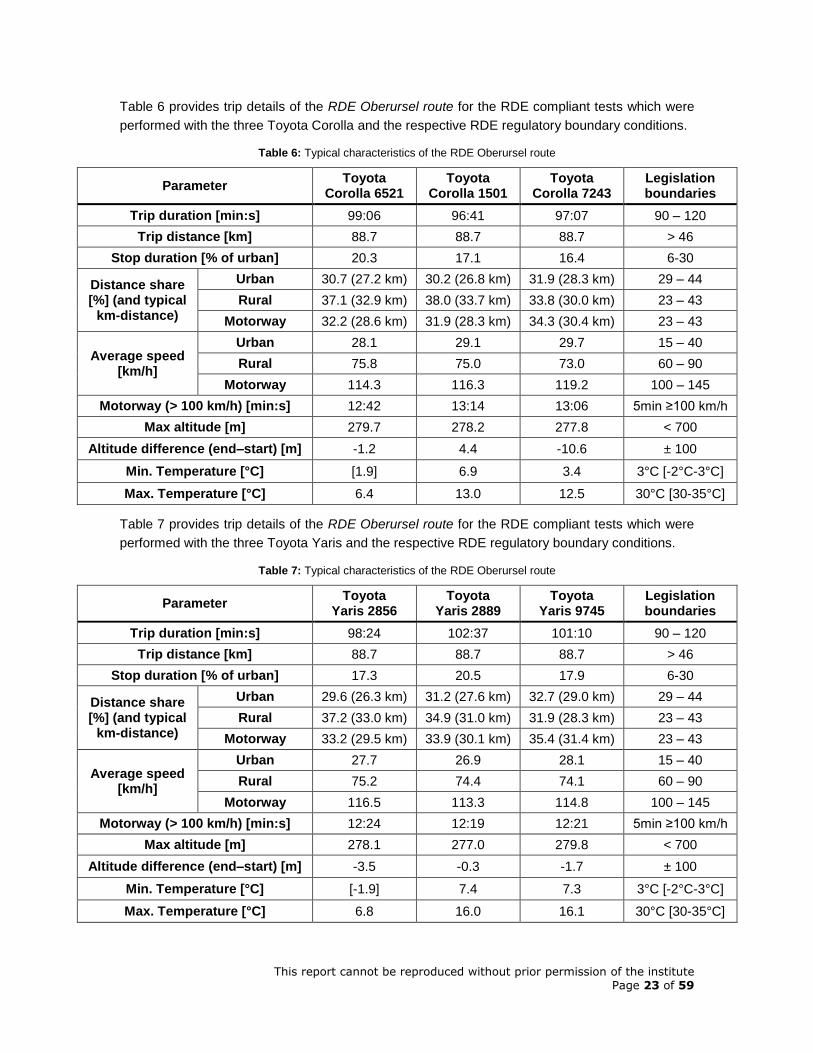
Table 6 provides trip details of the RDE Oberursel route for the RDE compliant tests which were
performed with the three Toyota Corolla and the respective RDE regulatory boundary conditions.
Table 6: Typical characteristics of the RDE Oberursel route
Parameter Toyota
Corolla 6521 Toyota
Corolla 1501 Toyota
Corolla 7243 Legislation boundaries
Trip duration [min:s] 99:06 96:41 97:07 90 – 120
Trip distance [km] 88.7 88.7 88.7 > 46
Stop duration [% of urban] 20.3 17.1 16.4 6-30
Distance share [%] (and typical
km-distance)
Urban 30.7 (27.2 km) 30.2 (26.8 km) 31.9 (28.3 km) 29 – 44
Rural 37.1 (32.9 km) 38.0 (33.7 km) 33.8 (30.0 km) 23 – 43
Motorway 32.2 (28.6 km) 31.9 (28.3 km) 34.3 (30.4 km) 23 – 43
Average speed [km/h]
Urban 28.1 29.1 29.7 15 – 40
Rural 75.8 75.0 73.0 60 – 90
Motorway 114.3 116.3 119.2 100 – 145
Motorway (> 100 km/h) [min:s] 12:42 13:14 13:06 5min ≥100 km/h
Max altitude [m] 279.7 278.2 277.8 < 700
Altitude difference (end–start) [m] -1.2 4.4 -10.6 ± 100
Min. Temperature [°C] [1.9] 6.9 3.4 3°C [-2°C-3°C]
Max. Temperature [°C] 6.4 13.0 12.5 30°C [30-35°C]
Table 7 provides trip details of the RDE Oberursel route for the RDE compliant tests which were
performed with the three Toyota Yaris and the respective RDE regulatory boundary conditions.
Table 7: Typical characteristics of the RDE Oberursel route
Parameter Toyota
Yaris 2856 Toyota
Yaris 2889 Toyota
Yaris 9745 Legislation boundaries
Trip duration [min:s] 98:24 102:37 101:10 90 – 120
Trip distance [km] 88.7 88.7 88.7 > 46
Stop duration [% of urban] 17.3 20.5 17.9 6-30
Distance share [%] (and typical
km-distance)
Urban 29.6 (26.3 km) 31.2 (27.6 km) 32.7 (29.0 km) 29 – 44
Rural 37.2 (33.0 km) 34.9 (31.0 km) 31.9 (28.3 km) 23 – 43
Motorway 33.2 (29.5 km) 33.9 (30.1 km) 35.4 (31.4 km) 23 – 43
Average speed [km/h]
Urban 27.7 26.9 28.1 15 – 40
Rural 75.2 74.4 74.1 60 – 90
Motorway 116.5 113.3 114.8 100 – 145
Motorway (> 100 km/h) [min:s] 12:24 12:19 12:21 5min ≥100 km/h
Max altitude [m] 278.1 277.0 279.8 < 700
Altitude difference (end–start) [m] -3.5 -0.3 -1.7 ± 100
Min. Temperature [°C] [-1.9] 7.4 7.3 3°C [-2°C-3°C]
Max. Temperature [°C] 6.8 16.0 16.1 30°C [30-35°C]
This report cannot be reproduced without prior permission of the institute Page 24 of 59
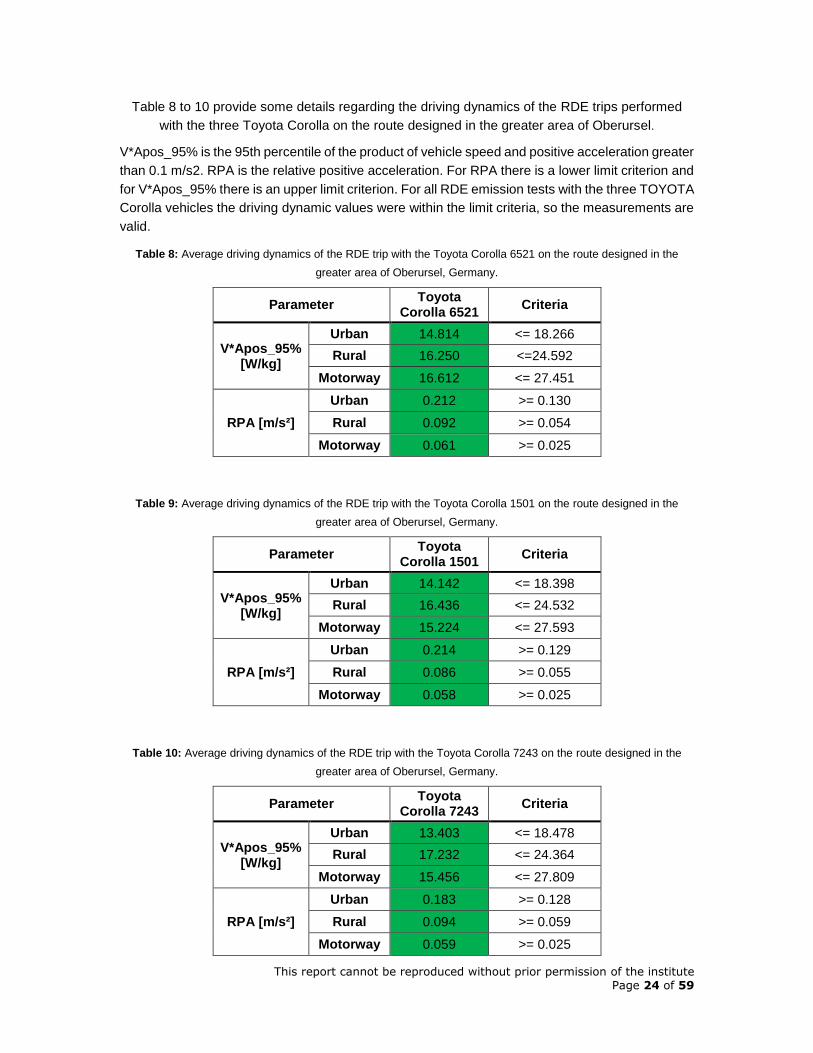
Table 8 to 10 provide some details regarding the driving dynamics of the RDE trips performed
with the three Toyota Corolla on the route designed in the greater area of Oberursel.
V*Apos_95% is the 95th percentile of the product of vehicle speed and positive acceleration greater
than 0.1 m/s2. RPA is the relative positive acceleration. For RPA there is a lower limit criterion and
for V*Apos_95% there is an upper limit criterion. For all RDE emission tests with the three TOYOTA
Corolla vehicles the driving dynamic values were within the limit criteria, so the measurements are
valid.
Table 8: Average driving dynamics of the RDE trip with the Toyota Corolla 6521 on the route designed in the
greater area of Oberursel, Germany.
Parameter Toyota
Corolla 6521 Criteria
V*Apos_95% [W/kg]
Urban 14.814 <= 18.266
Rural 16.250 <=24.592
Motorway 16.612 <= 27.451
RPA [m/s²]
Urban 0.212 >= 0.130
Rural 0.092 >= 0.054
Motorway 0.061 >= 0.025
Table 9: Average driving dynamics of the RDE trip with the Toyota Corolla 1501 on the route designed in the
greater area of Oberursel, Germany.
Parameter Toyota
Corolla 1501 Criteria
V*Apos_95% [W/kg]
Urban 14.142 <= 18.398
Rural 16.436 <= 24.532
Motorway 15.224 <= 27.593
RPA [m/s²]
Urban 0.214 >= 0.129
Rural 0.086 >= 0.055
Motorway 0.058 >= 0.025
Table 10: Average driving dynamics of the RDE trip with the Toyota Corolla 7243 on the route designed in the
greater area of Oberursel, Germany.
Parameter Toyota
Corolla 7243 Criteria
V*Apos_95% [W/kg]
Urban 13.403 <= 18.478
Rural 17.232 <= 24.364
Motorway 15.456 <= 27.809
RPA [m/s²]
Urban 0.183 >= 0.128
Rural 0.094 >= 0.059
Motorway 0.059 >= 0.025
This report cannot be reproduced without prior permission of the institute Page 25 of 59
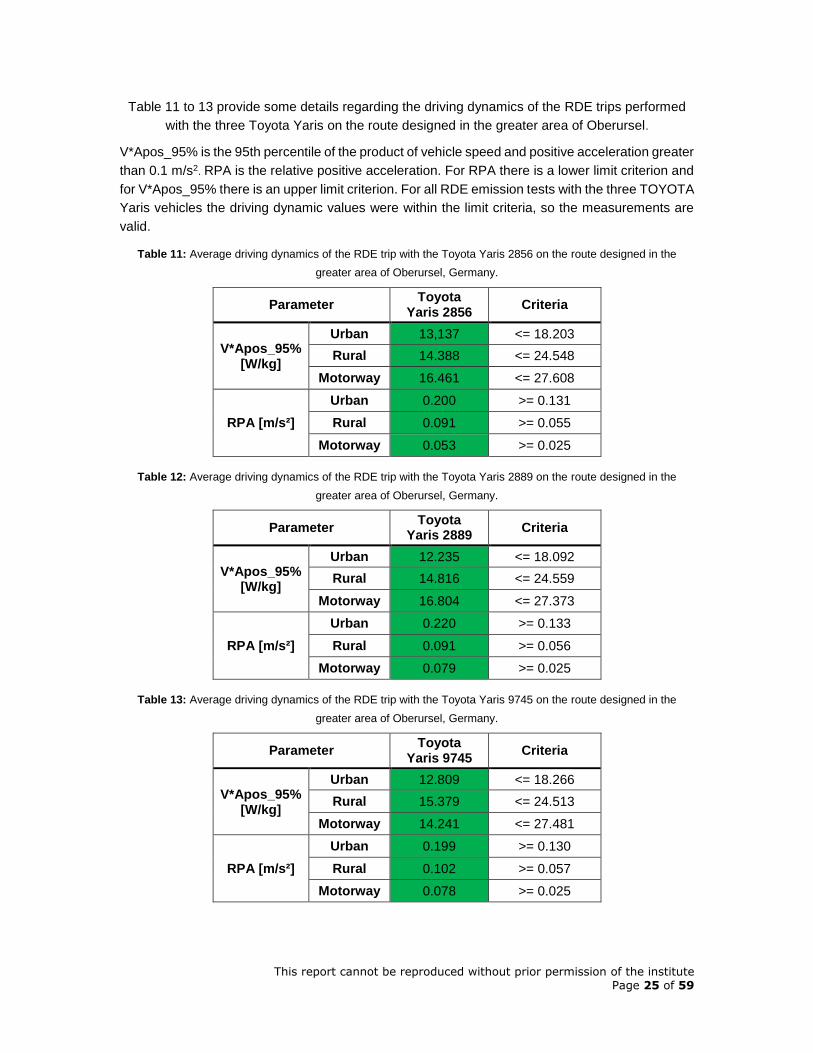
Table 11 to 13 provide some details regarding the driving dynamics of the RDE trips performed
with the three Toyota Yaris on the route designed in the greater area of Oberursel.
V*Apos_95% is the 95th percentile of the product of vehicle speed and positive acceleration greater
than 0.1 m/s2. RPA is the relative positive acceleration. For RPA there is a lower limit criterion and
for V*Apos_95% there is an upper limit criterion. For all RDE emission tests with the three TOYOTA
Yaris vehicles the driving dynamic values were within the limit criteria, so the measurements are
valid.
Table 11: Average driving dynamics of the RDE trip with the Toyota Yaris 2856 on the route designed in the
greater area of Oberursel, Germany.
Parameter Toyota
Yaris 2856 Criteria
V*Apos_95% [W/kg]
Urban 13,137 <= 18.203
Rural 14.388 <= 24.548
Motorway 16.461 <= 27.608
RPA [m/s²]
Urban 0.200 >= 0.131
Rural 0.091 >= 0.055
Motorway 0.053 >= 0.025
Table 12: Average driving dynamics of the RDE trip with the Toyota Yaris 2889 on the route designed in the
greater area of Oberursel, Germany.
Parameter Toyota
Yaris 2889 Criteria
V*Apos_95% [W/kg]
Urban 12.235 <= 18.092
Rural 14.816 <= 24.559
Motorway 16.804 <= 27.373
RPA [m/s²]
Urban 0.220 >= 0.133
Rural 0.091 >= 0.056
Motorway 0.079 >= 0.025
Table 13: Average driving dynamics of the RDE trip with the Toyota Yaris 9745 on the route designed in the
greater area of Oberursel, Germany.
Parameter Toyota
Yaris 9745 Criteria
V*Apos_95% [W/kg]
Urban 12.809 <= 18.266
Rural 15.379 <= 24.513
Motorway 14.241 <= 27.481
RPA [m/s²]
Urban 0.199 >= 0.130
Rural 0.102 >= 0.057
Motorway 0.078 >= 0.025
This report cannot be reproduced without prior permission of the institute Page 26 of 59
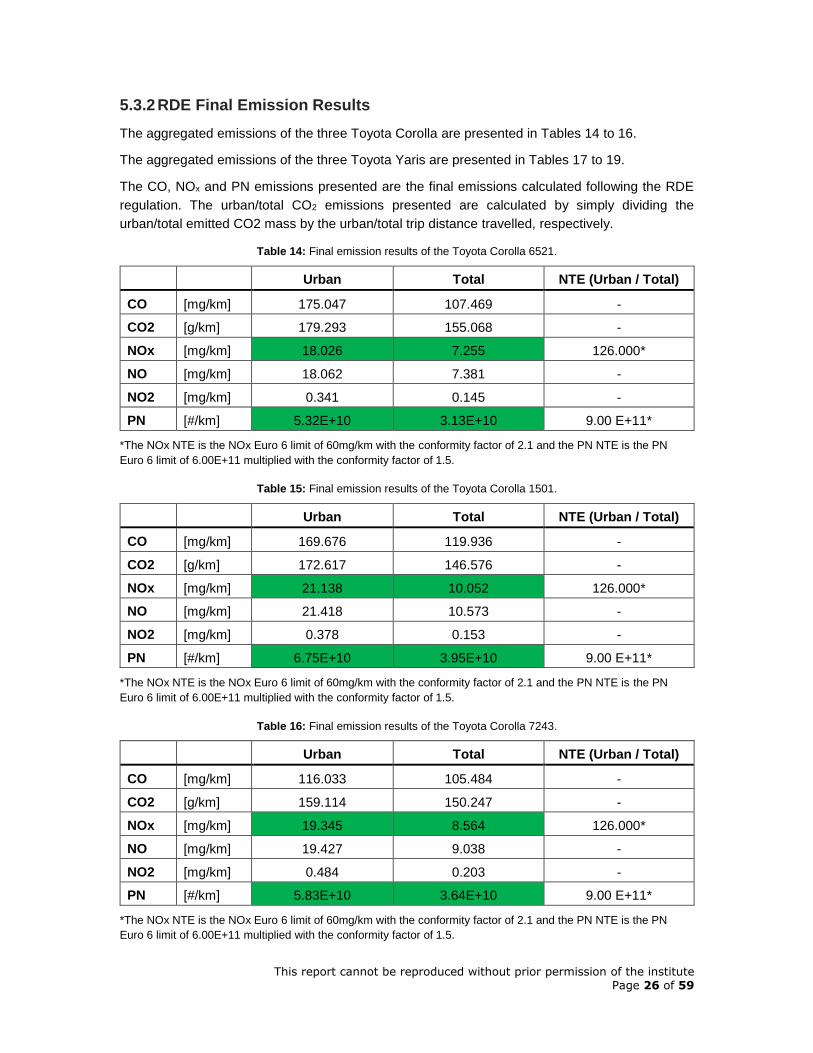
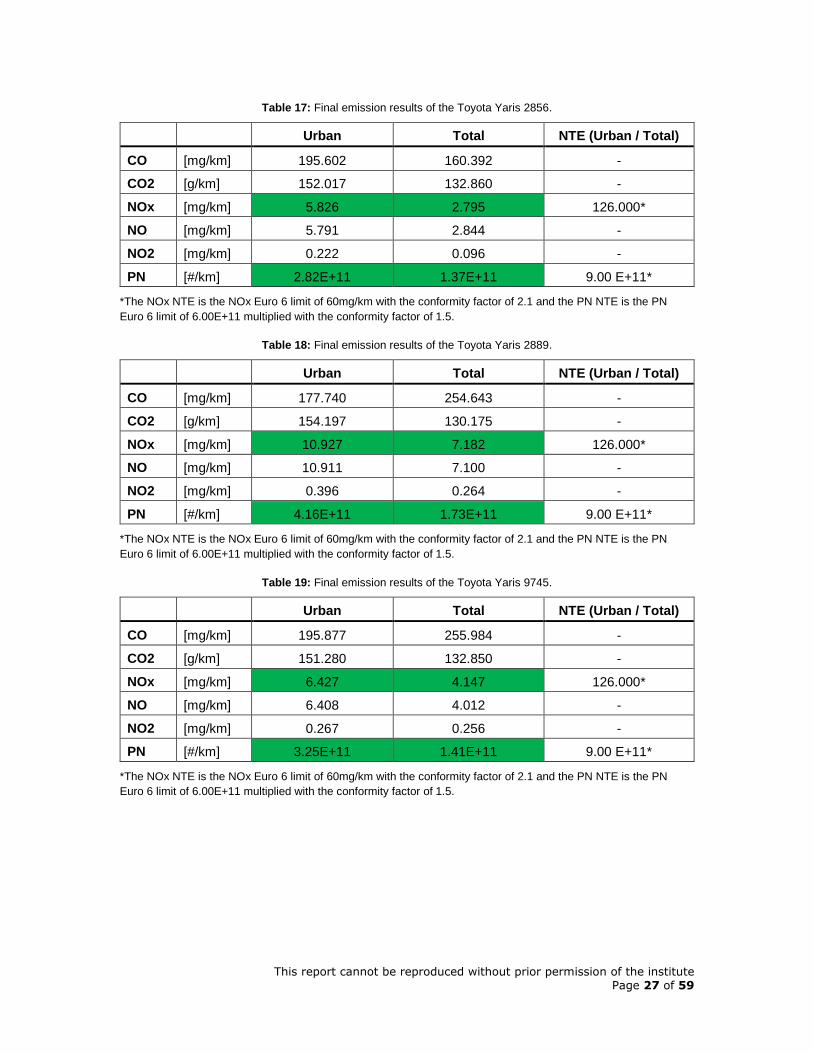
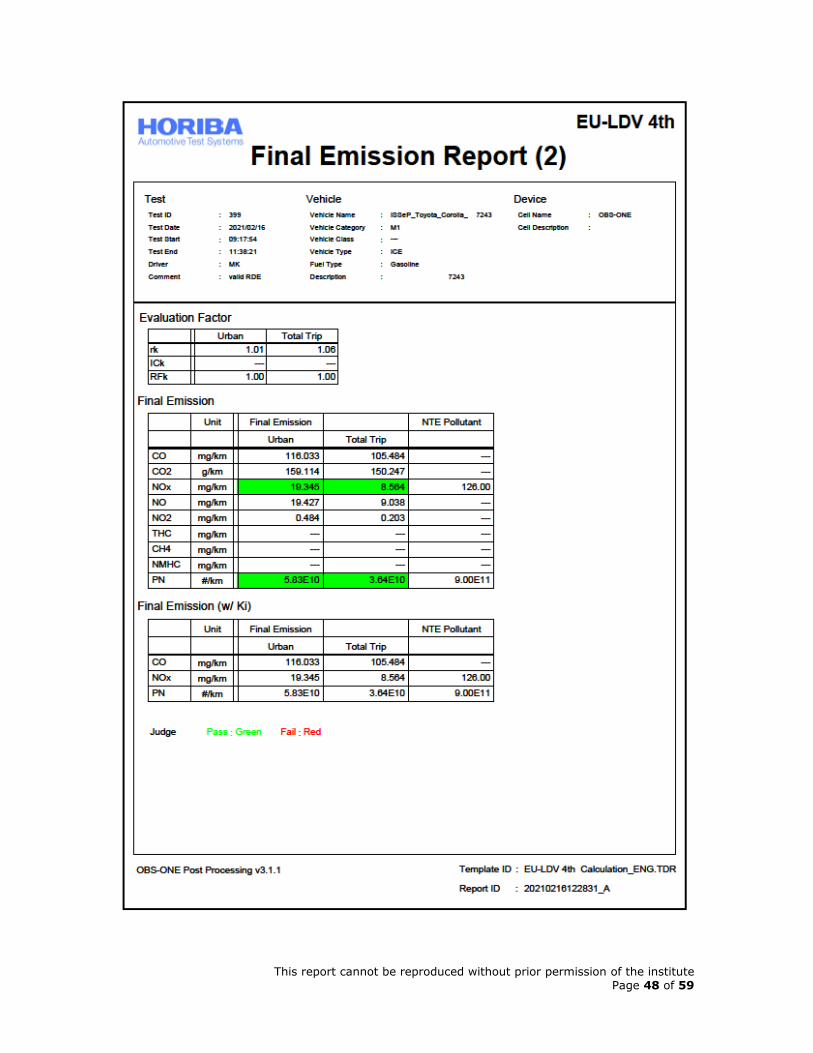
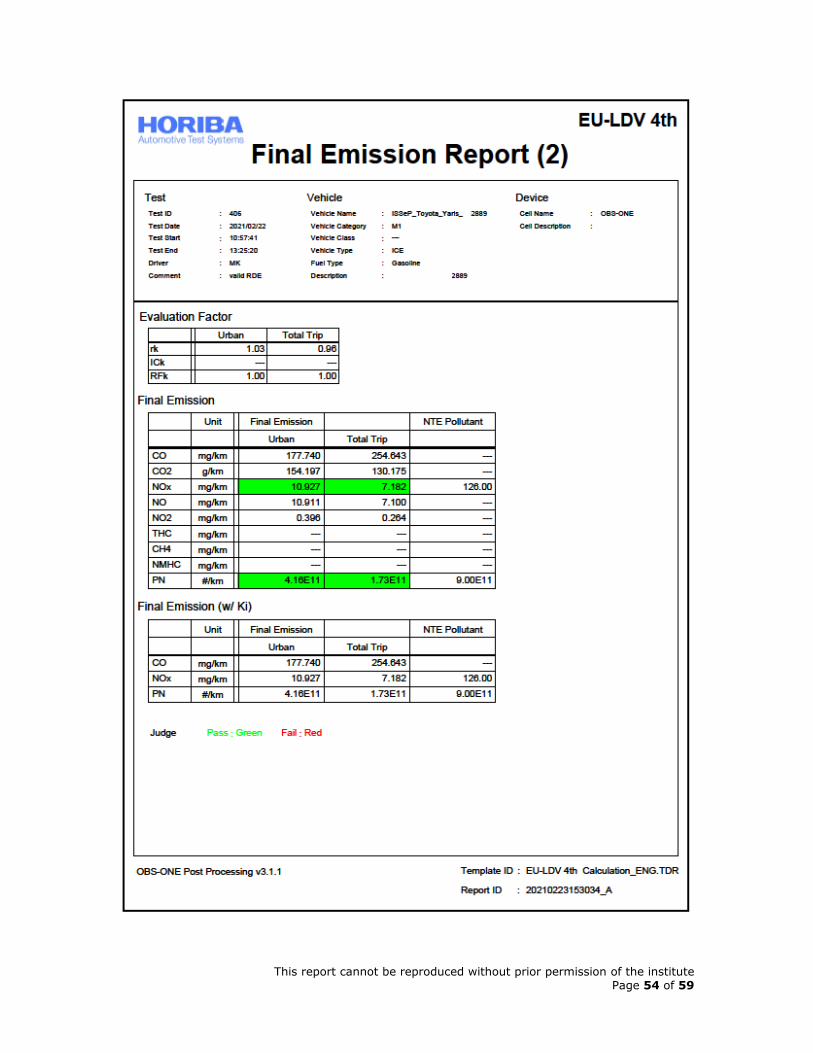
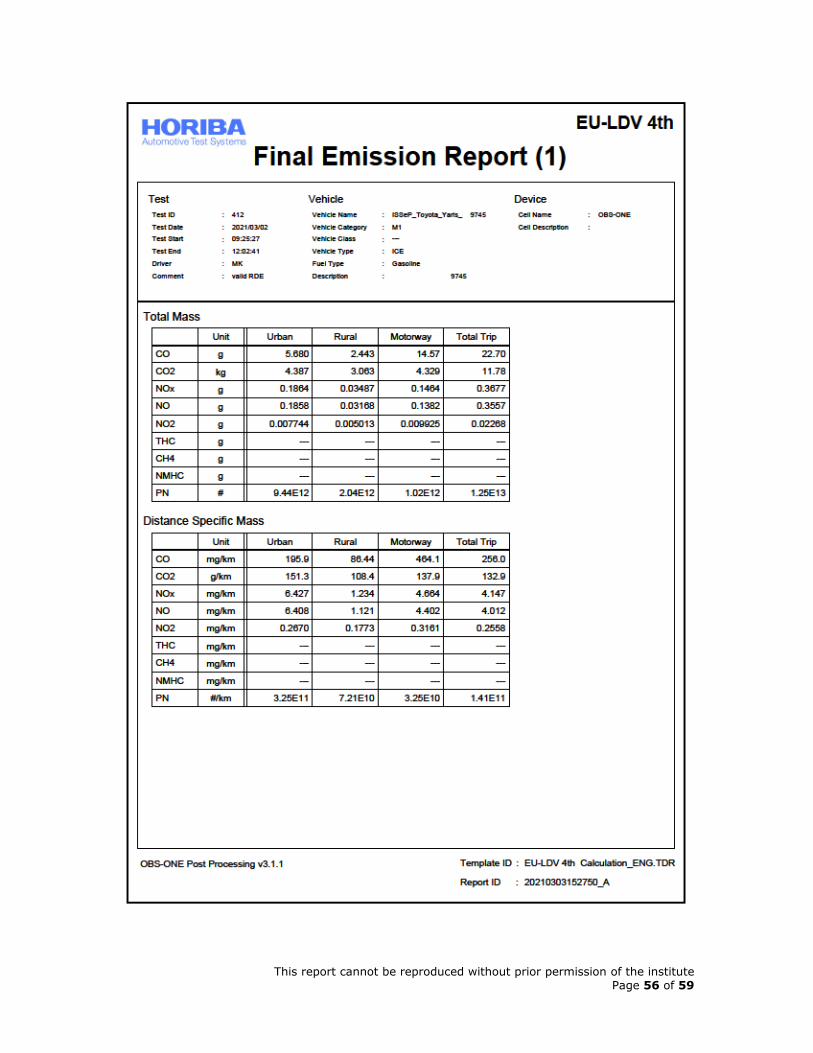
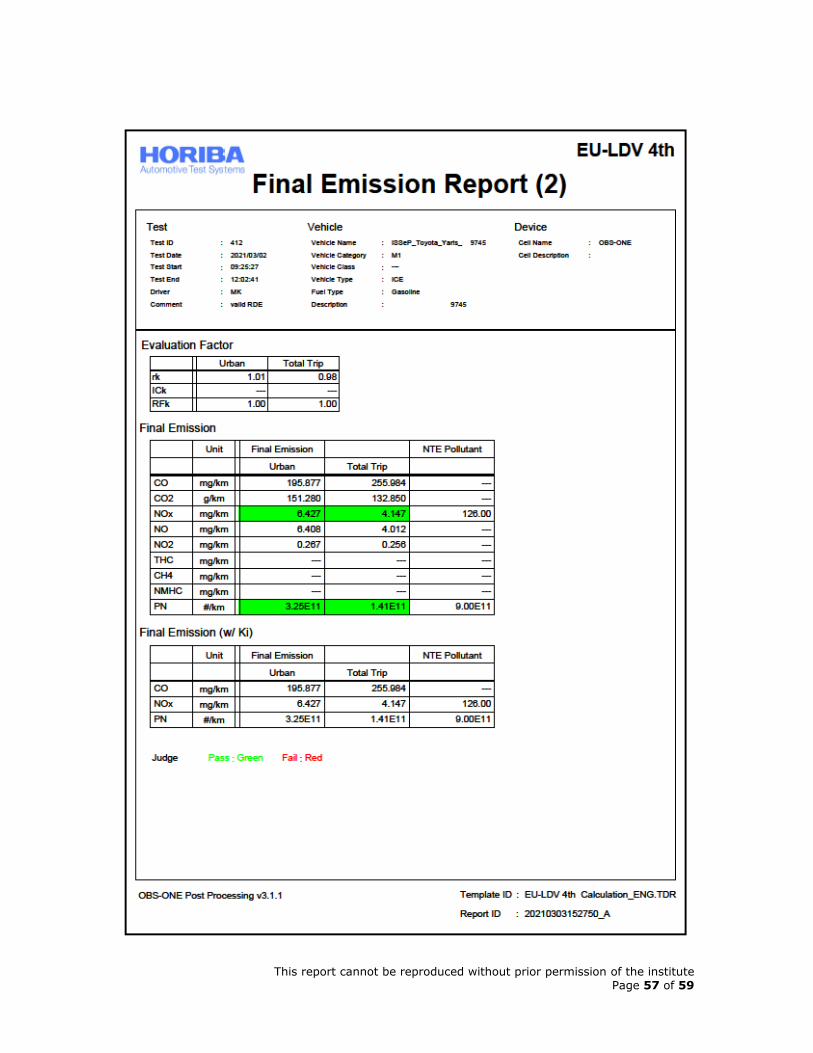
5.3.2 RDE Final Emission Results
The aggregated emissions of the three Toyota Corolla are presented in Tables 14 to 16.
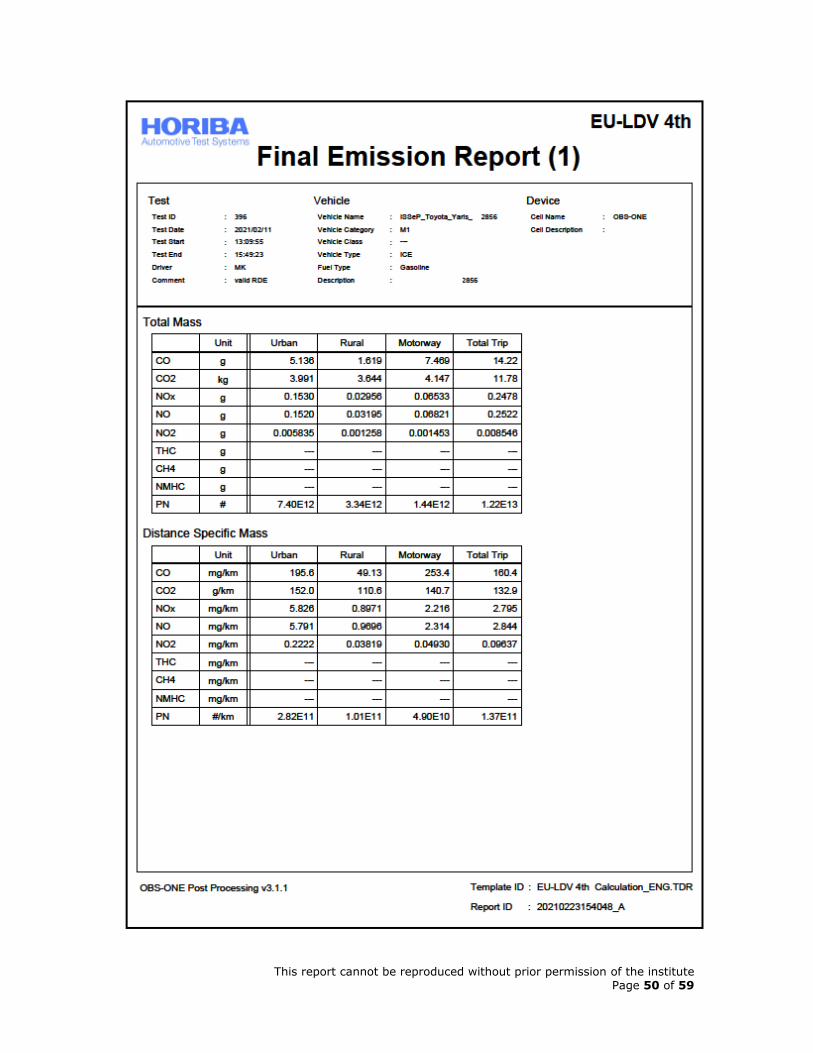
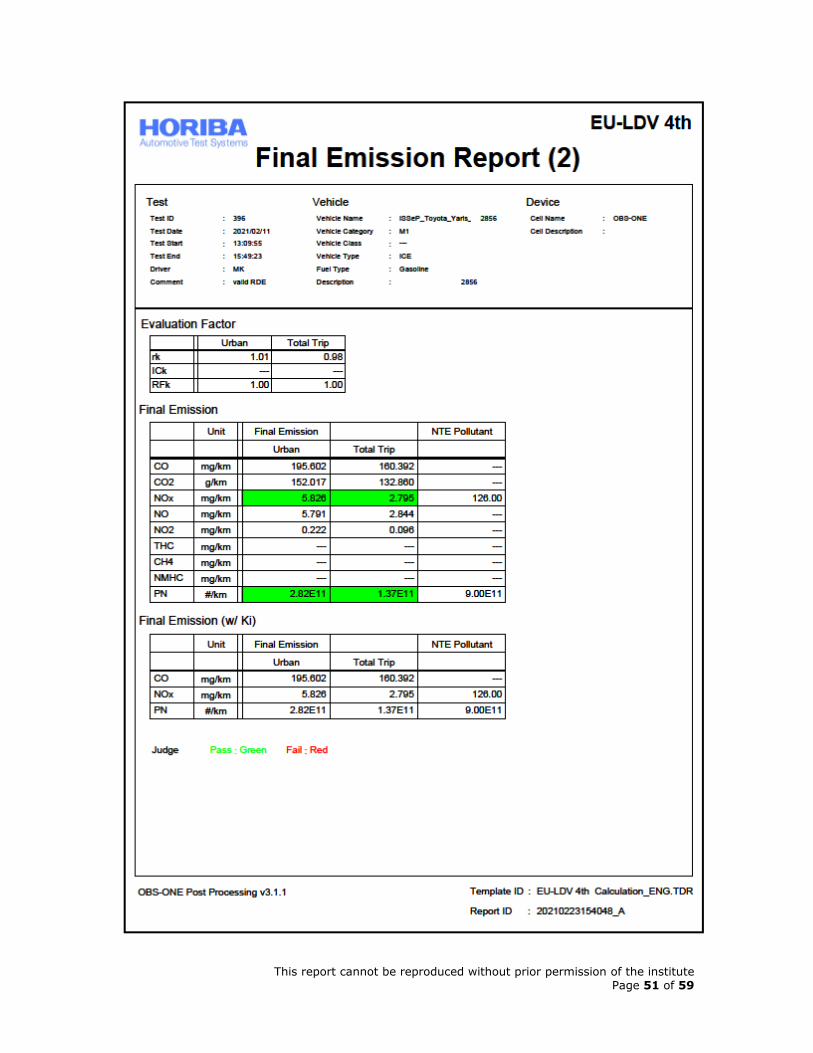
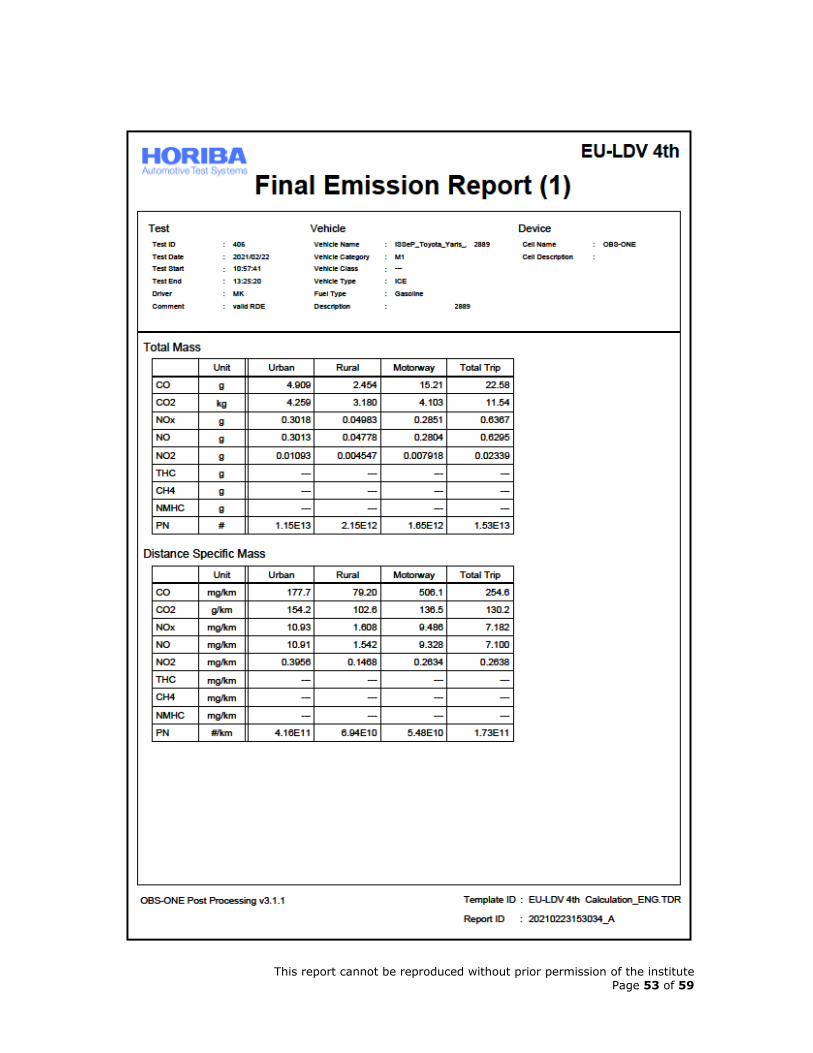
The aggregated emissions of the three Toyota Yaris are presented in Tables 17 to 19.
The CO, NOx and PN emissions presented are the final emissions calculated following the RDE
regulation. The urban/total CO2 emissions presented are calculated by simply dividing the
urban/total emitted CO2 mass by the urban/total trip distance travelled, respectively.
Table 14: Final emission results of the Toyota Corolla 6521.
Urban Total NTE (Urban / Total)
CO [mg/km] 175.047 107.469 -
CO2 [g/km] 179.293 155.068 -
NOx [mg/km] 18.026 7.255 126.000*
NO [mg/km] 18.062 7.381 -
NO2 [mg/km] 0.341 0.145 -
PN [#/km] 5.32E+10 3.13E+10 9.00 E+11*
*The NOx NTE is the NOx Euro 6 limit of 60mg/km with the conformity factor of 2.1 and the PN NTE is the PN
Euro 6 limit of 6.00E+11 multiplied with the conformity factor of 1.5.
Table 15: Final emission results of the Toyota Corolla 1501.
Urban Total NTE (Urban / Total)
CO [mg/km] 169.676 119.936 -
CO2 [g/km] 172.617 146.576 -
NOx [mg/km] 21.138 10.052 126.000*
NO [mg/km] 21.418 10.573 -
NO2 [mg/km] 0.378 0.153 -
PN [#/km] 6.75E+10 3.95E+10 9.00 E+11*
*The NOx NTE is the NOx Euro 6 limit of 60mg/km with the conformity factor of 2.1 and the PN NTE is the PN
Euro 6 limit of 6.00E+11 multiplied with the conformity factor of 1.5.
Table 16: Final emission results of the Toyota Corolla 7243.
Urban Total NTE (Urban / Total)
CO [mg/km] 116.033 105.484 -
CO2 [g/km] 159.114 150.247 -
NOx [mg/km] 19.345 8.564 126.000*
NO [mg/km] 19.427 9.038 -
NO2 [mg/km] 0.484 0.203 -
PN [#/km] 5.83E+10 3.64E+10 9.00 E+11*
*The NOx NTE is the NOx Euro 6 limit of 60mg/km with the conformity factor of 2.1 and the PN NTE is the PN
Euro 6 limit of 6.00E+11 multiplied with the conformity factor of 1.5.
This report cannot be reproduced without prior permission of the institute Page 27 of 59
Table 17: Final emission results of the Toyota Yaris 2856.
Urban Total NTE (Urban / Total)
CO [mg/km] 195.602 160.392 -
CO2 [g/km] 152.017 132.860 -
NOx [mg/km] 5.826 2.795 126.000*
NO [mg/km] 5.791 2.844 -
NO2 [mg/km] 0.222 0.096 -
PN [#/km] 2.82E+11 1.37E+11 9.00 E+11*
*The NOx NTE is the NOx Euro 6 limit of 60mg/km with the conformity factor of 2.1 and the PN NTE is the PN
Euro 6 limit of 6.00E+11 multiplied with the conformity factor of 1.5.
Table 18: Final emission results of the Toyota Yaris 2889.
Urban Total NTE (Urban / Total)
CO [mg/km] 177.740 254.643 -
CO2 [g/km] 154.197 130.175 -
NOx [mg/km] 10.927 7.182 126.000*
NO [mg/km] 10.911 7.100 -
NO2 [mg/km] 0.396 0.264 -
PN [#/km] 4.16E+11 1.73E+11 9.00 E+11*
*The NOx NTE is the NOx Euro 6 limit of 60mg/km with the conformity factor of 2.1 and the PN NTE is the PN
Euro 6 limit of 6.00E+11 multiplied with the conformity factor of 1.5.
Table 19: Final emission results of the Toyota Yaris 9745.
Urban Total NTE (Urban / Total)
CO [mg/km] 195.877 255.984 -
CO2 [g/km] 151.280 132.850 -
NOx [mg/km] 6.427 4.147 126.000*
NO [mg/km] 6.408 4.012 -
NO2 [mg/km] 0.267 0.256 -
PN [#/km] 3.25E+11 1.41E+11 9.00 E+11*
*The NOx NTE is the NOx Euro 6 limit of 60mg/km with the conformity factor of 2.1 and the PN NTE is the PN
Euro 6 limit of 6.00E+11 multiplied with the conformity factor of 1.5.
This report cannot be reproduced without prior permission of the institute Page 28 of 59
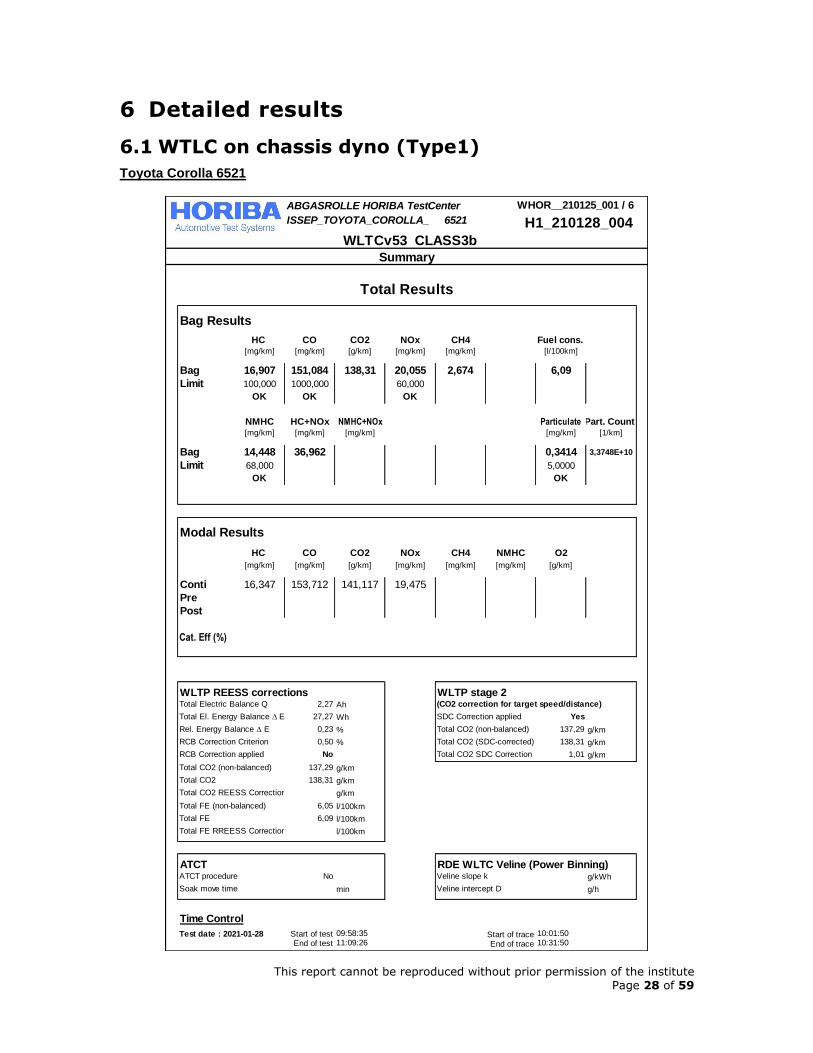
6 Detailed results
6.1 WTLC on chassis dyno (Type1)
Toyota Corolla 6521
ABGASROLLE HORIBA TestCenter WHOR__210125_001 / 6
ISSEP_TOYOTA_COROLLA_ 00 6521 H1_210128_004
WLTCv53_CLASS3b
Bag Results
HC CO CO2 NOx CH4 Fuel cons.[mg/km] [mg/km] [g/km] [mg/km] [mg/km] [l/100km]
Bag 16,907 151,084 138,31 20,055 2,674 6,09
Limit 100,000 1000,000 60,000
OK OK OK
NMHC HC+NOx NMHC+NOx Particulate Part. Count[mg/km] [mg/km] [mg/km] [mg/km] [1/km]
Bag 14,448 36,962 0,3414 3,3748E+10
Limit 68,000 5,0000
OK OK
Modal Results
HC CO CO2 NOx CH4 NMHC O2
[mg/km] [mg/km] [g/km] [mg/km] [mg/km] [mg/km] [g/km]
Conti 16,347 153,712 141,117 19,475
Pre
Post
Cat. Eff (%)
WLTP REESS corrections WLTP stage 2Total Electric Balance Q 2,27 Ah (CO2 correction for target speed/distance)
Total El. Energy Balance D E 27,27 Wh SDC Correction applied Yes
Rel. Energy Balance D E 0,23 % Total CO2 (non-balanced) 137,29 g/km
RCB Correction Criterion 0,50 % Total CO2 (SDC-corrected) 138,31 g/km
RCB Correction applied No Total CO2 SDC Correction 1,01 g/km
Total CO2 (non-balanced) 137,29 g/km
Total CO2 138,31 g/km
Total CO2 REESS Correction g/km
Total FE (non-balanced) 6,05 l/100km
Total FE 6,09 l/100km
Total FE RREESS Correction l/100km
ATCT RDE WLTC Veline (Power Binning)ATCT procedure No Veline slope k g/kWh
Soak move time min Veline intercept D g/h
Time Control
Test date : 2021-01-28 Start of test Start of traceEnd of test End of trace
Summary
09:58:35 10:01:5011:09:26 10:31:50
Total Results
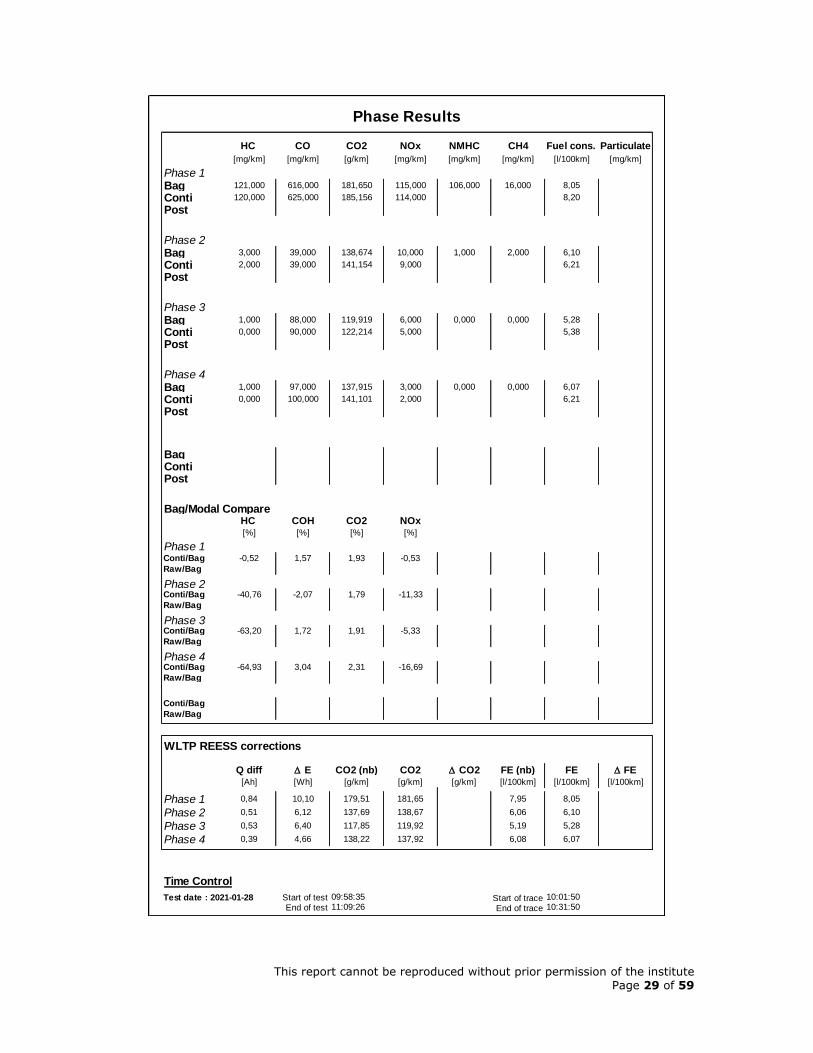
This report cannot be reproduced without prior permission of the institute Page 29 of 59
HC CO CO2 NOx NMHC CH4 Fuel cons. Particulate
[mg/km] [mg/km] [g/km] [mg/km] [mg/km] [mg/km] [l/100km] [mg/km]
Phase 1Bag 121,000 616,000 181,650 115,000 106,000 16,000 8,05
Conti 120,000 625,000 185,156 114,000 8,20
Post
Phase 2Bag 3,000 39,000 138,674 10,000 1,000 2,000 6,10
Conti 2,000 39,000 141,154 9,000 6,21
Post
Phase 3Bag 1,000 88,000 119,919 6,000 0,000 0,000 5,28
Conti 0,000 90,000 122,214 5,000 5,38
Post
Phase 4Bag 1,000 97,000 137,915 3,000 0,000 0,000 6,07
Conti 0,000 100,000 141,101 2,000 6,21
Post
BagConti Post
Bag/Modal CompareHC COH CO2 NOx[%] [%] [%] [%]
Phase 1Conti/Bag -0,52 1,57 1,93 -0,53
Raw/Bag
Phase 2Conti/Bag -40,76 -2,07 1,79 -11,33
Raw/Bag
Phase 3Conti/Bag -63,20 1,72 1,91 -5,33
Raw/Bag
Phase 4Conti/Bag -64,93 3,04 2,31 -16,69
Raw/Bag
Conti/Bag
Raw/Bag
WLTP REESS corrections
Q diff D E CO2 (nb) CO2 D CO2 FE (nb) FE D FE[Ah] [Wh] [g/km] [g/km] [g/km] [l/100km] [l/100km] [l/100km]
Phase 1 0,84 10,10 179,51 181,65 7,95 8,05
Phase 2 0,51 6,12 137,69 138,67 6,06 6,10
Phase 3 0,53 6,40 117,85 119,92 5,19 5,28
Phase 4 0,39 4,66 138,22 137,92 6,08 6,07
Time Control
Test date : 2021-01-28 Start of test Start of traceEnd of test End of trace
09:58:35 10:01:5011:09:26 10:31:50
Phase Results

This report cannot be reproduced without prior permission of the institute Page 30 of 59
Toyota Corolla 7243
ABGASROLLE HORIBA TestCenter WHOR__210205_002 / 6
ISSEP_TOYOTA_COROLLA_ 00 7243 H1_210209_004
WLTCv53_CLASS3b
Bag Results
HC CO CO2 NOx CH4 Fuel cons.[mg/km] [mg/km] [g/km] [mg/km] [mg/km] [l/100km]
Bag 14,484 145,485 136,77 13,066 2,493 6,03
Limit 100,000 1000,000 60,000
OK OK OK
NMHC HC+NOx NMHC+NOx Particulate Part. Count[mg/km] [mg/km] [mg/km] [mg/km] [1/km]
Bag 12,249 27,550 0,4889 6,7711E+10
Limit 68,000 5,0000
OK OK
Modal Results
HC CO CO2 NOx CH4 NMHC O2
[mg/km] [mg/km] [g/km] [mg/km] [mg/km] [mg/km] [g/km]
Conti 12,336 146,758 139,652 9,517
Pre
Post
Cat. Eff (%)
WLTP REESS corrections WLTP stage 2Total Electric Balance Q 1,39 Ah (CO2 correction for target speed/distance)
Total El. Energy Balance D E 16,65 Wh SDC Correction applied Yes
Rel. Energy Balance D E 0,14 % Total CO2 (non-balanced) 135,73 g/km
RCB Correction Criterion 0,50 % Total CO2 (SDC-corrected) 136,77 g/km
RCB Correction applied No Total CO2 SDC Correction 1,04 g/km
Total CO2 (non-balanced) 135,73 g/km
Total CO2 136,77 g/km
Total CO2 REESS Correction g/km
Total FE (non-balanced) 5,98 l/100km
Total FE 6,03 l/100km
Total FE RREESS Correction l/100km
ATCT RDE WLTC Veline (Power Binning)ATCT procedure No Veline slope k g/kWh
Soak move time min Veline intercept D g/h
Time Control
Test date : 2021-02-09 Start of test Start of traceEnd of test End of trace
Summary
11:57:54 12:02:0113:09:29 12:32:01
Total Results
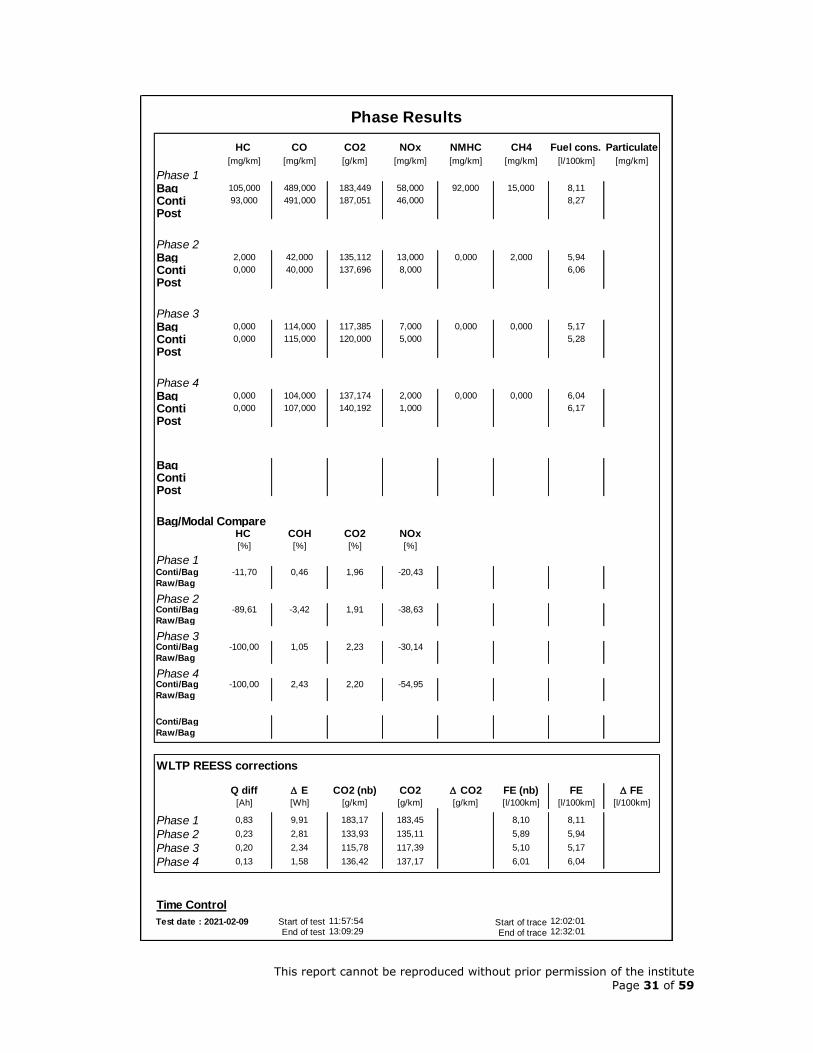
This report cannot be reproduced without prior permission of the institute Page 31 of 59
HC CO CO2 NOx NMHC CH4 Fuel cons. Particulate
[mg/km] [mg/km] [g/km] [mg/km] [mg/km] [mg/km] [l/100km] [mg/km]
Phase 1Bag 105,000 489,000 183,449 58,000 92,000 15,000 8,11
Conti 93,000 491,000 187,051 46,000 8,27
Post
Phase 2Bag 2,000 42,000 135,112 13,000 0,000 2,000 5,94
Conti 0,000 40,000 137,696 8,000 6,06
Post
Phase 3Bag 0,000 114,000 117,385 7,000 0,000 0,000 5,17
Conti 0,000 115,000 120,000 5,000 5,28
Post
Phase 4Bag 0,000 104,000 137,174 2,000 0,000 0,000 6,04
Conti 0,000 107,000 140,192 1,000 6,17
Post
BagConti Post
Bag/Modal CompareHC COH CO2 NOx[%] [%] [%] [%]
Phase 1Conti/Bag -11,70 0,46 1,96 -20,43
Raw/Bag
Phase 2Conti/Bag -89,61 -3,42 1,91 -38,63
Raw/Bag
Phase 3Conti/Bag -100,00 1,05 2,23 -30,14
Raw/Bag
Phase 4Conti/Bag -100,00 2,43 2,20 -54,95
Raw/Bag
Conti/Bag
Raw/Bag
WLTP REESS corrections
Q diff D E CO2 (nb) CO2 D CO2 FE (nb) FE D FE[Ah] [Wh] [g/km] [g/km] [g/km] [l/100km] [l/100km] [l/100km]
Phase 1 0,83 9,91 183,17 183,45 8,10 8,11
Phase 2 0,23 2,81 133,93 135,11 5,89 5,94
Phase 3 0,20 2,34 115,78 117,39 5,10 5,17
Phase 4 0,13 1,58 136,42 137,17 6,01 6,04
Time Control
Test date : 2021-02-09 Start of test Start of traceEnd of test End of trace
11:57:54 12:02:0113:09:29 12:32:01
Phase Results

This report cannot be reproduced without prior permission of the institute Page 32 of 59
Toyota Corolla 1501
ABGASROLLE HORIBA TestCenter WHOR__210125_003 / 9
ISSEP_TOYOTA_COROLLA_ 01 1501 H1_210203_003
WLTCv53_CLASS3b
Bag Results
HC CO CO2 NOx CH4 Fuel cons.[mg/km] [mg/km] [g/km] [mg/km] [mg/km] [l/100km]
Bag 21,855 240,236 134,76 16,553 3,880 5,94
Limit 100,000 1000,000 60,000
OK OK OK
NMHC HC+NOx NMHC+NOx Particulate Part. Count[mg/km] [mg/km] [mg/km] [mg/km] [1/km]
Bag 18,320 38,408 0,2088 5,9330E+10
Limit 68,000 5,0000
OK OK
Modal Results
HC CO CO2 NOx CH4 NMHC O2
[mg/km] [mg/km] [g/km] [mg/km] [mg/km] [mg/km] [g/km]
Conti 20,949 247,627 137,623 15,969
Pre
Post
Cat. Eff (%)
WLTP REESS corrections WLTP stage 2Total Electric Balance Q 3,52 Ah (CO2 correction for target speed/distance)
Total El. Energy Balance D E 42,23 Wh SDC Correction applied Yes
Rel. Energy Balance D E 0,36 % Total CO2 (non-balanced) 133,96 g/km
RCB Correction Criterion 0,50 % Total CO2 (SDC-corrected) 134,76 g/km
RCB Correction applied No Total CO2 SDC Correction 0,81 g/km
Total CO2 (non-balanced) 133,96 g/km
Total CO2 134,76 g/km
Total CO2 REESS Correction g/km
Total FE (non-balanced) 5,91 l/100km
Total FE 5,94 l/100km
Total FE RREESS Correction l/100km
ATCT RDE WLTC Veline (Power Binning)ATCT procedure No Veline slope k g/kWh
Soak move time min Veline intercept D g/h
Time Control
Test date : 2021-02-03 Start of test Start of traceEnd of test End of trace
Summary
10:07:26 10:23:0611:32:17 10:53:06
Total Results
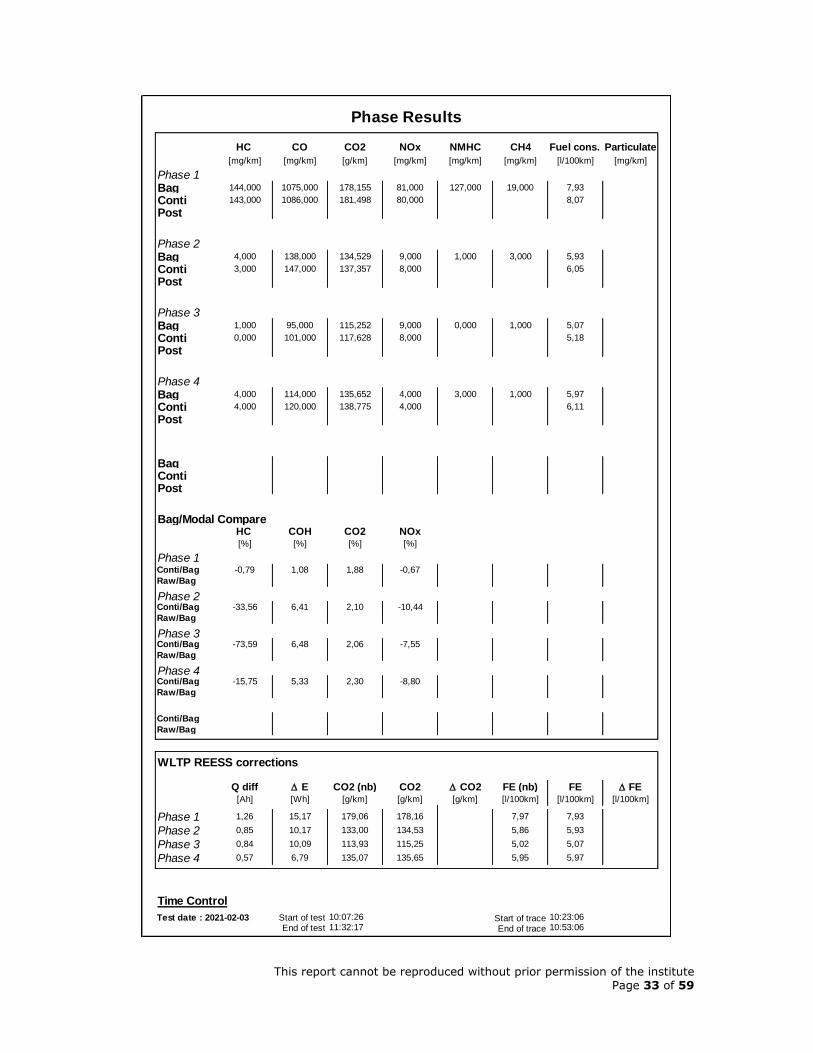
This report cannot be reproduced without prior permission of the institute Page 33 of 59
HC CO CO2 NOx NMHC CH4 Fuel cons. Particulate
[mg/km] [mg/km] [g/km] [mg/km] [mg/km] [mg/km] [l/100km] [mg/km]
Phase 1Bag 144,000 1075,000 178,155 81,000 127,000 19,000 7,93
Conti 143,000 1086,000 181,498 80,000 8,07
Post
Phase 2Bag 4,000 138,000 134,529 9,000 1,000 3,000 5,93
Conti 3,000 147,000 137,357 8,000 6,05
Post
Phase 3Bag 1,000 95,000 115,252 9,000 0,000 1,000 5,07
Conti 0,000 101,000 117,628 8,000 5,18
Post
Phase 4Bag 4,000 114,000 135,652 4,000 3,000 1,000 5,97
Conti 4,000 120,000 138,775 4,000 6,11
Post
BagConti Post
Bag/Modal CompareHC COH CO2 NOx[%] [%] [%] [%]
Phase 1Conti/Bag -0,79 1,08 1,88 -0,67
Raw/Bag
Phase 2Conti/Bag -33,56 6,41 2,10 -10,44
Raw/Bag
Phase 3Conti/Bag -73,59 6,48 2,06 -7,55
Raw/Bag
Phase 4Conti/Bag -15,75 5,33 2,30 -8,80
Raw/Bag
Conti/Bag
Raw/Bag
WLTP REESS corrections
Q diff D E CO2 (nb) CO2 D CO2 FE (nb) FE D FE[Ah] [Wh] [g/km] [g/km] [g/km] [l/100km] [l/100km] [l/100km]
Phase 1 1,26 15,17 179,06 178,16 7,97 7,93
Phase 2 0,85 10,17 133,00 134,53 5,86 5,93
Phase 3 0,84 10,09 113,93 115,25 5,02 5,07
Phase 4 0,57 6,79 135,07 135,65 5,95 5,97
Time Control
Test date : 2021-02-03 Start of test Start of traceEnd of test End of trace
10:07:26 10:23:0611:32:17 10:53:06
Phase Results
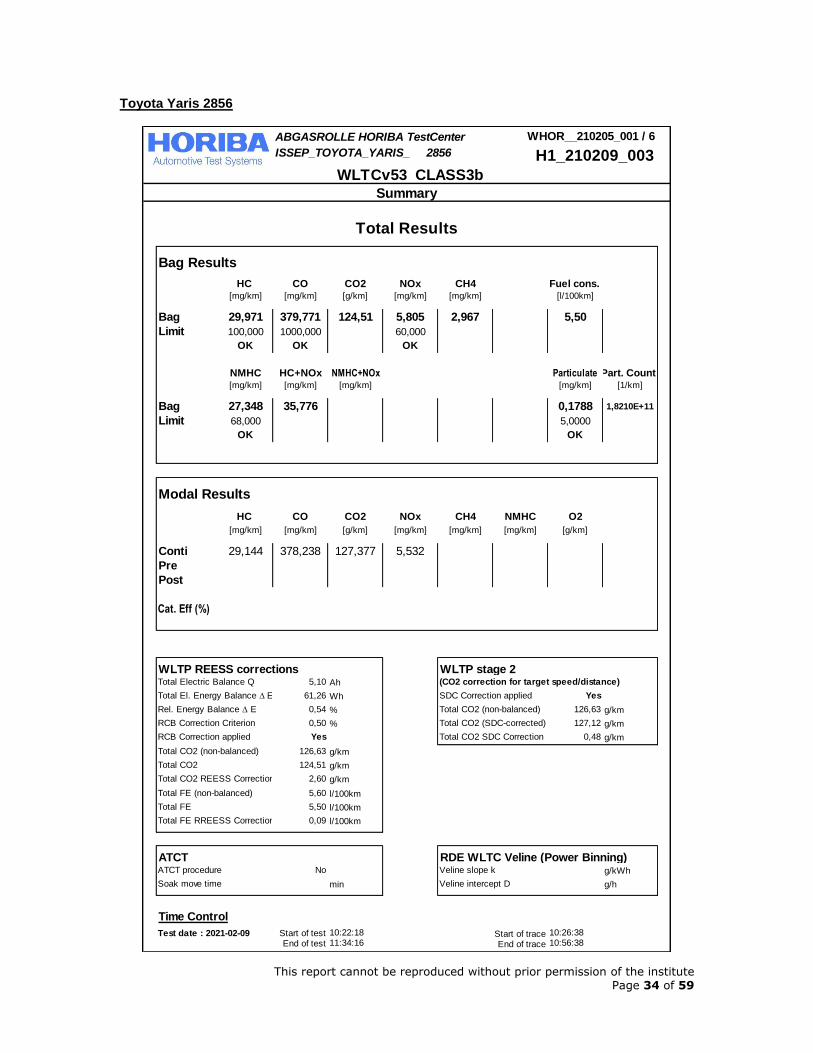
This report cannot be reproduced without prior permission of the institute Page 34 of 59
Toyota Yaris 2856
ABGASROLLE HORIBA TestCenter WHOR__210205_001 / 6
ISSEP_TOYOTA_YARIS_ 20 2856 H1_210209_003
WLTCv53_CLASS3b
Bag Results
HC CO CO2 NOx CH4 Fuel cons.[mg/km] [mg/km] [g/km] [mg/km] [mg/km] [l/100km]
Bag 29,971 379,771 124,51 5,805 2,967 5,50
Limit 100,000 1000,000 60,000
OK OK OK
NMHC HC+NOx NMHC+NOx Particulate Part. Count[mg/km] [mg/km] [mg/km] [mg/km] [1/km]
Bag 27,348 35,776 0,1788 1,8210E+11
Limit 68,000 5,0000
OK OK
Modal Results
HC CO CO2 NOx CH4 NMHC O2
[mg/km] [mg/km] [g/km] [mg/km] [mg/km] [mg/km] [g/km]
Conti 29,144 378,238 127,377 5,532
Pre
Post
Cat. Eff (%)
WLTP REESS corrections WLTP stage 2Total Electric Balance Q 5,10 Ah (CO2 correction for target speed/distance)
Total El. Energy Balance D E 61,26 Wh SDC Correction applied Yes
Rel. Energy Balance D E 0,54 % Total CO2 (non-balanced) 126,63 g/km
RCB Correction Criterion 0,50 % Total CO2 (SDC-corrected) 127,12 g/km
RCB Correction applied Yes Total CO2 SDC Correction 0,48 g/km
Total CO2 (non-balanced) 126,63 g/km
Total CO2 124,51 g/km
Total CO2 REESS Correction 2,60 g/km
Total FE (non-balanced) 5,60 l/100km
Total FE 5,50 l/100km
Total FE RREESS Correction 0,09 l/100km
ATCT RDE WLTC Veline (Power Binning)ATCT procedure No Veline slope k g/kWh
Soak move time min Veline intercept D g/h
Time Control
Test date : 2021-02-09 Start of test Start of traceEnd of test End of trace
Summary
10:22:18 10:26:3811:34:16 10:56:38
Total Results
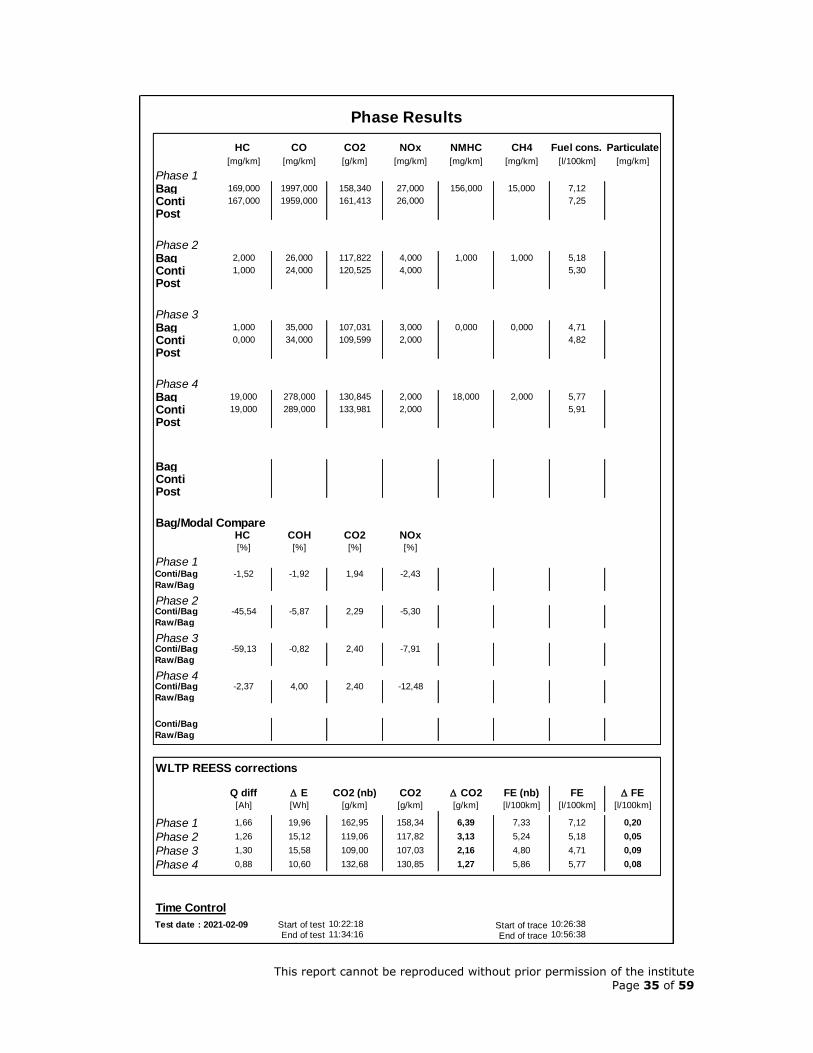
This report cannot be reproduced without prior permission of the institute Page 35 of 59
HC CO CO2 NOx NMHC CH4 Fuel cons. Particulate
[mg/km] [mg/km] [g/km] [mg/km] [mg/km] [mg/km] [l/100km] [mg/km]
Phase 1Bag 169,000 1997,000 158,340 27,000 156,000 15,000 7,12
Conti 167,000 1959,000 161,413 26,000 7,25
Post
Phase 2Bag 2,000 26,000 117,822 4,000 1,000 1,000 5,18
Conti 1,000 24,000 120,525 4,000 5,30
Post
Phase 3Bag 1,000 35,000 107,031 3,000 0,000 0,000 4,71
Conti 0,000 34,000 109,599 2,000 4,82
Post
Phase 4Bag 19,000 278,000 130,845 2,000 18,000 2,000 5,77
Conti 19,000 289,000 133,981 2,000 5,91
Post
BagConti Post
Bag/Modal CompareHC COH CO2 NOx[%] [%] [%] [%]
Phase 1Conti/Bag -1,52 -1,92 1,94 -2,43
Raw/Bag
Phase 2Conti/Bag -45,54 -5,87 2,29 -5,30
Raw/Bag
Phase 3Conti/Bag -59,13 -0,82 2,40 -7,91
Raw/Bag
Phase 4Conti/Bag -2,37 4,00 2,40 -12,48
Raw/Bag
Conti/Bag
Raw/Bag
WLTP REESS corrections
Q diff D E CO2 (nb) CO2 D CO2 FE (nb) FE D FE[Ah] [Wh] [g/km] [g/km] [g/km] [l/100km] [l/100km] [l/100km]
Phase 1 1,66 19,96 162,95 158,34 6,39 7,33 7,12 0,20
Phase 2 1,26 15,12 119,06 117,82 3,13 5,24 5,18 0,05
Phase 3 1,30 15,58 109,00 107,03 2,16 4,80 4,71 0,09
Phase 4 0,88 10,60 132,68 130,85 1,27 5,86 5,77 0,08
Time Control
Test date : 2021-02-09 Start of test Start of traceEnd of test End of trace
10:22:18 10:26:3811:34:16 10:56:38
Phase Results
This report cannot be reproduced without prior permission of the institute Page 36 of 59
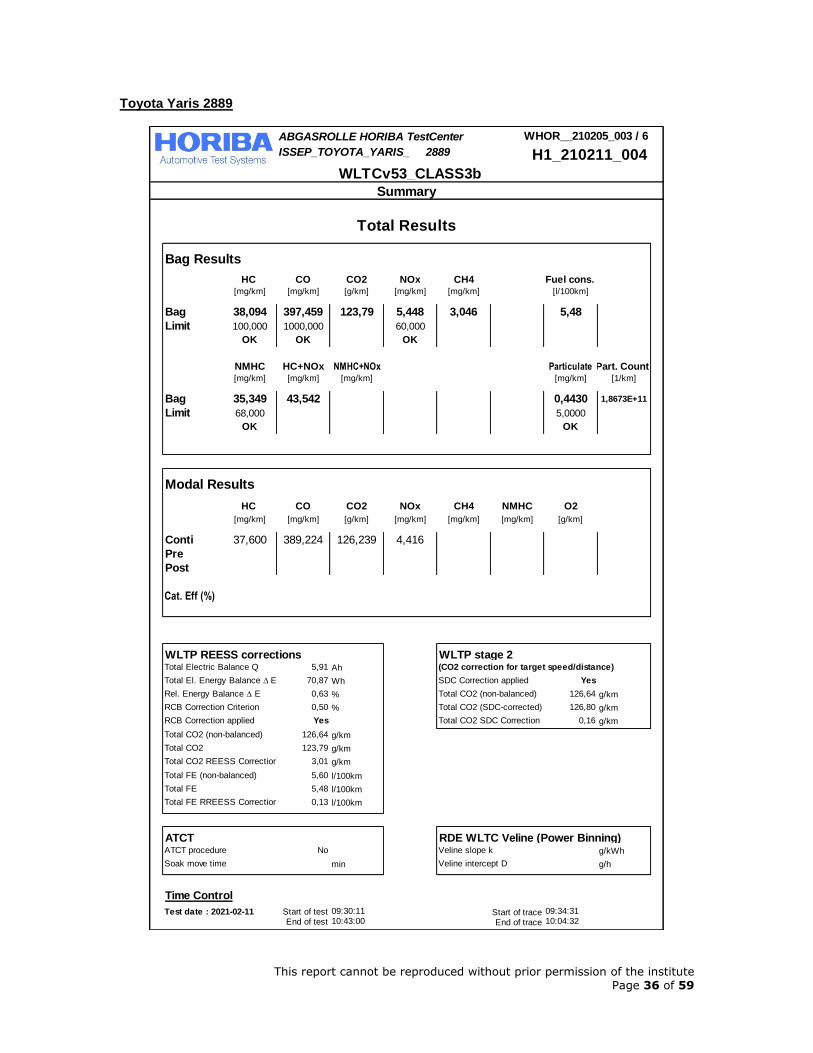
Toyota Yaris 2889
ABGASROLLE HORIBA TestCenter WHOR__210205_003 / 6
ISSEP_TOYOTA_YARIS_ 20 2889 H1_210211_004
WLTCv53_CLASS3b
Bag Results
HC CO CO2 NOx CH4 Fuel cons.[mg/km] [mg/km] [g/km] [mg/km] [mg/km] [l/100km]
Bag 38,094 397,459 123,79 5,448 3,046 5,48
Limit 100,000 1000,000 60,000
OK OK OK
NMHC HC+NOx NMHC+NOx Particulate Part. Count[mg/km] [mg/km] [mg/km] [mg/km] [1/km]
Bag 35,349 43,542 0,4430 1,8673E+11
Limit 68,000 5,0000
OK OK
Modal Results
HC CO CO2 NOx CH4 NMHC O2
[mg/km] [mg/km] [g/km] [mg/km] [mg/km] [mg/km] [g/km]
Conti 37,600 389,224 126,239 4,416
Pre
Post
Cat. Eff (%)
WLTP REESS corrections WLTP stage 2Total Electric Balance Q 5,91 Ah (CO2 correction for target speed/distance)
Total El. Energy Balance D E 70,87 Wh SDC Correction applied Yes
Rel. Energy Balance D E 0,63 % Total CO2 (non-balanced) 126,64 g/km
RCB Correction Criterion 0,50 % Total CO2 (SDC-corrected) 126,80 g/km
RCB Correction applied Yes Total CO2 SDC Correction 0,16 g/km
Total CO2 (non-balanced) 126,64 g/km
Total CO2 123,79 g/km
Total CO2 REESS Correction 3,01 g/km
Total FE (non-balanced) 5,60 l/100km
Total FE 5,48 l/100km
Total FE RREESS Correction 0,13 l/100km
ATCT RDE WLTC Veline (Power Binning)ATCT procedure No Veline slope k g/kWh
Soak move time min Veline intercept D g/h
Time Control
Test date : 2021-02-11 Start of test Start of traceEnd of test End of trace
Summary
09:30:11 09:34:3110:43:00 10:04:32
Total Results
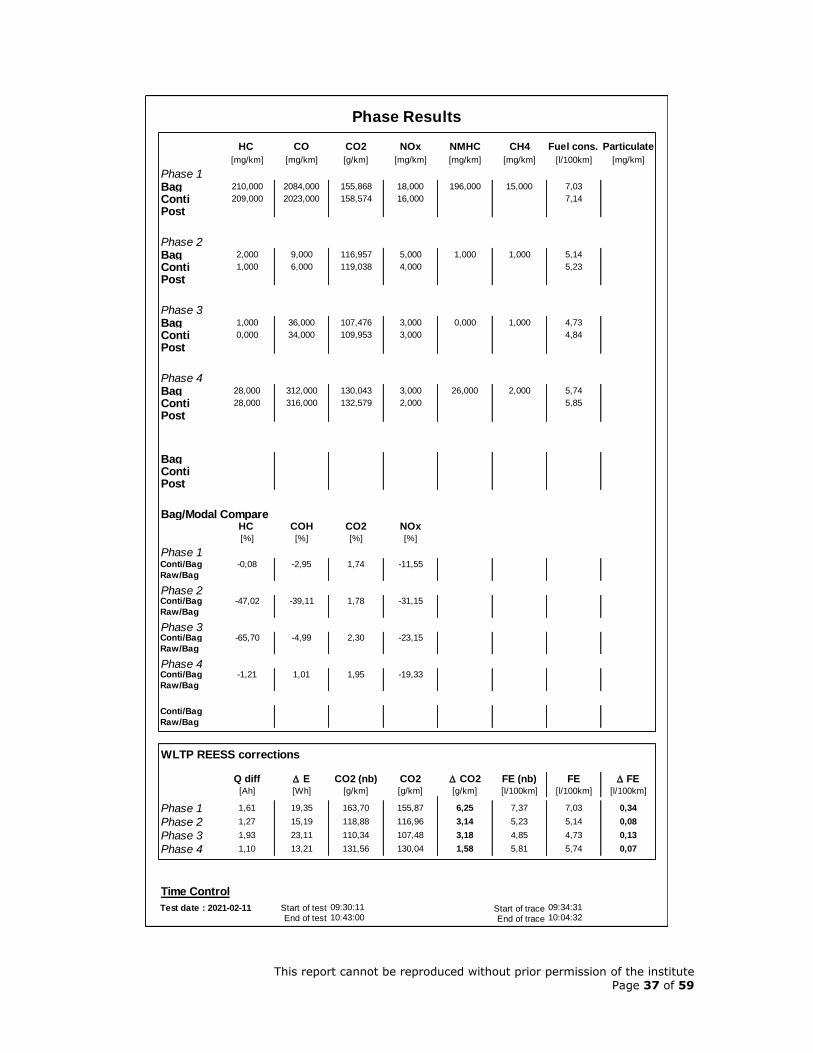
This report cannot be reproduced without prior permission of the institute Page 37 of 59
HC CO CO2 NOx NMHC CH4 Fuel cons. Particulate
[mg/km] [mg/km] [g/km] [mg/km] [mg/km] [mg/km] [l/100km] [mg/km]
Phase 1Bag 210,000 2084,000 155,868 18,000 196,000 15,000 7,03
Conti 209,000 2023,000 158,574 16,000 7,14
Post
Phase 2Bag 2,000 9,000 116,957 5,000 1,000 1,000 5,14
Conti 1,000 6,000 119,038 4,000 5,23
Post
Phase 3Bag 1,000 36,000 107,476 3,000 0,000 1,000 4,73
Conti 0,000 34,000 109,953 3,000 4,84
Post
Phase 4Bag 28,000 312,000 130,043 3,000 26,000 2,000 5,74
Conti 28,000 316,000 132,579 2,000 5,85
Post
BagConti Post
Bag/Modal CompareHC COH CO2 NOx[%] [%] [%] [%]
Phase 1Conti/Bag -0,08 -2,95 1,74 -11,55
Raw/Bag
Phase 2Conti/Bag -47,02 -39,11 1,78 -31,15
Raw/Bag
Phase 3Conti/Bag -65,70 -4,99 2,30 -23,15
Raw/Bag
Phase 4Conti/Bag -1,21 1,01 1,95 -19,33
Raw/Bag
Conti/Bag
Raw/Bag
WLTP REESS corrections
Q diff D E CO2 (nb) CO2 D CO2 FE (nb) FE D FE[Ah] [Wh] [g/km] [g/km] [g/km] [l/100km] [l/100km] [l/100km]
Phase 1 1,61 19,35 163,70 155,87 6,25 7,37 7,03 0,34
Phase 2 1,27 15,19 118,88 116,96 3,14 5,23 5,14 0,08
Phase 3 1,93 23,11 110,34 107,48 3,18 4,85 4,73 0,13
Phase 4 1,10 13,21 131,56 130,04 1,58 5,81 5,74 0,07
Time Control
Test date : 2021-02-11 Start of test Start of traceEnd of test End of trace
09:30:11 09:34:3110:43:00 10:04:32
Phase Results
This report cannot be reproduced without prior permission of the institute Page 38 of 59
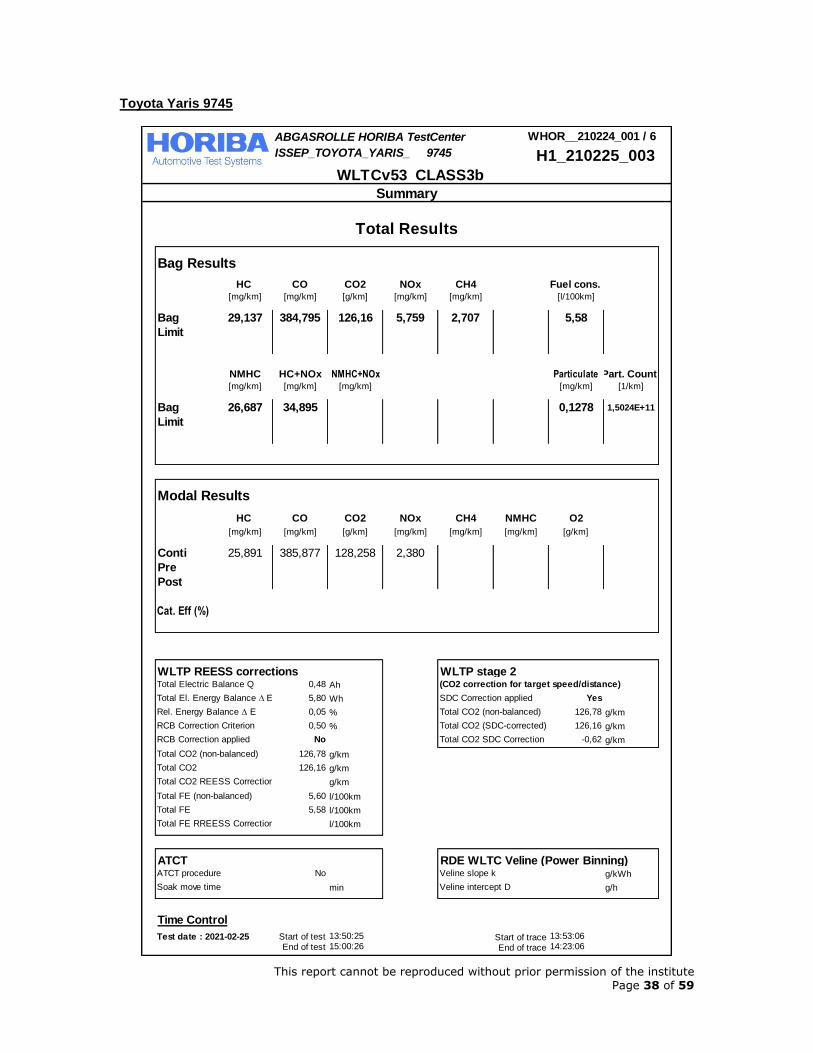
Toyota Yaris 9745
ABGASROLLE HORIBA TestCenter WHOR__210224_001 / 6
ISSEP_TOYOTA_YARIS_ 19 9745 H1_210225_003
WLTCv53_CLASS3b
Bag Results
HC CO CO2 NOx CH4 Fuel cons.[mg/km] [mg/km] [g/km] [mg/km] [mg/km] [l/100km]
Bag 29,137 384,795 126,16 5,759 2,707 5,58
Limit
NMHC HC+NOx NMHC+NOx Particulate Part. Count[mg/km] [mg/km] [mg/km] [mg/km] [1/km]
Bag 26,687 34,895 0,1278 1,5024E+11
Limit
Modal Results
HC CO CO2 NOx CH4 NMHC O2
[mg/km] [mg/km] [g/km] [mg/km] [mg/km] [mg/km] [g/km]
Conti 25,891 385,877 128,258 2,380
Pre
Post
Cat. Eff (%)
WLTP REESS corrections WLTP stage 2Total Electric Balance Q 0,48 Ah (CO2 correction for target speed/distance)
Total El. Energy Balance D E 5,80 Wh SDC Correction applied Yes
Rel. Energy Balance D E 0,05 % Total CO2 (non-balanced) 126,78 g/km
RCB Correction Criterion 0,50 % Total CO2 (SDC-corrected) 126,16 g/km
RCB Correction applied No Total CO2 SDC Correction -0,62 g/km
Total CO2 (non-balanced) 126,78 g/km
Total CO2 126,16 g/km
Total CO2 REESS Correction g/km
Total FE (non-balanced) 5,60 l/100km
Total FE 5,58 l/100km
Total FE RREESS Correction l/100km
ATCT RDE WLTC Veline (Power Binning)ATCT procedure No Veline slope k g/kWh
Soak move time min Veline intercept D g/h
Time Control
Test date : 2021-02-25 Start of test Start of traceEnd of test End of trace
Summary
13:50:25 13:53:0615:00:26 14:23:06
Total Results
This report cannot be reproduced without prior permission of the institute Page 39 of 59
HC CO CO2 NOx NMHC CH4 Fuel cons. Particulate
[mg/km] [mg/km] [g/km] [mg/km] [mg/km] [mg/km] [l/100km] [mg/km]
Phase 1Bag 183,000 2169,000 158,560 23,000 170,000 15,000 7,15
Conti 175,000 2125,000 161,127 15,000 7,25
Post
Phase 2Bag 2,000 10,000 121,767 5,000 1,000 1,000 5,35
Conti 0,000 14,000 123,502 0,000 5,43
Post
Phase 3Bag 1,000 40,000 110,657 3,000 1,000 0,000 4,87
Conti 0,000 45,000 112,329 0,000 4,94
Post
Phase 4Bag 12,000 236,000 130,095 2,000 11,000 1,000 5,74
Conti 8,000 248,000 132,587 0,000 5,85
Post
BagConti Post
Bag/Modal CompareHC COH CO2 NOx[%] [%] [%] [%]
Phase 1Conti/Bag -4,24 -2,01 1,62 -34,54
Raw/Bag
Phase 2Conti/Bag -91,86 43,83 1,43 -90,53
Raw/Bag
Phase 3Conti/Bag -100,00 13,61 1,51 -85,51
Raw/Bag
Phase 4Conti/Bag -36,73 5,13 1,92 -81,83
Raw/Bag
Conti/Bag
Raw/Bag
WLTP REESS corrections
Q diff D E CO2 (nb) CO2 D CO2 FE (nb) FE D FE[Ah] [Wh] [g/km] [g/km] [g/km] [l/100km] [l/100km] [l/100km]
Phase 1 0,35 4,18 162,93 158,56 7,34 7,15
Phase 2 0,09 1,04 120,14 121,77 5,28 5,35
Phase 3 0,04 0,50 110,39 110,66 4,86 4,87
Phase 4 0,01 0,07 131,37 130,10 5,79 5,74
Time Control
Test date : 2021-02-25 Start of test Start of traceEnd of test End of trace
13:50:25 13:53:0615:00:26 14:23:06
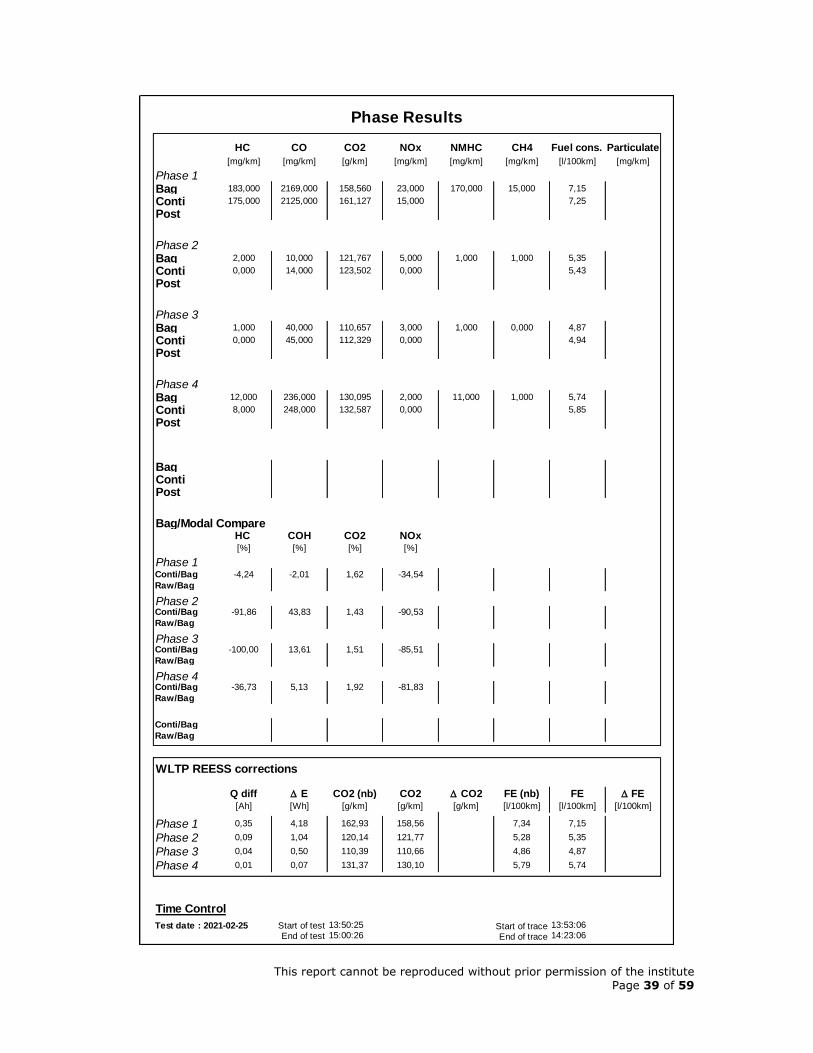
Phase Results
This report cannot be reproduced without prior permission of the institute Page 40 of 59
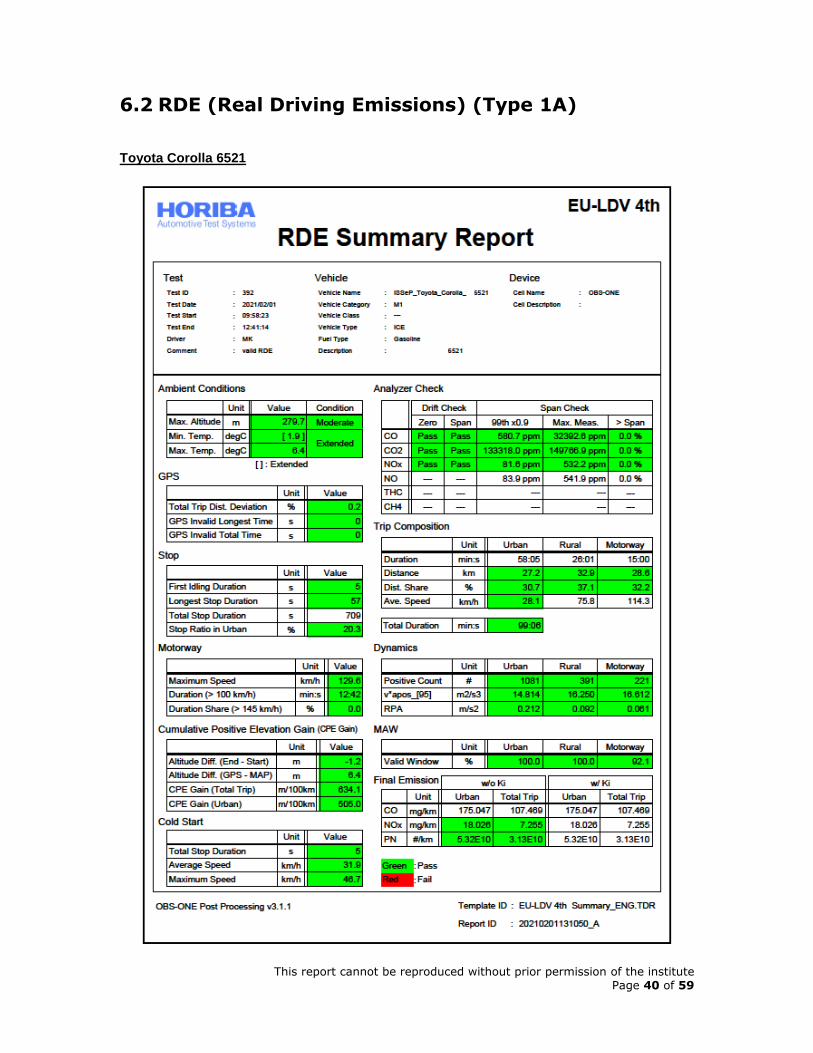
6.2 RDE (Real Driving Emissions) (Type 1A)
Toyota Corolla 6521
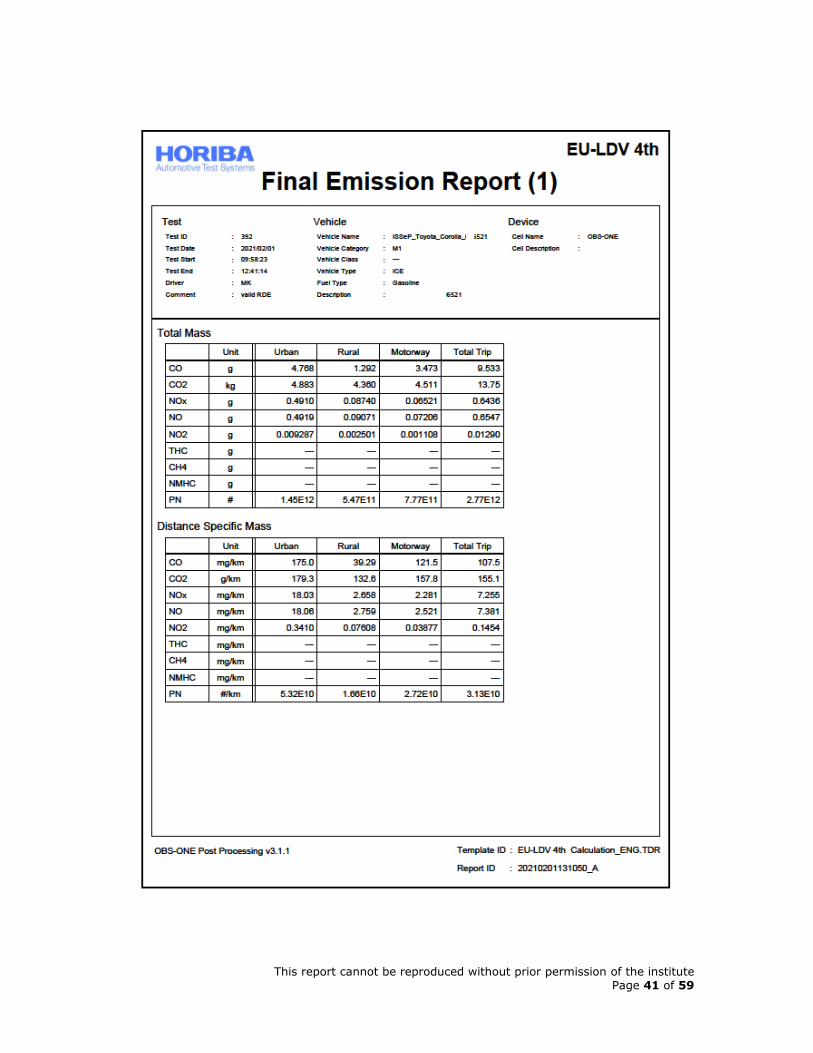
This report cannot be reproduced without prior permission of the institute Page 41 of 59
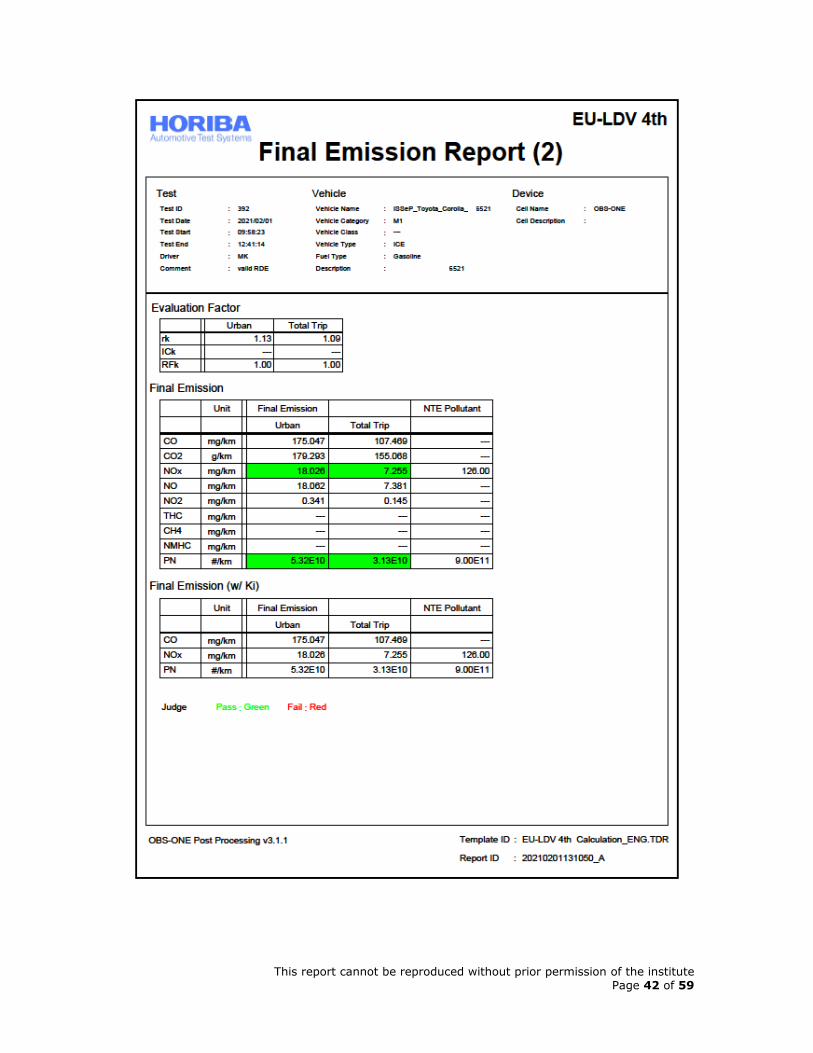
This report cannot be reproduced without prior permission of the institute Page 42 of 59
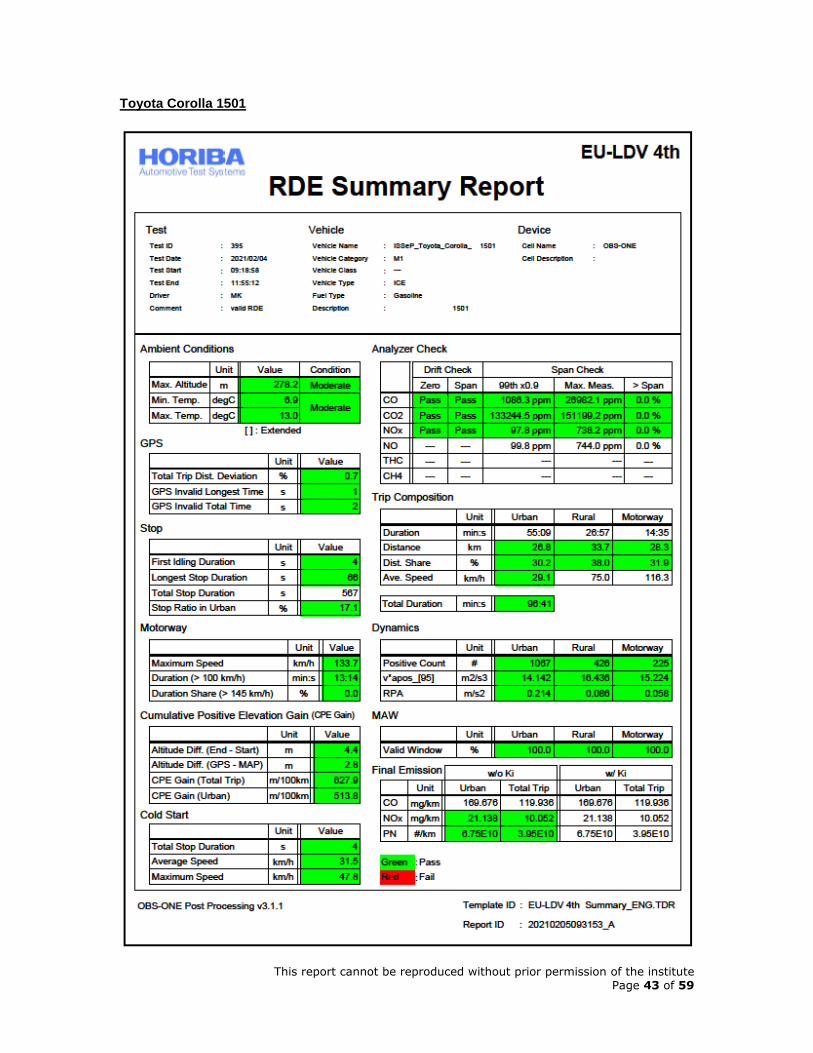
This report cannot be reproduced without prior permission of the institute Page 43 of 59
Toyota Corolla 1501
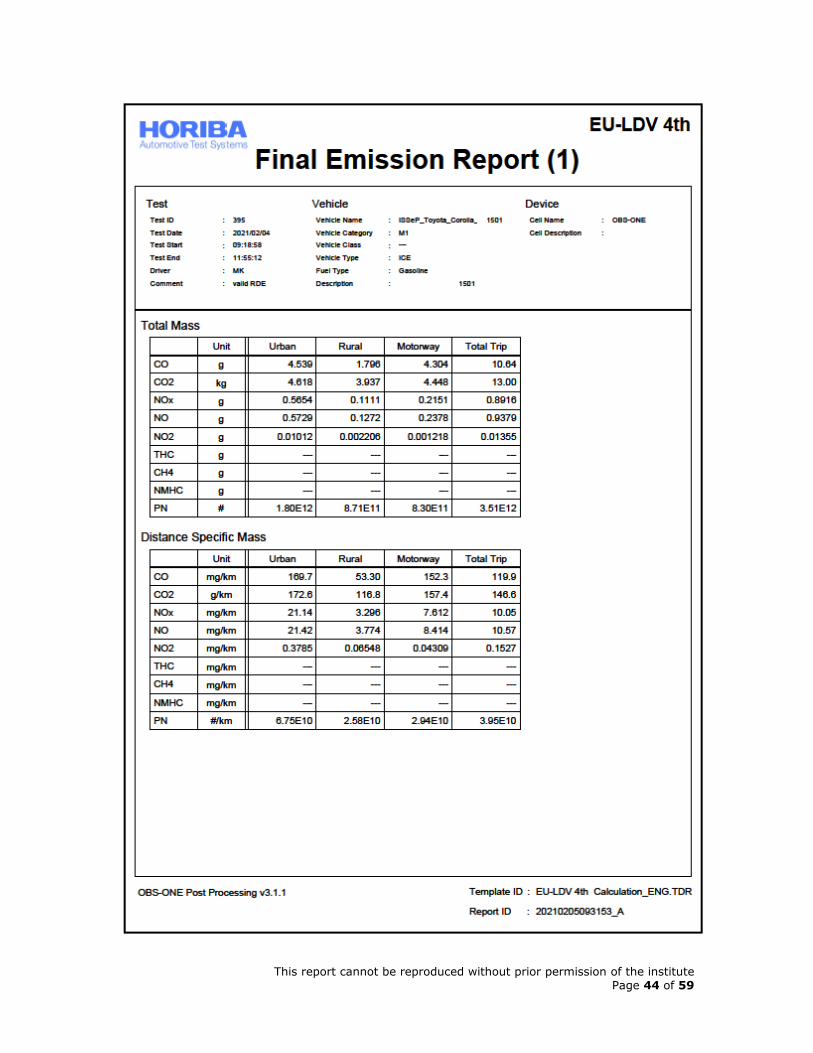
This report cannot be reproduced without prior permission of the institute Page 44 of 59
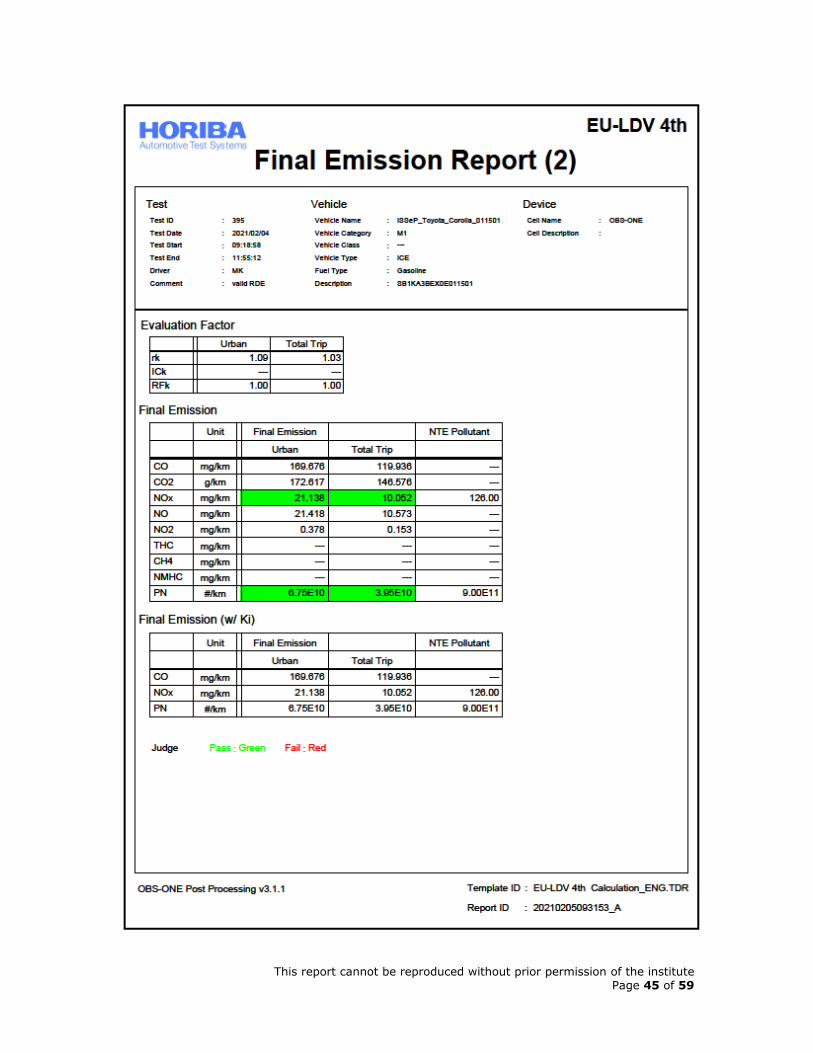
This report cannot be reproduced without prior permission of the institute Page 45 of 59

This report cannot be reproduced without prior permission of the institute Page 46 of 59
Toyota Corolla 7243
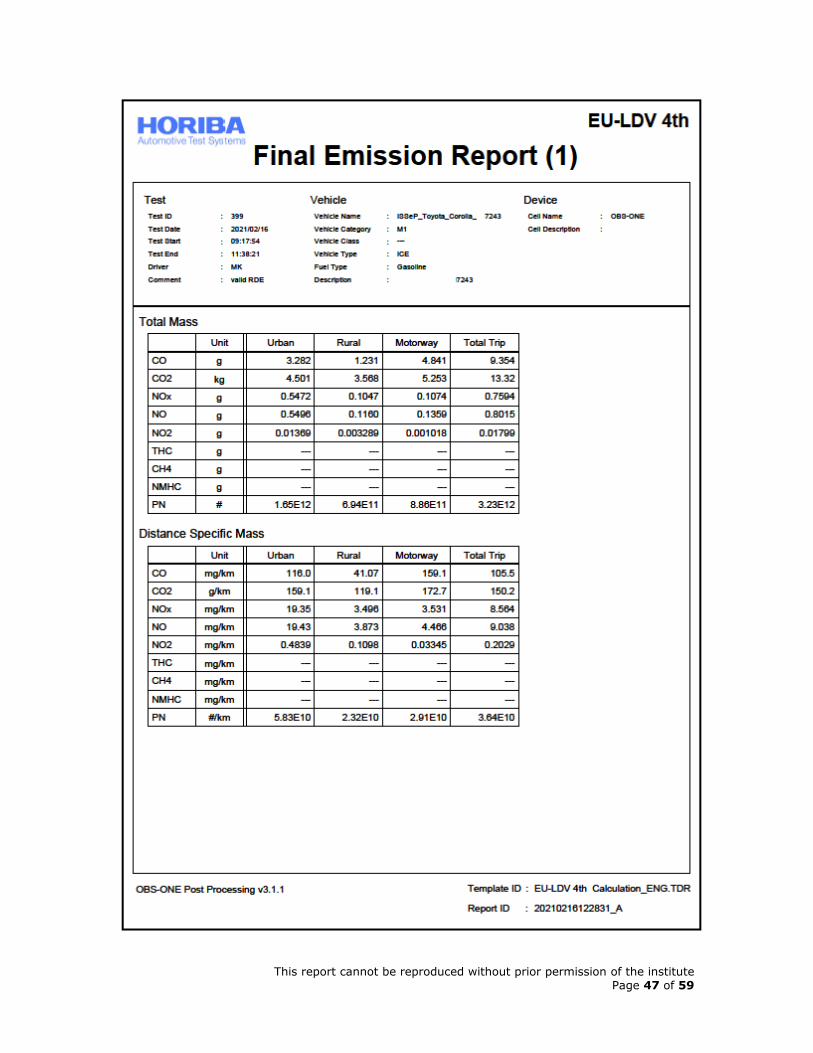
This report cannot be reproduced without prior permission of the institute Page 47 of 59
This report cannot be reproduced without prior permission of the institute Page 48 of 59

This report cannot be reproduced without prior permission of the institute Page 49 of 59
Toyota Yaris 2856
This report cannot be reproduced without prior permission of the institute Page 50 of 59
This report cannot be reproduced without prior permission of the institute Page 51 of 59

This report cannot be reproduced without prior permission of the institute Page 52 of 59
Toyota Yaris 2889
This report cannot be reproduced without prior permission of the institute Page 53 of 59
This report cannot be reproduced without prior permission of the institute Page 54 of 59

This report cannot be reproduced without prior permission of the institute Page 55 of 59
Toyota Yaris 2745
This report cannot be reproduced without prior permission of the institute Page 56 of 59
This report cannot be reproduced without prior permission of the institute Page 57 of 59
This report cannot be reproduced without prior permission of the institute Page 58 of 59
7 Lessons learned during the testing campaign
It results from the testing campaign that all vehicles comply with the regulation and are in good
working order.
All measuring instruments work properly and are calibrated and standardised according to the
manufacturer’s requirements.
In order to be even more efficient and anticipate an issue as quickly as possible, it is
recommendable to do the inspections on the vehicles as soon as they are delivered at the
laboratory to be sure that they comply with the regulation and are suitable to ISC testing (km,
maintenance, …).
8 General information
As presented at the beginning of the report, ISSeP is the environmental sentinel organized around
4 major pillars:
- Environment monitoring
- Risks and nuisances prevention
- Reference laboratory
- Research and development
Environmental metrology is of vital importance for understanding changes to the earth and its
climate. The well-being and safety of future generations depends on the decisions made concerned
environmental policies. To define the best actions, decision-makers, companies, and citizens must
receive reliable and regular information. Thanks to its experience and efficiency in the
environmental sector and in risk management, the ISSeP contributes to improving our environment.
It has a workforce of approx. 300 people distributed over two sites: Liège, where its head office is
located, and Colfontaine.
ISSeP is the Walloon reference laboratory specialized in environmental monitoring (i.e. water, air,
soil, sediments and waste) and risk assessment and prevention. ISSeP draws on the scientific
expertise from various area of expertise, from field sampling, lab analysis, numerical modelling,
geostatistical analysis to Earth observation.
Environmental monitoring activities rely on a 30-person team for samples collection and on 4
analytical laboratories in mineral chemistry, organic chemistry, microbiology and ecotoxicology.
These monitoring activities cover ambient air quality network, 53 industrial facilities pollutants
emissions control, the physicochemical, microbiological and ecotoxicological analysis of surface
and groundwater as well as sediments, contaminated sites analysis and landfill sites monitoring.
Whilst ISSeP’s missions were firstly confined to providing environmental characterization data, its
missions now have evolved to run forecasts and assess accidental and chronic risks (i.e. asbestos,
electromagnetic fields...). Our risk assessment studies tackle impact assessment on ecosystems,
with for instance fish and invertebrates monitored in the BIOTE network, as well as human health
exposure through biomonitoring projects and geostatistical approaches. ISSeP skills have also
evolved, with for instance land use change monitoring by earth observation methods. ISSeP
experts are also supporting the sectors in which waste is destined to become a resource.
Contents
1 About HORIBA Technical Service .......................................................................................... 4
2 Summary / Lessons learned ................................................................................................ 4
3 Scope of testing ............................................................................................................... 4
3.1 Vehicle sample ........................................................................................................... 4
3.2 Description of the measurement campaign .......................................................................... 8
3.2.1 Vehicle inspection ................................................................................................ 9
3.2.2 Vehicle owner interview ......................................................................................... 9
3.2.3 PEMS installation in the vehicle ................................................................................ 9
3.2.4 Testing schedule ............................................................................................... 10
4 Summary of Results ........................................................................................................ 12
4.1 WLTC on Chassis-Dyno (Type 1) ................................................................................... 12
4.1.1 TOYOTA Corolla ............................................................................................... 12
4.1.2 TOYOTA Yaris .................................................................................................. 14
4.2 PEMS validation on Chassis-Dyno .................................................................................. 17
4.3 Real Driving Emissions (Type 1A) .................................................................................. 19
4.3.1 RDE Testing route (characteristics and driving dynamics) ............................................... 19
4.3.2 RDE Final Emission Results .................................................................................. 23
4
1 About HORIBA Technical Service The HORIBA Europe GmbH Testcenter in 61440 Oberursel is designated as technical service
category A, B and D by the Kraftfahrt-Bundesamt (KBA) and complies with EN ISO/IEC 17025:2017
and EN ISO/IEC 17020:2012. The designation is valid from 19th December 2015.
Registration number: KBA-P 00071-15
The catalogue of designated and recognized testing methods contains emission measurement
complying to Regulation (EC) 715/2007, Regulation (EC) 2018/1832 including Regulation (EC)
692/2008, UN-R 83 Series 07 (Spark-ignition engine), UN-R 101 Series 01, UN-R 83 Series 07
(Compression-ignition engine) and fuel consumption measurement complying to UN-R 84.
2 Summary / Lessons learned During the measurement campaign six vehicles from the manufacturer TOYOTA (Corolla Gasoline
and Yaris Gasoline) have been tested within the scope of In-Service Conformity. Detailed
descriptions of the vehicles are summarized in Table 1 List of vehicles.
During the test period all vehicles performed a valid Type 1 (WLTP) as well as a valid Type 1A
(RDE) test according to ISC regulations.
The tested vehicles have fulfilled all requirements to an In-Service Conformity test and the final
emission results were below the Not-to-exceed limits given by ISC regulation.
Detailed description of the scope of testing as well as a summarization of the final results can be
found on the following pages.
3 Scope of testing
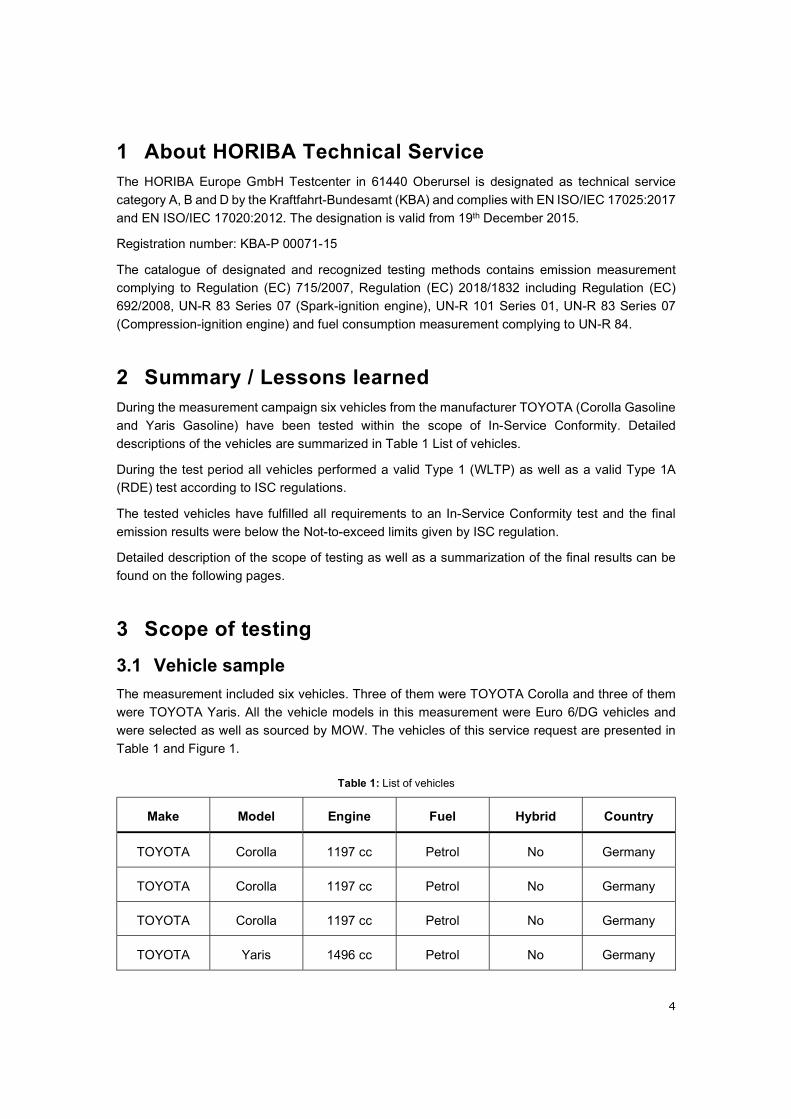
3.1 Vehicle sample
The measurement included six vehicles. Three of them were TOYOTA Corolla and three of them
were TOYOTA Yaris. All the vehicle models in this measurement were Euro 6/DG vehicles and
were selected as well as sourced by MOW. The vehicles of this service request are presented in
Table 1 and Figure 1.
Table 1: List of vehicles
Make Model Engine Fuel Hybrid Country
TOYOTA Corolla 1197 cc Petrol No Germany
TOYOTA Corolla 1197 cc Petrol No Germany
TOYOTA Corolla 1197 cc Petrol No Germany
TOYOTA Yaris 1496 cc Petrol No Germany
5
TOYOTA Yaris 1496 cc Petrol No Germany
TOYOTA Yaris 1496 cc Petrol No Germany
Figure 1: TOYOTA Corolla tested vehicles
Detailed specifications of the vehicle (as given in the EC Certificate of Conformity) are presented
in Table 2.
Table 2: Detailed vehicle data.
Model TOYOTA Corolla TOYOTA Corolla TOYOTA Corolla
VIN 6521 1501 7243
Vehicle category M1 M1 M1
PEMS family code 6-JT1-22-0 6-JT1-22-0 6-JT1-22-0
PCM cal id 896630ZK1000 896650221000
896630ZK1000 896650221000
896630ZK1000 896650221000
Max. Power 85kW at
5200 - 5600 min-1
85kW at
5200 - 5600 min-1
85kW at
5200 - 5600 min-1
Displacement 1197 cc 1197 cc 1197 cc
Fuel type Petrol Petrol Petrol
Bodywork Hatchback Hatchback Hatchback
Doors 5 5 5
Transmission Manual Manual Manual
Gears 6 Gears 6 Gears 6 Gears
Tyre weather type Winter Winter Winter
6
Tyre make BFGoodrich Falken BFGoodrich
Tyre model g-Grip All Season Euroall Season
AS210 g-Grip All Season
Tyre width Front: 205/55 R16
Rear: 205/55 R16
Front: 205/55 R16
Rear: 205/55 R16
Front: 205/55 R16
Rear: 205/55 R16
Tyre depth 6.0mm/7.0mm 6.0mm/7.0mm 6.0mm/7.0mm
Tyre test pressure 2.5bar/2.4bar 2.5bar/2.4bar 2.5bar/2.4bar
Official low CO2 183g/km 183g/km 183g/km
Official medium CO2 142g/km 142g/km 142g/km
Official high CO2 123g/km 123g/km 123g/km
Official extra high CO2 144g/km 144g/km 144g/km
Official combined CO2 142g/km 142g/km 142g/km
Maximum laden mass 1820kg 1820kg 1820kg
Official mass in running
order 1315kg 1315kg 1315kg
Weight with PEMS 1548kg 1550kg 1550kg
Mileage 19074km 23072km 15448km
Date of first registration 29/11/2019 12/12/2019 27/11/2019
Emission standard Euro 6/DG Euro 6/DG Euro 6/DG
Country of registration Germany Germany Germany
Engine code 8NR 8NR 8NR
Drive axle FWD FWD FWD
Wheelbase 2640mm 2640mm 2640mm
Injection Direct injection Direct injection Direct injection
Turbo Charged Yes Yes Yes
EGR Yes Yes Yes
Particulate Filter GPF GPF GPF
Catalyst 3-way-catalyst 3-way-catalyst 3-way-catalyst
7
Figure 2: TOYOTA Yaris tested vehicles
Detailed specifications of the vehicle (as given in the EC Certificate of Conformity) are presented
in Table 3.
Table 3: Detailed vehicle data.
Model TOYOTA Yaris TOYOTA Yaris TOYOTA Yaris
VIN 2856 2889 9745
Vehicle category M1 M1 M1
PEMS family code 6-JT1-35-0 6-JT1-35-0 6-JT1-35-0
PCM cal id 30DX1100
A0202000
30DX1100
A0202000
30DX1100
A0202000
Max. Power 82kW at 6000 min-1 82kW at 6000 min-1 82kW at 6000 min-1
Displacement 1496 cc 1496 cc 1496 cc
Fuel type Petrol Petrol Petrol
Bodywork Hatchback Hatchback Hatchback
Doors 5 5 5
Transmission Manual Manual Manual
Gears 6 Gears 6 Gears 6 Gears
Tyre weather type Winter Winter Winter
Tyre make Goodyear Goodyear Goodyear
Tyre model Vector 4 Seasons Vector 4 Seasons Vector 4 Seasons
Tyre width Front: 175/65 R15
Rear: 175/65 R15
Front: 175/65 R15
Rear: 175/65 R15
Front: 175/65 R15
Rear: 175/65 R15
Tyre depth 7.0mm/8.0mm 6.5mm/7.5mm 7.0mm/7.5mm
8
Tyre test pressure 2.3bar/2.2bar 2.3bar/2.2bar 2.3bar/2.2bar
Official low CO2 178g/km 178g/km 178g/km
Official medium CO2 132g/km 132g/km 132g/km
Official high CO2 118g/km 118g/km 118g/km
Official extra high CO2 138g/km 138g/km 138g/km
Official combined CO2 136g/km 136g/km 136g/km
Maximum laden mass 1545kg 1545kg 1545kg
Official mass in running
order 1120kg 1120kg 1120kg
Weight with PEMS 1262kg 1272kg 1266kg
Mileage 16585km 25837km 15051km
Date of first registration 18/05/2020 18/05/2020 18/05/2020
Emission standard Euro 6/DG Euro 6/DG Euro 6/DG
Country of registration Germany Germany Germany
Engine code 2NR 2NR 2NR
Drive axle FWD FWD FWD
Wheelbase 2510mm 2510mm 2510mm
Injection manifold injection manifold injection manifold injection
Turbo Charged No No No
EGR Yes Yes Yes
Particulate Filter No No No
Catalyst 3-way-catalyst 3-way-catalyst 3-way-catalyst
3.2 Description of the measurement campaign
The measurement concerned the evaluation of emissions performance of the vehicle mentioned
above. The service request included the following tasks performed for this vehicle:
Vehicle inspection before testing
Vehicle Owner interview
WLTC (Type 1) on chassis-dyno
9
PEMS installation in the vehicle
PEMS validation
RDE testing (Type 1A)
3.2.1 Vehicle inspection
Before starting the emission measurement tests, the vehicle was inspected for damages,
modifications, other incompliances and was checked for being in good running order. The exact
vehicle inspection checklist which is taken from RDE Regulation 2018/1832 is presented in Table
4.
Table 4: Vehicle inspection checklist.
Aerodynamic modifications Fuel tank level Warning lights activated SCR light activated Next scheduled maintenance Fluid levels Drive belt and cooler cover Air filter and oil contamination Ignition cables
Injection valves/cabling Vacuum hoses and electrical
wiring Exhaust system Exhaust system components EGR, Catalyst, Particle Filter Wheels Fuel Sample Safety conditions Semi-trailer OBD error checks
The results of each check were documented with photos and/or relevant documentation.
Additionally a fuel- and oil- sample was collected and stored.
3.2.2 Vehicle owner interview
The physical owner of each vehicle was interviewed in order to understand the past usage of the
vehicle under testing. The questions are taken from RDE Regulation 2018/1832.
3.2.3 PEMS installation in the vehicle
A complete Horiba OBS-ONE PEMS was properly installed in the tested vehicle. The equipment
included NDIR gas analyzers which measured CO and CO2, heated CLD gas analyzers which
measured NO and NOx and a CPC counter which measured PN. Altitude, velocity and location
coordinates were measured using an on-board GPS device, whereas ambient temperature,
humidity and pressure, along with tailpipe exhaust gas temperature, were measured using
respective sensors. In addition, various engine-related signals were recorded from the On-Board
Diagnostics (OBD) port. The total exhaust flow was measured with a pitot EFM installed and
properly sealed at the exhaust tailpipe of the vehicle. A lead gel battery was used to power all
devices.
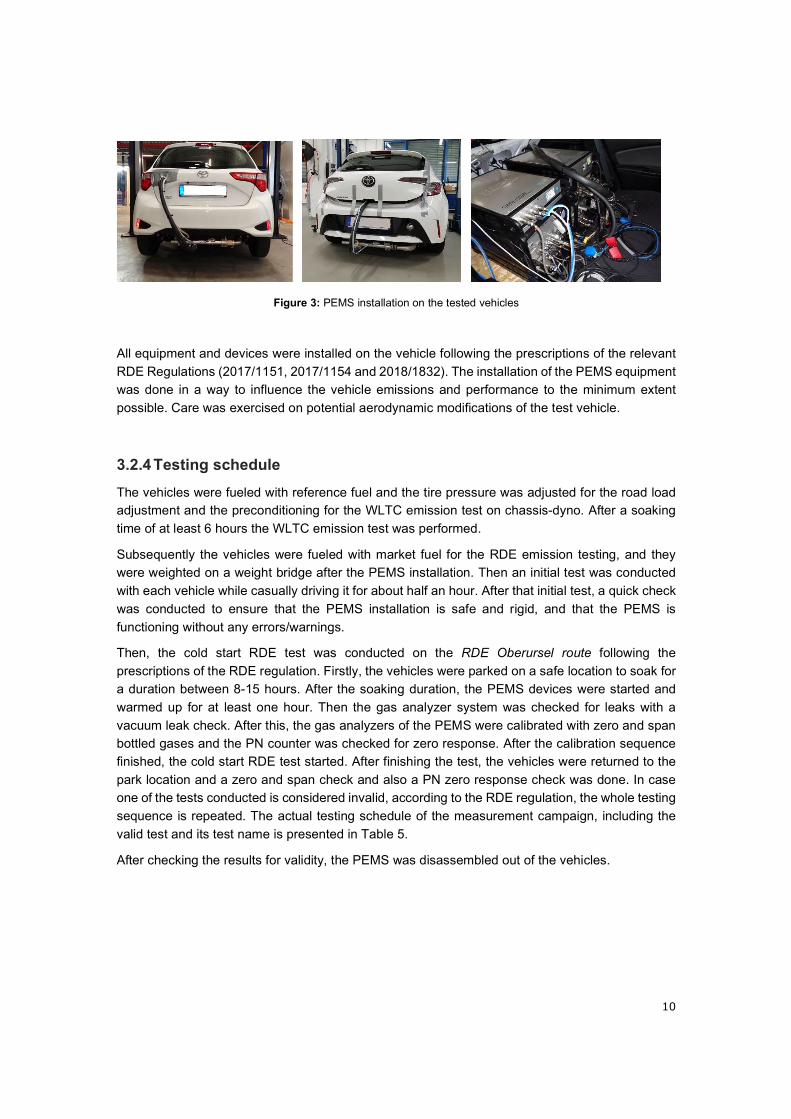
10
Figure 3: PEMS installation on the tested vehicles
All equipment and devices were installed on the vehicle following the prescriptions of the relevant
RDE Regulations (2017/1151, 2017/1154 and 2018/1832). The installation of the PEMS equipment
was done in a way to influence the vehicle emissions and performance to the minimum extent
possible. Care was exercised on potential aerodynamic modifications of the test vehicle.
3.2.4 Testing schedule
The vehicles were fueled with reference fuel and the tire pressure was adjusted for the road load adjustment and the preconditioning for the WLTC emission test on chassis-dyno. After a soaking
time of at least 6 hours the WLTC emission test was performed.
Subsequently the vehicles were fueled with market fuel for the RDE emission testing, and they
were weighted on a weight bridge after the PEMS installation. Then an initial test was conducted
with each vehicle while casually driving it for about half an hour. After that initial test, a quick check
was conducted to ensure that the PEMS installation is safe and rigid, and that the PEMS is
functioning without any errors/warnings.
Then, the cold start RDE test was conducted on the RDE Oberursel route following the
prescriptions of the RDE regulation. Firstly, the vehicles were parked on a safe location to soak for
a duration between 8-15 hours. After the soaking duration, the PEMS devices were started and
warmed up for at least one hour. Then the gas analyzer system was checked for leaks with a
vacuum leak check. After this, the gas analyzers of the PEMS were calibrated with zero and span
bottled gases and the PN counter was checked for zero response. After the calibration sequence
finished, the cold start RDE test started. After finishing the test, the vehicles were returned to the
park location and a zero and span check and also a PN zero response check was done. In case
one of the tests conducted is considered invalid, according to the RDE regulation, the whole testing
sequence is repeated. The actual testing schedule of the measurement campaign, including the
valid test and its test name is presented in Table 5.
After checking the results for validity, the PEMS was disassembled out of the vehicles.
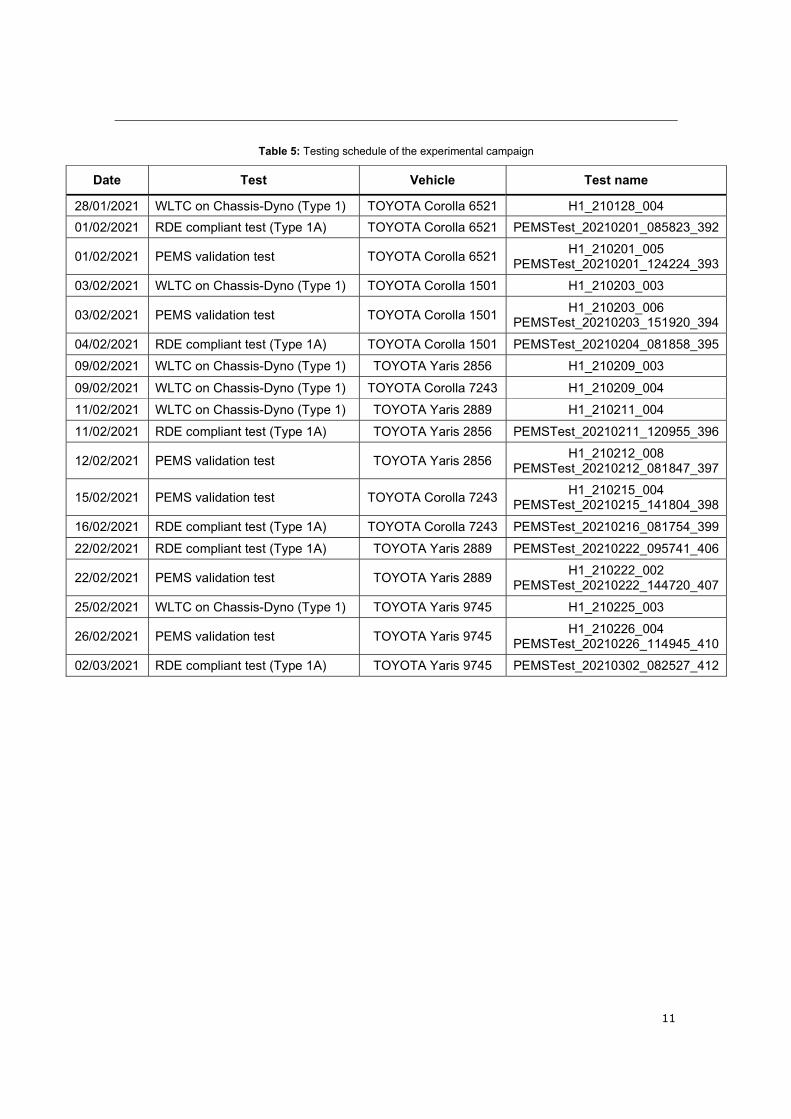
11
Table 5: Testing schedule of the experimental campaign
Date Test Vehicle Test name
28/01/2021 WLTC on Chassis-Dyno (Type 1) TOYOTA Corolla 6521 H1_210128_004
01/02/2021 RDE compliant test (Type 1A) TOYOTA Corolla 6521 PEMSTest_20210201_085823_392
01/02/2021 PEMS validation test TOYOTA Corolla 6521 H1_210201_005
PEMSTest_20210201_124224_393
03/02/2021 WLTC on Chassis-Dyno (Type 1) TOYOTA Corolla 1501 H1_210203_003
03/02/2021 PEMS validation test TOYOTA Corolla 1501 H1_210203_006
PEMSTest_20210203_151920_394
04/02/2021 RDE compliant test (Type 1A) TOYOTA Corolla 1501 PEMSTest_20210204_081858_395
09/02/2021 WLTC on Chassis-Dyno (Type 1) TOYOTA Yaris 2856 H1_210209_003
09/02/2021 WLTC on Chassis-Dyno (Type 1) TOYOTA Corolla 7243 H1_210209_004
11/02/2021 WLTC on Chassis-Dyno (Type 1) TOYOTA Yaris 2889 H1_210211_004
11/02/2021 RDE compliant test (Type 1A) TOYOTA Yaris 2856 PEMSTest_20210211_120955_396
12/02/2021 PEMS validation test TOYOTA Yaris 2856 H1_210212_008
PEMSTest_20210212_081847_397
15/02/2021 PEMS validation test TOYOTA Corolla 7243 H1_210215_004
PEMSTest_20210215_141804_398
16/02/2021 RDE compliant test (Type 1A) TOYOTA Corolla 7243 PEMSTest_20210216_081754_399
22/02/2021 RDE compliant test (Type 1A) TOYOTA Yaris 2889 PEMSTest_20210222_095741_406
22/02/2021 PEMS validation test TOYOTA Yaris 2889 H1_210222_002
PEMSTest_20210222_144720_407
25/02/2021 WLTC on Chassis-Dyno (Type 1) TOYOTA Yaris 9745 H1_210225_003
26/02/2021 PEMS validation test TOYOTA Yaris 9745 H1_210226_004
PEMSTest_20210226_114945_410
02/03/2021 RDE compliant test (Type 1A) TOYOTA Yaris 9745 PEMSTest_20210302_082527_412
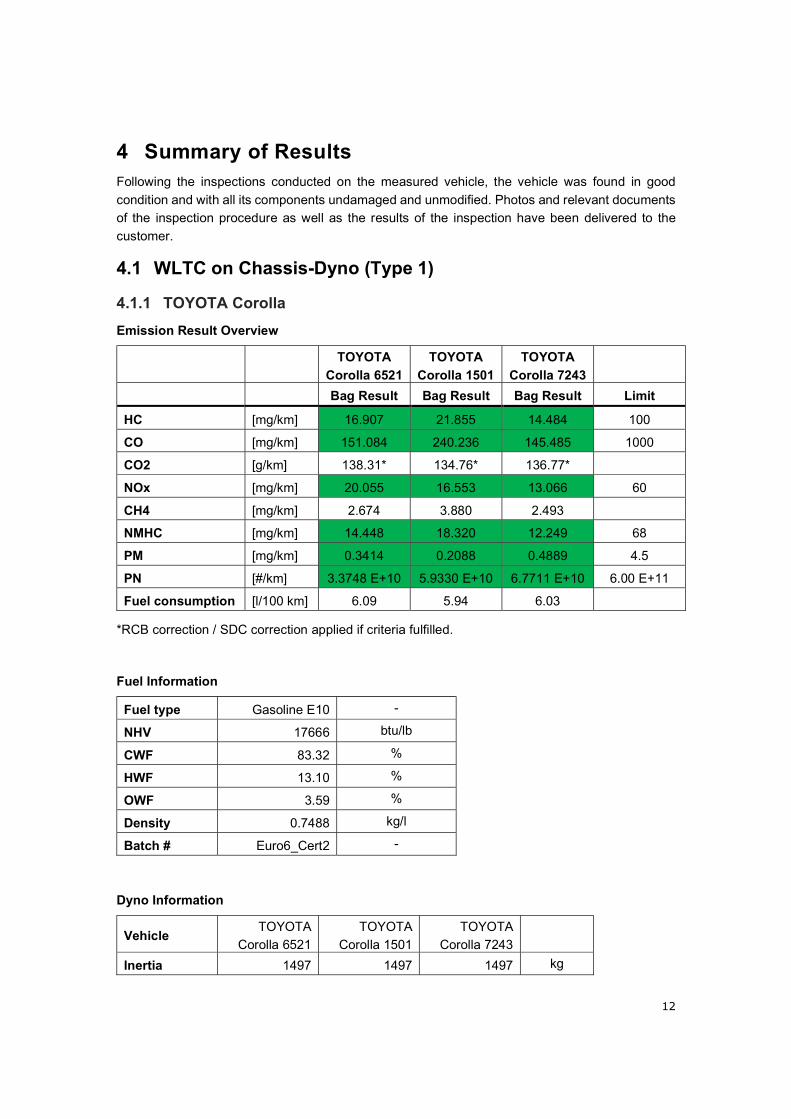
12
4 Summary of Results Following the inspections conducted on the measured vehicle, the vehicle was found in good
condition and with all its components undamaged and unmodified. Photos and relevant documents
of the inspection procedure as well as the results of the inspection have been delivered to the
customer.
4.1 WLTC on Chassis-Dyno (Type 1)
4.1.1 TOYOTA Corolla
Emission Result Overview
TOYOTA
Corolla 6521
TOYOTA
Corolla 1501
TOYOTA
Corolla 7243
Bag Result Bag Result Bag Result Limit
HC [mg/km] 16.907 21.855 14.484 100
CO [mg/km] 151.084 240.236 145.485 1000
CO2 [g/km] 138.31* 134.76* 136.77*
NOx [mg/km] 20.055 16.553 13.066 60
CH4 [mg/km] 2.674 3.880 2.493
NMHC [mg/km] 14.448 18.320 12.249 68
PM [mg/km] 0.3414 0.2088 0.4889 4.5
PN [#/km] 3.3748 E+10 5.9330 E+10 6.7711 E+10 6.00 E+11
Fuel consumption [l/100 km] 6.09 5.94 6.03
*RCB correction / SDC correction applied if criteria fulfilled.
Fuel Information
Fuel type Gasoline E10 -
NHV 17666 btu/lb
CWF 83.32 %
HWF 13.10 %
OWF 3.59 %
Density 0.7488 kg/l
Batch # Euro6_Cert2 -
Dyno Information
Vehicle TOYOTA
Corolla 6521
TOYOTA
Corolla 1501
TOYOTA
Corolla 7243
Inertia 1497 1497 1497 kg
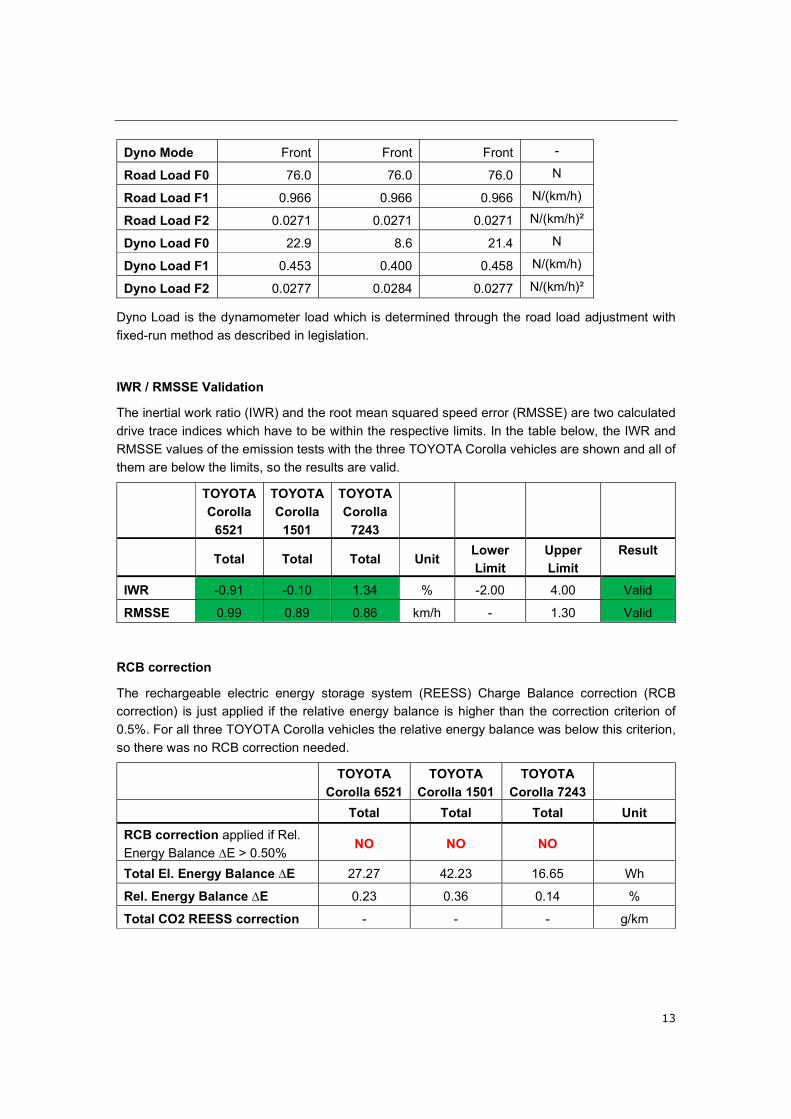
13
Dyno Mode Front Front Front -
Road Load F0 76.0 76.0 76.0 N
Road Load F1 0.966 0.966 0.966 N/(km/h)
Road Load F2 0.0271 0.0271 0.0271 N/(km/h)²
Dyno Load F0 22.9 8.6 21.4 N
Dyno Load F1 0.453 0.400 0.458 N/(km/h)
Dyno Load F2 0.0277 0.0284 0.0277 N/(km/h)²
Dyno Load is the dynamometer load which is determined through the road load adjustment with
fixed-run method as described in legislation.
IWR / RMSSE Validation
The inertial work ratio (IWR) and the root mean squared speed error (RMSSE) are two calculated
drive trace indices which have to be within the respective limits. In the table below, the IWR and
RMSSE values of the emission tests with the three TOYOTA Corolla vehicles are shown and all of
them are below the limits, so the results are valid.
TOYOTA
Corolla
6521
TOYOTA
Corolla
1501
TOYOTA
Corolla
7243
Total Total Total Unit Lower
Limit
Upper
Limit
Result
IWR -0.91 -0.10 1.34 % -2.00 4.00 Valid
RMSSE 0.99 0.89 0.86 km/h - 1.30 Valid
RCB correction
The rechargeable electric energy storage system (REESS) Charge Balance correction (RCB
correction) is just applied if the relative energy balance is higher than the correction criterion of
0.5%. For all three TOYOTA Corolla vehicles the relative energy balance was below this criterion,
so there was no RCB correction needed.
TOYOTA
Corolla 6521
TOYOTA
Corolla 1501
TOYOTA
Corolla 7243
Total Total Total Unit
RCB correction applied if Rel.
Energy Balance ∆E > 0.50% NO NO NO
Total El. Energy Balance ∆E 27.27 42.23 16.65 Wh
Rel. Energy Balance ∆E 0.23 0.36 0.14 %
Total CO2 REESS correction - - - g/km
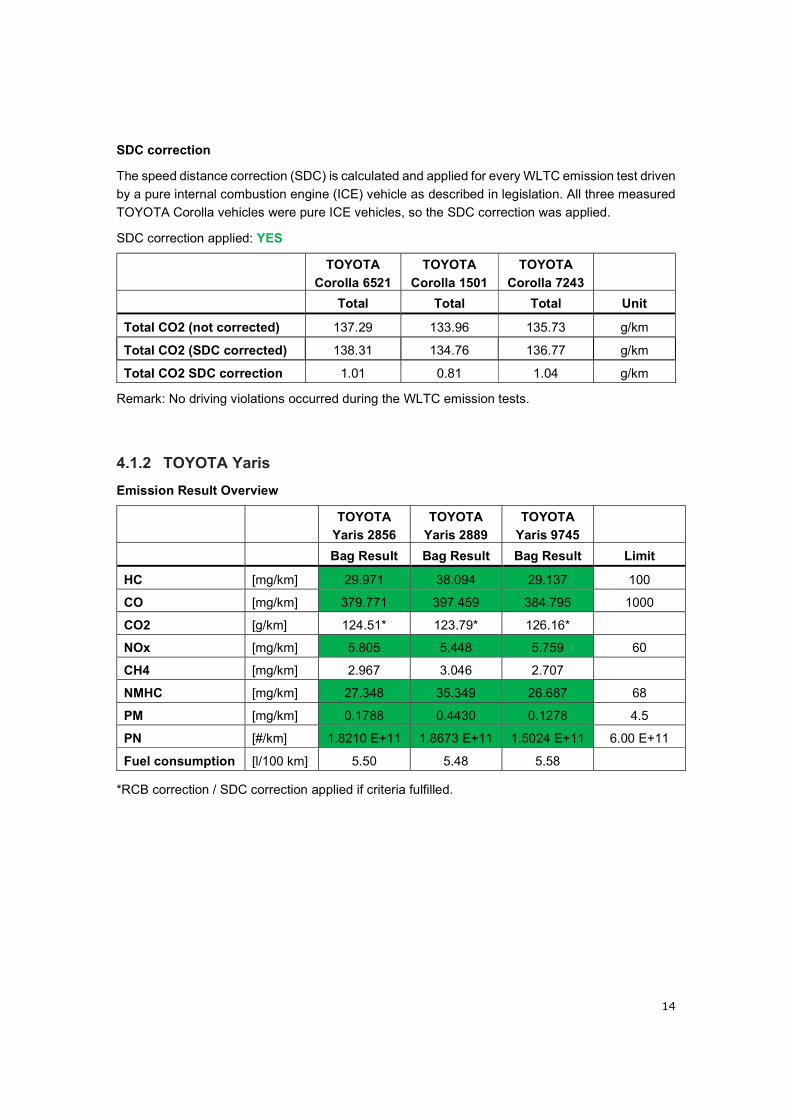
14
SDC correction
The speed distance correction (SDC) is calculated and applied for every WLTC emission test driven
by a pure internal combustion engine (ICE) vehicle as described in legislation. All three measured
TOYOTA Corolla vehicles were pure ICE vehicles, so the SDC correction was applied.
SDC correction applied: YES
TOYOTA
Corolla 6521
TOYOTA
Corolla 1501
TOYOTA
Corolla 7243
Total Total Total Unit
Total CO2 (not corrected) 137.29 133.96 135.73 g/km
Total CO2 (SDC corrected) 138.31 134.76 136.77 g/km
Total CO2 SDC correction 1.01 0.81 1.04 g/km
Remark: No driving violations occurred during the WLTC emission tests.
4.1.2 TOYOTA Yaris
Emission Result Overview
TOYOTA
Yaris 2856
TOYOTA
Yaris 2889
TOYOTA
Yaris 9745
Bag Result Bag Result Bag Result Limit
HC [mg/km] 29.971 38.094 29.137 100
CO [mg/km] 379.771 397.459 384.795 1000
CO2 [g/km] 124.51* 123.79* 126.16*
NOx [mg/km] 5.805 5.448 5.759 60
CH4 [mg/km] 2.967 3.046 2.707
NMHC [mg/km] 27.348 35.349 26.687 68
PM [mg/km] 0.1788 0.4430 0.1278 4.5
PN [#/km] 1.8210 E+11 1.8673 E+11 1.5024 E+11 6.00 E+11
Fuel consumption [l/100 km] 5.50 5.48 5.58
*RCB correction / SDC correction applied if criteria fulfilled.
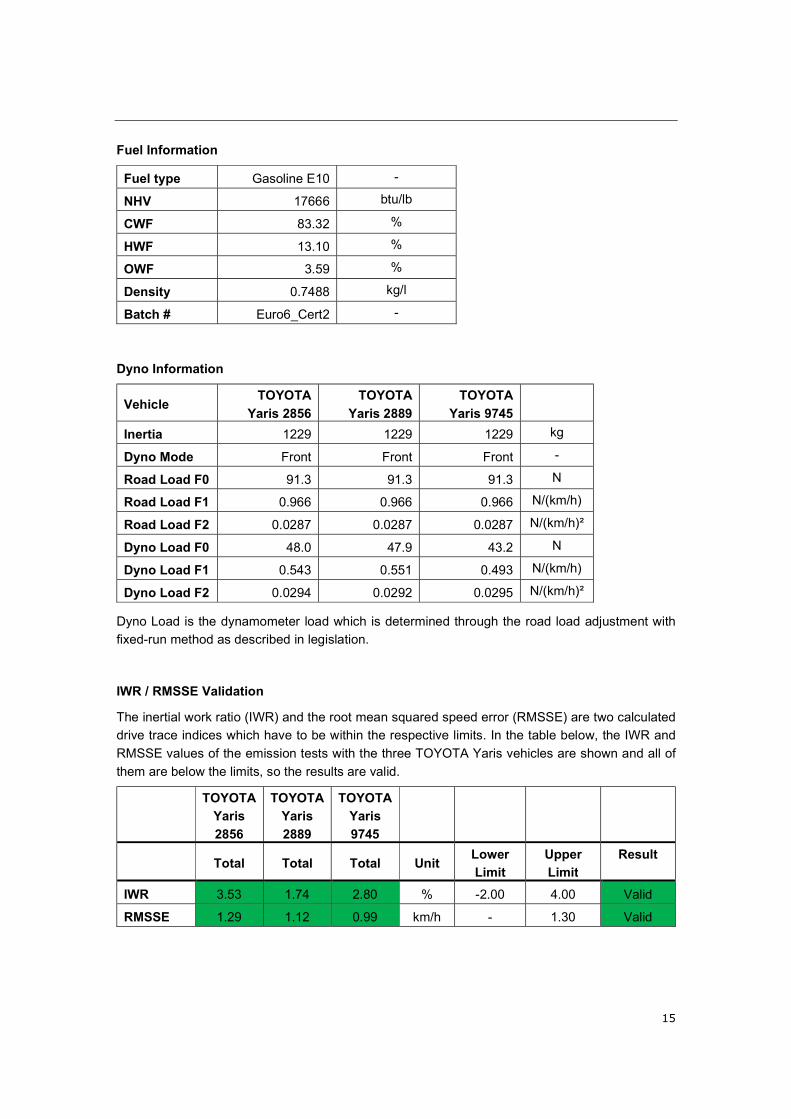
15
Fuel Information
Fuel type Gasoline E10 -
NHV 17666 btu/lb
CWF 83.32 %
HWF 13.10 %
OWF 3.59 %
Density 0.7488 kg/l
Batch # Euro6_Cert2 -
Dyno Information
Vehicle TOYOTA
Yaris 2856
TOYOTA
Yaris 2889
TOYOTA
Yaris 9745
Inertia 1229 1229 1229 kg
Dyno Mode Front Front Front -
Road Load F0 91.3 91.3 91.3 N
Road Load F1 0.966 0.966 0.966 N/(km/h)
Road Load F2 0.0287 0.0287 0.0287 N/(km/h)²
Dyno Load F0 48.0 47.9 43.2 N
Dyno Load F1 0.543 0.551 0.493 N/(km/h)
Dyno Load F2 0.0294 0.0292 0.0295 N/(km/h)²
Dyno Load is the dynamometer load which is determined through the road load adjustment with
fixed-run method as described in legislation.
IWR / RMSSE Validation
The inertial work ratio (IWR) and the root mean squared speed error (RMSSE) are two calculated
drive trace indices which have to be within the respective limits. In the table below, the IWR and
RMSSE values of the emission tests with the three TOYOTA Yaris vehicles are shown and all of
them are below the limits, so the results are valid.
TOYOTA
Yaris
2856
TOYOTA
Yaris
2889
TOYOTA
Yaris
9745
Total Total Total Unit Lower
Limit
Upper
Limit
Result
IWR 3.53 1.74 2.80 % -2.00 4.00 Valid
RMSSE 1.29 1.12 0.99 km/h - 1.30 Valid
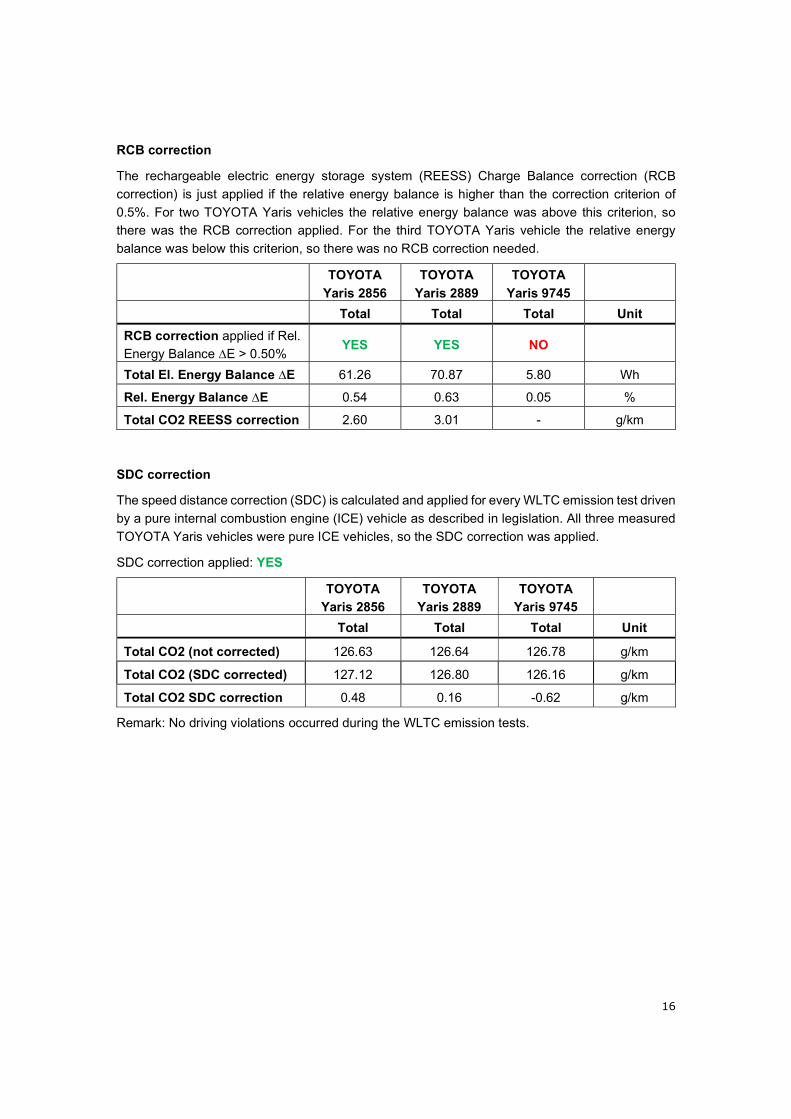
16
RCB correction
The rechargeable electric energy storage system (REESS) Charge Balance correction (RCB
correction) is just applied if the relative energy balance is higher than the correction criterion of
0.5%. For two TOYOTA Yaris vehicles the relative energy balance was above this criterion, so
there was the RCB correction applied. For the third TOYOTA Yaris vehicle the relative energy
balance was below this criterion, so there was no RCB correction needed.
TOYOTA
Yaris 2856
TOYOTA
Yaris 2889
TOYOTA
Yaris 9745
Total Total Total Unit
RCB correction applied if Rel.
Energy Balance ∆E > 0.50% YES YES NO
Total El. Energy Balance ∆E 61.26 70.87 5.80 Wh
Rel. Energy Balance ∆E 0.54 0.63 0.05 %
Total CO2 REESS correction 2.60 3.01 - g/km
SDC correction
The speed distance correction (SDC) is calculated and applied for every WLTC emission test driven
by a pure internal combustion engine (ICE) vehicle as described in legislation. All three measured
TOYOTA Yaris vehicles were pure ICE vehicles, so the SDC correction was applied.
SDC correction applied: YES
TOYOTA
Yaris 2856
TOYOTA
Yaris 2889
TOYOTA
Yaris 9745
Total Total Total Unit
Total CO2 (not corrected) 126.63 126.64 126.78 g/km
Total CO2 (SDC corrected) 127.12 126.80 126.16 g/km
Total CO2 SDC correction 0.48 0.16 -0.62 g/km
Remark: No driving violations occurred during the WLTC emission tests.
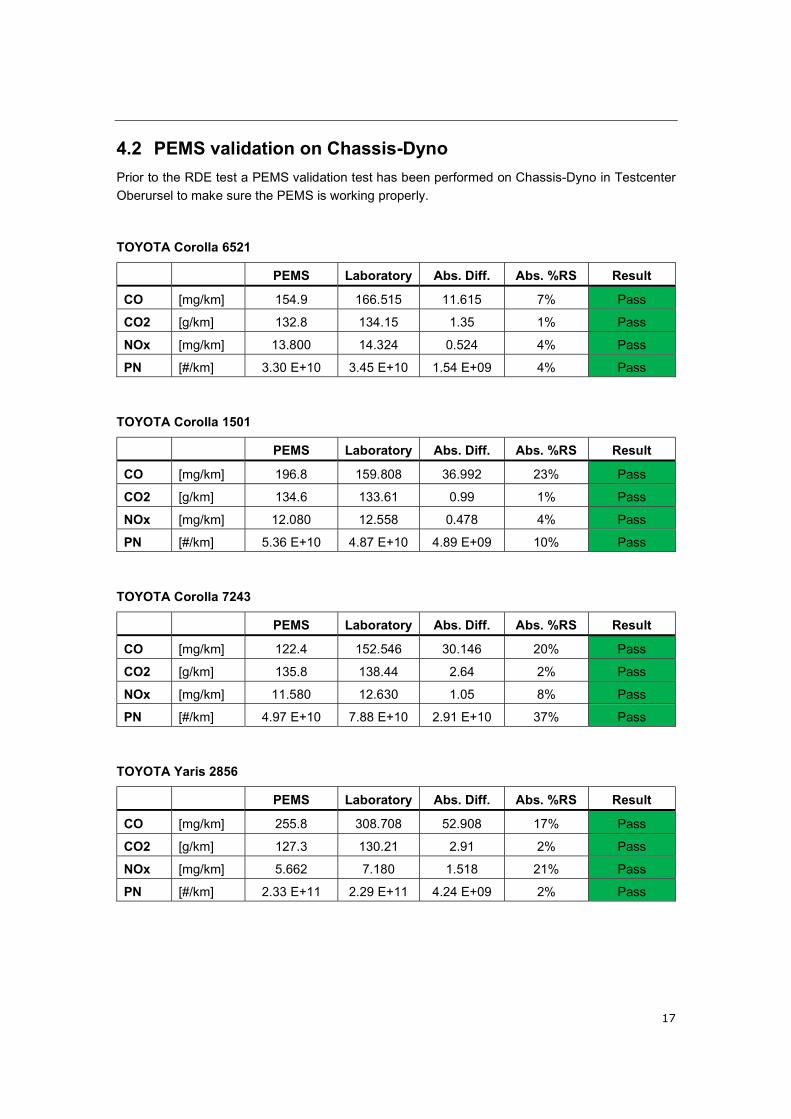
17
4.2 PEMS validation on Chassis-Dyno
Prior to the RDE test a PEMS validation test has been performed on Chassis-Dyno in Testcenter
Oberursel to make sure the PEMS is working properly.
TOYOTA Corolla 6521
PEMS Laboratory Abs. Diff. Abs. %RS Result
CO [mg/km] 154.9 166.515 11.615 7% Pass
CO2 [g/km] 132.8 134.15 1.35 1% Pass
NOx [mg/km] 13.800 14.324 0.524 4% Pass
PN [#/km] 3.30 E+10 3.45 E+10 1.54 E+09 4% Pass
TOYOTA Corolla 1501
PEMS Laboratory Abs. Diff. Abs. %RS Result
CO [mg/km] 196.8 159.808 36.992 23% Pass
CO2 [g/km] 134.6 133.61 0.99 1% Pass
NOx [mg/km] 12.080 12.558 0.478 4% Pass
PN [#/km] 5.36 E+10 4.87 E+10 4.89 E+09 10% Pass
TOYOTA Corolla 7243
PEMS Laboratory Abs. Diff. Abs. %RS Result
CO [mg/km] 122.4 152.546 30.146 20% Pass
CO2 [g/km] 135.8 138.44 2.64 2% Pass
NOx [mg/km] 11.580 12.630 1.05 8% Pass
PN [#/km] 4.97 E+10 7.88 E+10 2.91 E+10 37% Pass
TOYOTA Yaris 2856
PEMS Laboratory Abs. Diff. Abs. %RS Result
CO [mg/km] 255.8 308.708 52.908 17% Pass
CO2 [g/km] 127.3 130.21 2.91 2% Pass
NOx [mg/km] 5.662 7.180 1.518 21% Pass
PN [#/km] 2.33 E+11 2.29 E+11 4.24 E+09 2% Pass
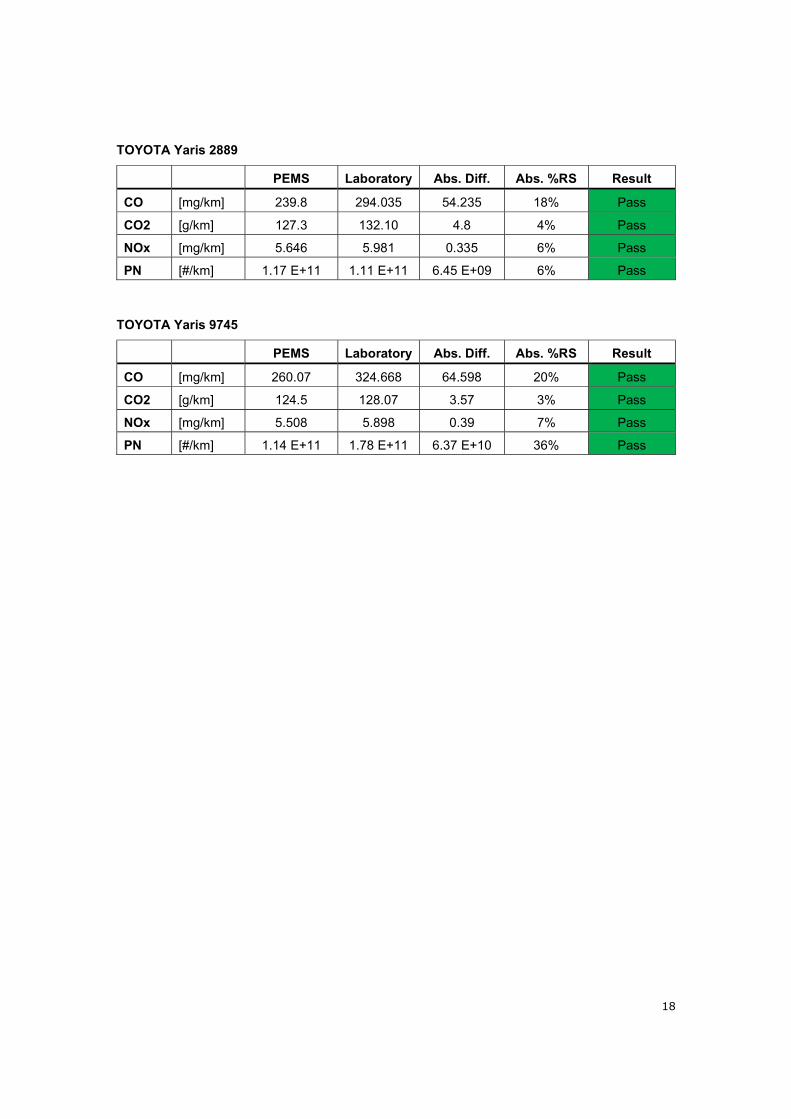
18
TOYOTA Yaris 2889
PEMS Laboratory Abs. Diff. Abs. %RS Result
CO [mg/km] 239.8 294.035 54.235 18% Pass
CO2 [g/km] 127.3 132.10 4.8 4% Pass
NOx [mg/km] 5.646 5.981 0.335 6% Pass
PN [#/km] 1.17 E+11 1.11 E+11 6.45 E+09 6% Pass
TOYOTA Yaris 9745
PEMS Laboratory Abs. Diff. Abs. %RS Result
CO [mg/km] 260.07 324.668 64.598 20% Pass
CO2 [g/km] 124.5 128.07 3.57 3% Pass
NOx [mg/km] 5.508 5.898 0.39 7% Pass
PN [#/km] 1.14 E+11 1.78 E+11 6.37 E+10 36% Pass
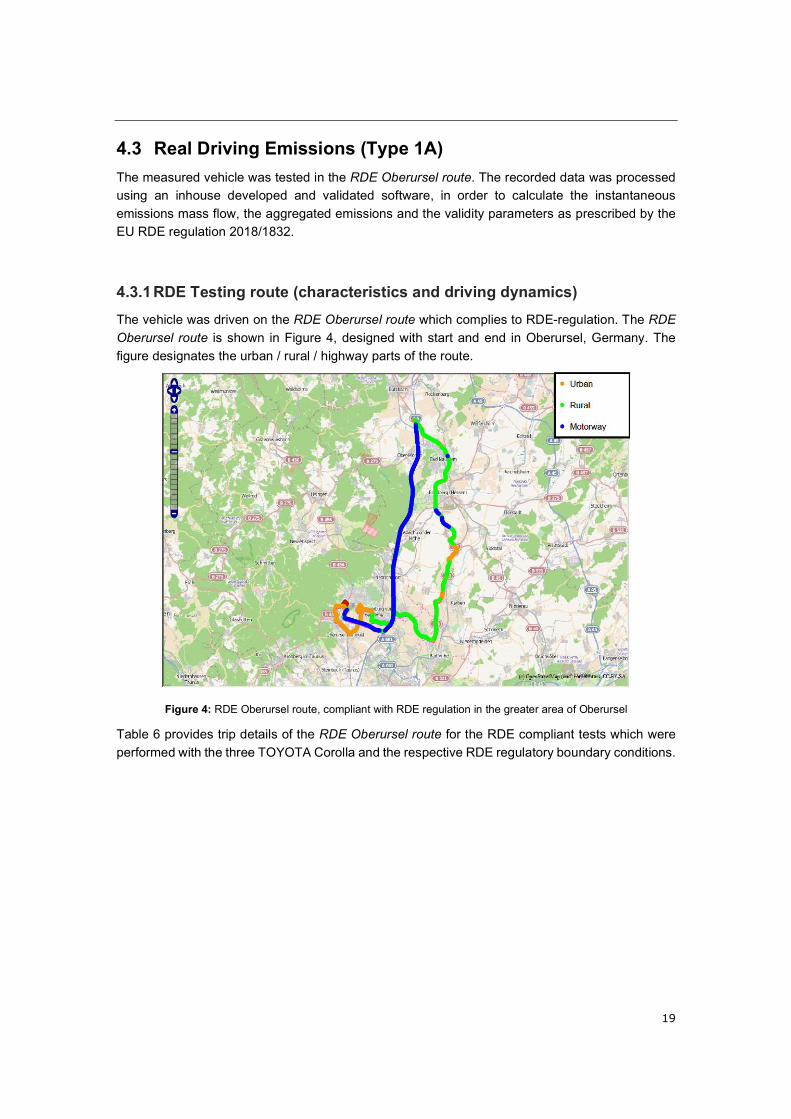
19
4.3 Real Driving Emissions (Type 1A)
The measured vehicle was tested in the RDE Oberursel route. The recorded data was processed
using an inhouse developed and validated software, in order to calculate the instantaneous
emissions mass flow, the aggregated emissions and the validity parameters as prescribed by the
EU RDE regulation 2018/1832.
4.3.1 RDE Testing route (characteristics and driving dynamics)
The vehicle was driven on the RDE Oberursel route which complies to RDE-regulation. The RDE
Oberursel route is shown in Figure 4, designed with start and end in Oberursel, Germany. The
figure designates the urban / rural / highway parts of the route.
Figure 4: RDE Oberursel route, compliant with RDE regulation in the greater area of Oberursel
Table 6 provides trip details of the RDE Oberursel route for the RDE compliant tests which were
performed with the three TOYOTA Corolla and the respective RDE regulatory boundary conditions.
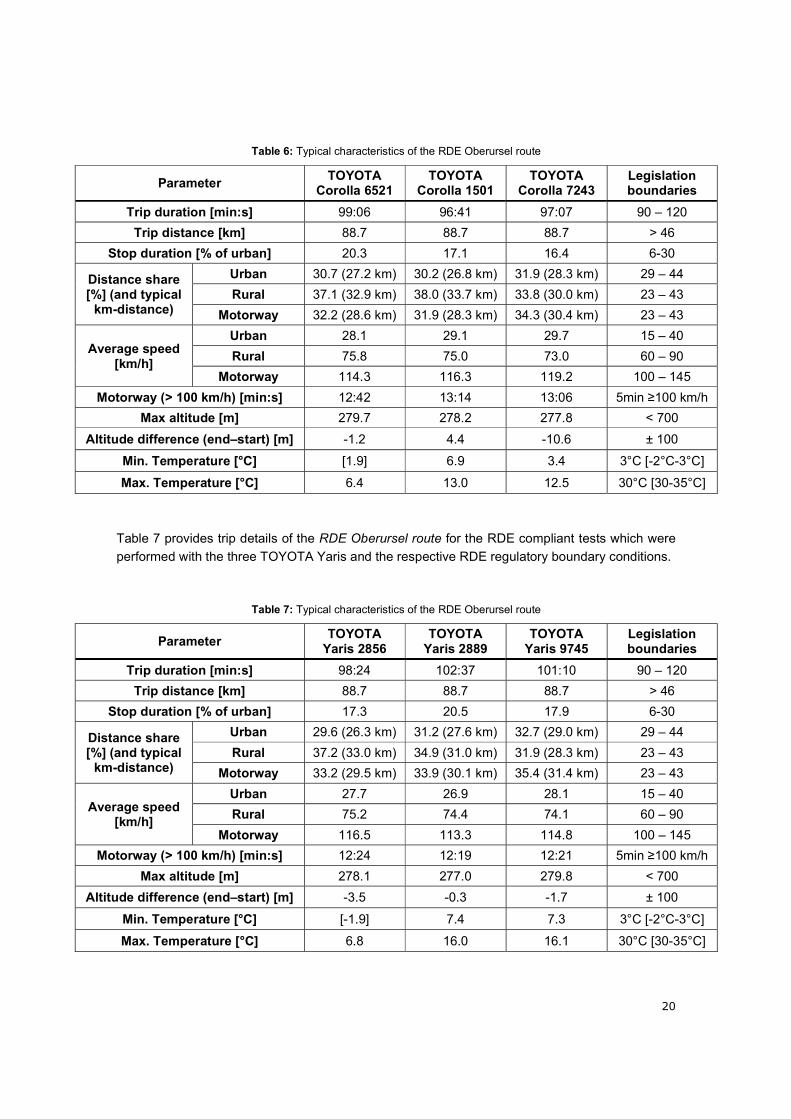
20
Table 6: Typical characteristics of the RDE Oberursel route
Parameter TOYOTA
Corolla 6521 TOYOTA
Corolla 1501 TOYOTA
Corolla 7243 Legislation boundaries
Trip duration [min:s] 99:06 96:41 97:07 90 – 120
Trip distance [km] 88.7 88.7 88.7 > 46
Stop duration [% of urban] 20.3 17.1 16.4 6-30
Distance share [%] (and typical
km-distance)
Urban 30.7 (27.2 km) 30.2 (26.8 km) 31.9 (28.3 km) 29 – 44
Rural 37.1 (32.9 km) 38.0 (33.7 km) 33.8 (30.0 km) 23 – 43
Motorway 32.2 (28.6 km) 31.9 (28.3 km) 34.3 (30.4 km) 23 – 43
Average speed [km/h]
Urban 28.1 29.1 29.7 15 – 40
Rural 75.8 75.0 73.0 60 – 90
Motorway 114.3 116.3 119.2 100 – 145
Motorway (> 100 km/h) [min:s] 12:42 13:14 13:06 5min ≥100 km/h
Max altitude [m] 279.7 278.2 277.8 < 700
Altitude difference (end–start) [m] -1.2 4.4 -10.6 ± 100
Min. Temperature [°C] [1.9] 6.9 3.4 3°C [-2°C-3°C]
Max. Temperature [°C] 6.4 13.0 12.5 30°C [30-35°C]
Table 7 provides trip details of the RDE Oberursel route for the RDE compliant tests which were
performed with the three TOYOTA Yaris and the respective RDE regulatory boundary conditions.
Table 7: Typical characteristics of the RDE Oberursel route
Parameter TOYOTA
Yaris 2856 TOYOTA
Yaris 2889 TOYOTA
Yaris 9745 Legislation boundaries
Trip duration [min:s] 98:24 102:37 101:10 90 – 120
Trip distance [km] 88.7 88.7 88.7 > 46
Stop duration [% of urban] 17.3 20.5 17.9 6-30
Distance share [%] (and typical
km-distance)
Urban 29.6 (26.3 km) 31.2 (27.6 km) 32.7 (29.0 km) 29 – 44
Rural 37.2 (33.0 km) 34.9 (31.0 km) 31.9 (28.3 km) 23 – 43
Motorway 33.2 (29.5 km) 33.9 (30.1 km) 35.4 (31.4 km) 23 – 43
Average speed [km/h]
Urban 27.7 26.9 28.1 15 – 40
Rural 75.2 74.4 74.1 60 – 90
Motorway 116.5 113.3 114.8 100 – 145
Motorway (> 100 km/h) [min:s] 12:24 12:19 12:21 5min ≥100 km/h
Max altitude [m] 278.1 277.0 279.8 < 700
Altitude difference (end–start) [m] -3.5 -0.3 -1.7 ± 100
Min. Temperature [°C] [-1.9] 7.4 7.3 3°C [-2°C-3°C]
Max. Temperature [°C] 6.8 16.0 16.1 30°C [30-35°C]
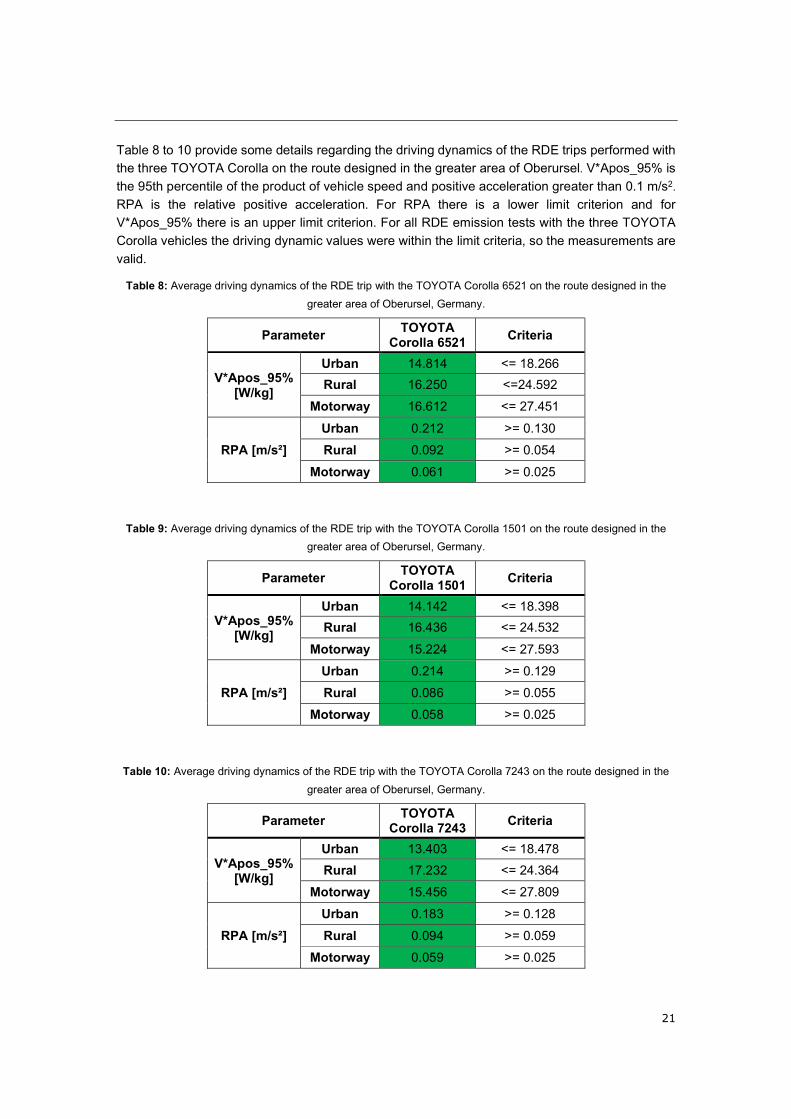
21
Table 8 to 10 provide some details regarding the driving dynamics of the RDE trips performed with
the three TOYOTA Corolla on the route designed in the greater area of Oberursel. V*Apos_95% is
the 95th percentile of the product of vehicle speed and positive acceleration greater than 0.1 m/s2.
RPA is the relative positive acceleration. For RPA there is a lower limit criterion and for
V*Apos_95% there is an upper limit criterion. For all RDE emission tests with the three TOYOTA
Corolla vehicles the driving dynamic values were within the limit criteria, so the measurements are
valid.
Table 8: Average driving dynamics of the RDE trip with the TOYOTA Corolla 6521 on the route designed in the
greater area of Oberursel, Germany.
Parameter TOYOTA
Corolla 6521 Criteria
V*Apos_95% [W/kg]
Urban 14.814 <= 18.266
Rural 16.250 <=24.592
Motorway 16.612 <= 27.451
RPA [m/s²]
Urban 0.212 >= 0.130
Rural 0.092 >= 0.054
Motorway 0.061 >= 0.025
Table 9: Average driving dynamics of the RDE trip with the TOYOTA Corolla 1501 on the route designed in the
greater area of Oberursel, Germany.
Parameter TOYOTA
Corolla 1501 Criteria
V*Apos_95% [W/kg]
Urban 14.142 <= 18.398
Rural 16.436 <= 24.532
Motorway 15.224 <= 27.593
RPA [m/s²]
Urban 0.214 >= 0.129
Rural 0.086 >= 0.055
Motorway 0.058 >= 0.025
Table 10: Average driving dynamics of the RDE trip with the TOYOTA Corolla 7243 on the route designed in the
greater area of Oberursel, Germany.
Parameter TOYOTA
Corolla 7243 Criteria
V*Apos_95% [W/kg]
Urban 13.403 <= 18.478
Rural 17.232 <= 24.364
Motorway 15.456 <= 27.809
RPA [m/s²]
Urban 0.183 >= 0.128
Rural 0.094 >= 0.059
Motorway 0.059 >= 0.025
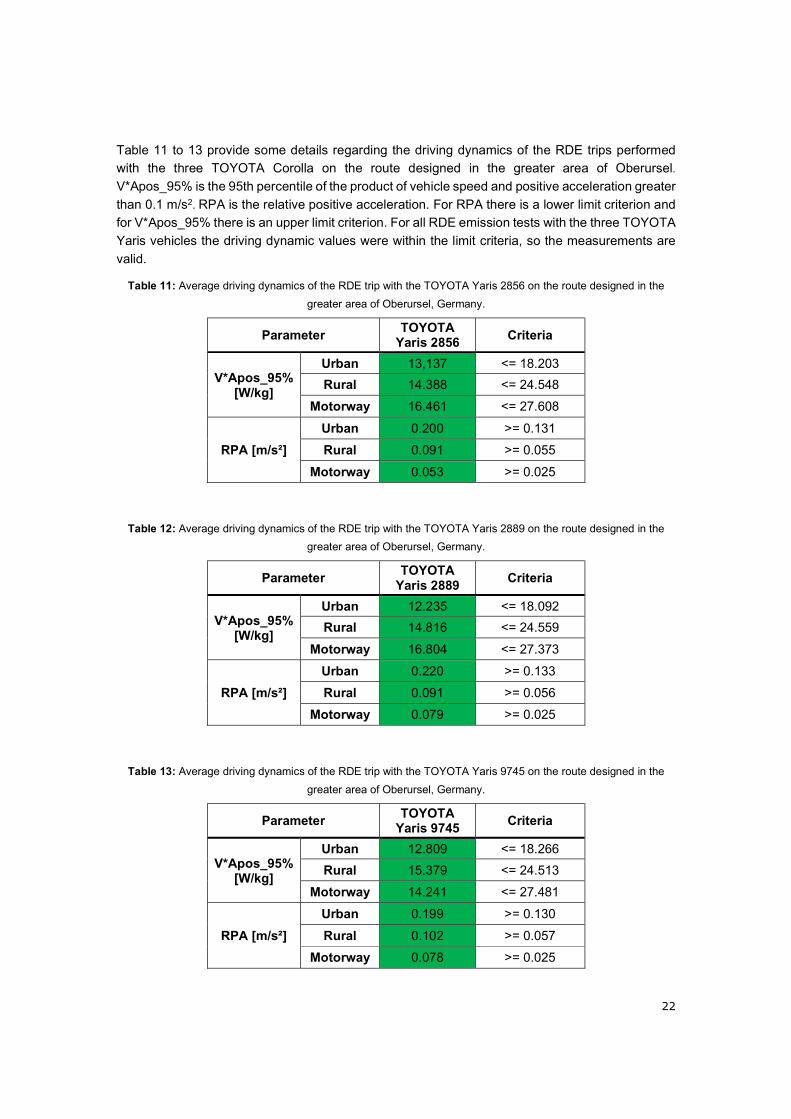
22
Table 11 to 13 provide some details regarding the driving dynamics of the RDE trips performed
with the three TOYOTA Corolla on the route designed in the greater area of Oberursel.
V*Apos_95% is the 95th percentile of the product of vehicle speed and positive acceleration greater
than 0.1 m/s2. RPA is the relative positive acceleration. For RPA there is a lower limit criterion and
for V*Apos_95% there is an upper limit criterion. For all RDE emission tests with the three TOYOTA
Yaris vehicles the driving dynamic values were within the limit criteria, so the measurements are
valid.
Table 11: Average driving dynamics of the RDE trip with the TOYOTA Yaris 2856 on the route designed in the
greater area of Oberursel, Germany.
Parameter TOYOTA
Yaris 2856 Criteria
V*Apos_95% [W/kg]
Urban 13,137 <= 18.203
Rural 14.388 <= 24.548
Motorway 16.461 <= 27.608
RPA [m/s²]
Urban 0.200 >= 0.131
Rural 0.091 >= 0.055
Motorway 0.053 >= 0.025
Table 12: Average driving dynamics of the RDE trip with the TOYOTA Yaris 2889 on the route designed in the
greater area of Oberursel, Germany.
Parameter TOYOTA
Yaris 2889 Criteria
V*Apos_95% [W/kg]
Urban 12.235 <= 18.092
Rural 14.816 <= 24.559
Motorway 16.804 <= 27.373
RPA [m/s²]
Urban 0.220 >= 0.133
Rural 0.091 >= 0.056
Motorway 0.079 >= 0.025
Table 13: Average driving dynamics of the RDE trip with the TOYOTA Yaris 9745 on the route designed in the
greater area of Oberursel, Germany.
Parameter TOYOTA
Yaris 9745 Criteria
V*Apos_95% [W/kg]
Urban 12.809 <= 18.266
Rural 15.379 <= 24.513
Motorway 14.241 <= 27.481
RPA [m/s²]
Urban 0.199 >= 0.130
Rural 0.102 >= 0.057
Motorway 0.078 >= 0.025
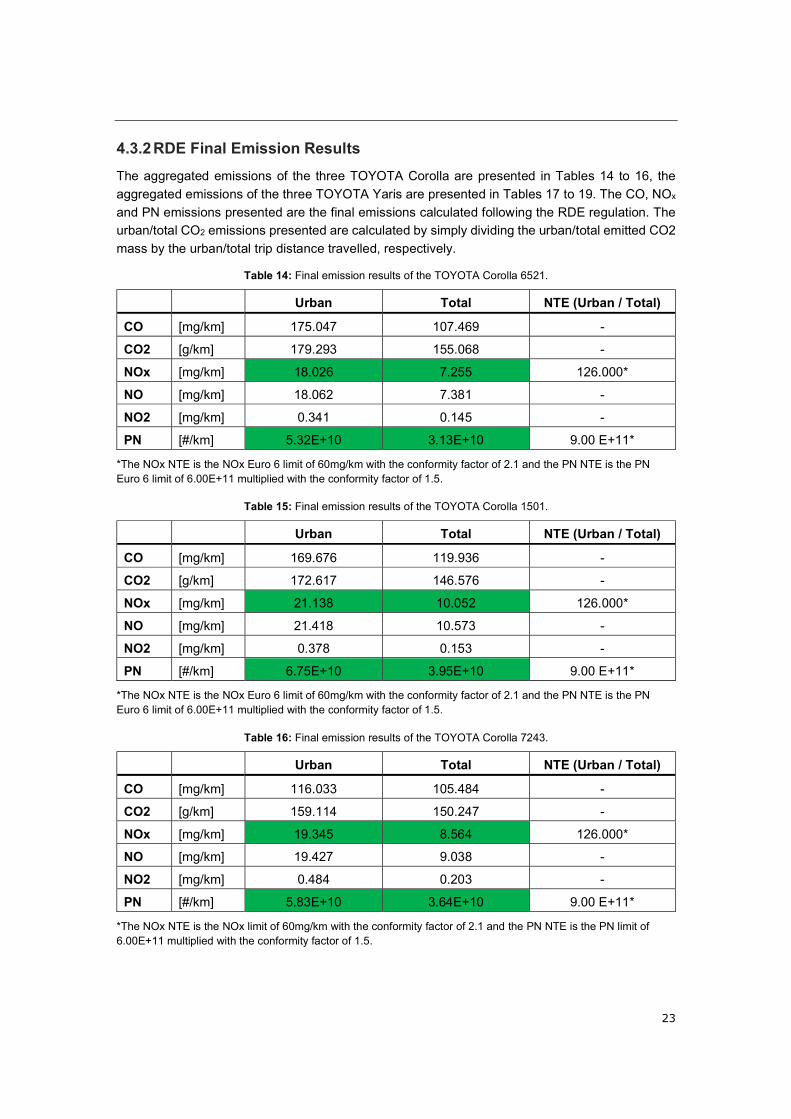
23
4.3.2 RDE Final Emission Results
The aggregated emissions of the three TOYOTA Corolla are presented in Tables 14 to 16, the
aggregated emissions of the three TOYOTA Yaris are presented in Tables 17 to 19. The CO, NOx
and PN emissions presented are the final emissions calculated following the RDE regulation. The
urban/total CO2 emissions presented are calculated by simply dividing the urban/total emitted CO2
mass by the urban/total trip distance travelled, respectively.
Table 14: Final emission results of the TOYOTA Corolla 6521.
Urban Total NTE (Urban / Total)
CO [mg/km] 175.047 107.469 -
CO2 [g/km] 179.293 155.068 -
NOx [mg/km] 18.026 7.255 126.000*
NO [mg/km] 18.062 7.381 -
NO2 [mg/km] 0.341 0.145 -
PN [#/km] 5.32E+10 3.13E+10 9.00 E+11*
*The NOx NTE is the NOx Euro 6 limit of 60mg/km with the conformity factor of 2.1 and the PN NTE is the PN Euro 6 limit of 6.00E+11 multiplied with the conformity factor of 1.5.
Table 15: Final emission results of the TOYOTA Corolla 1501.
Urban Total NTE (Urban / Total)
CO [mg/km] 169.676 119.936 -
CO2 [g/km] 172.617 146.576 -
NOx [mg/km] 21.138 10.052 126.000*
NO [mg/km] 21.418 10.573 -
NO2 [mg/km] 0.378 0.153 -
PN [#/km] 6.75E+10 3.95E+10 9.00 E+11*
*The NOx NTE is the NOx Euro 6 limit of 60mg/km with the conformity factor of 2.1 and the PN NTE is the PN Euro 6 limit of 6.00E+11 multiplied with the conformity factor of 1.5.
Table 16: Final emission results of the TOYOTA Corolla 7243.
Urban Total NTE (Urban / Total)
CO [mg/km] 116.033 105.484 -
CO2 [g/km] 159.114 150.247 -
NOx [mg/km] 19.345 8.564 126.000*
NO [mg/km] 19.427 9.038 -
NO2 [mg/km] 0.484 0.203 -
PN [#/km] 5.83E+10 3.64E+10 9.00 E+11*
*The NOx NTE is the NOx limit of 60mg/km with the conformity factor of 2.1 and the PN NTE is the PN limit of 6.00E+11 multiplied with the conformity factor of 1.5.
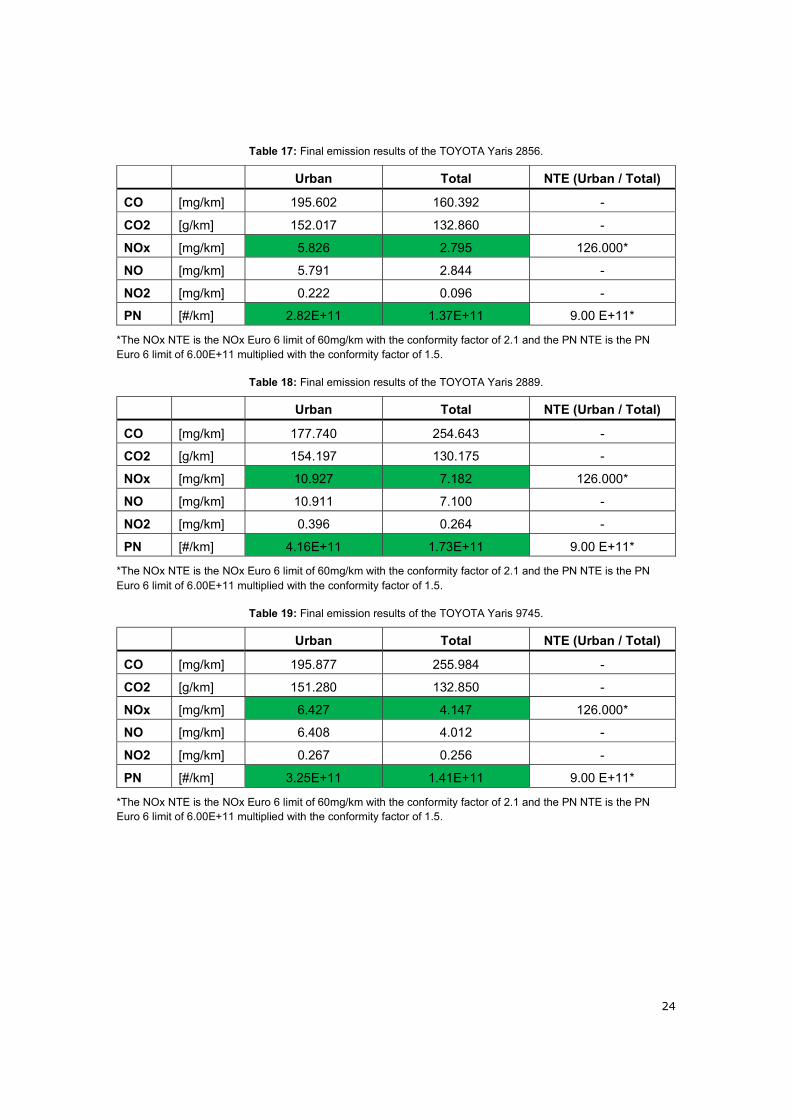
24
Table 17: Final emission results of the TOYOTA Yaris 2856.
Urban Total NTE (Urban / Total)
CO [mg/km] 195.602 160.392 -
CO2 [g/km] 152.017 132.860 -
NOx [mg/km] 5.826 2.795 126.000*
NO [mg/km] 5.791 2.844 -
NO2 [mg/km] 0.222 0.096 -
PN [#/km] 2.82E+11 1.37E+11 9.00 E+11*
*The NOx NTE is the NOx Euro 6 limit of 60mg/km with the conformity factor of 2.1 and the PN NTE is the PN Euro 6 limit of 6.00E+11 multiplied with the conformity factor of 1.5.
Table 18: Final emission results of the TOYOTA Yaris 2889.
Urban Total NTE (Urban / Total)
CO [mg/km] 177.740 254.643 -
CO2 [g/km] 154.197 130.175 -
NOx [mg/km] 10.927 7.182 126.000*
NO [mg/km] 10.911 7.100 -
NO2 [mg/km] 0.396 0.264 -
PN [#/km] 4.16E+11 1.73E+11 9.00 E+11*
*The NOx NTE is the NOx Euro 6 limit of 60mg/km with the conformity factor of 2.1 and the PN NTE is the PN Euro 6 limit of 6.00E+11 multiplied with the conformity factor of 1.5.
Table 19: Final emission results of the TOYOTA Yaris 9745.
Urban Total NTE (Urban / Total)
CO [mg/km] 195.877 255.984 -
CO2 [g/km] 151.280 132.850 -
NOx [mg/km] 6.427 4.147 126.000*
NO [mg/km] 6.408 4.012 -
NO2 [mg/km] 0.267 0.256 -
PN [#/km] 3.25E+11 1.41E+11 9.00 E+11*
*The NOx NTE is the NOx Euro 6 limit of 60mg/km with the conformity factor of 2.1 and the PN NTE is the PN Euro 6 limit of 6.00E+11 multiplied with the conformity factor of 1.5.