ldb analytics : june report for jnpt 2018 -...
TRANSCRIPT
Report Components
LDB ANALYTICS : June Report for JNPT 2018
Logistics Redefined
EXECUTIVE SUMMARY
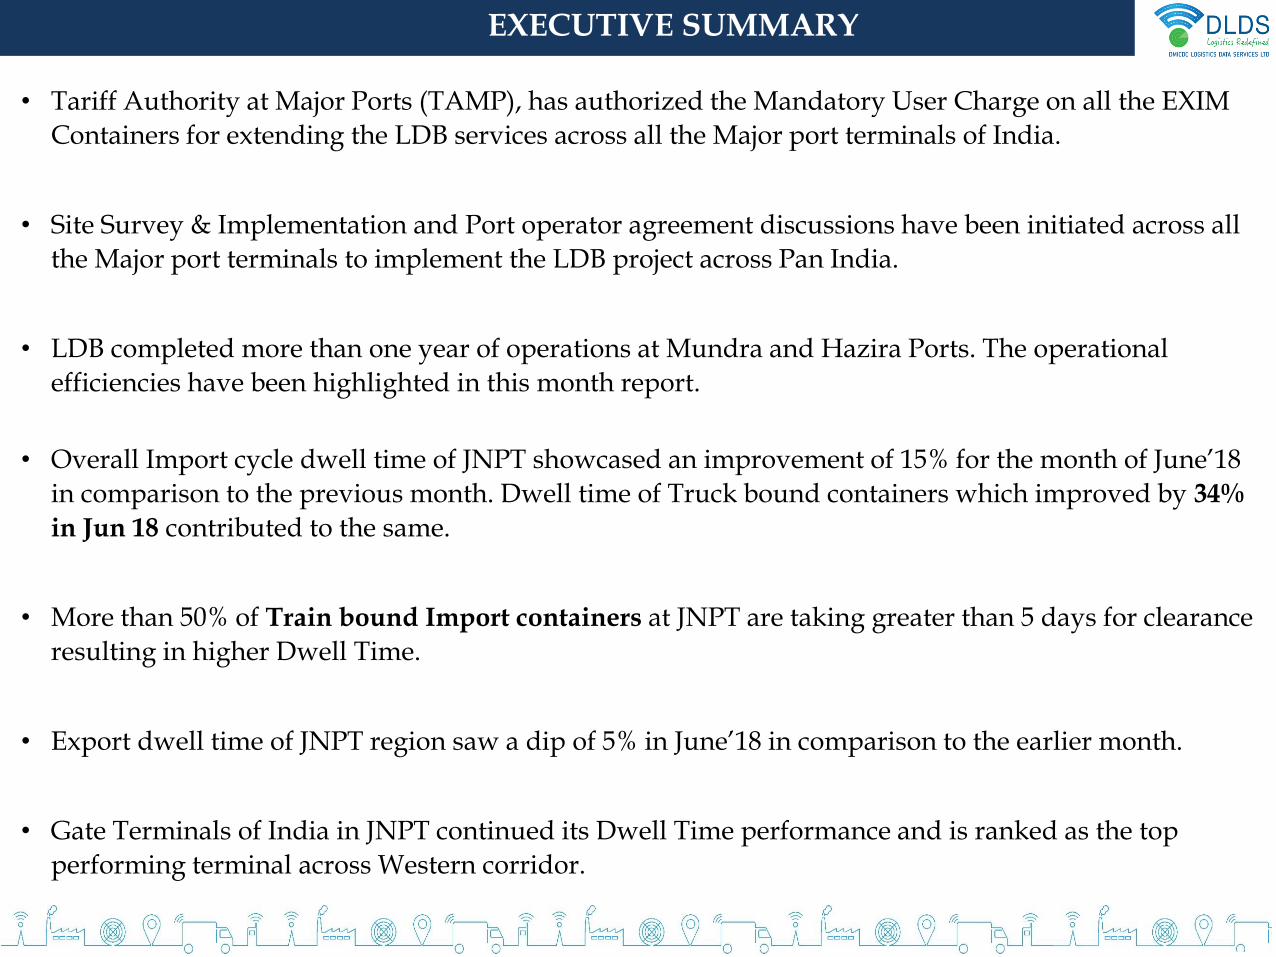
• Tariff Authority at Major Ports (TAMP), has authorized the Mandatory User Charge on all the EXIM
Containers for extending the LDB services across all the Major port terminals of India.
• Site Survey & Implementation and Port operator agreement discussions have been initiated across all
the Major port terminals to implement the LDB project across Pan India.
• LDB completed more than one year of operations at Mundra and Hazira Ports. The operational
efficiencies have been highlighted in this month report.
• Overall Import cycle dwell time of JNPT showcased an improvement of 15% for the month of June’18
in comparison to the previous month. Dwell time of Truck bound containers which improved by 34%
in Jun 18 contributed to the same.
• More than 50% of Train bound Import containers at JNPT are taking greater than 5 days for clearance
resulting in higher Dwell Time.
• Export dwell time of JNPT region saw a dip of 5% in June’18 in comparison to the earlier month.
• Gate Terminals of India in JNPT continued its Dwell Time performance and is ranked as the top
performing terminal across Western corridor.
IMP
OR
TE
XP
OR
T
ICD
Mode May’18(Import Cycle)
Dwell Time
June’18(Import Cycle)
Dwell Time
Overall 68.70 hrs 72.29
Truck 62.39 hrs 70.32
Train 102.50Hrs 101.48
Mode May’18(Import Cycle)
Dwell Time
June’18(Import Cycle)
Dwell Time
Overall 50.96 hrs 44.04
Truck 51.02 hrs 37.95
Train 98.35 hrs 151.63
Toward ICD
Toward CFS
Station
From ICD
From CFS
Station
CFS
Transit Cycle
May’18(hrs)
June’18(hrs)
Port to ICD 71.20 67
Port to CFS 2.37 2.57
LCO May’18Dwell Time
June’18 Dwell time
CFS 80.69 hrs
89.75 hrs
ICD 141.07 hrs
128.15hrs
Transit Cycle
May 18(hrs)
June’18(hrs)
ICD to Port
67.84 64.01
CFS to Port
4.04 5.46
Port Transit CFS/ICD
Container Lifecycle (Import Cycle)
Container Lifecycle (Export Cycle)
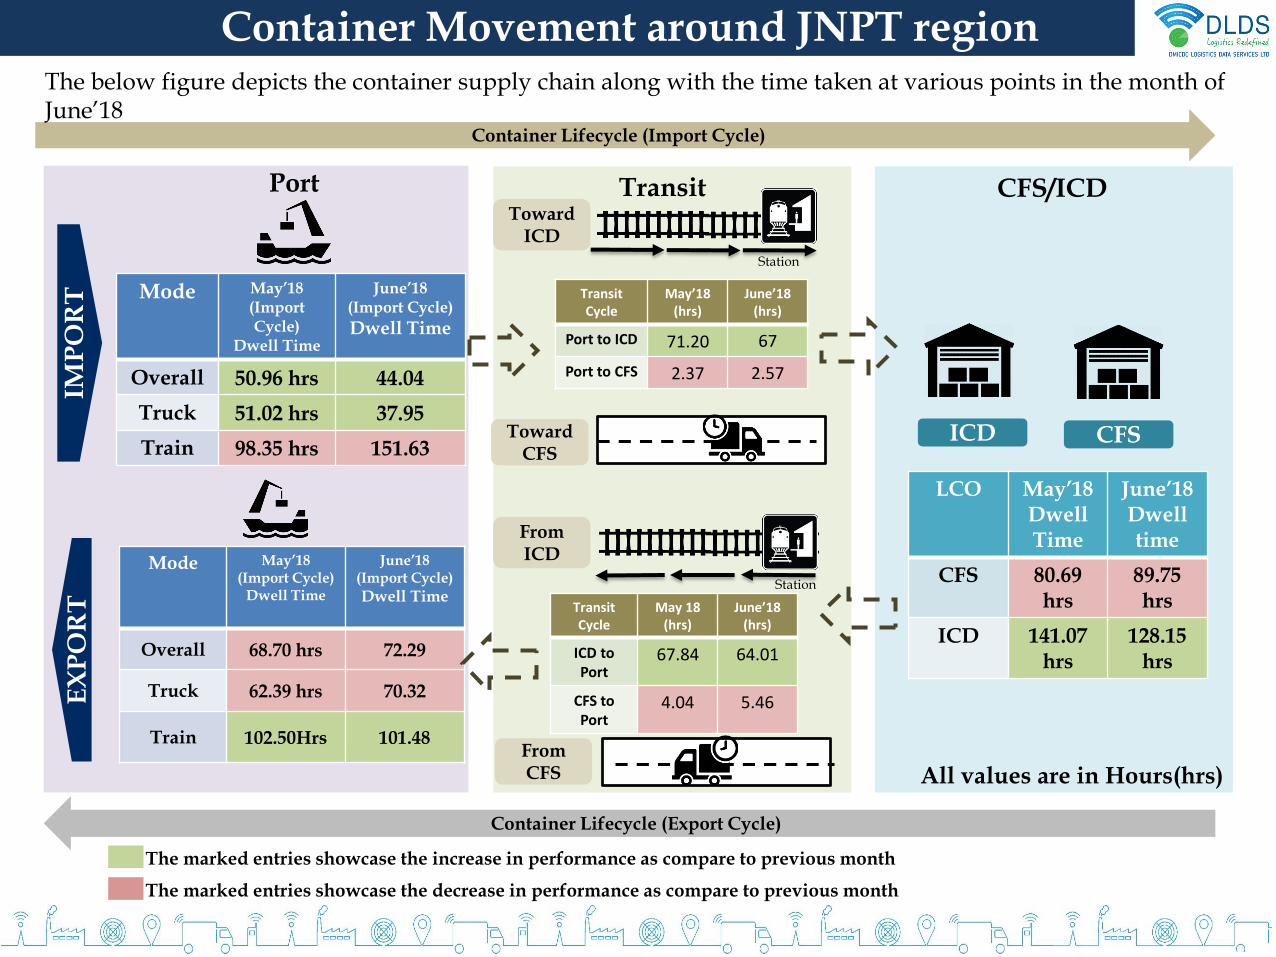
The below figure depicts the container supply chain along with the time taken at various points in the month of June’18
Container Movement around JNPT region
The marked entries showcase the increase in performance as compare to previous month
The marked entries showcase the decrease in performance as compare to previous month
All values are in Hours(hrs)
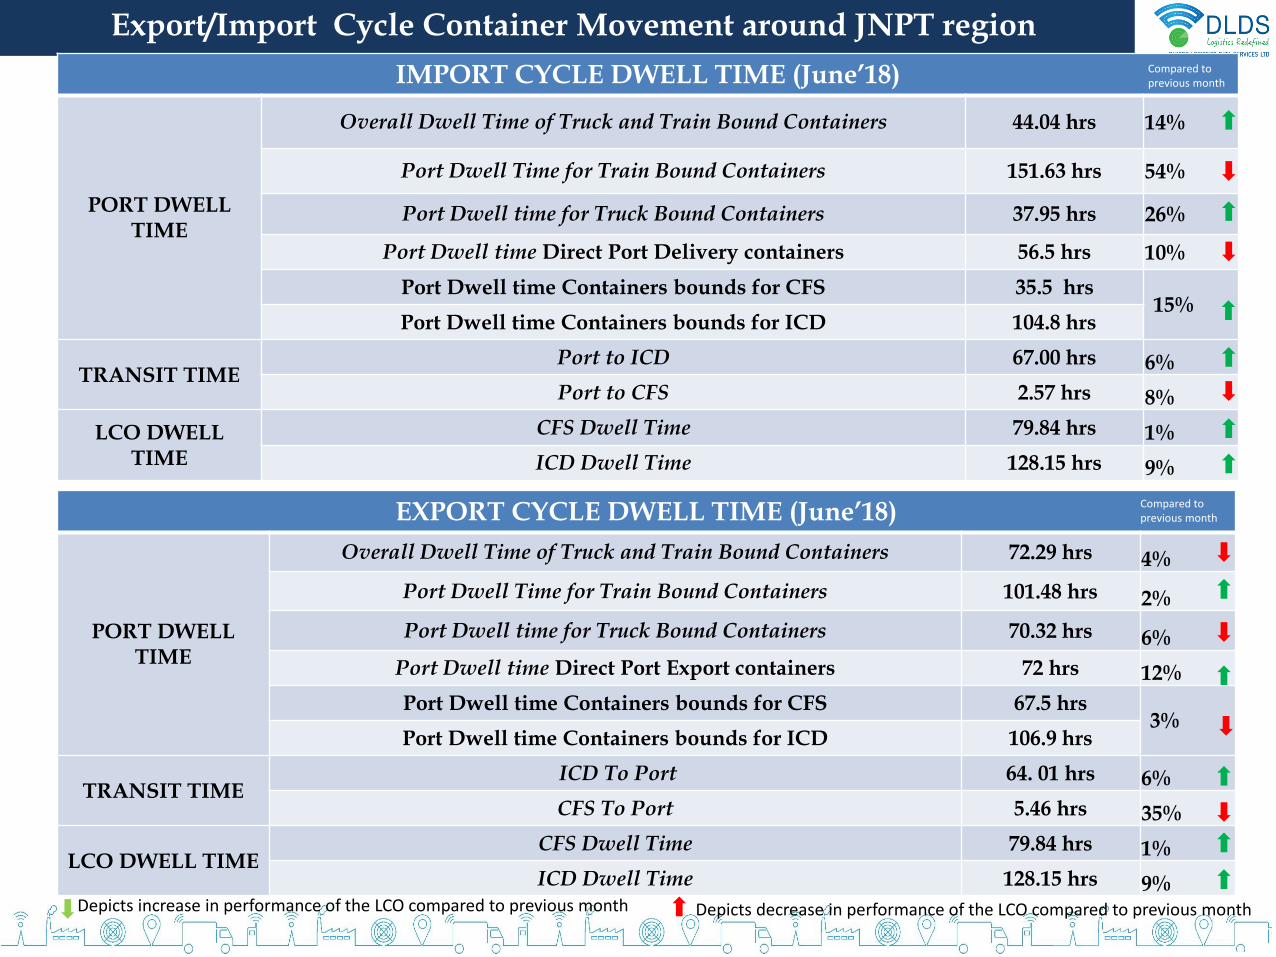
IMPORT CYCLE DWELL TIME (June’18)
PORT DWELL TIME
Overall Dwell Time of Truck and Train Bound Containers 44.04 hrs 14%
Port Dwell Time for Train Bound Containers 151.63 hrs 54%
Port Dwell time for Truck Bound Containers 37.95 hrs 26%
Port Dwell time Direct Port Delivery containers 56.5 hrs 10%
Port Dwell time Containers bounds for CFS 35.5 hrs15%
Port Dwell time Containers bounds for ICD 104.8 hrs
TRANSIT TIMEPort to ICD 67.00 hrs 6%
Port to CFS 2.57 hrs 8%
LCO DWELLTIME
CFS Dwell Time 79.84 hrs 1%
ICD Dwell Time 128.15 hrs 9%
Export/Import Cycle Container Movement around JNPT region
EXPORT CYCLE DWELL TIME (June’18)
PORT DWELL TIME
Overall Dwell Time of Truck and Train Bound Containers 72.29 hrs 4%
Port Dwell Time for Train Bound Containers 101.48 hrs 2%
Port Dwell time for Truck Bound Containers 70.32 hrs 6%
Port Dwell time Direct Port Export containers 72 hrs 12%
Port Dwell time Containers bounds for CFS 67.5 hrs3%
Port Dwell time Containers bounds for ICD 106.9 hrs
TRANSIT TIMEICD To Port 64. 01 hrs 6%
CFS To Port 5.46 hrs 35%
LCO DWELL TIMECFS Dwell Time 79.84 hrs 1%
ICD Dwell Time 128.15 hrs 9%
Compared to previous month
Compared to previous month
Depicts increase in performance of the LCO compared to previous month Depicts decrease in performance of the LCO compared to previous month
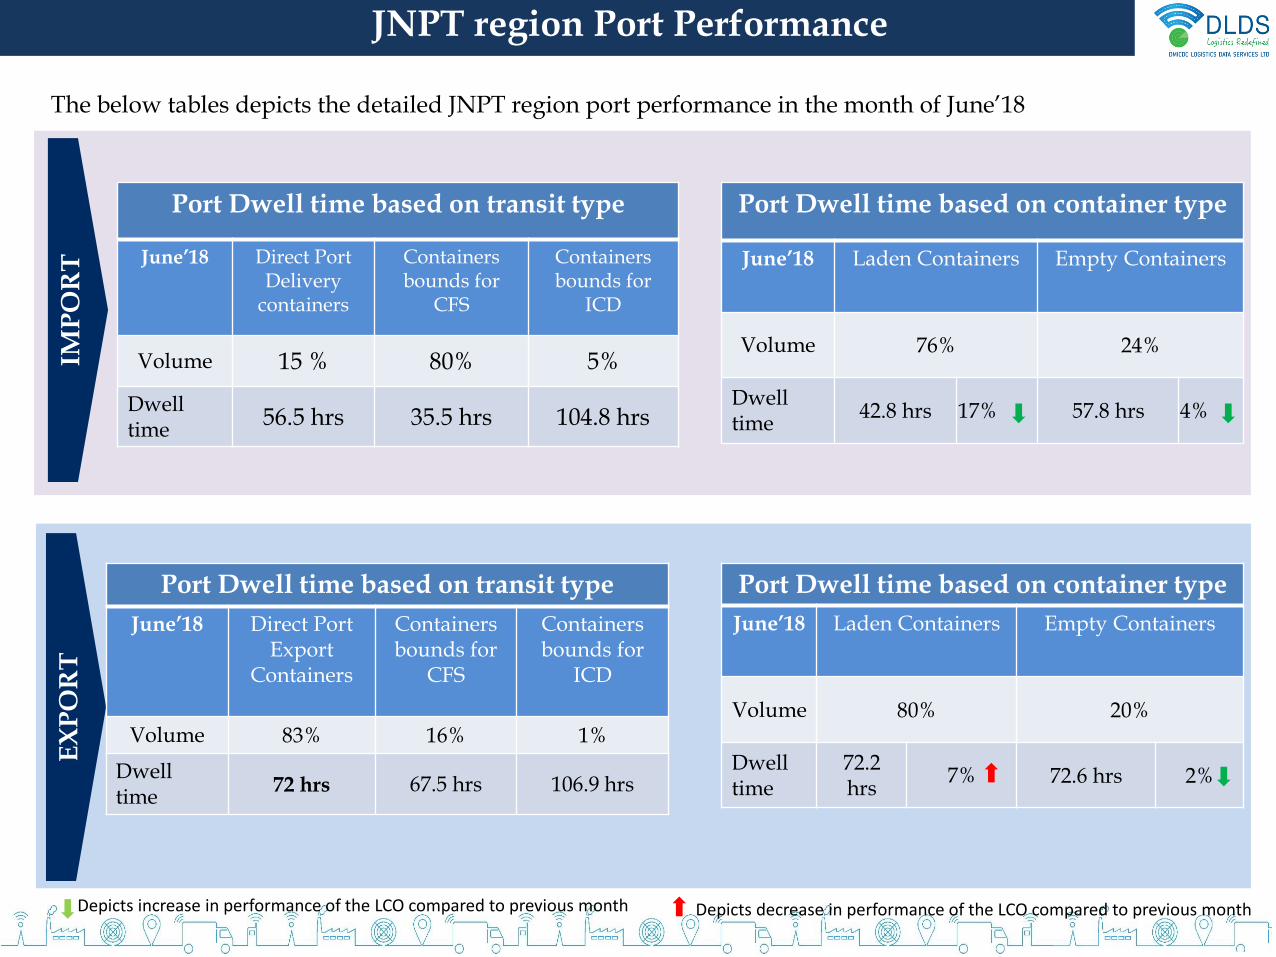
JNPT region Port Performance
The below tables depicts the detailed JNPT region port performance in the month of June’18
Port Dwell time based on transit type
June’18 Direct PortDelivery
containers
Containers bounds for
CFS
Containers bounds for
ICD
Volume 15 % 80% 5%
Dwell time
56.5 hrs 35.5 hrs 104.8 hrs
Port Dwell time based on container type
June’18 Laden Containers Empty Containers
Volume 76% 24%
Dwell time
42.8 hrs 17% 57.8 hrs 4%
Port Dwell time based on container type
June’18 Laden Containers Empty Containers
Volume 80% 20%
Dwell time
72.2 hrs
7% 72.6 hrs 2%
IMP
OR
TE
XP
OR
T
Port Dwell time based on transit type
June’18 Direct PortExport
Containers
Containers bounds for
CFS
Containers bounds for
ICD
Volume 83% 16% 1%
Dwell time
72 hrs 67.5 hrs 106.9 hrs
Depicts increase in performance of the LCO compared to previous month Depicts decrease in performance of the LCO compared to previous month
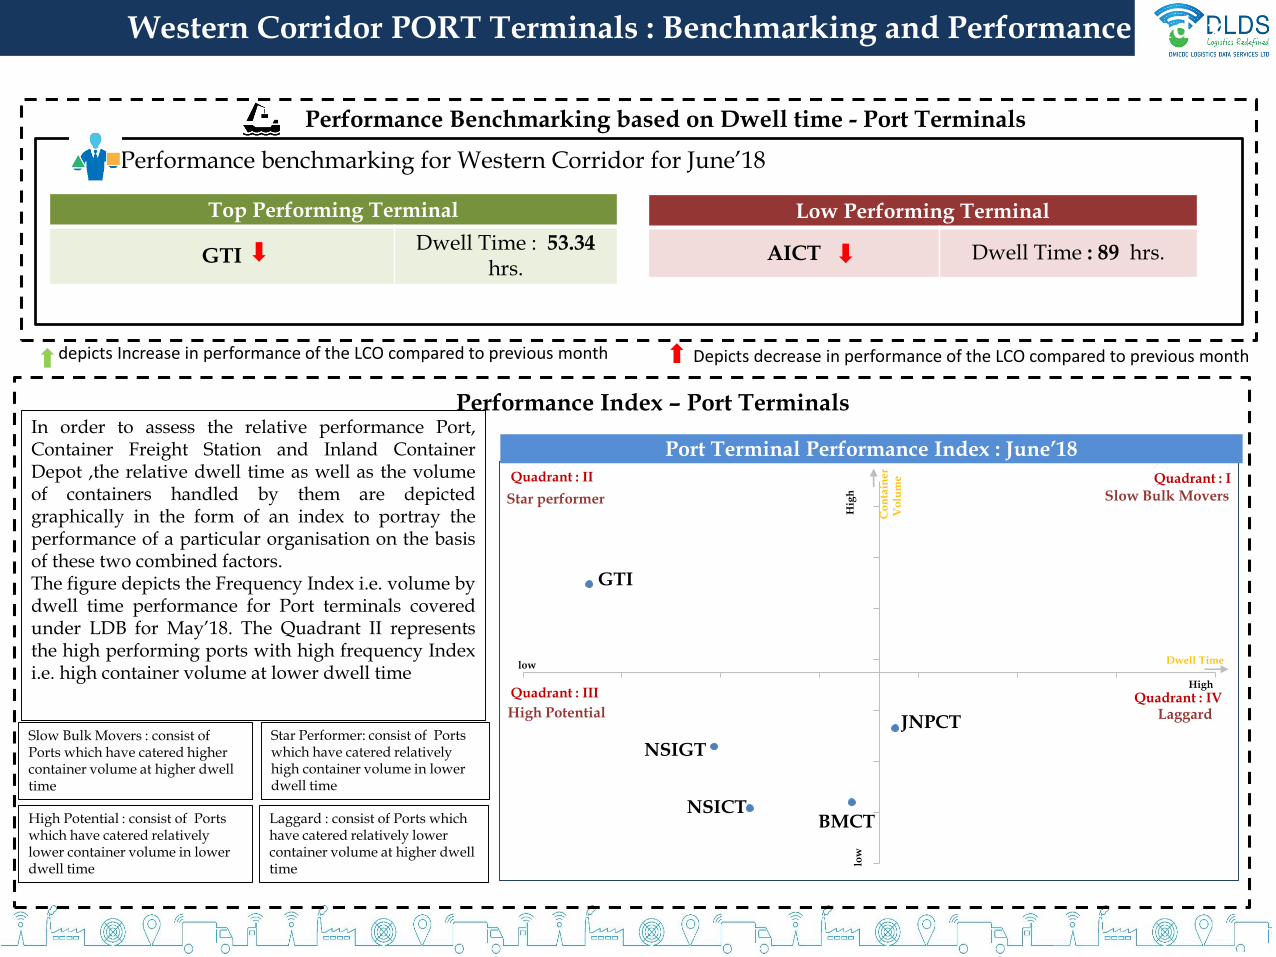
Western Corridor PORT Terminals : Benchmarking and Performance Index
NSIGT
GTI
NSICT
JNPCT
BMCT
Quadrant : IQuadrant : II
Quadrant : III Quadrant : IV
Port Terminal Performance Index : June’18
Dwell Time
Co
nta
ine
rV
olu
me
High
low
low
Hig
hStar performer
Laggard
Slow Bulk Movers
High Potential
Top Performing Terminal
GTIDwell Time : 53.34
hrs.
Performance benchmarking for Western Corridor for June’18
Performance Benchmarking based on Dwell time - Port Terminals
In order to assess the relative performance Port,Container Freight Station and Inland ContainerDepot ,the relative dwell time as well as the volumeof containers handled by them are depictedgraphically in the form of an index to portray theperformance of a particular organisation on the basisof these two combined factors.The figure depicts the Frequency Index i.e. volume bydwell time performance for Port terminals coveredunder LDB for May’18. The Quadrant II representsthe high performing ports with high frequency Indexi.e. high container volume at lower dwell time
Slow Bulk Movers : consist of Ports which have catered higher container volume at higher dwell time
Star Performer: consist of Ports which have catered relatively high container volume in lower dwell time
High Potential : consist of Ports which have catered relatively lower container volume in lower dwell time
Laggard : consist of Ports which have catered relatively lower container volume at higher dwell time
Performance Index – Port Terminals
Low Performing Terminal
AICT Dwell Time : 89 hrs.
depicts Increase in performance of the LCO compared to previous month Depicts decrease in performance of the LCO compared to previous month
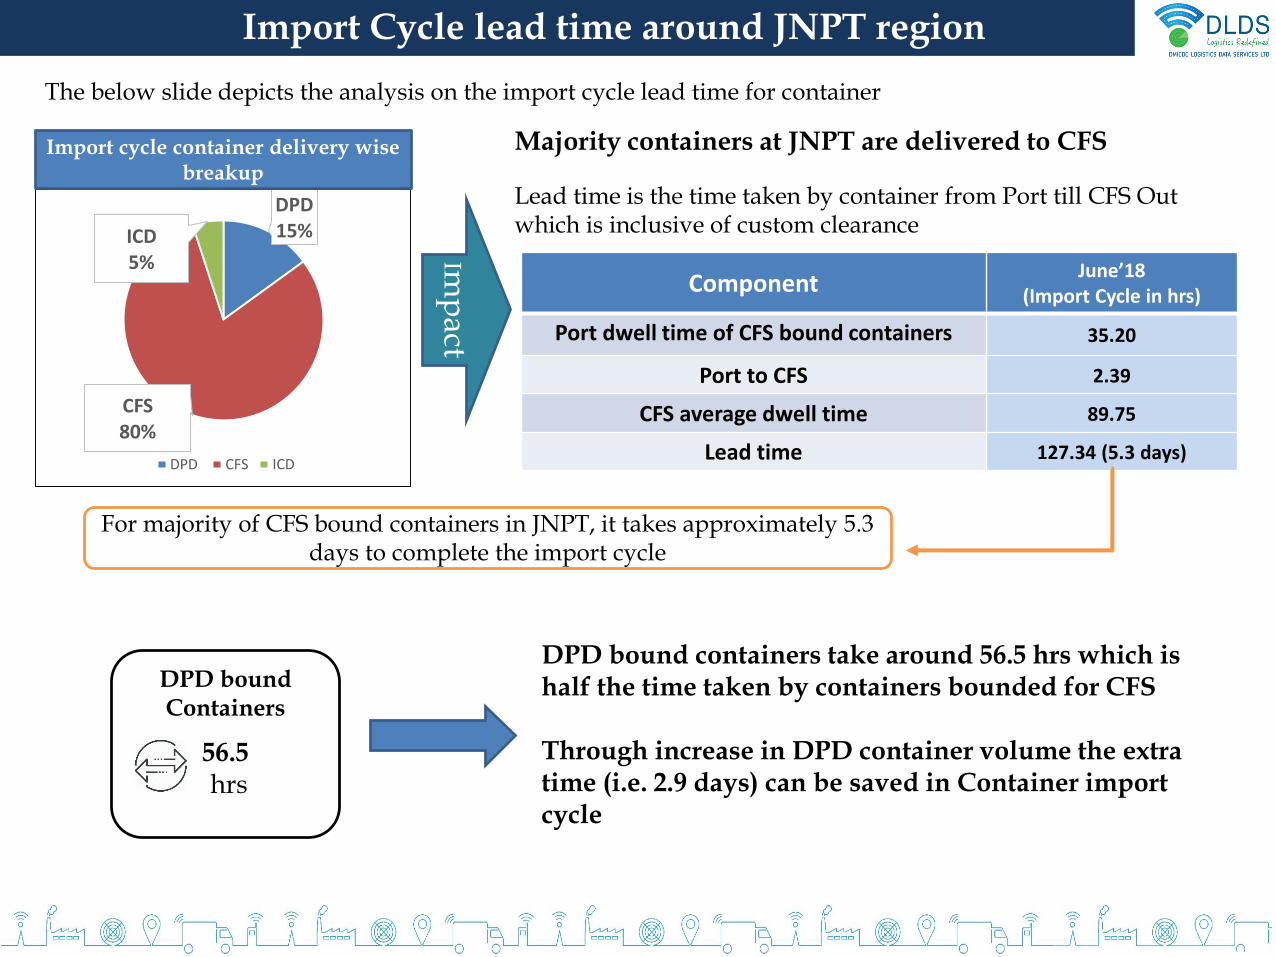
Import Cycle lead time around JNPT region
DPD 15%
CFS80%
ICD5%
DPD CFS ICD
The below slide depicts the analysis on the import cycle lead time for container
Import cycle container delivery wise breakup
Majority containers at JNPT are delivered to CFS
Component June’18
(Import Cycle in hrs)
Port dwell time of CFS bound containers 35.20
Port to CFS 2.39
CFS average dwell time 89.75
Lead time 127.34 (5.3 days)
Lead time is the time taken by container from Port till CFS Out which is inclusive of custom clearance
Imp
act
For majority of CFS bound containers in JNPT, it takes approximately 5.3 days to complete the import cycle
DPD bound Containers
DPD bound containers take around 56.5 hrs which is half the time taken by containers bounded for CFS
Through increase in DPD container volume the extra time (i.e. 2.9 days) can be saved in Container import cycle
56.5hrs
SECTION II:LDB ANALYTICS

Import CycleAnalysis
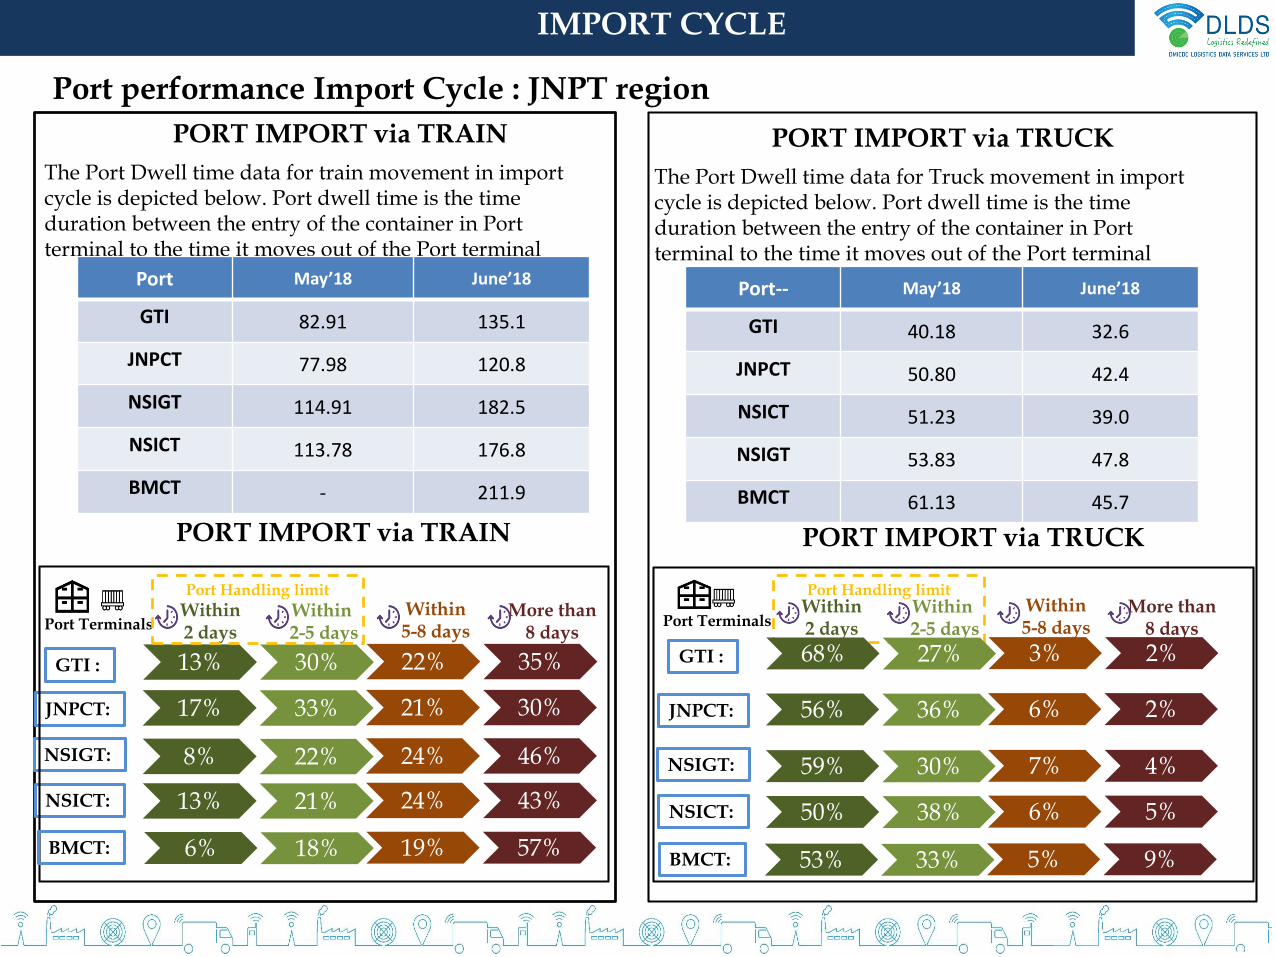
Port performance Import Cycle : JNPT region
The Port Dwell time data for train movement in import cycle is depicted below. Port dwell time is the time duration between the entry of the container in Port terminal to the time it moves out of the Port terminal
Port May’18 June’18
GTI 82.91 135.1
JNPCT 77.98 120.8
NSIGT 114.91 182.5
NSICT 113.78 176.8
BMCT - 211.9
PORT IMPORT via TRAIN
The Port Dwell time data for Truck movement in import cycle is depicted below. Port dwell time is the time duration between the entry of the container in Port terminal to the time it moves out of the Port terminal
PORT IMPORT via TRUCK
Port-- May’18 June’18
GTI 40.18 32.6
JNPCT 50.80 42.4
NSICT 51.23 39.0
NSIGT 53.83 47.8
BMCT 61.13 45.7
PORT IMPORT via TRAIN PORT IMPORT via TRUCK
IMPORT CYCLE
Port Handling limit
68% 27% 3% 2%GTI :
JNPCT:
NSIGT:
NSICT:
More than 8 days
Within 5-8 days
Within2-5 days
Within 2 daysPort Terminals
56% 36% 6% 2%
59% 30% 7% 4%
50% 38% 6% 5%
BMCT: 53% 33% 5% 9%
13% 30% 22% 35% GTI :
JNPCT:
NSIGT:
NSICT:
More than 8 days
Within 5-8 days
Within2-5 days
Within 2 daysPort Terminals
Port Handling limit
17% 33% 21% 30%
8% 22% 24% 46%
13% 21% 24% 43%
BMCT: 6% 18% 19% 57%
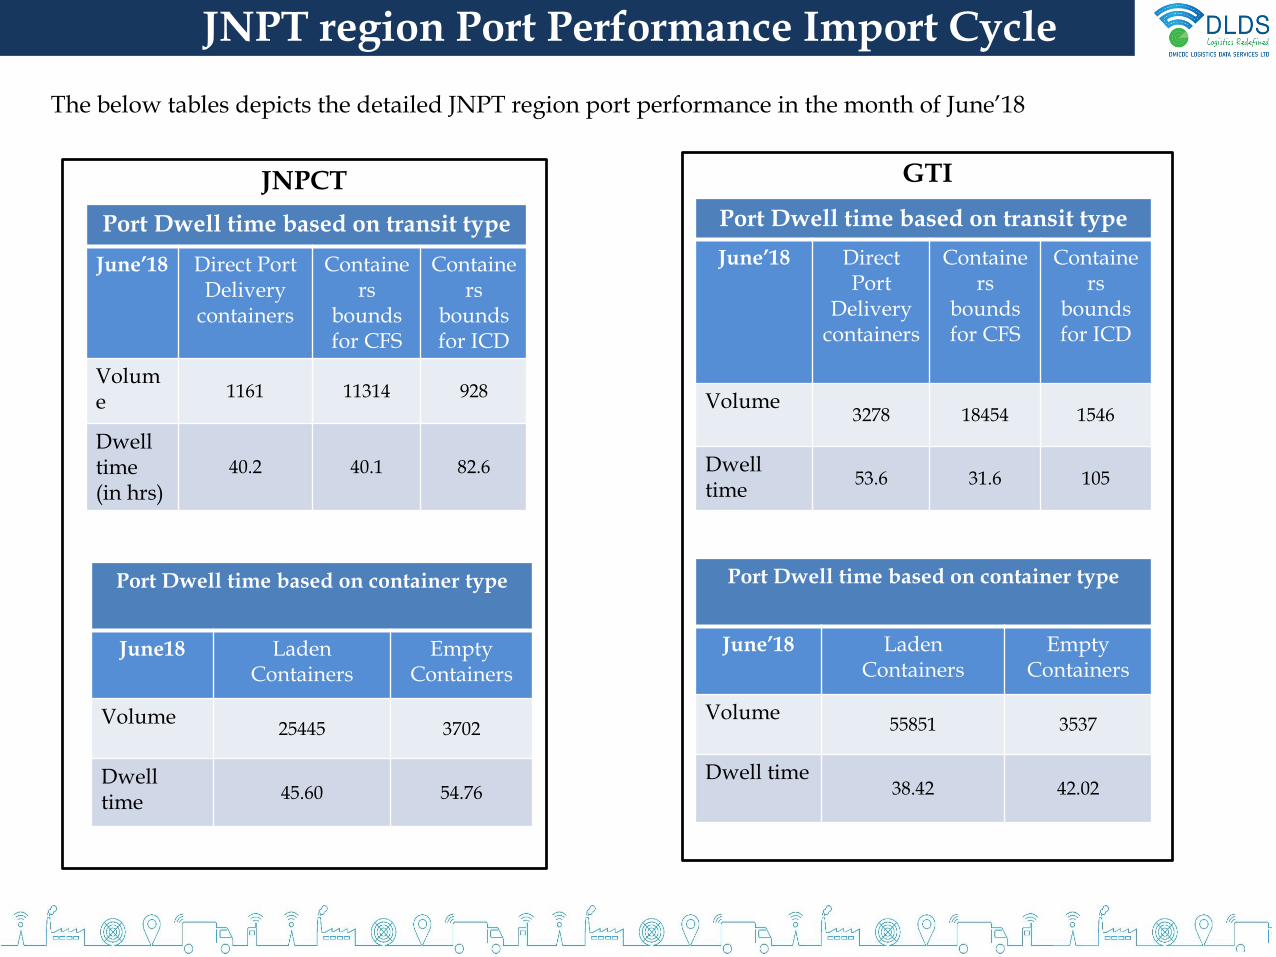
JNPT region Port Performance Import Cycle
The below tables depicts the detailed JNPT region port performance in the month of June’18
Port Dwell time based on transit type
June’18 Direct PortDelivery
containers
Containers
bounds for CFS
Containers
bounds for ICD
Volume
1161 11314 928
Dwell time (in hrs)
40.2 40.1 82.6
Port Dwell time based on container type
June18 Laden Containers
Empty Containers
Volume25445 3702
Dwell time 45.60 54.76
JNPCT
Port Dwell time based on transit type
June’18 Direct Port
Delivery containers
Containers
bounds for CFS
Containers
bounds for ICD
Volume3278 18454 1546
Dwell time
53.6 31.6 105
Port Dwell time based on container type
June’18 Laden Containers
Empty Containers
Volume55851 3537
Dwell time 38.42 42.02
GTI
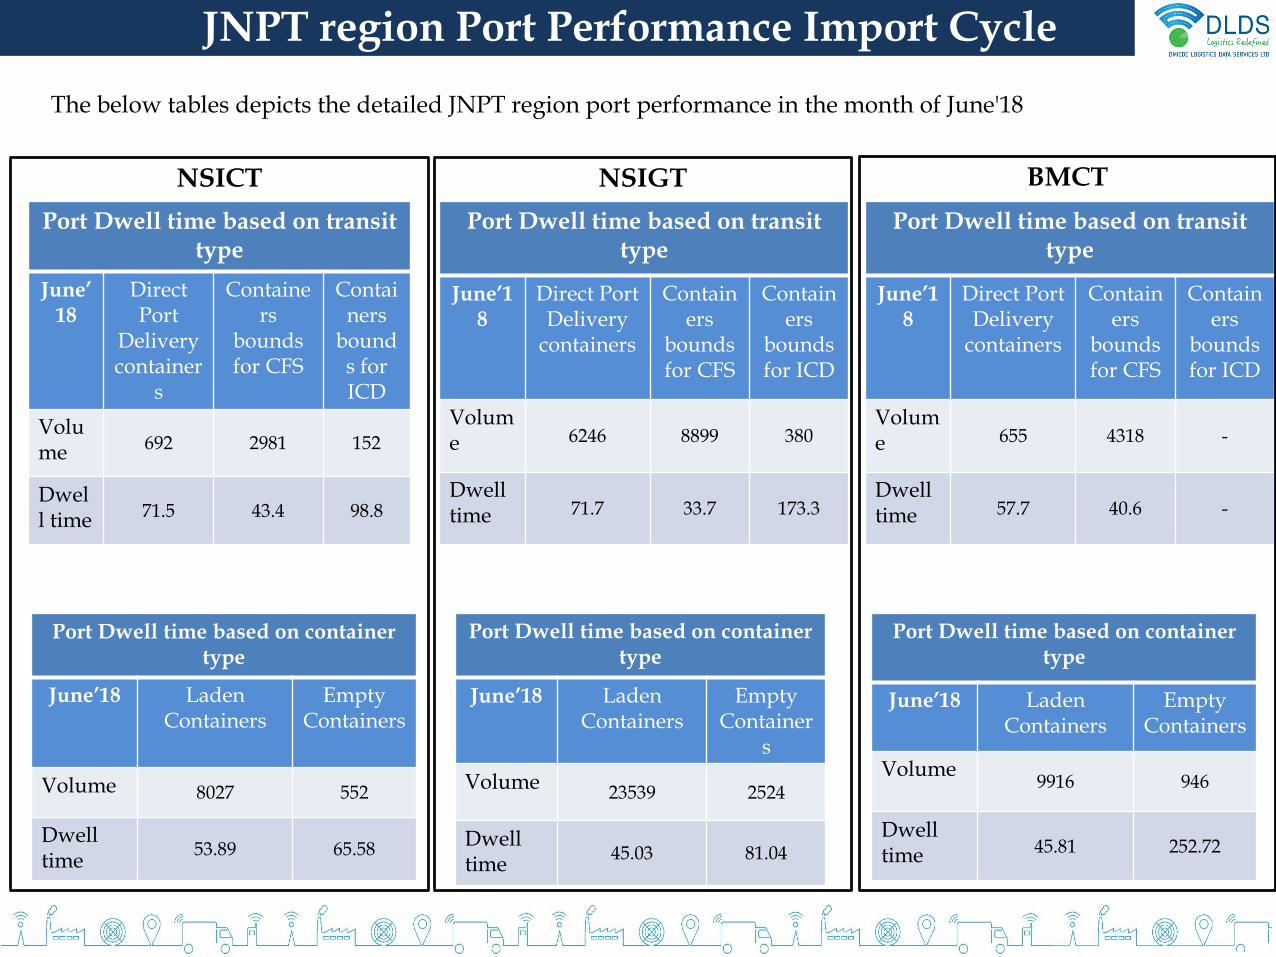
JNPT region Port Performance Import Cycle
The below tables depicts the detailed JNPT region port performance in the month of June'18
Port Dwell time based on transittype
June’18
Direct Port
Delivery container
s
Containers
bounds for CFS
Containers
bounds for ICD
Volume 692 2981 152
Dwell time 71.5 43.4 98.8
Port Dwell time based on containertype
June’18 Laden Containers
Empty Containers
Volume 8027 552
Dwell time
53.89 65.58
NSICT
Port Dwell time based on transittype
June’18
Direct PortDelivery
containers
Containers
bounds for CFS
Containers
bounds for ICD
Volume 6246 8899 380
Dwell time 71.7 33.7 173.3
Port Dwell time based on containertype
June’18 Laden Containers
Empty Container
s
Volume23539 2524
Dwell time
45.03 81.04
NSIGT
Port Dwell time based on transittype
June’18
Direct PortDelivery
containers
Containers
bounds for CFS
Containers
bounds for ICD
Volume 655 4318 -
Dwell time 57.7 40.6 -
Port Dwell time based on containertype
June’18 Laden Containers
Empty Containers
Volume9916 946
Dwell time 45.81 252.72
BMCT
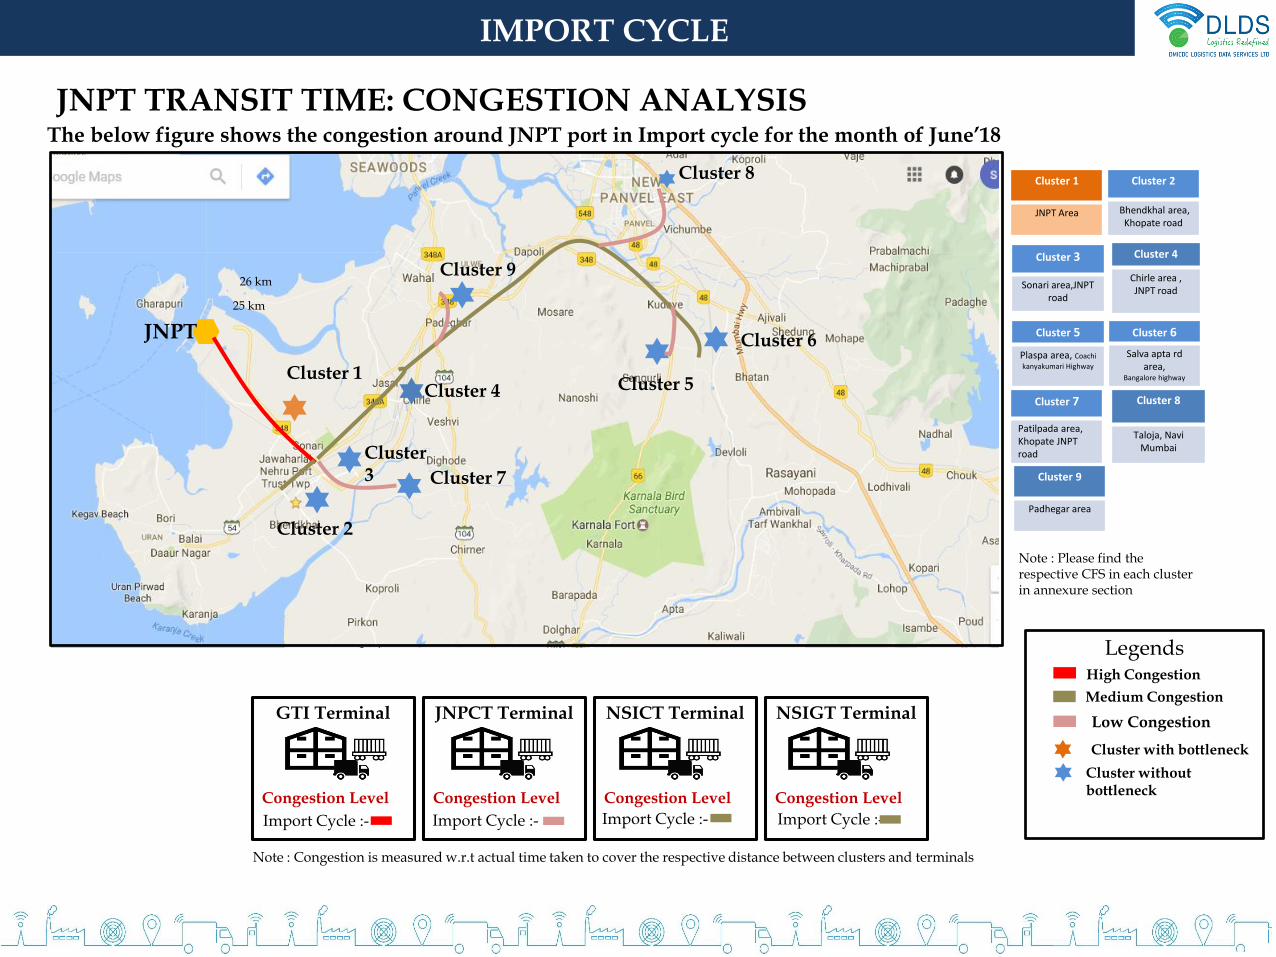
IMPORT CYCLE
The below figure shows the congestion around JNPT port in Import cycle for the month of June’18
High Congestion
Cluster without bottleneck
Cluster with bottleneck
Medium Congestion GTI Terminal
Congestion Level
JNPCT Terminal
Congestion Level
NSICT Terminal
Congestion Level
NSIGT Terminal
Congestion Level
Import Cycle :- Import Cycle :- Import Cycle :- Import Cycle :-
Note : Congestion is measured w.r.t actual time taken to cover the respective distance between clusters and terminals
Cluster 1
JNPT Area
Cluster 2
Bhendkhal area, Khopate road
Cluster 3
Sonari area,JNPT road
Cluster 5
Plaspa area, Coachi
kanyakumari Highway
Cluster 6
Salva apta rd area,
Bangalore highway
Cluster 7
Patilpada area, Khopate JNPT road
Note : Please find the respective CFS in each cluster in annexure section
Cluster 8
Taloja, Navi Mumbai
Low Congestion
Legends
Cluster 9
Padhegar area
Cluster 4
Chirle area , JNPT road
JNPT TRANSIT TIME: CONGESTION ANALYSIS
Cluster 2
Cluster 5
Cluster 7
Cluster 4
Cluster 6
Cluster 3
Cluster 1
JNPT
25 km
26 km
Cluster 8
Cluster 9
HEAT MAP : OVERALL MUMBAI REGION
52%MUMBA
I REGION
Heat Map : June 2018
2%NH3
17 %Pune route10 %
Others
19%NH
8
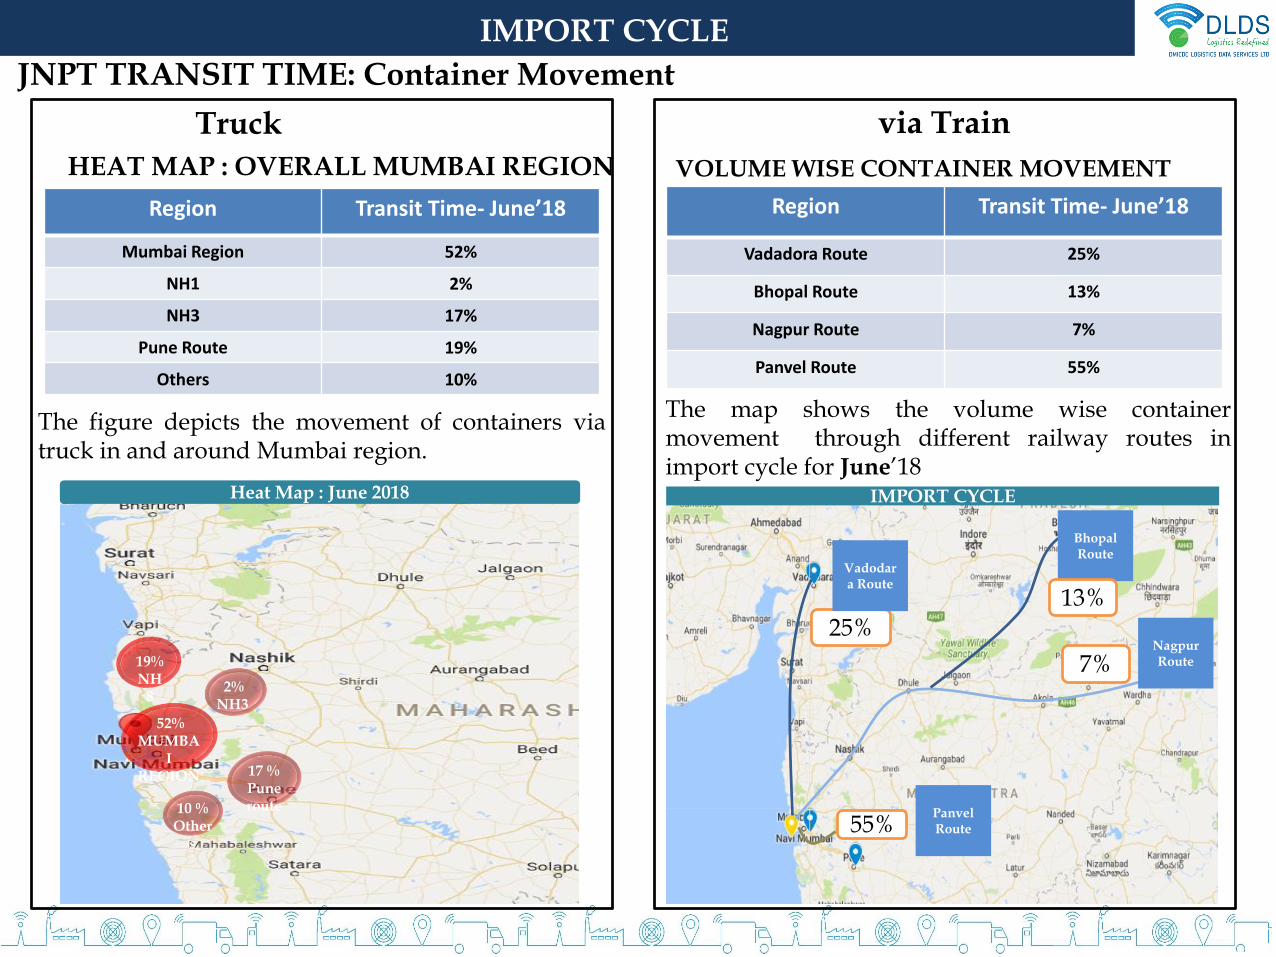
The figure depicts the movement of containers viatruck in and around Mumbai region.
IMPORT CYCLE
JNPT TRANSIT TIME: Container Movement
The map shows the volume wise containermovement through different railway routes inimport cycle for June’18
25%
7%
55%
IMPORT CYCLE
Nagpur Route
Vadodara Route
Panvel Route
Bhopal Route
13%
via TrainTruck
Region Transit Time- June’18
Mumbai Region 52%
NH1 2%
NH3 17%
Pune Route 19%
Others 10%
Region Transit Time- June’18
Vadadora Route 25%
Bhopal Route 13%
Nagpur Route 7%
Panvel Route 55%
VOLUME WISE CONTAINER MOVEMENT
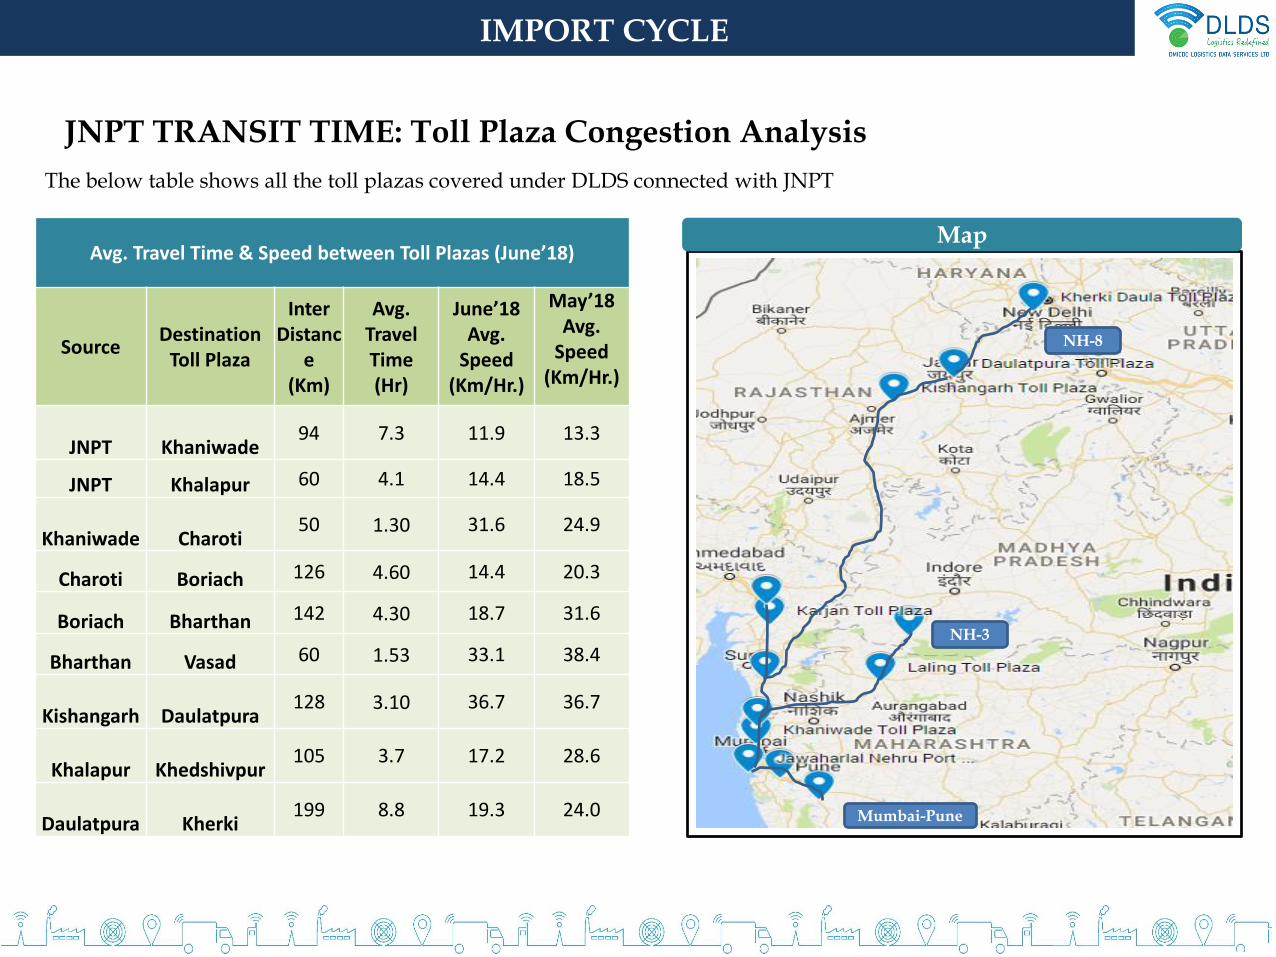
The below table shows all the toll plazas covered under DLDS connected with JNPT
JNPT TRANSIT TIME: Toll Plaza Congestion Analysis
Avg. Travel Time & Speed between Toll Plazas (June’18)
Source Destination
Toll Plaza
Inter Distanc
e(Km)
Avg. Travel Time (Hr)
June’18Avg.
Speed(Km/Hr.)
May’18Avg.
Speed(Km/Hr.)
JNPT Khaniwade94 7.3 11.9 13.3
JNPT Khalapur 60 4.1 14.4 18.5
Khaniwade Charoti50 1.30 31.6 24.9
Charoti Boriach 126 4.60 14.4 20.3
Boriach Bharthan 142 4.30 18.7 31.6
Bharthan Vasad 60 1.53 33.1 38.4
Kishangarh Daulatpura128 3.10 36.7 36.7
Khalapur Khedshivpur 105 3.7 17.2 28.6
Daulatpura Kherki 199 8.8 19.3 24.0
Map
Mumbai-Pune
NH-3
NH-8
IMPORT CYCLE
Export CycleAnalysis
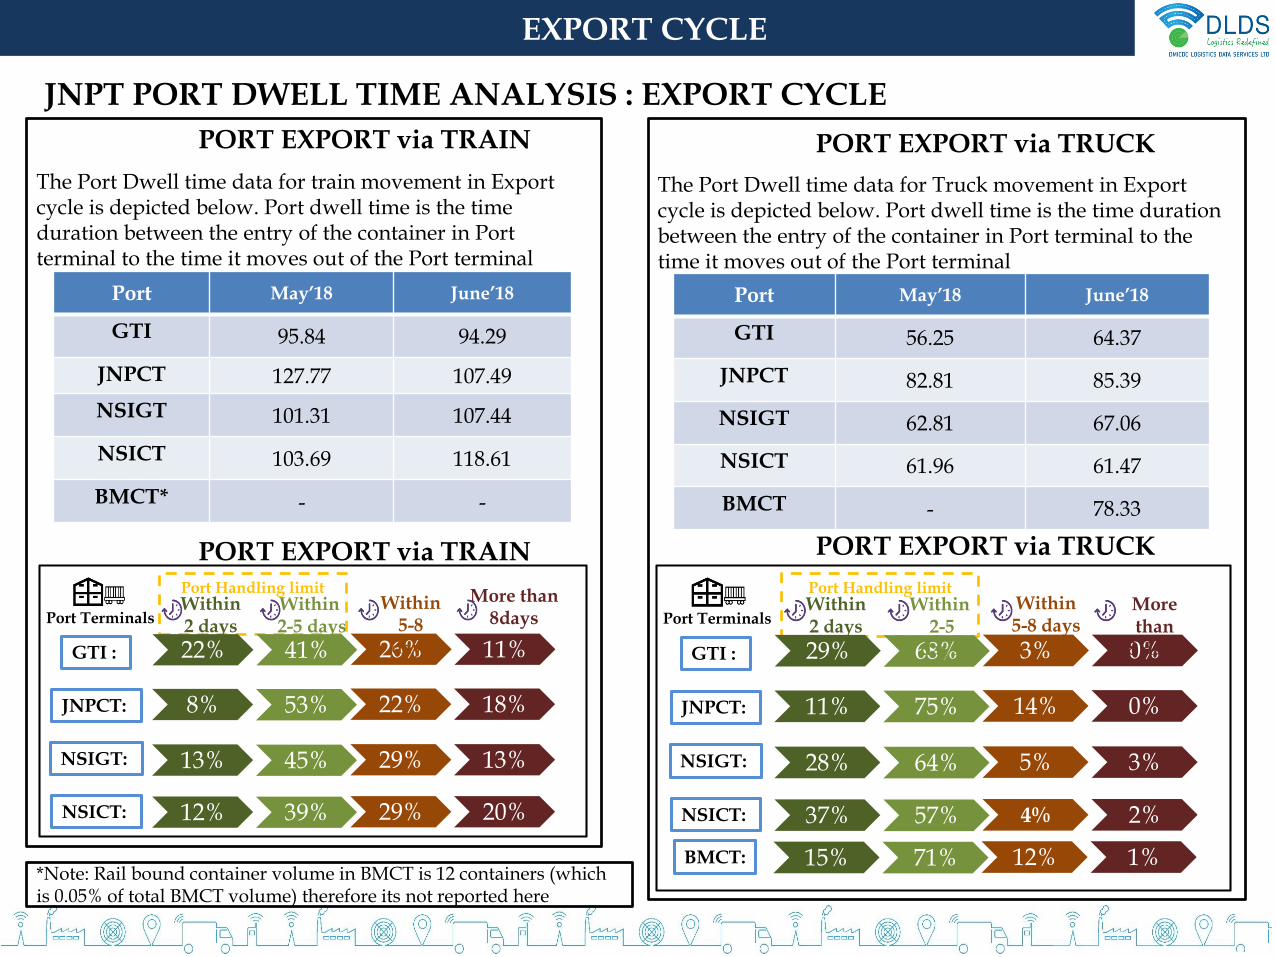
The Port Dwell time data for train movement in Export cycle is depicted below. Port dwell time is the time duration between the entry of the container in Port terminal to the time it moves out of the Port terminal
PORT EXPORT via TRAIN
Port May’18 June’18
GTI 95.84 94.29
JNPCT 127.77 107.49
NSIGT 101.31 107.44
NSICT 103.69 118.61
BMCT* - -
The Port Dwell time data for Truck movement in Export cycle is depicted below. Port dwell time is the time duration between the entry of the container in Port terminal to the time it moves out of the Port terminal
PORT EXPORT via TRUCK
Port May’18 June’18
GTI 56.25 64.37
JNPCT 82.81 85.39
NSIGT 62.81 67.06
NSICT 61.96 61.47
BMCT - 78.33
Port Handling limit
22% 41% 26% 11% GTI :
JNPCT:
NSIGT:
NSICT:
More than 8days
Within 5-8
days
Within2-5 days
Within 2 daysPort Terminals
8% 53% 22% 18%
13% 45% 29% 13%
12% 39% 29% 20%
PORT EXPORT via TRAIN PORT EXPORT via TRUCK
EXPORT CYCLE
JNPT PORT DWELL TIME ANALYSIS : EXPORT CYCLE
Port Handling limit
29% 68% 3% 0% GTI :
JNPCT:
NSIGT:
NSICT:
More than
8 days
Within 5-8 days
Within2-5
days
Within 2 daysPort Terminals
11% 75% 14% 0%
28% 64% 5% 3%
37% 57% 4% 2%
BMCT: 15% 71% 12% 1% *Note: Rail bound container volume in BMCT is 12 containers (which is 0.05% of total BMCT volume) therefore its not reported here
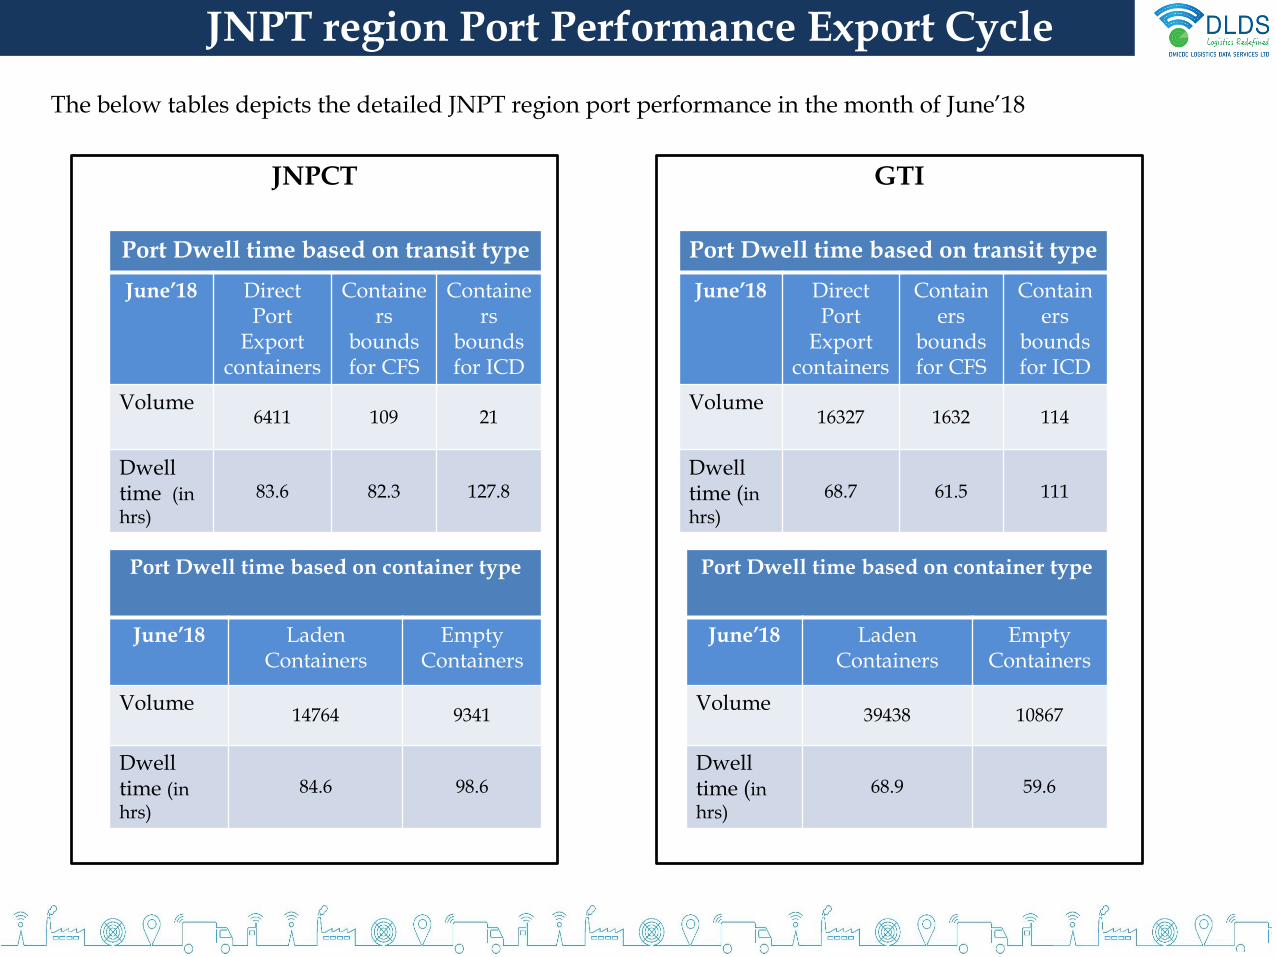
JNPT region Port Performance Export Cycle
The below tables depicts the detailed JNPT region port performance in the month of June’18
Port Dwell time based on transit type
June’18 Direct Port
Export containers
Containers
bounds for CFS
Containers
bounds for ICD
Volume6411 109 21
Dwell time (in hrs)
83.6 82.3 127.8
Port Dwell time based on container type
June’18 Laden Containers
Empty Containers
Volume14764 9341
Dwell time (in hrs)
84.6 98.6
JNPCT
Port Dwell time based on transit type
June’18 Direct Port
Export containers
Containers
bounds for CFS
Containers
bounds for ICD
Volume16327 1632 114
Dwell time (in hrs)
68.7 61.5 111
Port Dwell time based on container type
June’18 Laden Containers
Empty Containers
Volume39438 10867
Dwell time (in hrs)
68.9 59.6
GTI
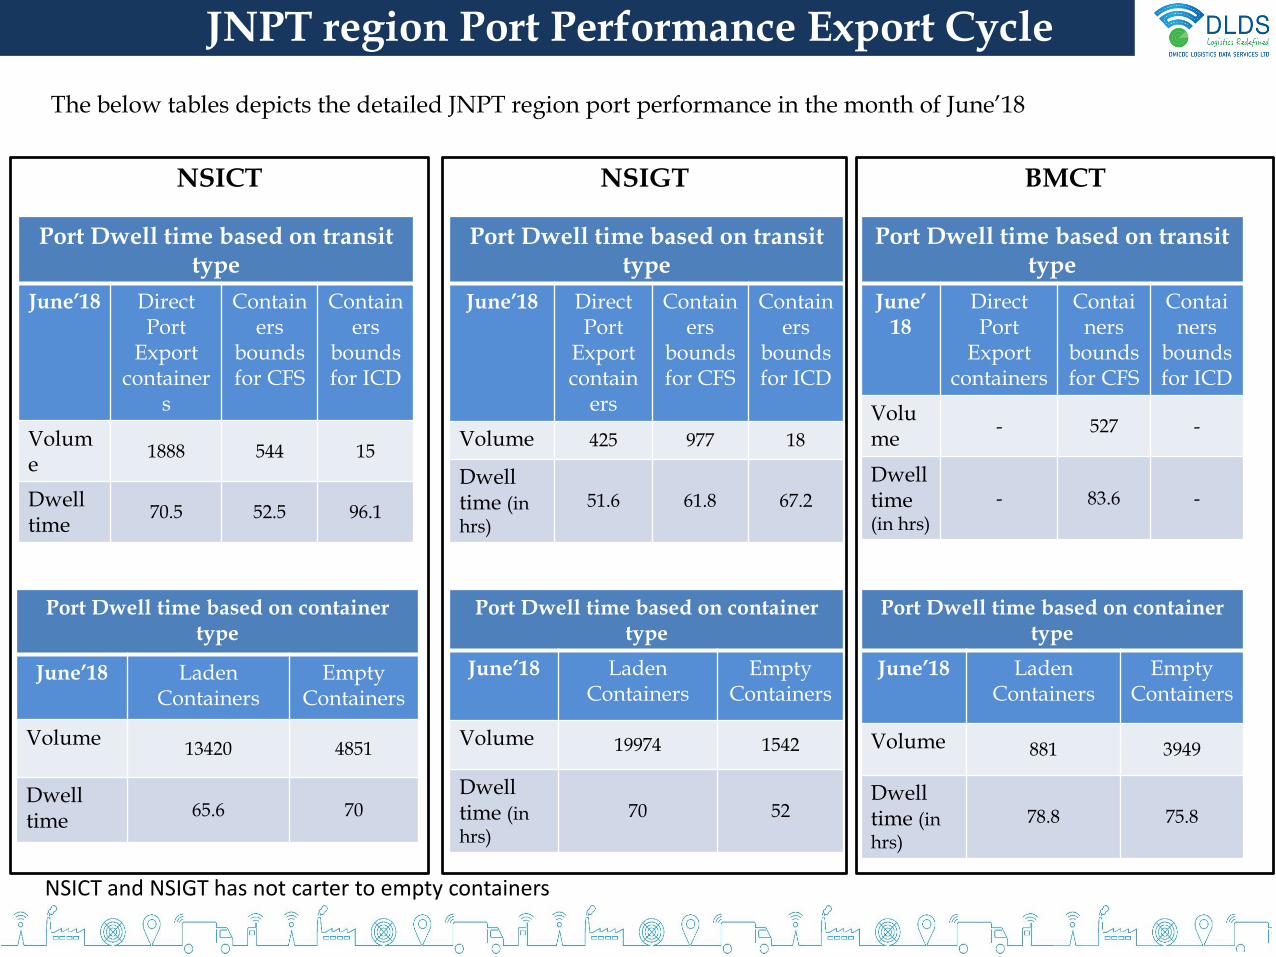
JNPT region Port Performance Export Cycle
The below tables depicts the detailed JNPT region port performance in the month of June’18
Port Dwell time based on transittype
June’18 Direct Port
Export container
s
Containers
bounds for CFS
Containers
bounds for ICD
Volume
1888 544 15
Dwell time
70.5 52.5 96.1
Port Dwell time based on containertype
June’18 Laden Containers
Empty Containers
Volume13420 4851
Dwell time
65.6 70
Port Dwell time based on transittype
June’18 Direct Port
Export contain
ers
Containers
bounds for CFS
Containers
bounds for ICD
Volume 425 977 18
Dwell time (in hrs)
51.6 61.8 67.2
Port Dwell time based on containertype
June’18 Laden Containers
Empty Containers
Volume 19974 1542
Dwell time (in hrs)
70 52
NSIGT
Port Dwell time based on transittype
June’18
Direct Port
Export containers
Containers
bounds for CFS
Containers
bounds for ICD
Volume
- 527 -
Dwell time (in hrs)
- 83.6 -
Port Dwell time based on containertype
June’18 Laden Containers
Empty Containers
Volume 881 3949
Dwell time (in hrs)
78.8 75.8
BMCTNSICT
NSICT and NSIGT has not carter to empty containers
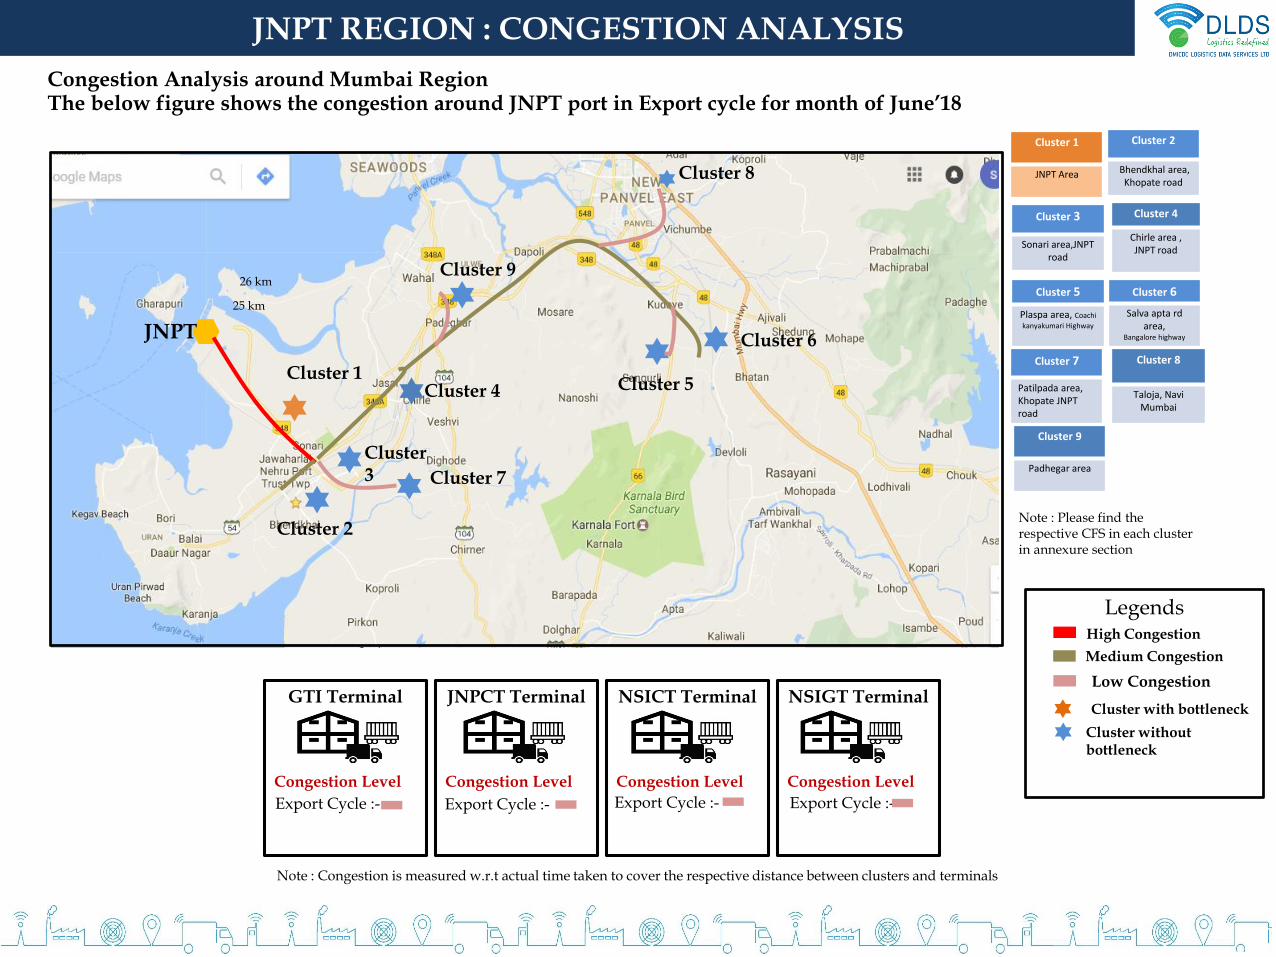
JNPT REGION : CONGESTION ANALYSIS
Congestion Analysis around Mumbai Region
High Congestion
Cluster without bottleneck
Cluster with bottleneck
Medium Congestion
GTI Terminal
Congestion Level
JNPCT Terminal
Congestion Level
NSICT Terminal
Congestion Level
NSIGT Terminal
Congestion Level
Export Cycle :- Export Cycle :- Export Cycle :- Export Cycle :-
Note : Congestion is measured w.r.t actual time taken to cover the respective distance between clusters and terminals
Cluster 1
JNPT Area
Cluster 2
Bhendkhal area, Khopate road
Cluster 3
Sonari area,JNPT road
Cluster 5
Plaspa area, Coachi
kanyakumari Highway
Cluster 6
Salva apta rd area,
Bangalore highway
Cluster 7
Patilpada area, Khopate JNPT road
Note : Please find the respective CFS in each cluster in annexure section
Cluster 8
Taloja, Navi Mumbai
Low Congestion
Legends
Cluster 9
Padhegar area
Cluster 4
Chirle area , JNPT road
The below figure shows the congestion around JNPT port in Export cycle for month of June’18
Cluster 2
Cluster 5
Cluster 7
Cluster 4
Cluster 6
Cluster 3
Cluster 1
JNPT
25 km
26 km
Cluster 8
Cluster 9

20%
10%
56%
EXPORT CYCLE
Panvel Route
Nagpur Route
Vadodara Route
Bhopal Route
14%
The map shows the volume wise container movement through different railway routes in export and import cycle for June’18
Container movement around JNPT Port terminal region via Train
EXPORT CYCLE
To JNPT Port From
Route Percentage of Container Movement
From Wardha Jn. To JNPT Port (Nagpur Route) 10%
From Varodhra Jn To JNPT Port (Varodara Route) 20%
From Panwel Jn To JNPT Port (Panwel Route) 56%
From Jalgaon Jn To JNPT Port (Bhopal Route) 14%
CFS and ICD Performance
CFS and ICD Performance
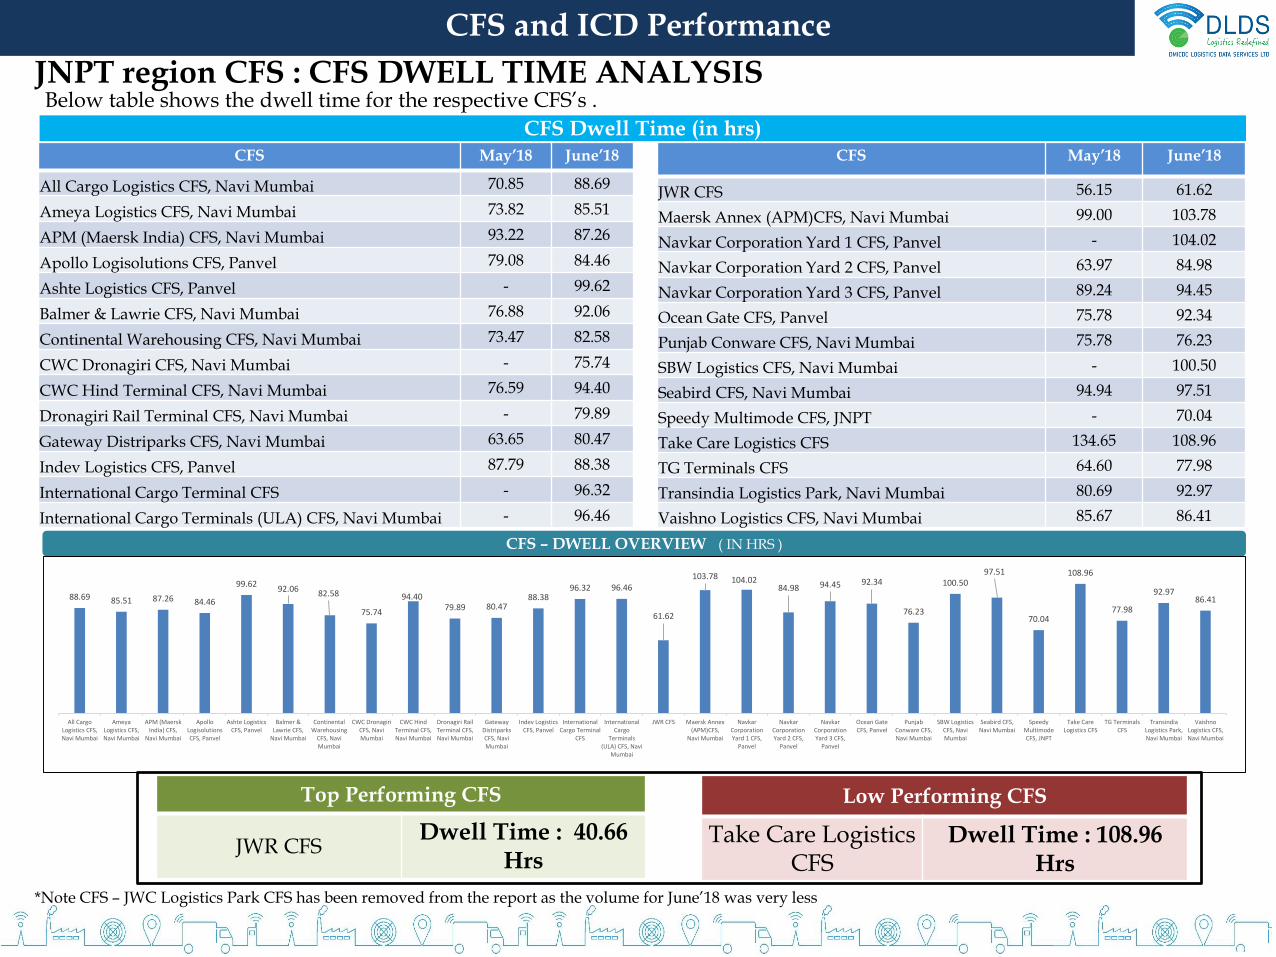
CFS May’18 June’18
All Cargo Logistics CFS, Navi Mumbai 70.85 88.69
Ameya Logistics CFS, Navi Mumbai 73.82 85.51
APM (Maersk India) CFS, Navi Mumbai 93.22 87.26
Apollo Logisolutions CFS, Panvel 79.08 84.46
Ashte Logistics CFS, Panvel - 99.62
Balmer & Lawrie CFS, Navi Mumbai 76.88 92.06
Continental Warehousing CFS, Navi Mumbai 73.47 82.58
CWC Dronagiri CFS, Navi Mumbai - 75.74
CWC Hind Terminal CFS, Navi Mumbai 76.59 94.40
Dronagiri Rail Terminal CFS, Navi Mumbai - 79.89
Gateway Distriparks CFS, Navi Mumbai 63.65 80.47
Indev Logistics CFS, Panvel 87.79 88.38
International Cargo Terminal CFS - 96.32
International Cargo Terminals (ULA) CFS, Navi Mumbai - 96.46
Below table shows the dwell time for the respective CFS’s .
CFS May’18 June’18
JWR CFS 56.15 61.62
Maersk Annex (APM)CFS, Navi Mumbai 99.00 103.78
Navkar Corporation Yard 1 CFS, Panvel - 104.02
Navkar Corporation Yard 2 CFS, Panvel 63.97 84.98
Navkar Corporation Yard 3 CFS, Panvel 89.24 94.45
Ocean Gate CFS, Panvel 75.78 92.34
Punjab Conware CFS, Navi Mumbai 75.78 76.23
SBW Logistics CFS, Navi Mumbai - 100.50
Seabird CFS, Navi Mumbai 94.94 97.51
Speedy Multimode CFS, JNPT - 70.04
Take Care Logistics CFS 134.65 108.96
TG Terminals CFS 64.60 77.98
Transindia Logistics Park, Navi Mumbai 80.69 92.97
Vaishno Logistics CFS, Navi Mumbai 85.67 86.41
CFS Dwell Time (in hrs)
JNPT region CFS : CFS DWELL TIME ANALYSIS
CFS – DWELL OVERVIEW ( IN HRS )
88.69 85.51 87.26 84.46
99.6292.06 82.58
75.74
94.4079.89 80.47
88.3896.32 96.46
61.62
103.78 104.0284.98 94.45 92.34
76.23
100.5097.51
70.04
108.96
77.98
92.9786.41
All CargoLogistics CFS,Navi Mumbai
AmeyaLogistics CFS,Navi Mumbai
APM (MaerskIndia) CFS,
Navi Mumbai
ApolloLogisolutionsCFS, Panvel
Ashte LogisticsCFS, Panvel
Balmer &Lawrie CFS,
Navi Mumbai
ContinentalWarehousing
CFS, NaviMumbai
CWC DronagiriCFS, NaviMumbai
CWC HindTerminal CFS,Navi Mumbai
Dronagiri RailTerminal CFS,Navi Mumbai
GatewayDistriparksCFS, NaviMumbai
Indev LogisticsCFS, Panvel
InternationalCargo Terminal
CFS
InternationalCargo
Terminals(ULA) CFS, Navi
Mumbai
JWR CFS Maersk Annex(APM)CFS,
Navi Mumbai
NavkarCorporationYard 1 CFS,
Panvel
NavkarCorporationYard 2 CFS,
Panvel
NavkarCorporationYard 3 CFS,
Panvel
Ocean GateCFS, Panvel
PunjabConware CFS,Navi Mumbai
SBW LogisticsCFS, NaviMumbai
Seabird CFS,Navi Mumbai
SpeedyMultimodeCFS, JNPT
Take CareLogistics CFS
TG TerminalsCFS
TransindiaLogistics Park,Navi Mumbai
VaishnoLogistics CFS,Navi Mumbai
Top Performing CFS
JWR CFSDwell Time : 40.66
Hrs
Low Performing CFS
Take Care Logistics CFS
Dwell Time : 108.96 Hrs
*Note CFS – JWC Logistics Park CFS has been removed from the report as the volume for June’18 was very less
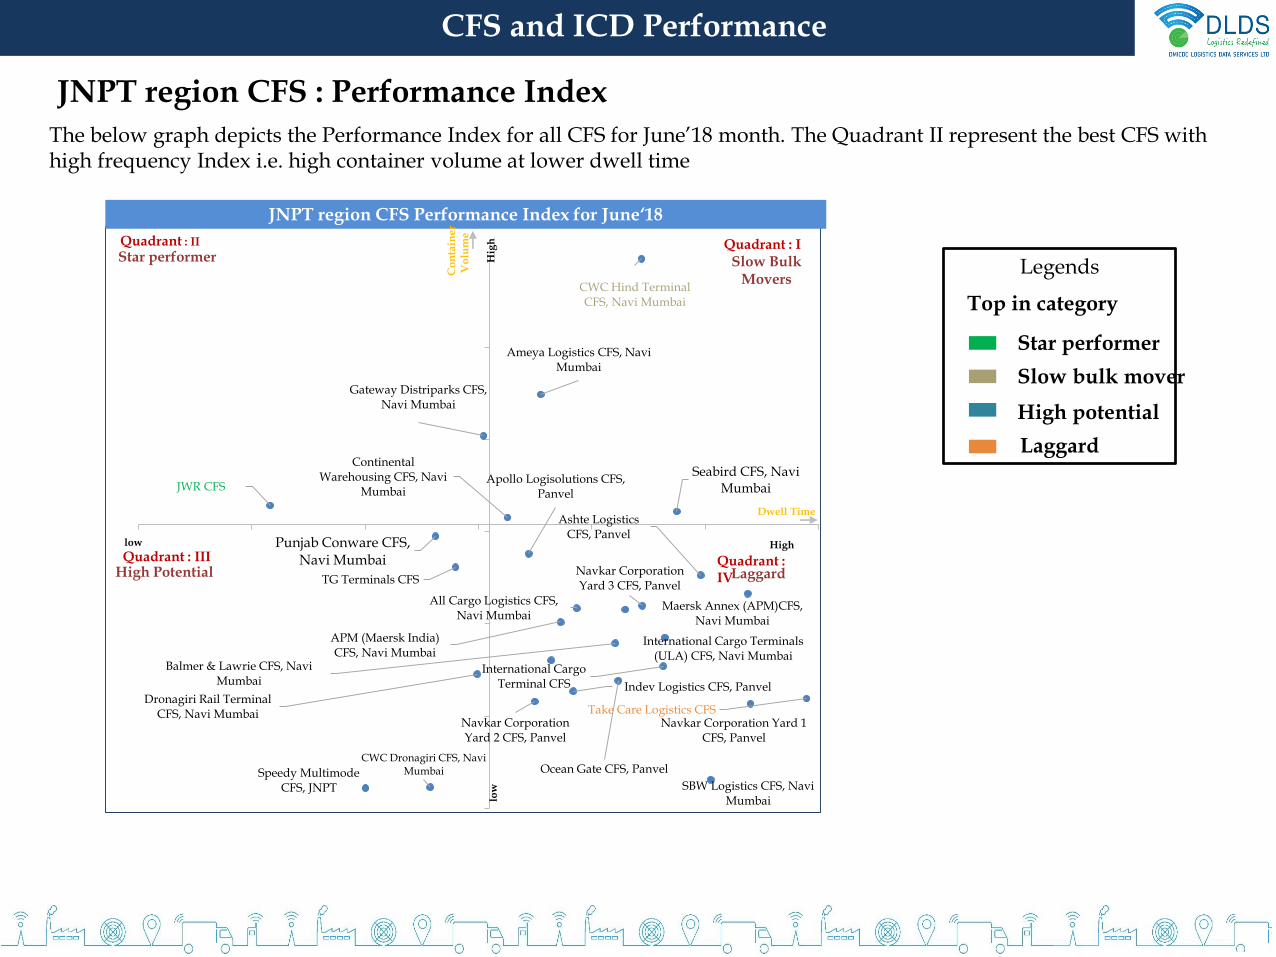
The below graph depicts the Performance Index for all CFS for June’18 month. The Quadrant II represent the best CFS with high frequency Index i.e. high container volume at lower dwell time
CFS and ICD Performance
Top in category
Star performer
Slow bulk mover
High potential
Laggard
Legends
All Cargo Logistics CFS, Navi Mumbai
Ameya Logistics CFS, Navi Mumbai
APM (Maersk India) CFS, Navi Mumbai
Apollo Logisolutions CFS, Panvel
Ashte Logistics CFS, Panvel
Balmer & Lawrie CFS, Navi Mumbai
Continental Warehousing CFS, Navi
Mumbai
CWC Dronagiri CFS, Navi Mumbai
CWC Hind Terminal CFS, Navi Mumbai
Dronagiri Rail Terminal CFS, Navi Mumbai
Gateway Distriparks CFS, Navi Mumbai
Indev Logistics CFS, Panvel
International Cargo Terminal CFS
International Cargo Terminals (ULA) CFS, Navi Mumbai
JWR CFS
Maersk Annex (APM)CFS, Navi Mumbai
Navkar Corporation Yard 1 CFS, Panvel
Navkar Corporation Yard 2 CFS, Panvel
Navkar Corporation Yard 3 CFS, Panvel
Ocean Gate CFS, Panvel
Punjab Conware CFS, Navi Mumbai
SBW Logistics CFS, Navi Mumbai
Seabird CFS, Navi Mumbai
Speedy Multimode CFS, JNPT
Take Care Logistics CFS
TG Terminals CFS
Quadrant : IQuadrant : II
Quadrant : III Quadrant : IV
JNPT region CFS Performance Index for June‘18
Dwell Time
Co
nta
ine
rV
olu
me
Highlow
low
Hig
h
Star performer
Laggard
Slow Bulk Movers
High Potential
JNPT region CFS : Performance Index
*Based on Dwell time for June’18
CFS and ICD Performance
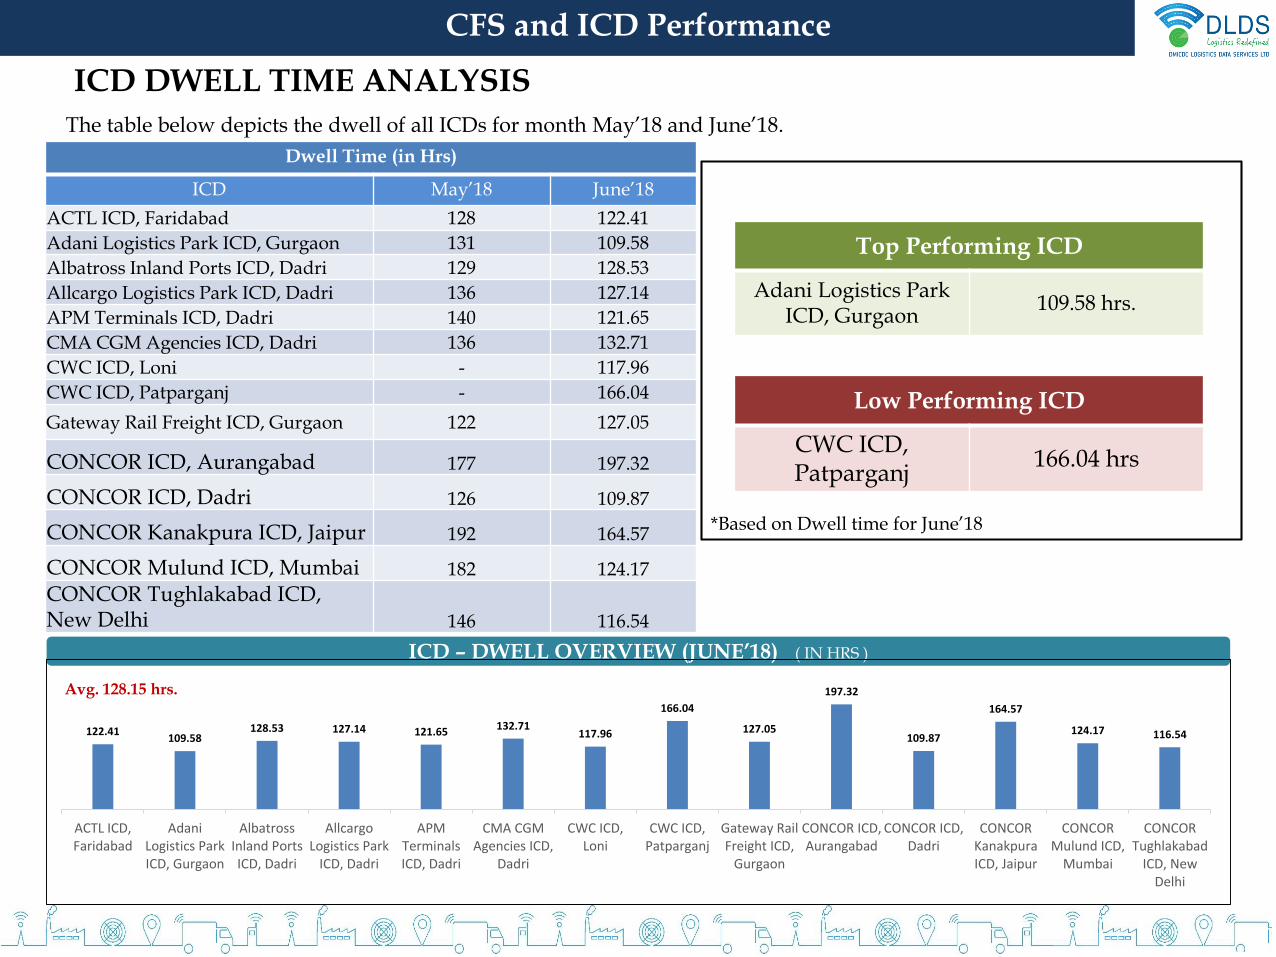
Dwell Time (in Hrs)
ICD May’18 June’18
ACTL ICD, Faridabad 128 122.41
Adani Logistics Park ICD, Gurgaon 131 109.58
Albatross Inland Ports ICD, Dadri 129 128.53
Allcargo Logistics Park ICD, Dadri 136 127.14
APM Terminals ICD, Dadri 140 121.65
CMA CGM Agencies ICD, Dadri 136 132.71
CWC ICD, Loni - 117.96
CWC ICD, Patparganj - 166.04
Gateway Rail Freight ICD, Gurgaon 122 127.05
CONCOR ICD, Aurangabad 177 197.32
CONCOR ICD, Dadri 126 109.87
CONCOR Kanakpura ICD, Jaipur 192 164.57
CONCOR Mulund ICD, Mumbai 182 124.17
CONCOR Tughlakabad ICD, New Delhi 146 116.54
The table below depicts the dwell of all ICDs for month May’18 and June’18.
ICD DWELL TIME ANALYSIS
ICD – DWELL OVERVIEW (JUNE’18) ( IN HRS )
122.41109.58
128.53 127.14 121.65 132.71117.96
166.04
127.05
197.32
109.87
164.57
124.17 116.54
ACTL ICD,Faridabad
AdaniLogistics ParkICD, Gurgaon
AlbatrossInland PortsICD, Dadri
AllcargoLogistics Park
ICD, Dadri
APMTerminalsICD, Dadri
CMA CGMAgencies ICD,
Dadri
CWC ICD,Loni
CWC ICD,Patparganj
Gateway RailFreight ICD,
Gurgaon
CONCOR ICD,Aurangabad
CONCOR ICD,Dadri
CONCORKanakpuraICD, Jaipur
CONCORMulund ICD,
Mumbai
CONCORTughlakabad
ICD, NewDelhi
Top Performing ICD
Adani Logistics Park ICD, Gurgaon
109.58 hrs.
Low Performing ICD
CWC ICD, Patparganj
166.04 hrs
Avg. 128.15 hrs.
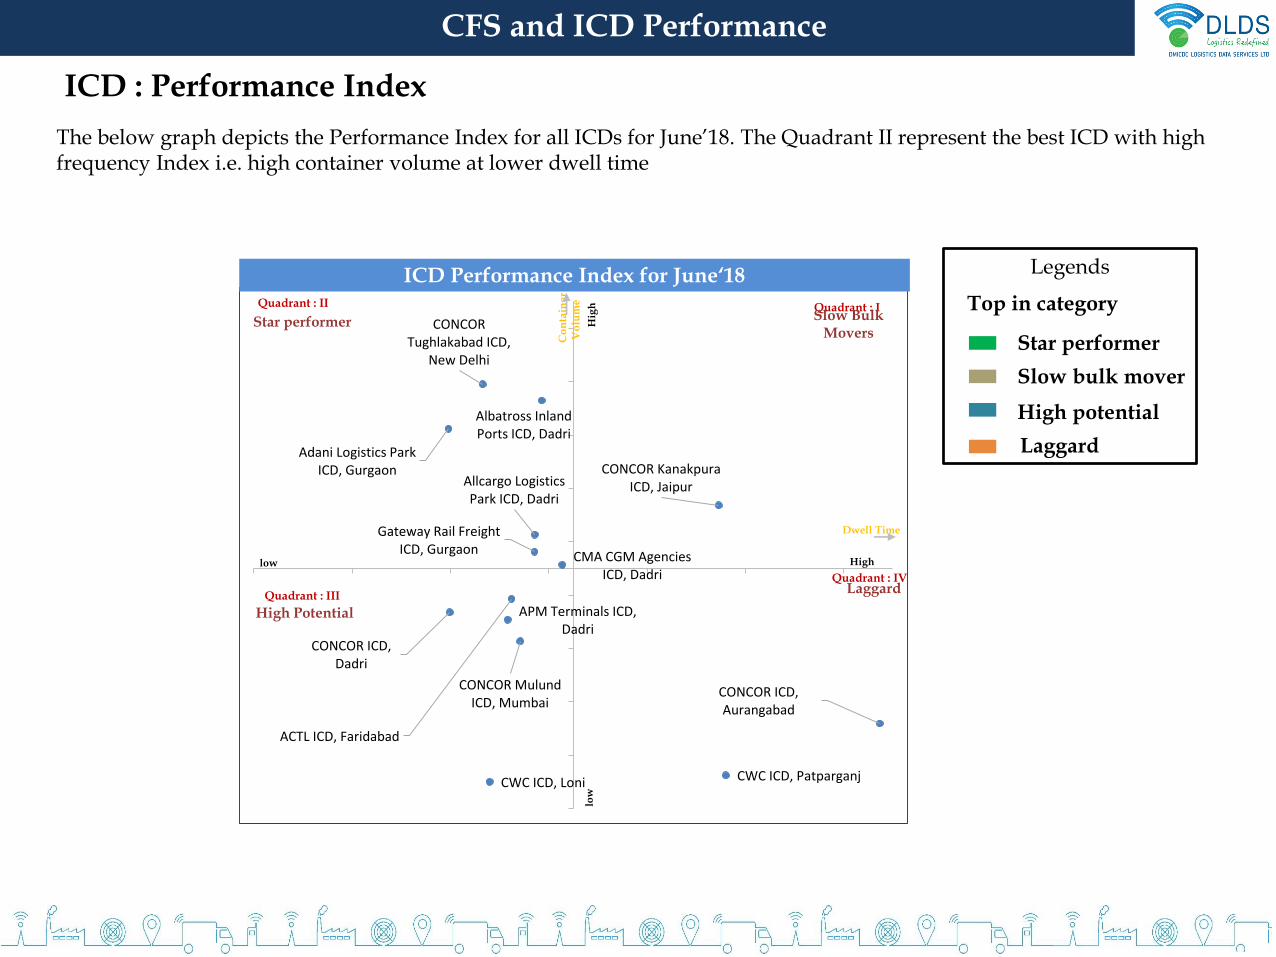
The below graph depicts the Performance Index for all ICDs for June’18. The Quadrant II represent the best ICD with high frequency Index i.e. high container volume at lower dwell time
ICD : Performance Index
CONCOR ICD, Aurangabad
CONCOR ICD, Dadri
CONCOR Kanakpura ICD, Jaipur
CONCOR Mulund ICD, Mumbai
CONCOR Tughlakabad ICD,
New Delhi
ACTL ICD, Faridabad
Adani Logistics Park ICD, Gurgaon
Albatross Inland Ports ICD, Dadri
Allcargo Logistics Park ICD, Dadri
APM Terminals ICD, Dadri
CMA CGM Agencies ICD, Dadri
CWC ICD, Loni CWC ICD, Patparganj
Gateway Rail Freight ICD, Gurgaon
Quadrant : IQuadrant : II
Quadrant : III
Quadrant : IV
ICD Performance Index for June‘18
Dwell Time
Co
nta
ine
rV
olu
me
Highlow
low
Hig
h
Star performer
Laggard
Slow Bulk Movers
High Potential
Top in category
Star performer
Slow bulk mover
High potential
Laggard
Legends
CFS and ICD Performance
Trend Analysis
IMP
OR
TE
XP
OR
T
ICD
Mode JFM’18(Import Cycle)
Dwell Time
AMJ’18(Import Cycle)
Dwell Time
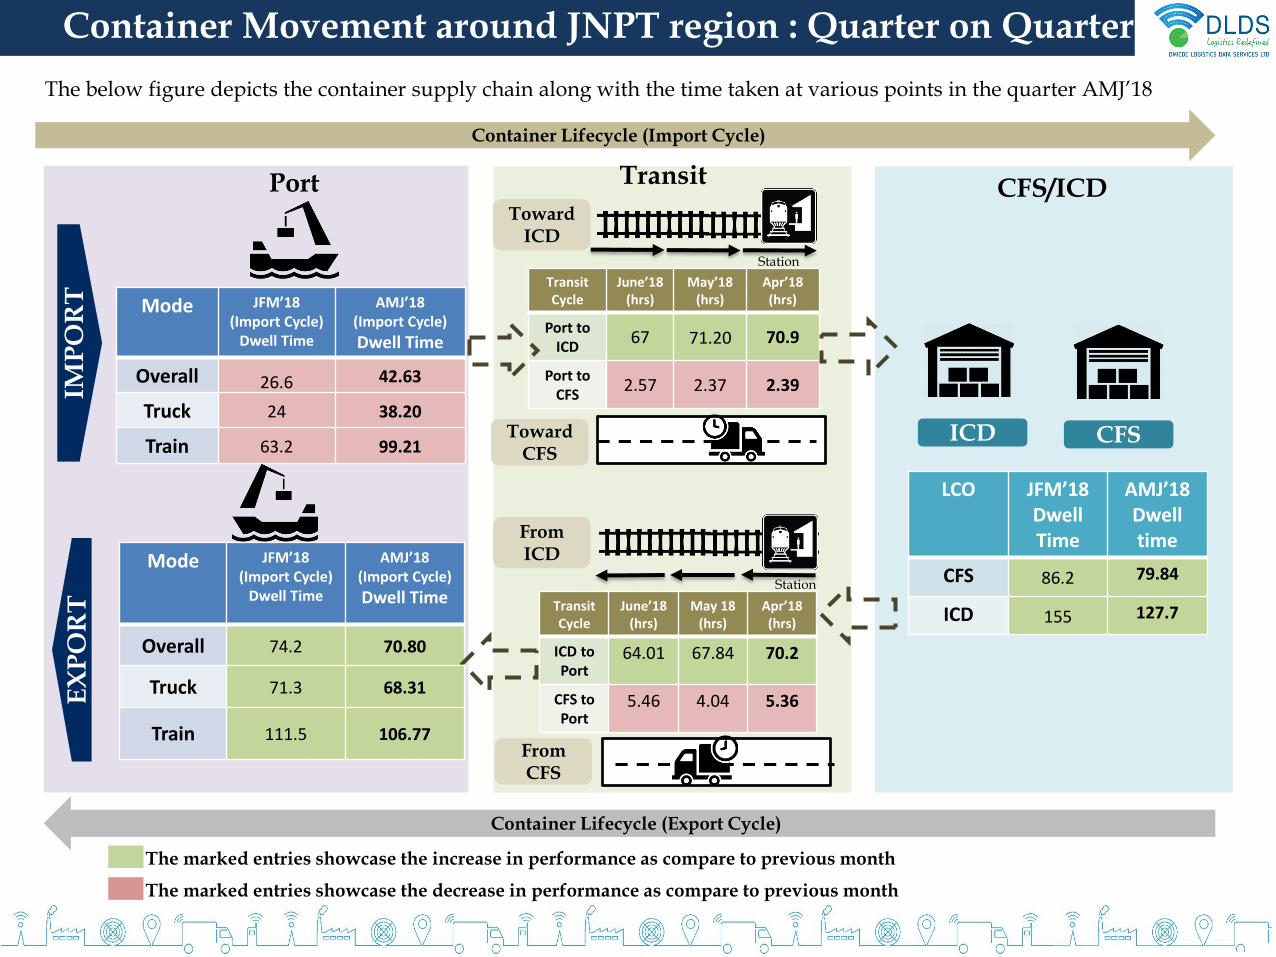
Overall 74.2 70.80
Truck 71.3 68.31
Train 111.5 106.77
Mode JFM’18(Import Cycle)
Dwell Time
AMJ’18(Import Cycle)
Dwell Time
Overall 26.6 42.63
Truck 24 38.20
Train 63.2 99.21
Toward ICD
Toward CFS
Station
From ICD
From CFS
Station
CFS
Transit Cycle
June’18(hrs)
May’18(hrs)
Apr’18(hrs)
Port to ICD
67 71.20 70.9
Port to CFS
2.57 2.37 2.39
LCO JFM’18Dwell Time
AMJ’18 Dwell time
CFS 86.2 79.84
ICD 155 127.7Transit Cycle
June’18(hrs)
May 18(hrs)
Apr’18(hrs)
ICD to Port
64.01 67.84 70.2
CFS to Port
5.46 4.04 5.36
Port Transit CFS/ICD
Container Lifecycle (Import Cycle)
Container Lifecycle (Export Cycle)
The below figure depicts the container supply chain along with the time taken at various points in the quarter AMJ’18
Container Movement around JNPT region : Quarter on Quarter
The marked entries showcase the increase in performance as compare to previous month
The marked entries showcase the decrease in performance as compare to previous month
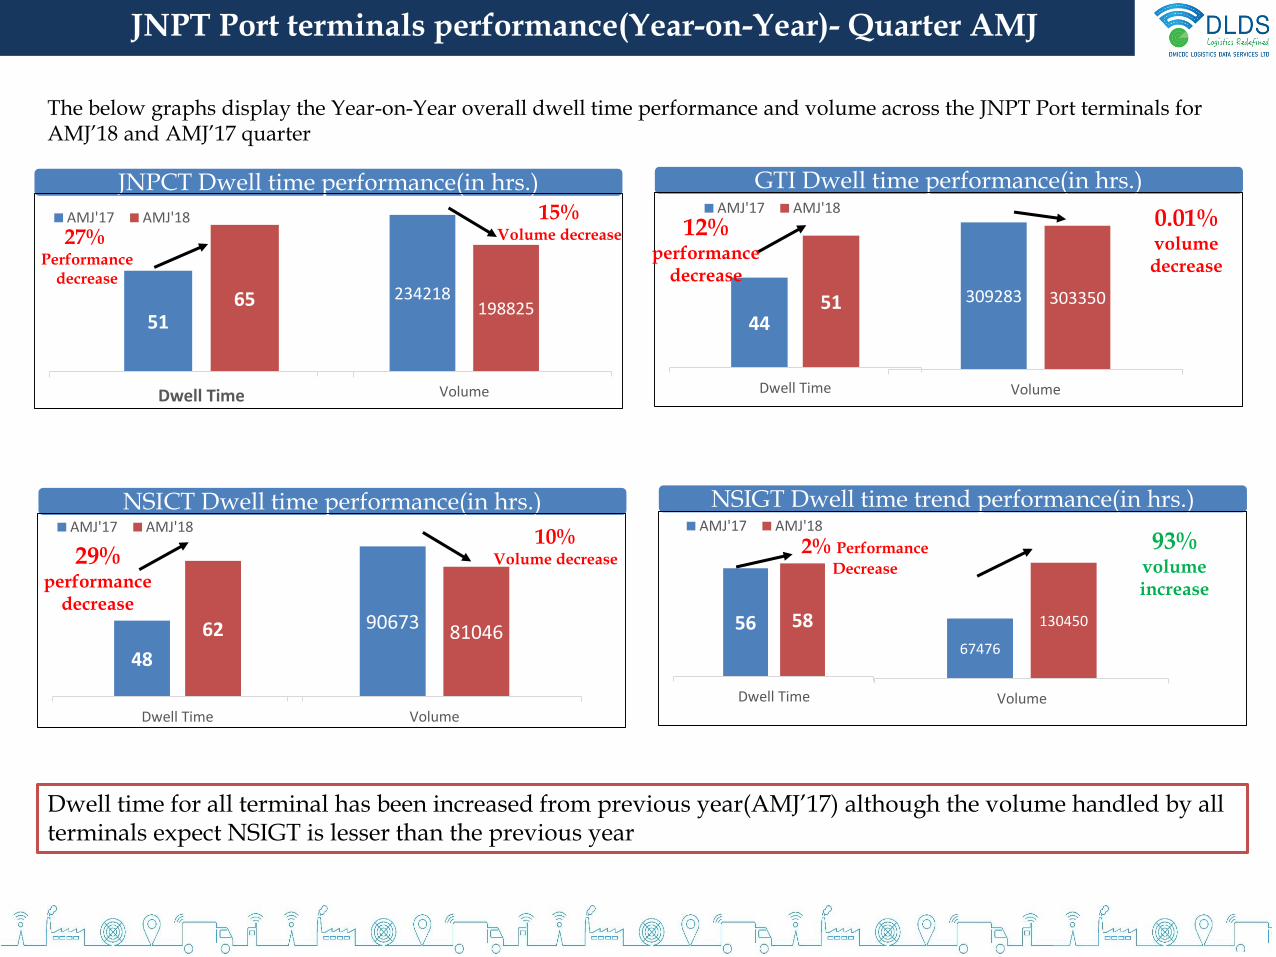
JNPT Port terminals performance(Year-on-Year)- Quarter AMJ
JNPCT Dwell time performance(in hrs.) GTI Dwell time performance(in hrs.)
NSICT Dwell time performance(in hrs.) NSIGT Dwell time trend performance(in hrs.)
The below graphs display the Year-on-Year overall dwell time performance and volume across the JNPT Port terminals for AMJ’18 and AMJ’17 quarter
Dwell time for all terminal has been increased from previous year(AMJ’17) although the volume handled by all terminals expect NSIGT is lesser than the previous year
5165
Dwell Time
AMJ'17 AMJ'18
4451
Dwell Time
AMJ'17 AMJ'18
48
62
Dwell Time
AMJ'17 AMJ'18
56 58
Dwell Time
AMJ'17 AMJ'18
27% Performance
decrease
12% performance
decrease
29% performance
decrease
2% Performance
Decrease
234218198825
Volume
15% Volume decrease
309283 303350
Volume
0.01% volumedecrease
90673 81046
Volume
10% Volume decrease
67476
130450
Volume
93% volumeincrease
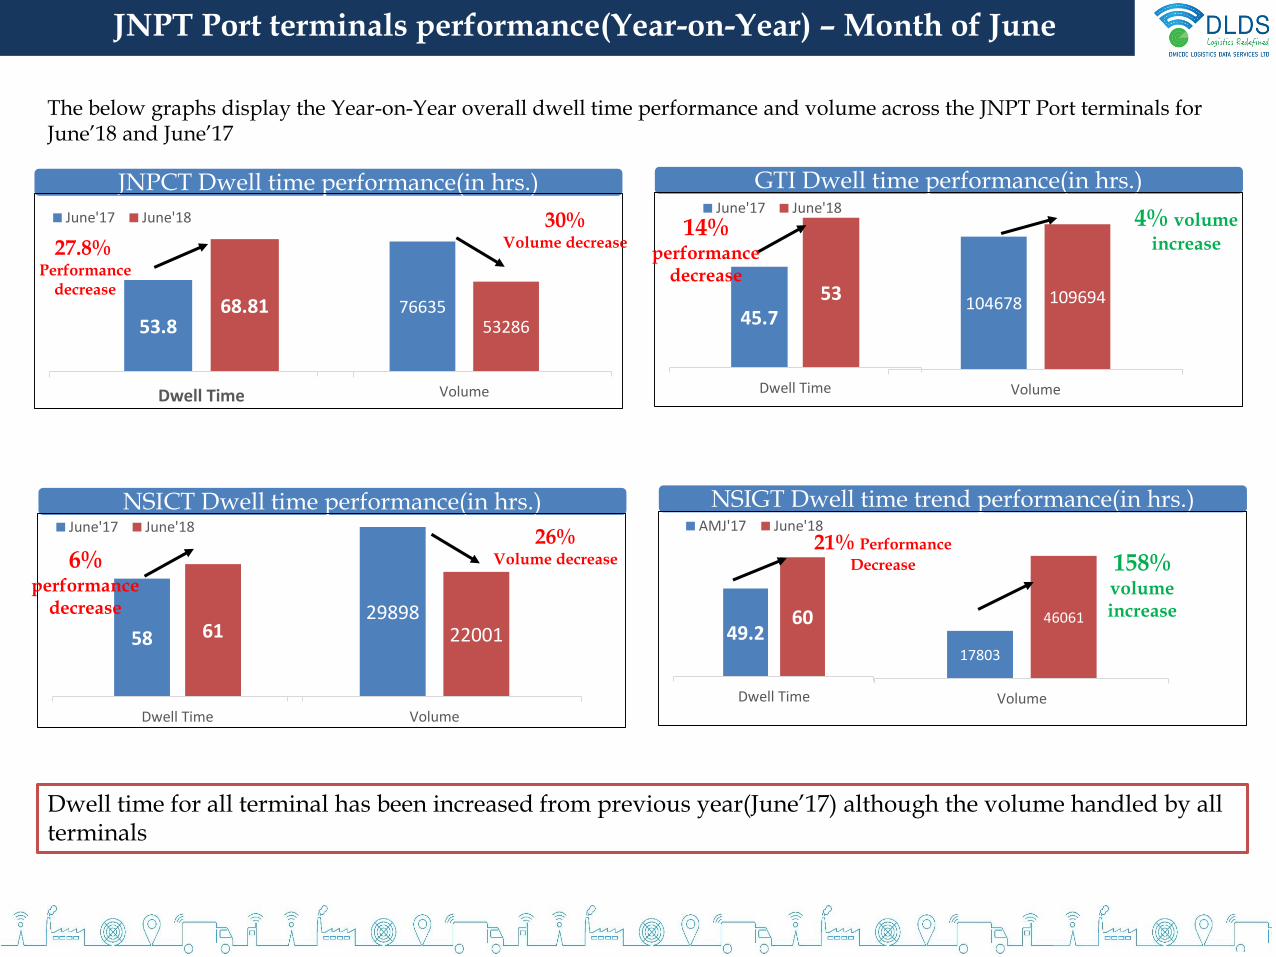
JNPT Port terminals performance(Year-on-Year) – Month of June
JNPCT Dwell time performance(in hrs.) GTI Dwell time performance(in hrs.)
NSICT Dwell time performance(in hrs.) NSIGT Dwell time trend performance(in hrs.)
The below graphs display the Year-on-Year overall dwell time performance and volume across the JNPT Port terminals for June’18 and June’17
Dwell time for all terminal has been increased from previous year(June’17) although the volume handled by all terminals
53.868.81
Dwell Time
June'17 June'18
45.753
Dwell Time
June'17 June'18
58 61
Dwell Time
June'17 June'18
49.260
Dwell Time
AMJ'17 June'18
27.8% Performance
decrease
14% performance
decrease
6% performance
decrease
21% Performance
Decrease
7663553286
Volume
30% Volume decrease
104678 109694
Volume
4% volume
increase
2989822001
Volume
26% Volume decrease
17803
46061
Volume
158% volumeincrease
JNPT PORT DWELL TIME TREND: Month on Month
57 4562 52
7253 63 62 7069
53 61 60 67
JNPCT GTI NSICT NSIGT BMCT
April'18 May'18 June'18
JNPT Region Dwell time: Overall (in hrs.)
34 29
4738
5445
58 5761
4739
5448 50
JNPCT GTI NSICT NSIGT BMCT
Apr'18 May'18 June'18
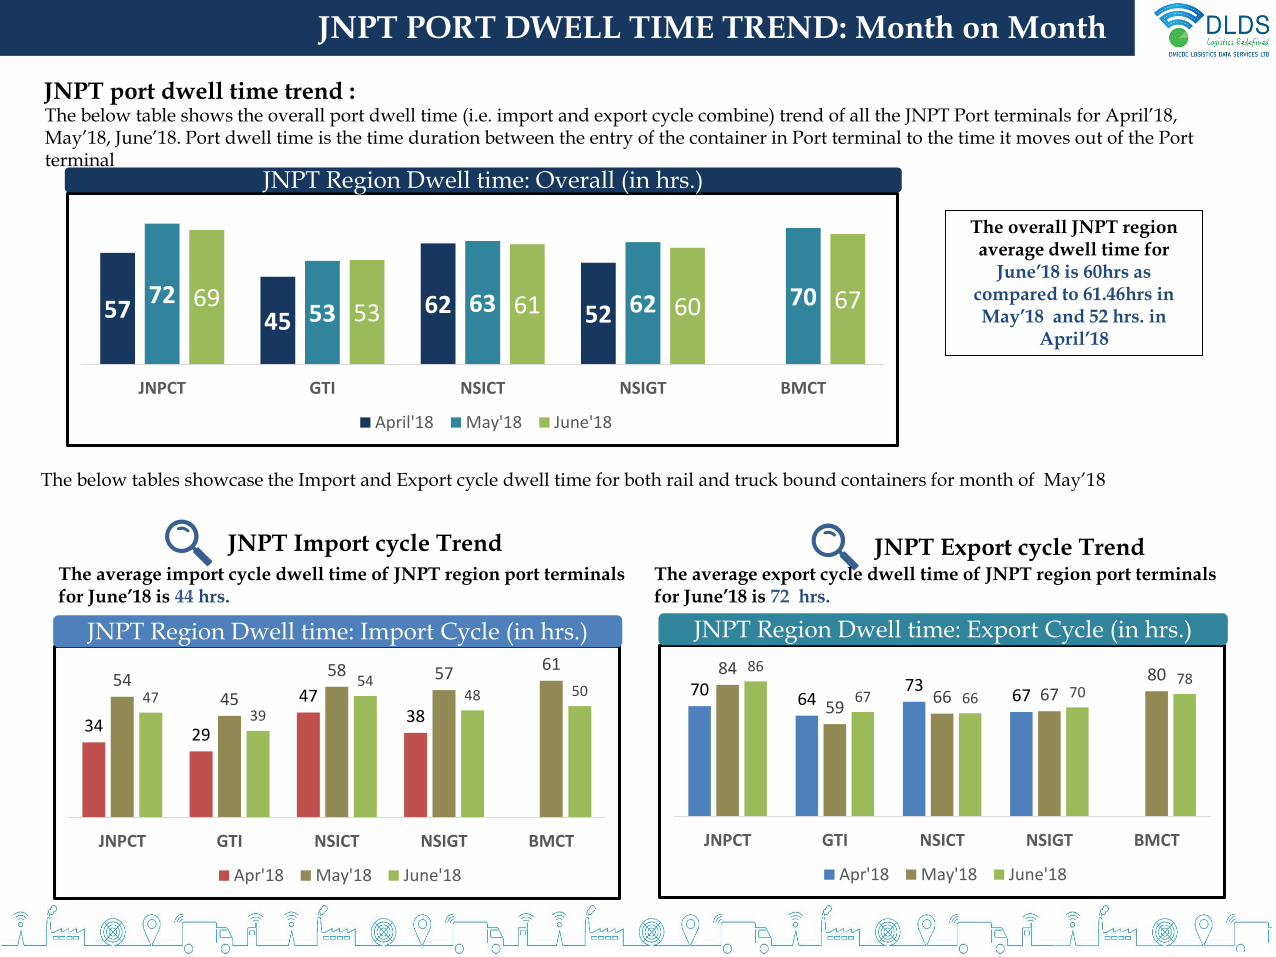
The average import cycle dwell time of JNPT region port terminals for June’18 is 44 hrs.
JNPT Region Dwell time: Import Cycle (in hrs.)
JNPT Import cycle Trend
JNPT port dwell time trend :The below table shows the overall port dwell time (i.e. import and export cycle combine) trend of all the JNPT Port terminals for April’18, May’18, June’18. Port dwell time is the time duration between the entry of the container in Port terminal to the time it moves out of the Port terminal
The below tables showcase the Import and Export cycle dwell time for both rail and truck bound containers for month of May’18
The overall JNPT region average dwell time for
June’18 is 60hrs as compared to 61.46hrs in May’18 and 52 hrs. in
April’18
7064
7367
84
5966 67
8086
67 66 7078
JNPCT GTI NSICT NSIGT BMCT
Apr'18 May'18 June'18
JNPT Region Dwell time: Export Cycle (in hrs.)
JNPT Export cycle TrendThe average export cycle dwell time of JNPT region port terminals for June’18 is 72 hrs.
JNPT Port terminals Dwell Time Trend and Forecast
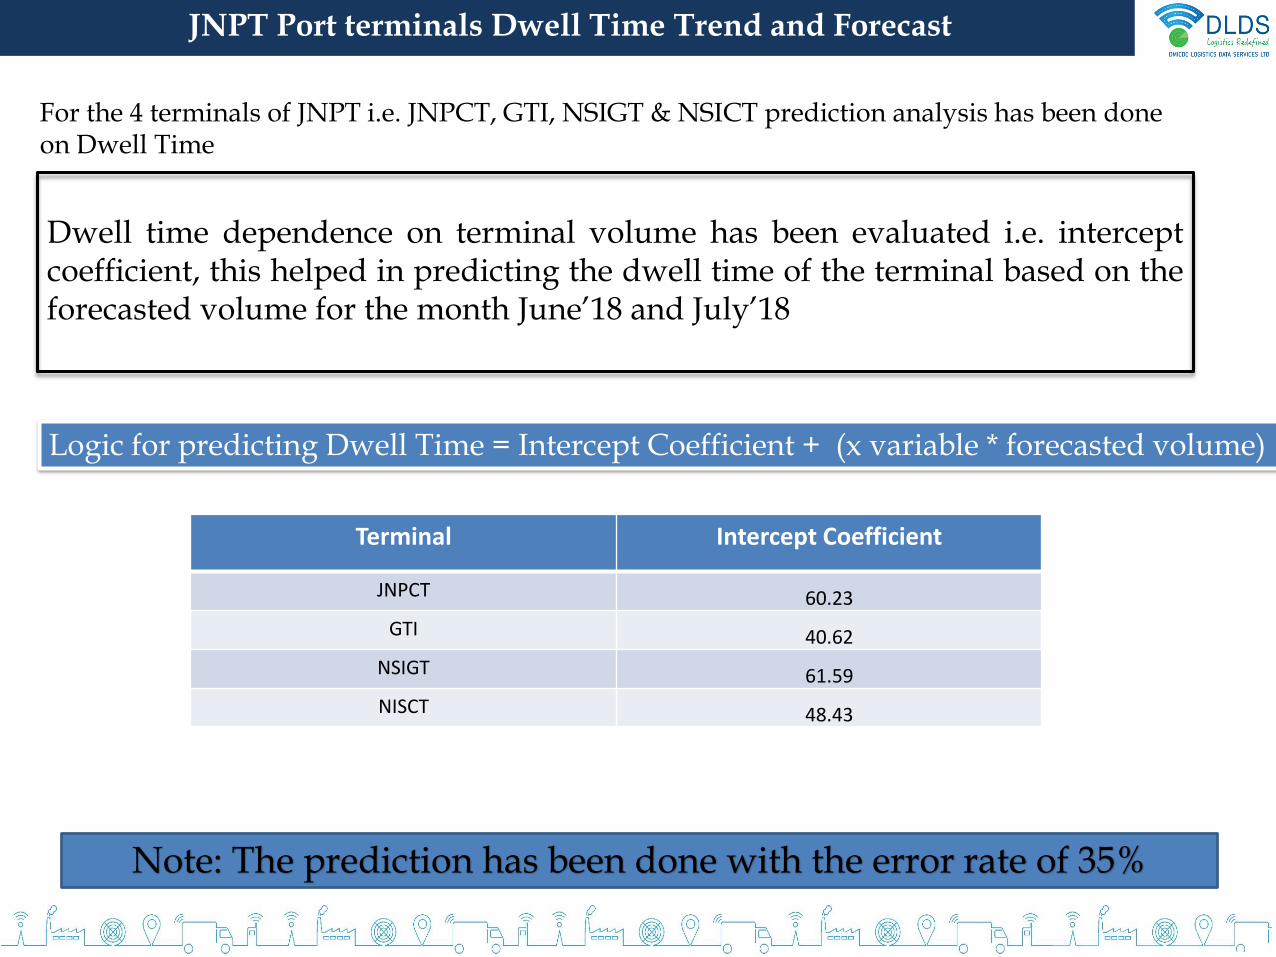
For the 4 terminals of JNPT i.e. JNPCT, GTI, NSIGT & NSICT prediction analysis has been done on Dwell Time
Logic for predicting Dwell Time = Intercept Coefficient + (x variable * forecasted volume)
Dwell time dependence on terminal volume has been evaluated i.e. interceptcoefficient, this helped in predicting the dwell time of the terminal based on theforecasted volume for the month June’18 and July’18
Terminal Intercept Coefficient
JNPCT 60.23
GTI 40.62
NSIGT 61.59
NISCT 48.43
Note: The prediction has been done with the error rate of 35%
JNPT Port terminals Dwell time Trend and Forecast
81938 83512
76635
85013
89284
84742
68063
78870
83635
79774
77860
69227
73023
72516
72038
71198
Container Volume Trend and forecast
Forecasted value
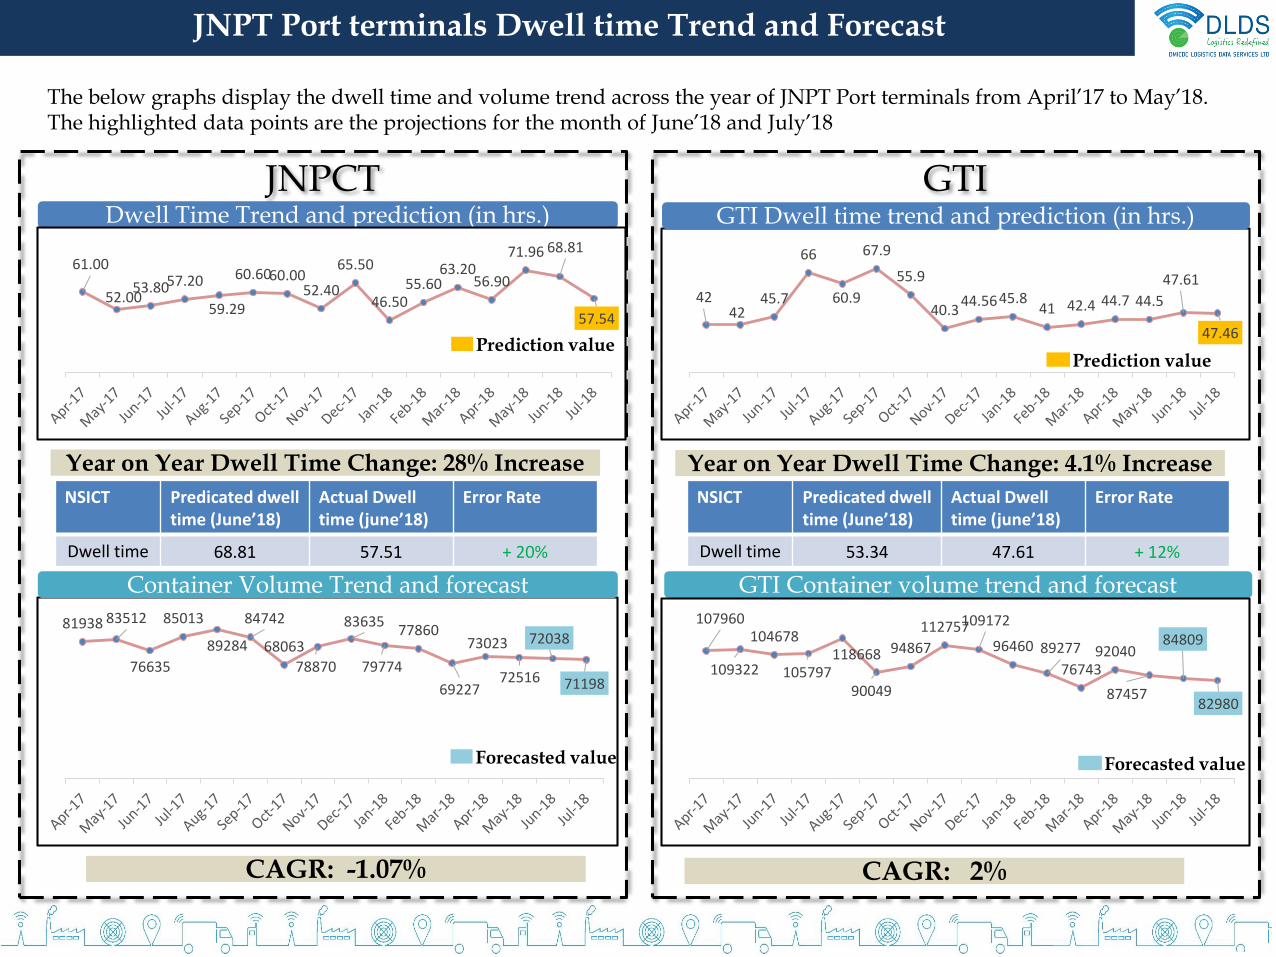
Year on Year Dwell Time Change: 28% Increase
Dwell Time Trend and prediction (in hrs.)
Prediction value
4242
45.7
66
60.9
67.9
55.9
40.344.5645.8
41 42.4 44.7 44.5
47.61
47.46
GTI Dwell time trend and prediction (in hrs.)
Prediction value
GTI Container volume trend and forecast
Forecasted value
107960
109322
104678
105797118668
90049
94867
112757109172
96460 89277
7674392040
87457
84809
82980
The below graphs display the dwell time and volume trend across the year of JNPT Port terminals from April’17 to May’18. The highlighted data points are the projections for the month of June’18 and July’18
JNPCT GTI
Year on Year Dwell Time Change: 4.1% Increase
CAGR: -1.07% CAGR: 2%
NSICT Predicated dwell time (June’18)
Actual Dwell time (june’18)
Error Rate
Dwell time 68.81 57.51 + 20%
NSICT Predicated dwell time (June’18)
Actual Dwell time (june’18)
Error Rate
Dwell time 53.34 47.61 + 12%
61.00
52.0053.8057.20
59.29
60.6060.0052.40
65.50
46.5055.60
63.2056.90
71.96 68.81
57.54
50
58 57.7
60.9
61.6 59.1 56.756.2557.850.9
55.961.8 58.7
62.00
56.80
Dwell Time Trend and prediction (hrs.)
prediction value
28692
29898
36949
37969
31534
29682
3554737722
34643
3203127668
33515
32873
32825
32792
Container Volume Trend and forecast
Forecasted value
62.00 61.00
49.20
64.90
56.70
65.10
61.0049.8048.3049.00
45.4050.00
51.90
46.90
57.59
50.55
Dwell Time Trend and prediction(in hrs.)
Prediction value
2520127029
17803
34196
15195
36322
31253
30571
31662
3955638333
49501 46804
46592
49417
51368
Container Volume Trend and forecast
Forecasted value
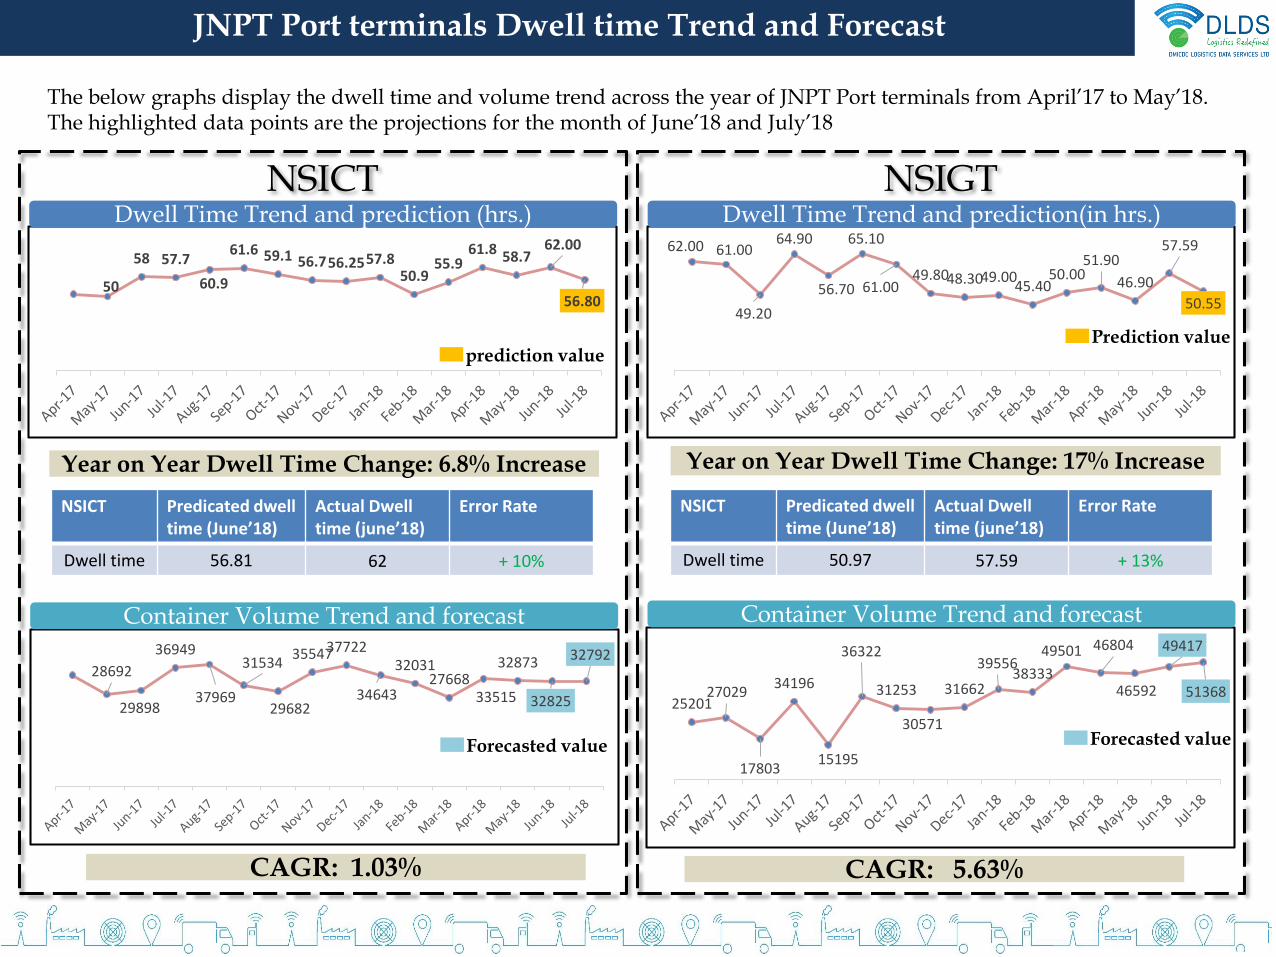
The below graphs display the dwell time and volume trend across the year of JNPT Port terminals from April’17 to May’18. The highlighted data points are the projections for the month of June’18 and July’18
JNPT Port terminals Dwell time Trend and Forecast
NSICT NSIGT
Year on Year Dwell Time Change: 6.8% Increase Year on Year Dwell Time Change: 17% Increase
CAGR: 1.03% CAGR: 5.63%
NSICT Predicated dwell time (June’18)
Actual Dwell time (june’18)
Error Rate
Dwell time 56.81 62 + 10%
NSICT Predicated dwell time (June’18)
Actual Dwell time (june’18)
Error Rate
Dwell time 50.97 57.59 + 13%
SECTION III:ANNEXURE
JNPT Region

Container movement around JNPT Port terminal region via Truck
51%MUMBAI REGION
Heat Map : June 2018
The heat map above depicts the movement of containers in and around the Mumbai region.
4%NH3
14%Pune route
10 %Other
s
Region May’18 June’18
Mumbai region
54% 51%
NH3 2% 2%
Pune 15% 14%
NH8 19% 23%
others 10% 10%
HEAT MAP : JNPCT Port Terminal
23%NH
8 2%NH3
60%MUMBAI REGION
Heat Map : June 2018
The heat map above depicts the movement of containers in and around the Mumbai region.
2%NH3
13 %Pune route
10 %Other
s
Region May’18 June’18
Mumbai region
60% 60%
NH3 1% 2%
Pune 14% 13%
NH8 15% 15%
others 10% 10%
15%NH
8
HEAT MAP : GTI Port Terminal
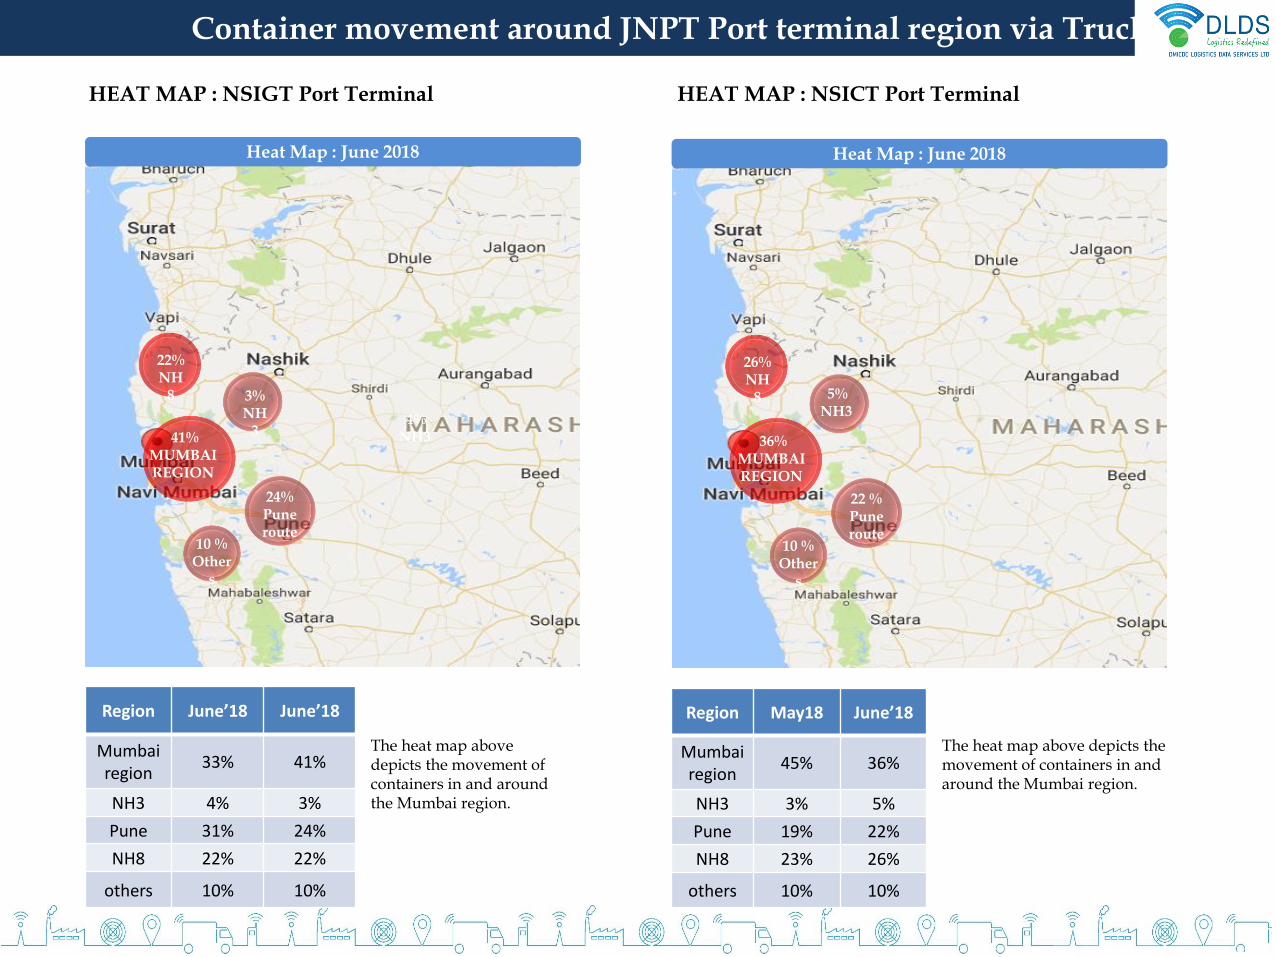
Container movement around JNPT Port terminal region via Truck
41%MUMBAI REGION
Heat Map : June 2018
The heat map above depicts the movement of containers in and around the Mumbai region.
4%NH3
24%Pune route
10 %Other
s
Region June’18 June’18
Mumbai region
33% 41%
NH3 4% 3%
Pune 31% 24%
NH8 22% 22%
others 10% 10%
HEAT MAP : NSIGT Port Terminal
22%NH
8 3%NH
336%
MUMBAI REGION
Heat Map : June 2018
The heat map above depicts the movement of containers in and around the Mumbai region.
5%NH3
22 %Pune route
10 %Other
s
Region May18 June’18
Mumbai region
45% 36%
NH3 3% 5%
Pune 19% 22%
NH8 23% 26%
others 10% 10%
26%NH
8
HEAT MAP : NSICT Port Terminal
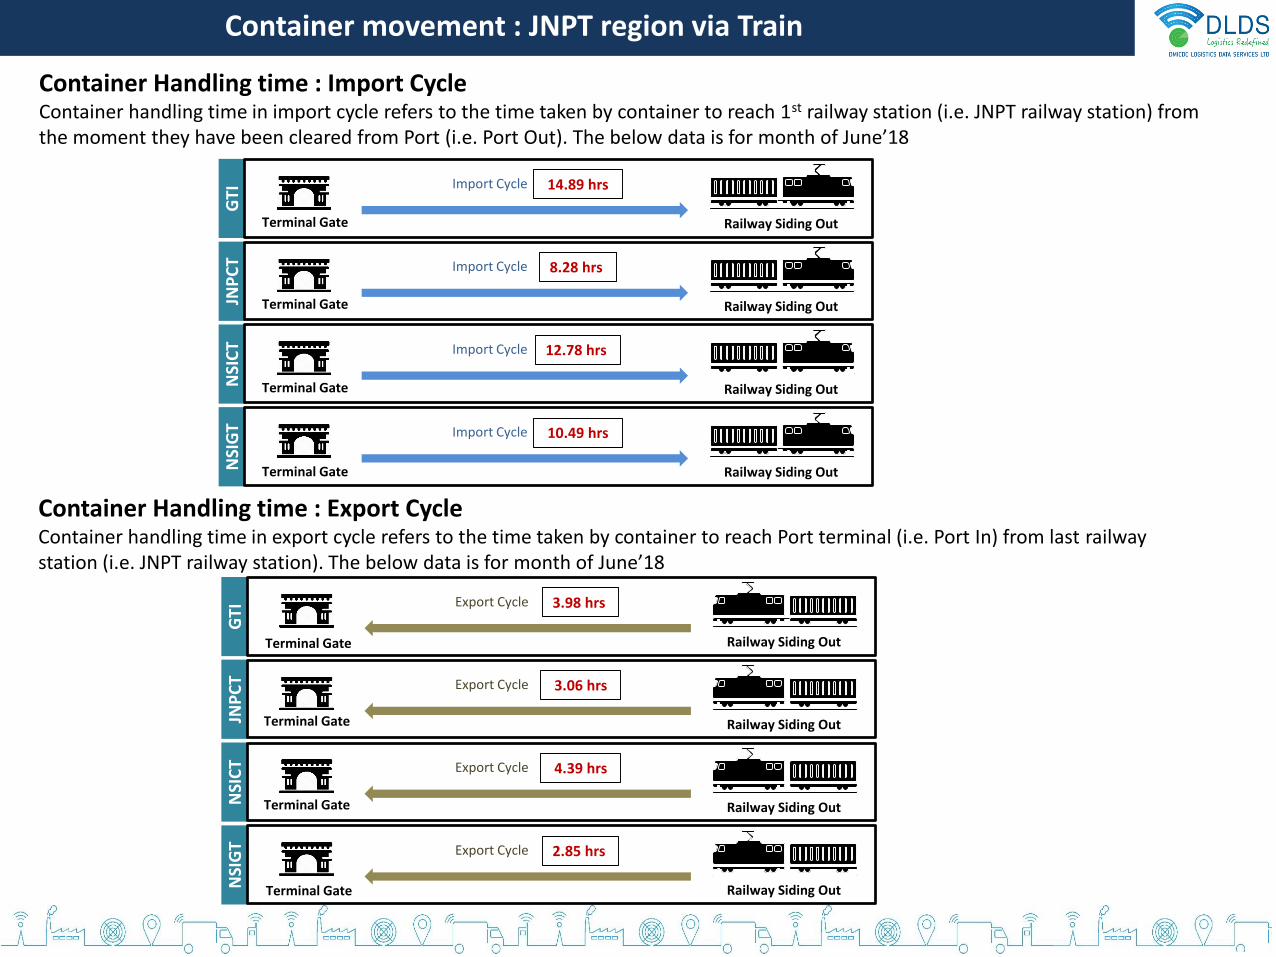
Container movement : JNPT region via Train
Container Handling time : Import Cycle Container handling time in import cycle refers to the time taken by container to reach 1st railway station (i.e. JNPT railway station) from the moment they have been cleared from Port (i.e. Port Out). The below data is for month of June’18
Terminal Gate Railway Siding OutG
TI
14.89 hrsImport Cycle
Railway Siding OutJNP
CT 8.28 hrsImport Cycle
Railway Siding OutNSI
CT 12.78 hrsImport Cycle
Railway Siding OutNSI
GT 10.49 hrsImport Cycle
Railway Siding Out
GTI
3.98 hrsExport Cycle
Railway Siding OutJNP
CT 3.06 hrsExport Cycle
Railway Siding OutNSI
CT 4.39 hrsExport Cycle
Railway Siding OutNSI
GT 2.85 hrsExport Cycle
Terminal Gate
Terminal Gate
Terminal Gate
Terminal Gate
Terminal Gate
Terminal Gate
Terminal Gate
Container Handling time : Export Cycle Container handling time in export cycle refers to the time taken by container to reach Port terminal (i.e. Port In) from last railway station (i.e. JNPT railway station). The below data is for month of June’18
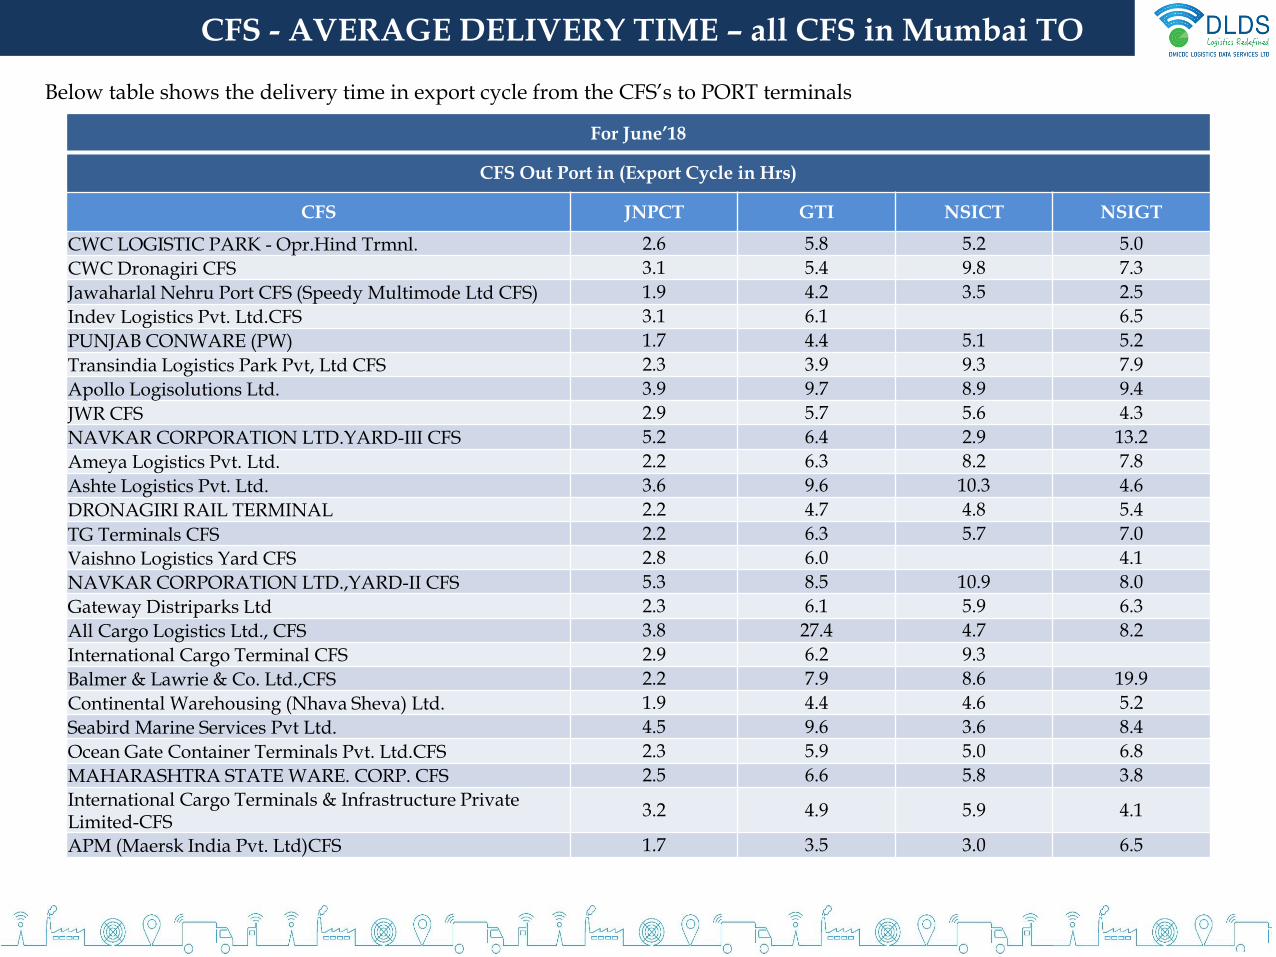
Below table shows the delivery time in export cycle from the CFS’s to PORT terminals
For June’18
CFS Out Port in (Export Cycle in Hrs)
CFS JNPCT GTI NSICT NSIGT
CWC LOGISTIC PARK - Opr.Hind Trmnl. 2.6 5.8 5.2 5.0
CWC Dronagiri CFS 3.1 5.4 9.8 7.3
Jawaharlal Nehru Port CFS (Speedy Multimode Ltd CFS) 1.9 4.2 3.5 2.5
Indev Logistics Pvt. Ltd.CFS 3.1 6.1 6.5
PUNJAB CONWARE (PW) 1.7 4.4 5.1 5.2
Transindia Logistics Park Pvt, Ltd CFS 2.3 3.9 9.3 7.9
Apollo Logisolutions Ltd. 3.9 9.7 8.9 9.4
JWR CFS 2.9 5.7 5.6 4.3
NAVKAR CORPORATION LTD.YARD-III CFS 5.2 6.4 2.9 13.2
Ameya Logistics Pvt. Ltd. 2.2 6.3 8.2 7.8
Ashte Logistics Pvt. Ltd. 3.6 9.6 10.3 4.6
DRONAGIRI RAIL TERMINAL 2.2 4.7 4.8 5.4
TG Terminals CFS 2.2 6.3 5.7 7.0
Vaishno Logistics Yard CFS 2.8 6.0 4.1
NAVKAR CORPORATION LTD.,YARD-II CFS 5.3 8.5 10.9 8.0
Gateway Distriparks Ltd 2.3 6.1 5.9 6.3
All Cargo Logistics Ltd., CFS 3.8 27.4 4.7 8.2
International Cargo Terminal CFS 2.9 6.2 9.3
Balmer & Lawrie & Co. Ltd.,CFS 2.2 7.9 8.6 19.9
Continental Warehousing (Nhava Sheva) Ltd. 1.9 4.4 4.6 5.2
Seabird Marine Services Pvt Ltd. 4.5 9.6 3.6 8.4
Ocean Gate Container Terminals Pvt. Ltd.CFS 2.3 5.9 5.0 6.8
MAHARASHTRA STATE WARE. CORP. CFS 2.5 6.6 5.8 3.8
International Cargo Terminals & Infrastructure Private Limited-CFS
3.2 4.9 5.9 4.1
APM (Maersk India Pvt. Ltd)CFS 1.7 3.5 3.0 6.5
CFS - AVERAGE DELIVERY TIME – all CFS in Mumbai TO JNPT Port
CFS DELIVERY TIME ANALYSIS
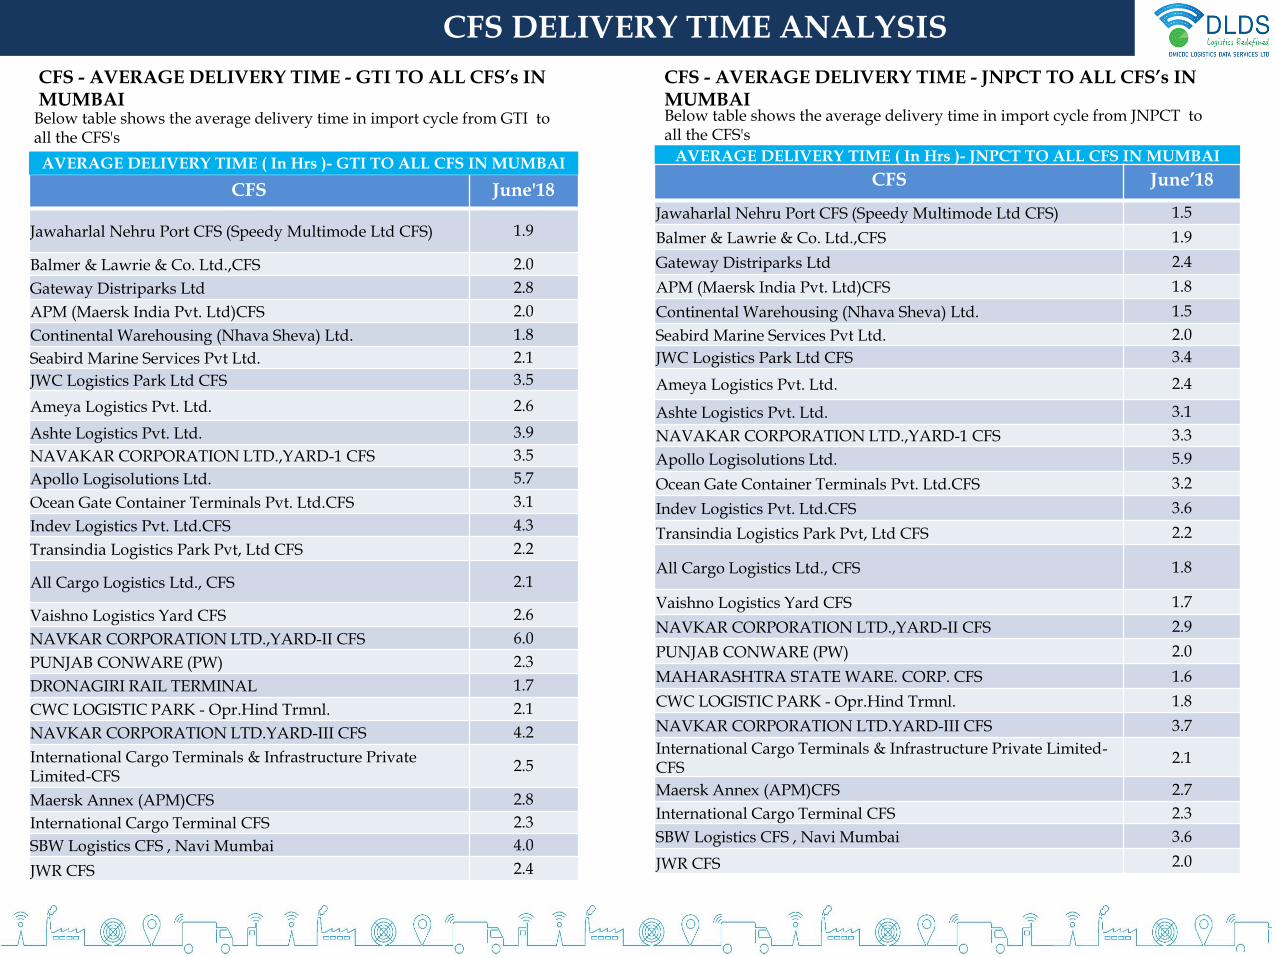
CFS - AVERAGE DELIVERY TIME - GTI TO ALL CFS’s IN MUMBAI
CFS June'18
Jawaharlal Nehru Port CFS (Speedy Multimode Ltd CFS) 1.9
Balmer & Lawrie & Co. Ltd.,CFS 2.0
Gateway Distriparks Ltd 2.8
APM (Maersk India Pvt. Ltd)CFS 2.0
Continental Warehousing (Nhava Sheva) Ltd. 1.8
Seabird Marine Services Pvt Ltd. 2.1
JWC Logistics Park Ltd CFS 3.5
Ameya Logistics Pvt. Ltd. 2.6
Ashte Logistics Pvt. Ltd. 3.9
NAVAKAR CORPORATION LTD.,YARD-1 CFS 3.5
Apollo Logisolutions Ltd. 5.7
Ocean Gate Container Terminals Pvt. Ltd.CFS 3.1
Indev Logistics Pvt. Ltd.CFS 4.3
Transindia Logistics Park Pvt, Ltd CFS 2.2
All Cargo Logistics Ltd., CFS 2.1
Vaishno Logistics Yard CFS 2.6
NAVKAR CORPORATION LTD.,YARD-II CFS 6.0
PUNJAB CONWARE (PW) 2.3
DRONAGIRI RAIL TERMINAL 1.7
CWC LOGISTIC PARK - Opr.Hind Trmnl. 2.1
NAVKAR CORPORATION LTD.YARD-III CFS 4.2
International Cargo Terminals & Infrastructure Private Limited-CFS
2.5
Maersk Annex (APM)CFS 2.8
International Cargo Terminal CFS 2.3
SBW Logistics CFS , Navi Mumbai 4.0
JWR CFS 2.4
AVERAGE DELIVERY TIME ( In Hrs )- GTI TO ALL CFS IN MUMBAI
Below table shows the average delivery time in import cycle from GTI to all the CFS's
AVERAGE DELIVERY TIME ( In Hrs )- JNPCT TO ALL CFS IN MUMBAI
CFS June’18
Jawaharlal Nehru Port CFS (Speedy Multimode Ltd CFS) 1.5
Balmer & Lawrie & Co. Ltd.,CFS 1.9
Gateway Distriparks Ltd 2.4
APM (Maersk India Pvt. Ltd)CFS 1.8
Continental Warehousing (Nhava Sheva) Ltd. 1.5
Seabird Marine Services Pvt Ltd. 2.0
JWC Logistics Park Ltd CFS 3.4
Ameya Logistics Pvt. Ltd. 2.4
Ashte Logistics Pvt. Ltd. 3.1
NAVAKAR CORPORATION LTD.,YARD-1 CFS 3.3
Apollo Logisolutions Ltd. 5.9
Ocean Gate Container Terminals Pvt. Ltd.CFS 3.2
Indev Logistics Pvt. Ltd.CFS 3.6
Transindia Logistics Park Pvt, Ltd CFS 2.2
All Cargo Logistics Ltd., CFS 1.8
Vaishno Logistics Yard CFS 1.7
NAVKAR CORPORATION LTD.,YARD-II CFS 2.9
PUNJAB CONWARE (PW) 2.0
MAHARASHTRA STATE WARE. CORP. CFS 1.6
CWC LOGISTIC PARK - Opr.Hind Trmnl. 1.8
NAVKAR CORPORATION LTD.YARD-III CFS 3.7
International Cargo Terminals & Infrastructure Private Limited-CFS
2.1
Maersk Annex (APM)CFS 2.7
International Cargo Terminal CFS 2.3
SBW Logistics CFS , Navi Mumbai 3.6
JWR CFS 2.0
CFS - AVERAGE DELIVERY TIME - JNPCT TO ALL CFS’s IN MUMBAIBelow table shows the average delivery time in import cycle from JNPCT to all the CFS's
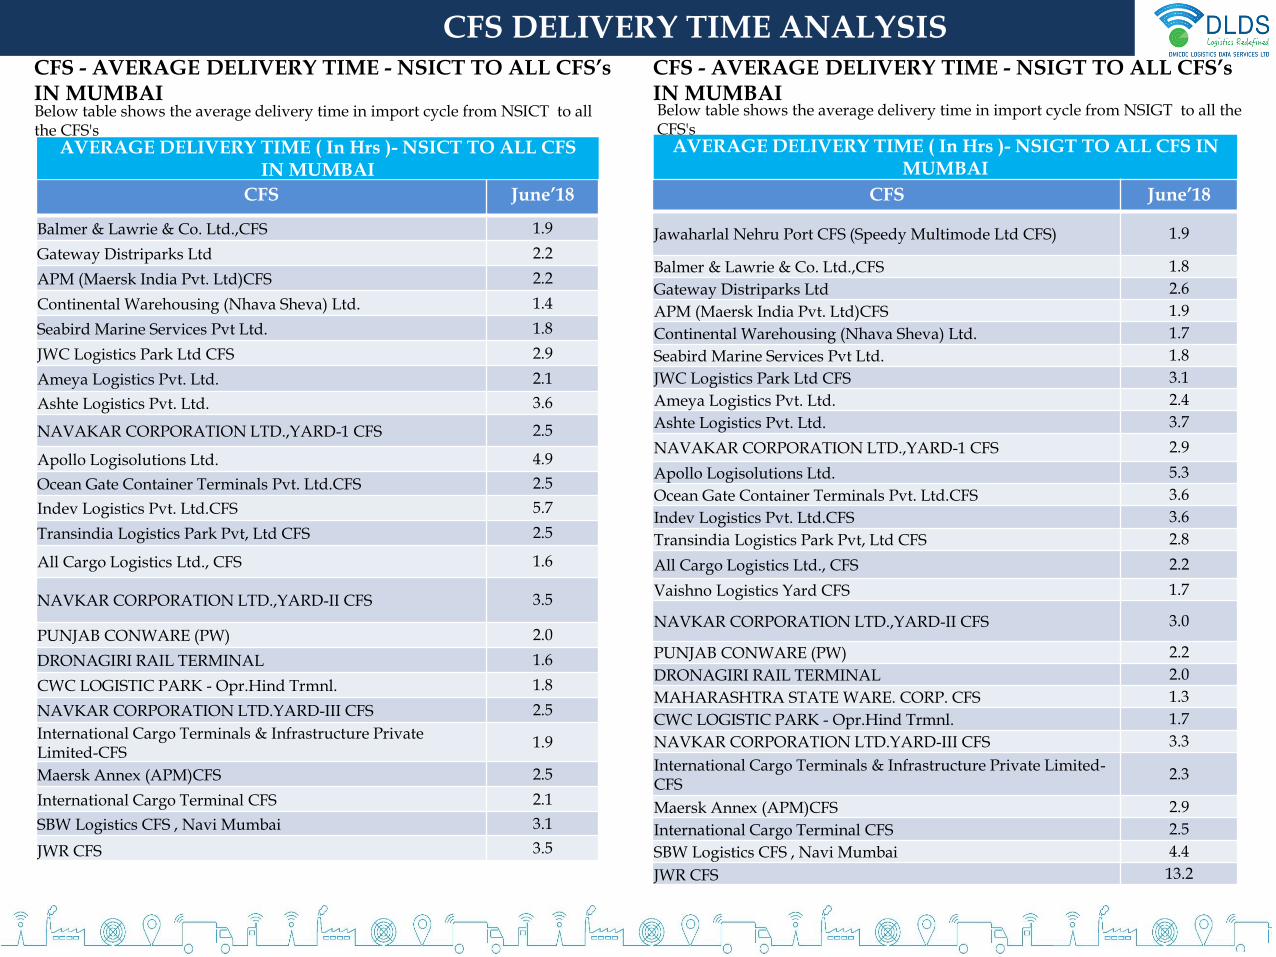
CFS DELIVERY TIME ANALYSISCFS - AVERAGE DELIVERY TIME - NSICT TO ALL CFS’s IN MUMBAI
CFS June’18
Balmer & Lawrie & Co. Ltd.,CFS 1.9
Gateway Distriparks Ltd 2.2
APM (Maersk India Pvt. Ltd)CFS 2.2
Continental Warehousing (Nhava Sheva) Ltd. 1.4
Seabird Marine Services Pvt Ltd. 1.8
JWC Logistics Park Ltd CFS 2.9
Ameya Logistics Pvt. Ltd. 2.1
Ashte Logistics Pvt. Ltd. 3.6
NAVAKAR CORPORATION LTD.,YARD-1 CFS 2.5
Apollo Logisolutions Ltd. 4.9
Ocean Gate Container Terminals Pvt. Ltd.CFS 2.5
Indev Logistics Pvt. Ltd.CFS 5.7
Transindia Logistics Park Pvt, Ltd CFS 2.5
All Cargo Logistics Ltd., CFS 1.6
NAVKAR CORPORATION LTD.,YARD-II CFS 3.5
PUNJAB CONWARE (PW) 2.0
DRONAGIRI RAIL TERMINAL 1.6
CWC LOGISTIC PARK - Opr.Hind Trmnl. 1.8
NAVKAR CORPORATION LTD.YARD-III CFS 2.5
International Cargo Terminals & Infrastructure Private Limited-CFS
1.9
Maersk Annex (APM)CFS 2.5
International Cargo Terminal CFS 2.1
SBW Logistics CFS , Navi Mumbai 3.1
JWR CFS 3.5
AVERAGE DELIVERY TIME ( In Hrs )- NSICT TO ALL CFS IN MUMBAI
Below table shows the average delivery time in import cycle from NSICT to all the CFS's
AVERAGE DELIVERY TIME ( In Hrs )- NSIGT TO ALL CFS IN MUMBAI
CFS June’18
Jawaharlal Nehru Port CFS (Speedy Multimode Ltd CFS) 1.9
Balmer & Lawrie & Co. Ltd.,CFS 1.8
Gateway Distriparks Ltd 2.6
APM (Maersk India Pvt. Ltd)CFS 1.9
Continental Warehousing (Nhava Sheva) Ltd. 1.7
Seabird Marine Services Pvt Ltd. 1.8
JWC Logistics Park Ltd CFS 3.1
Ameya Logistics Pvt. Ltd. 2.4
Ashte Logistics Pvt. Ltd. 3.7
NAVAKAR CORPORATION LTD.,YARD-1 CFS 2.9
Apollo Logisolutions Ltd. 5.3
Ocean Gate Container Terminals Pvt. Ltd.CFS 3.6
Indev Logistics Pvt. Ltd.CFS 3.6
Transindia Logistics Park Pvt, Ltd CFS 2.8
All Cargo Logistics Ltd., CFS 2.2
Vaishno Logistics Yard CFS 1.7
NAVKAR CORPORATION LTD.,YARD-II CFS 3.0
PUNJAB CONWARE (PW) 2.2
DRONAGIRI RAIL TERMINAL 2.0
MAHARASHTRA STATE WARE. CORP. CFS 1.3
CWC LOGISTIC PARK - Opr.Hind Trmnl. 1.7
NAVKAR CORPORATION LTD.YARD-III CFS 3.3
International Cargo Terminals & Infrastructure Private Limited-CFS
2.3
Maersk Annex (APM)CFS 2.9
International Cargo Terminal CFS 2.5
SBW Logistics CFS , Navi Mumbai 4.4
JWR CFS 13.2
CFS - AVERAGE DELIVERY TIME - NSIGT TO ALL CFS’s IN MUMBAIBelow table shows the average delivery time in import cycle from NSIGT to all the CFS's

JNPT Region : Cluster Analysis
NSICT terminal for month of June’18
ClustersNo. of
CFS's in Cluster
Distancefrom Port
(Km)
Import cycle time
(in Hrs)
Export cycle time (in Hrs)
Cluster 1 1 8 - 3.5
Cluster 2 6 13 2.1 5.9
Cluster 3 6 11 0.8 5.1
Cluster 4 1 13 0.0 5.7
Cluster 5 2 25 2.7 2.5
Cluster 6 6 25 3.6 8.9
Cluster 7 4 12 1.8 6.4
Cluster 8 1 34 3.1 0.0
Cluster 9 1 20 3.5 5.6
Base on container movement from port to CFS in Mumbai region, 29 CFS's have been grouped into 9 Clusters on the basis of their vicinity.Below table shows all the clusters and the relevant data for NSICT and NSIGT terminal
• In export cycle the NSICT terminal is having congestion for traffic from cluster 3 and cluster 6
• In import cycle the movement of traffic towards cluster 9 is facing congestion
CFS Cluster : NSICT Terminal
Export container usually aren’t allowed in the port before the arrival of their respective vessel so this unplanned transportation of the export containers from the CFS's to Port can cause bottlenecks
NSIGT terminal for month of June’18
ClustersNo. of
CFS's in Cluster
Distancefrom Port
(Km)
Import cycle time
(in Hrs)
Export cycle time (in Hrs)
Cluster 1 1 8 1.9 2.5
Cluster 2 6 13 2.3 5.7
Cluster 3 6 11 1.8 5.4
Cluster 4 1 13 1.7 4.1
Cluster 5 2 25 3.3 3.4
Cluster 6 6 25 3.5 7.2
Cluster 7 4 12 2.3 7.9
Cluster 8 1 34 4.4 0.0
Cluster 9 1 20 13.2 4.3
CFS Cluster : NSIGT Terminal
• In export cycle the NSIGT terminal is having traffic congestion from cluster 1 and Cluster 7
• In import cycle the NSIGT terminal is having traffic congestion from cluster 9
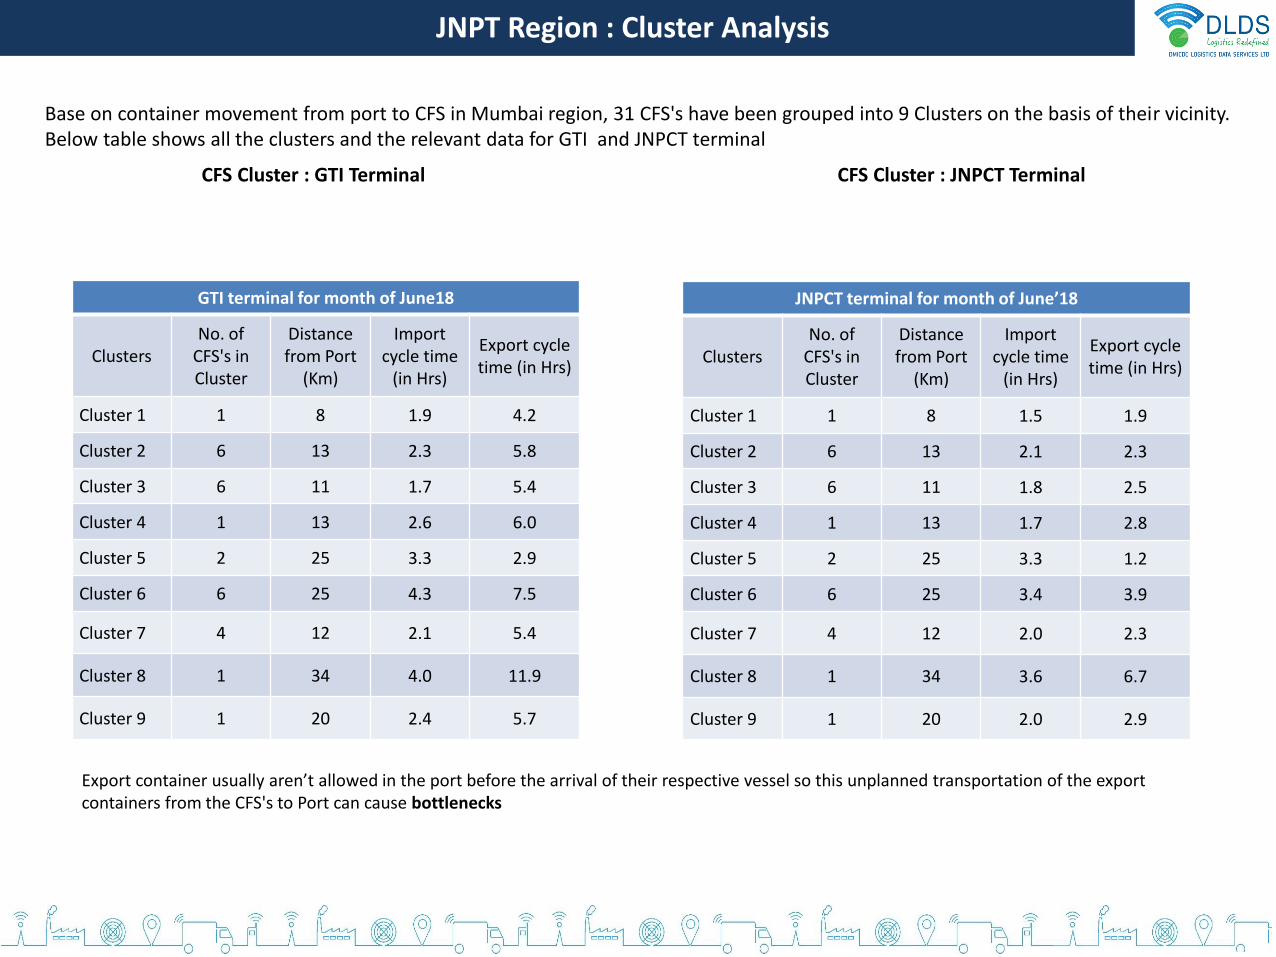
JNPT Region : Cluster Analysis
GTI terminal for month of June18
ClustersNo. of
CFS's in Cluster
Distancefrom Port
(Km)
Import cycle time
(in Hrs)
Export cycle time (in Hrs)
Cluster 1 1 8 1.9 4.2
Cluster 2 6 13 2.3 5.8
Cluster 3 6 11 1.7 5.4
Cluster 4 1 13 2.6 6.0
Cluster 5 2 25 3.3 2.9
Cluster 6 6 25 4.3 7.5
Cluster 7 4 12 2.1 5.4
Cluster 8 1 34 4.0 11.9
Cluster 9 1 20 2.4 5.7
Base on container movement from port to CFS in Mumbai region, 31 CFS's have been grouped into 9 Clusters on the basis of their vicinity.Below table shows all the clusters and the relevant data for GTI and JNPCT terminal
CFS Cluster : GTI Terminal
Export container usually aren’t allowed in the port before the arrival of their respective vessel so this unplanned transportation of the export containers from the CFS's to Port can cause bottlenecks
JNPCT terminal for month of June’18
ClustersNo. of
CFS's in Cluster
Distancefrom Port
(Km)
Import cycle time
(in Hrs)
Export cycle time (in Hrs)
Cluster 1 1 8 1.5 1.9
Cluster 2 6 13 2.1 2.3
Cluster 3 6 11 1.8 2.5
Cluster 4 1 13 1.7 2.8
Cluster 5 2 25 3.3 1.2
Cluster 6 6 25 3.4 3.9
Cluster 7 4 12 2.0 2.3
Cluster 8 1 34 3.6 6.7
Cluster 9 1 20 2.0 2.9
CFS Cluster : JNPCT Terminal

• APM (Maersk India) CFS, Navi Mumbai
• Maersk Annex (APM)CFS, Navi Mumbai
• Balmer & Lawrie CFS, Navi Mumbai
• CWC Hind Terminal CFS, Navi Mumbai
• International Cargo Terminals (ULA) CFS, Navi Mumbai & Infrastructure Private Limited
• Gateway Distriparks CFS, Navi Mumbai
• International Cargo Terminal CFS
Cluster 2 (Bhendkhal area, Khopate road)
Cluster 1 (JNPT Area)
• Speedy Multimode CFS,JNPT • Punjab Conware CFS, Navi Mumbai• Dronogiri Rail Terminal CFS, Navi
Mumbai• CWC Impex Park CFS, Navi Mumbai• CWC Dronagiri CFS, Navi Mumbai• Maharashtra State Corp CFS• Seabird CFS, Navi Mumbai
Cluster 3Sonari area,JNPT road
Cluster 4(Chirle area , JNPT road)
• Vaishno Logistics CFS, Navi Mumbai
Cluster 5(Plaspa area, Coachi kanyakumari
Highway)
• JWC Logistics Park CFS• Ocean Gate CFS, Panvel
• Ashte Logistics CFS, Panvel• Apollo Logisolutions CFS, Panvel• Indev Logistics CFS, Panvel• Navkar Corporation Yrd 1 CFS,
Panvel• Navkar Corporation Yard 2 CFS,
Panvel• Navkar Corporation Yard 3 CFS,
Panvel
Cluster 6(Salva apta rd area, Bangalore highway)
Cluster 7(Patilpada area, Khopate JNPT road)
• All Cargo Logistics CFS, Navi Mumbai
• Transindia Logistics Park, Navi Mumbai
• Ameya Logistics CFS, Navi Mumbai• Continental Warehousing CFS, Navi
Mumbai
Below mentioned are all the CFS in the respective Clusters :
Cluster 8SBW
Thank You !!