ms project tutorial - wordpress.com · ms project tutorial prepared by milton hurtado cs 587...
TRANSCRIPT

MS Project TutorialMS Project Tutorial
Prepared byPrepared byMilton HurtadoMilton Hurtado
CS 587 Software Project ManagementInstructor: Dr. Atef Bader
MS Project in Labs:Available in Siegal Hall Lab in Main CampusAvailable in Room 210 Rice Campus
How to get MS Project ?How to get MS Project ?
Download MS project from following linkhttp://www.microsoft.com/office/project/
Embarking new ProjectEmbarking new Project
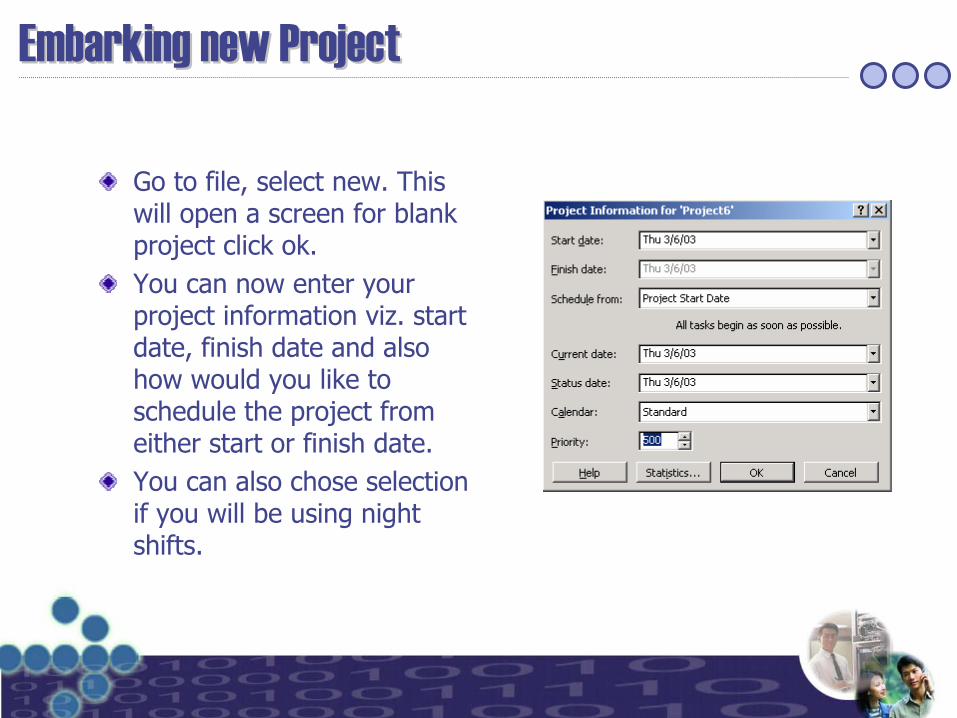
Go to file, select new. This will open a screen for blank project click ok.You can now enter your project information viz. start date, finish date and also how would you like to schedule the project from either start or finish date.You can also chose selection if you will be using night shifts.
Gantt ChartGantt Chart
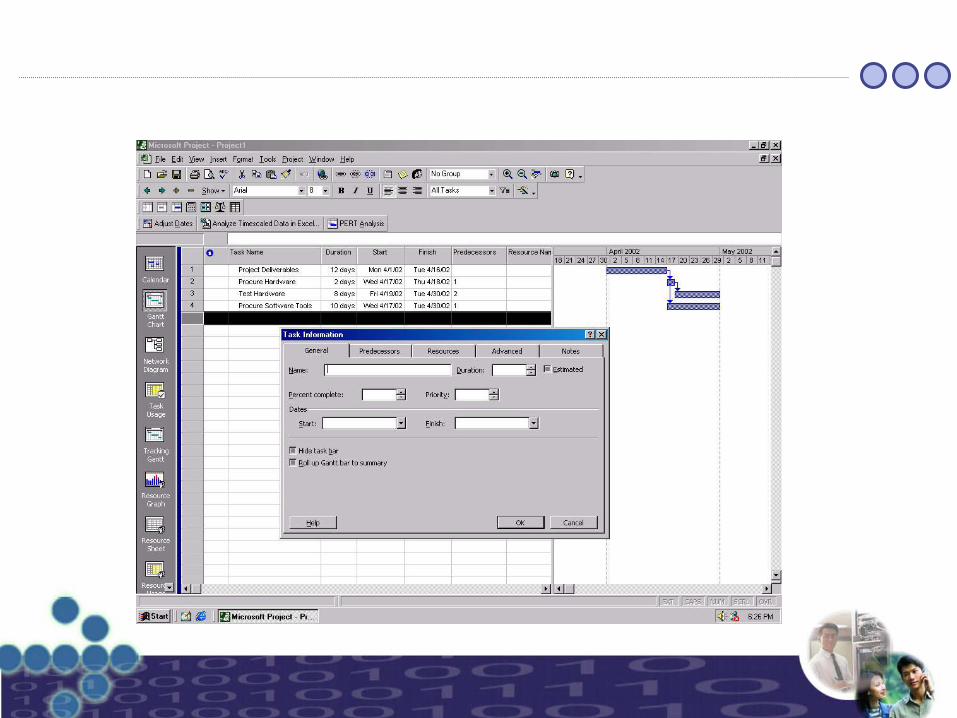
Select Gantt Chart view from the view menu.You’ll have a spreadsheet where you can now enter information of all the activitiesi.e. task name, duration, start date, end date, predecessors andvarious other fields.You can enter required information in two ways, in spreadsheet or when you double click on cell you get pop up window in which you can enter all the information of that particular activity.For predecessor activity you need to write activity number.The SW itself will calculate start and end date.Now the Gantt Chart is complete.
Adding tasks and milestones to a Project FileAdding tasks and milestones to a Project File
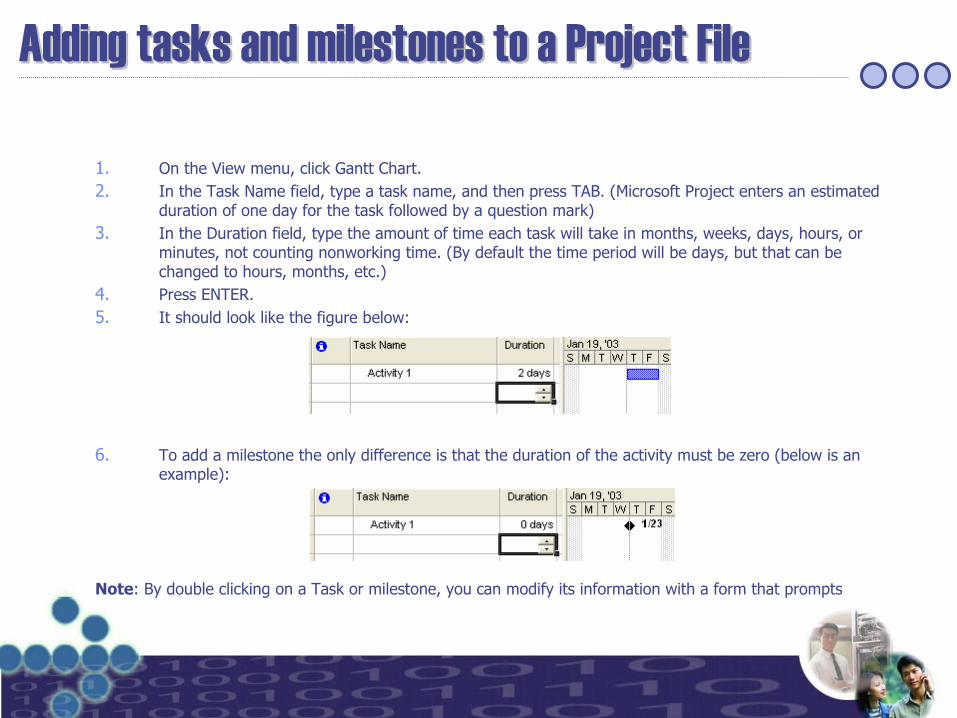
1. On the View menu, click Gantt Chart. 2. In the Task Name field, type a task name, and then press TAB. (Microsoft Project enters an estimated
duration of one day for the task followed by a question mark)3. In the Duration field, type the amount of time each task will take in months, weeks, days, hours, or
minutes, not counting nonworking time. (By default the time period will be days, but that can be changed to hours, months, etc.)
4. Press ENTER. 5. It should look like the figure below:
6. To add a milestone the only difference is that the duration of the activity must be zero (below is an example):
Note: By double clicking on a Task or milestone, you can modify its information with a form that prompts
Grouping Tasks in Logical Order Grouping Tasks in Logical Order (WBS Outline)(WBS Outline)
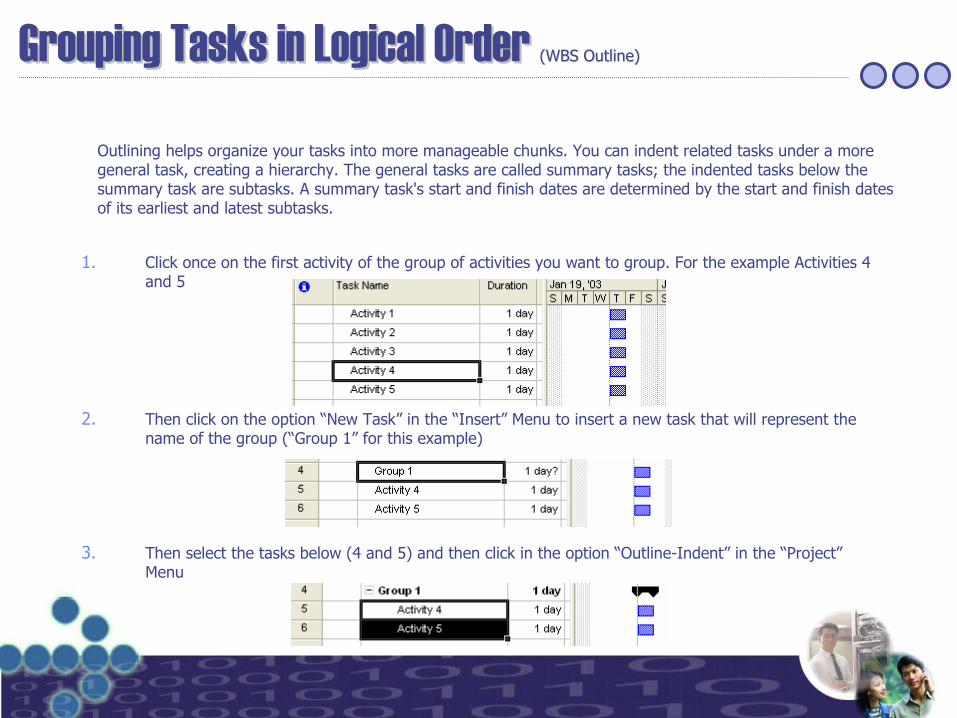
1. Click once on the first activity of the group of activities you want to group. For the example Activities 4 and 5
2. Then click on the option “New Task” in the “Insert” Menu to insert a new task that will represent the name of the group (“Group 1” for this example)
3. Then select the tasks below (4 and 5) and then click in the option “Outline-Indent” in the “Project” Menu
Outlining helps organize your tasks into more manageable chunks. You can indent related tasks under a more general task, creating a hierarchy. The general tasks are called summary tasks; the indented tasks below the summary task are subtasks. A summary task's start and finish dates are determined by the start and finish dates of its earliest and latest subtasks.
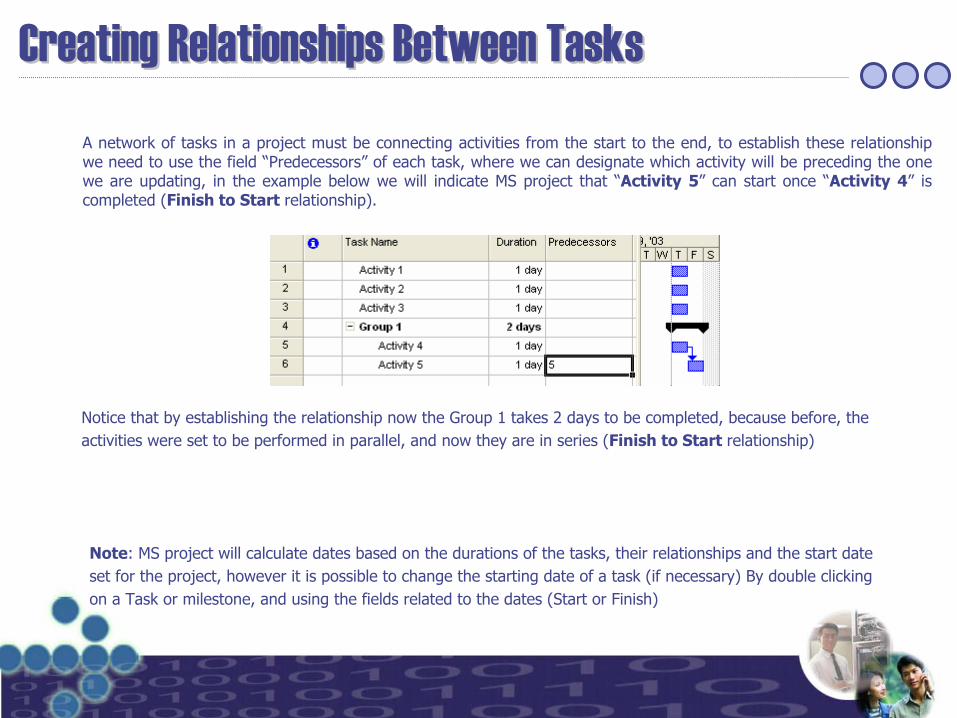
A network of tasks in a project must be connecting activities from the start to the end, to establish these relationship we need to use the field “Predecessors” of each task, where we can designate which activity will be preceding the one we are updating, in the example below we will indicate MS project that “Activity 5” can start once “Activity 4” is completed (Finish to Start relationship).
Notice that by establishing the relationship now the Group 1 takes 2 days to be completed, because before, the activities were set to be performed in parallel, and now they are in series (Finish to Start relationship)
Note: MS project will calculate dates based on the durations of the tasks, their relationships and the start date set for the project, however it is possible to change the starting date of a task (if necessary) By double clicking on a Task or milestone, and using the fields related to the dates (Start or Finish)
Creating Relationships Between TasksCreating Relationships Between Tasks
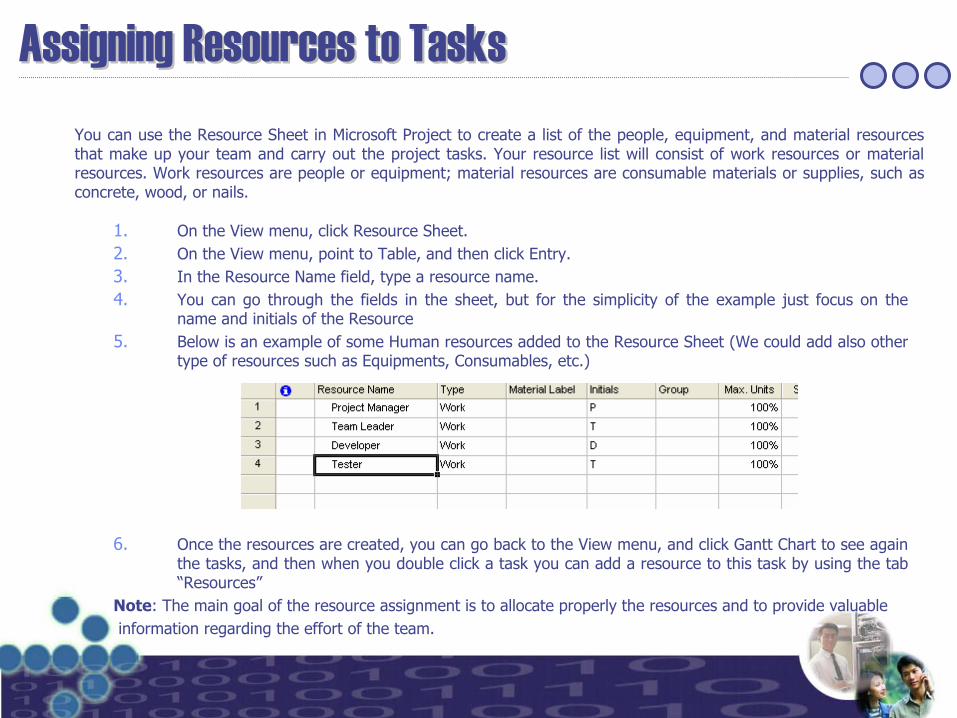
You can use the Resource Sheet in Microsoft Project to create a list of the people, equipment, and material resourcesthat make up your team and carry out the project tasks. Your resource list will consist of work resources or material resources. Work resources are people or equipment; material resources are consumable materials or supplies, such as concrete, wood, or nails.
1. On the View menu, click Resource Sheet. 2. On the View menu, point to Table, and then click Entry. 3. In the Resource Name field, type a resource name.4. You can go through the fields in the sheet, but for the simplicity of the example just focus on the
name and initials of the Resource 5. Below is an example of some Human resources added to the Resource Sheet (We could add also other
type of resources such as Equipments, Consumables, etc.)
6. Once the resources are created, you can go back to the View menu, and click Gantt Chart to see again the tasks, and then when you double click a task you can add a resource to this task by using the tab “Resources”
Note: The main goal of the resource assignment is to allocate properly the resources and to provide valuableinformation regarding the effort of the team.
Assigning Resources to TasksAssigning Resources to Tasks
Find Critical PathFind Critical Path
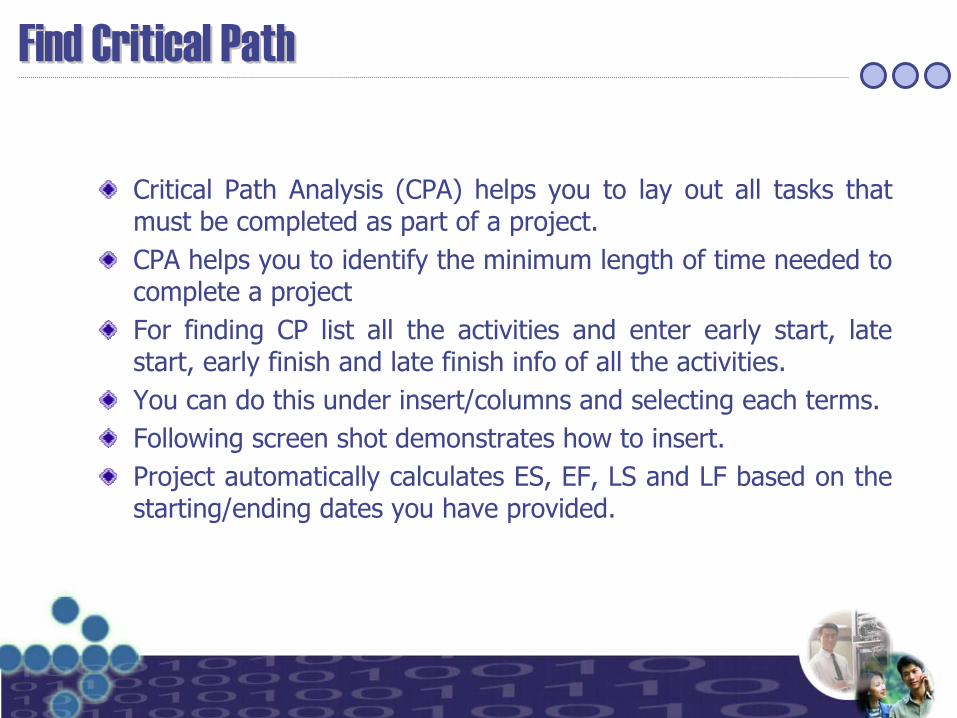
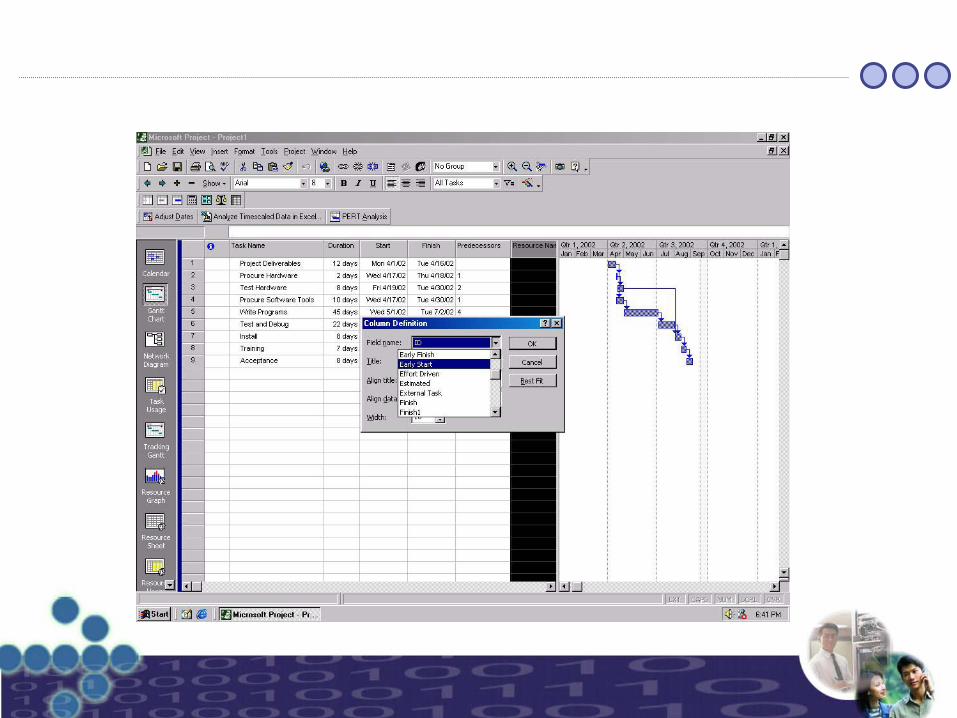
Critical Path Analysis (CPA) helps you to lay out all tasks thatmust be completed as part of a project. CPA helps you to identify the minimum length of time needed to complete a projectFor finding CP list all the activities and enter early start, late start, early finish and late finish info of all the activities.You can do this under insert/columns and selecting each terms.Following screen shot demonstrates how to insert.Project automatically calculates ES, EF, LS and LF based on the starting/ending dates you have provided.
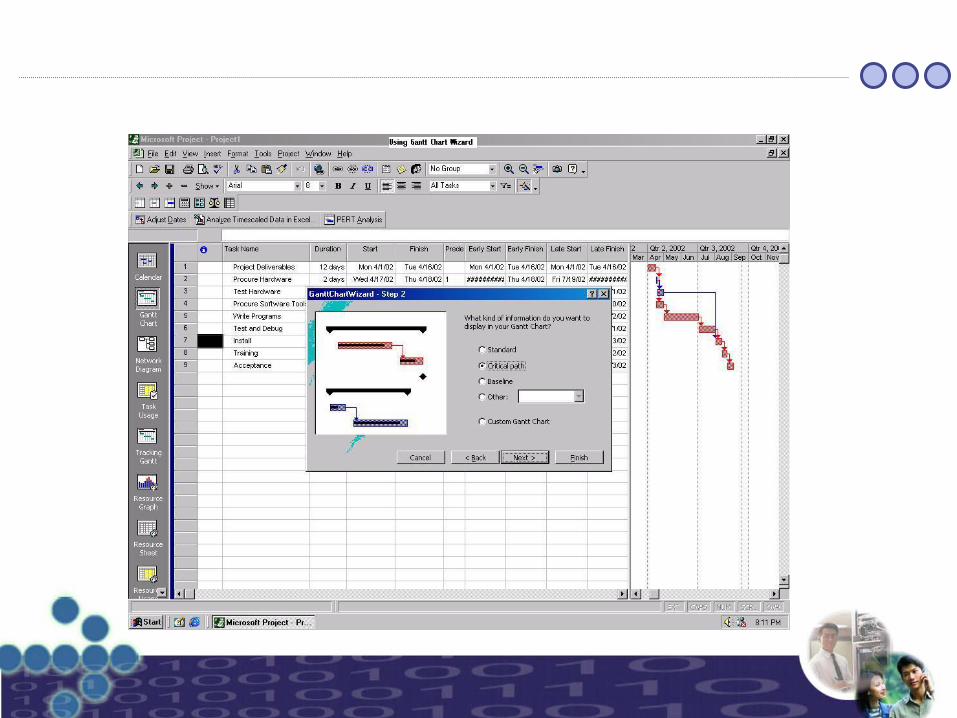
Showing Critical PathShowing Critical Path
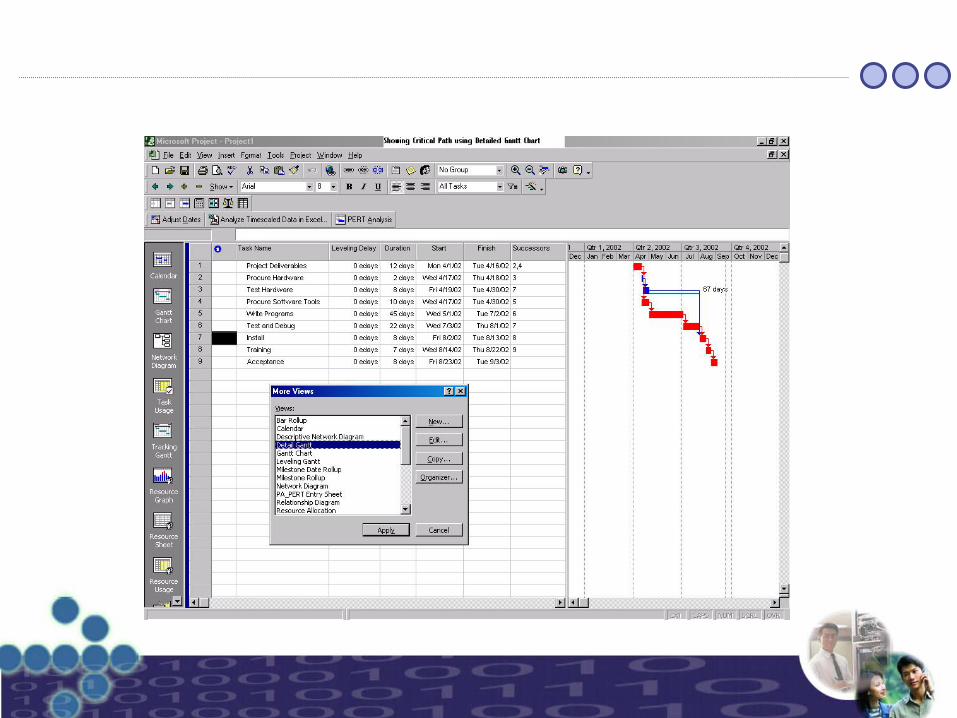
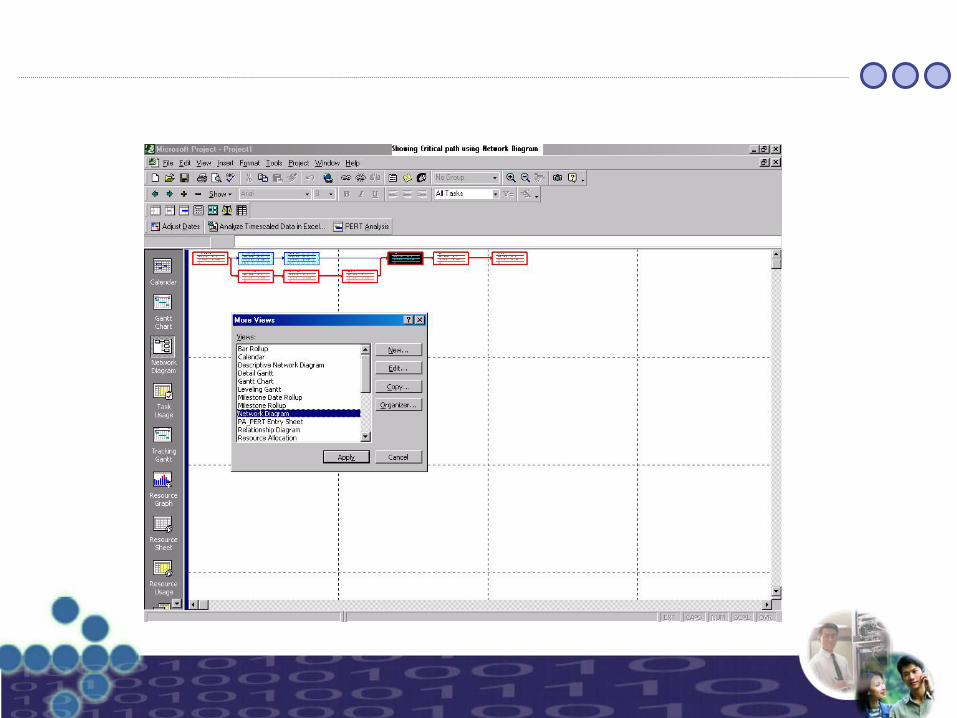
You can show the critical path in multiple ways. You can show critical path using Gantt chart, Detailed Gantt, Network Diagram, and showing only critical tasks.In Gantt Chart click on Gantt Chart wizard and choose critical path and follow the steps.In Detailed Gantt click on View More Views Detailed Gantt Apply. It shows the critical path with slack time.In Network Diagram click on View More Views Network Diagram Apply. For showing only the critical tasks, click on Gantt Chart filter Critical.The following slides has screenshots of how to show critical path using various methods.

Slack Time For SchedulingSlack Time For Scheduling
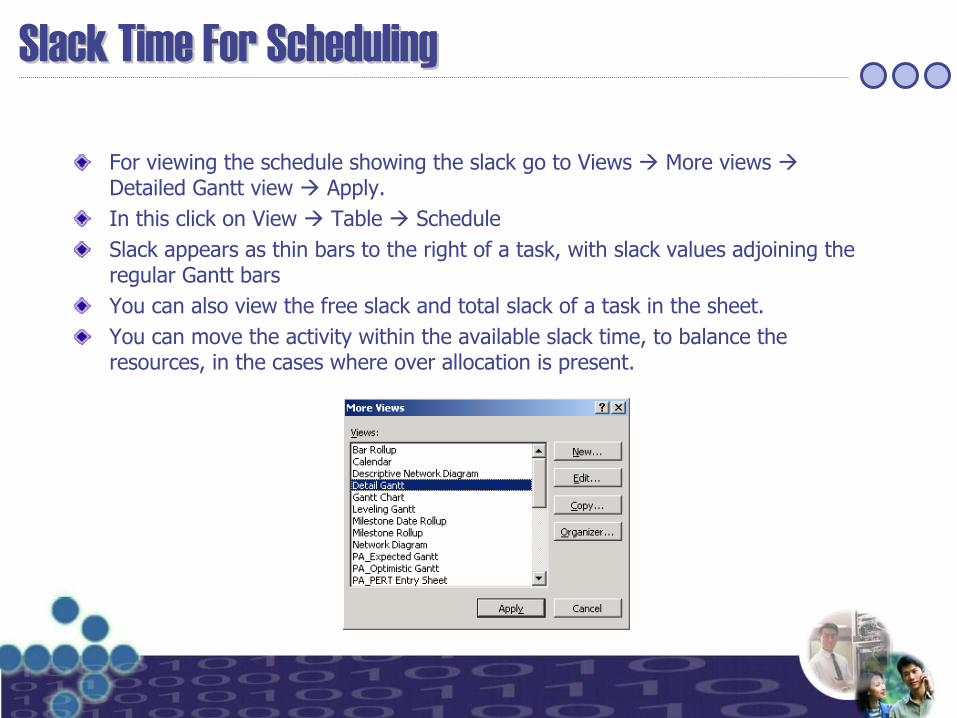
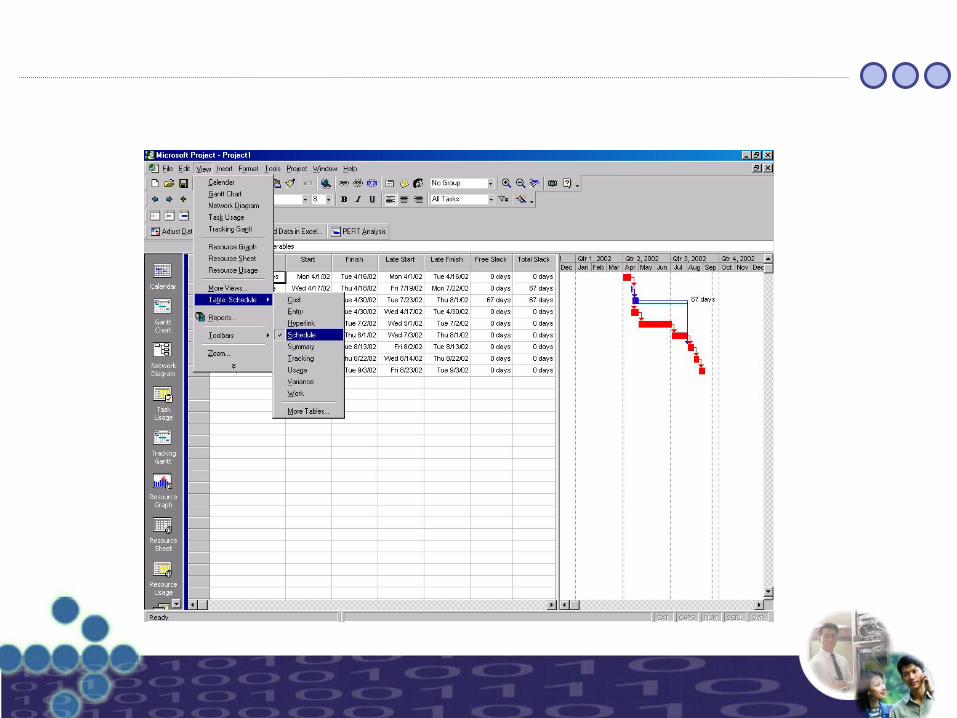
For viewing the schedule showing the slack go to Views More views Detailed Gantt view Apply.In this click on View Table ScheduleSlack appears as thin bars to the right of a task, with slack values adjoining the regular Gantt barsYou can also view the free slack and total slack of a task in the sheet.You can move the activity within the available slack time, to balance the resources, in the cases where over allocation is present.
Closing ProjectClosing Project
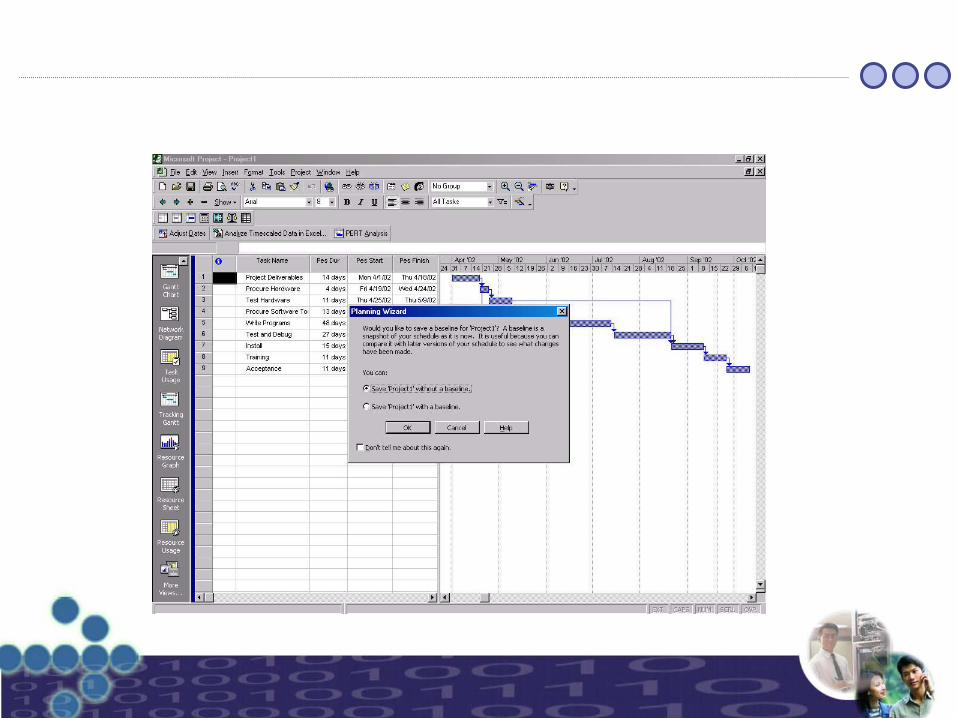
When you are saving a file it asks you whether you want to save with baseline/without baseline. You can choose either options. If you choose to save with baseline, a copy of your schedule and other things will be saved and any changes when you are making when the project progress can be viewed clearly using the baseline.If you choose to save without baseline, you will not be able to view the changes.
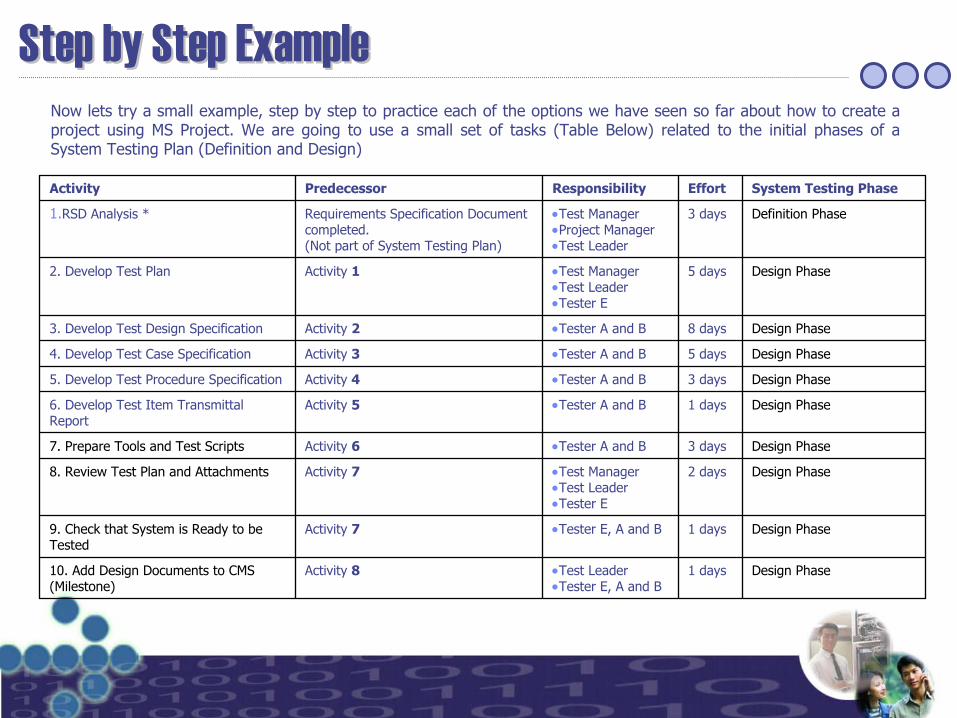
Now lets try a small example, step by step to practice each of the options we have seen so far about how to create a project using MS Project. We are going to use a small set of tasks (Table Below) related to the initial phases of a System Testing Plan (Definition and Design)
Design Phase1 days•Test Leader•Tester E, A and B
Activity 810. Add Design Documents to CMS (Milestone)
Design Phase1 days•Tester E, A and BActivity 79. Check that System is Ready to be Tested
Design Phase2 days•Test Manager•Test Leader•Tester E
Activity 78. Review Test Plan and Attachments
Design Phase3 days•Tester A and BActivity 67. Prepare Tools and Test Scripts
Design Phase1 days•Tester A and BActivity 5 6. Develop Test Item Transmittal Report
Design Phase3 days•Tester A and BActivity 4 5. Develop Test Procedure Specification
Design Phase5 days•Tester A and BActivity 3 4. Develop Test Case Specification
Design Phase8 days•Tester A and BActivity 23. Develop Test Design Specification
Design Phase5 days•Test Manager•Test Leader•Tester E
Activity 12. Develop Test Plan
Definition Phase3 days•Test Manager•Project Manager•Test Leader
Requirements Specification Document completed.(Not part of System Testing Plan)
1.RSD Analysis *
System Testing PhaseEffort ResponsibilityPredecessorActivity
Step by Step ExampleStep by Step Example
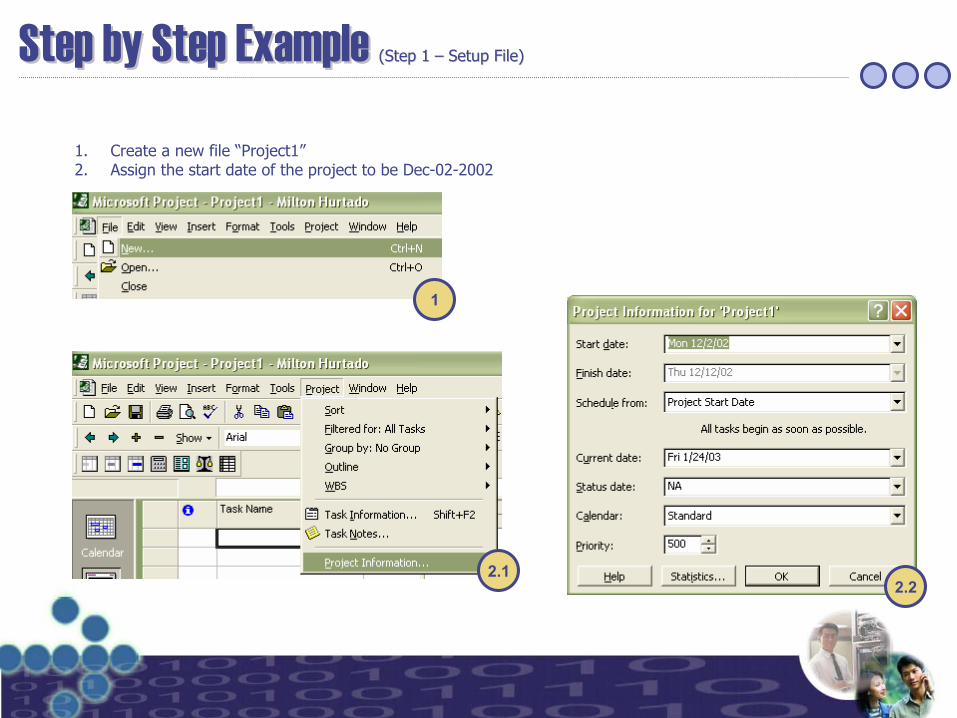
1. Create a new file “Project1”2. Assign the start date of the project to be Dec-02-2002
1
2.12.2
Step by Step Example Step by Step Example (Step 1 (Step 1 –– Setup File)Setup File)
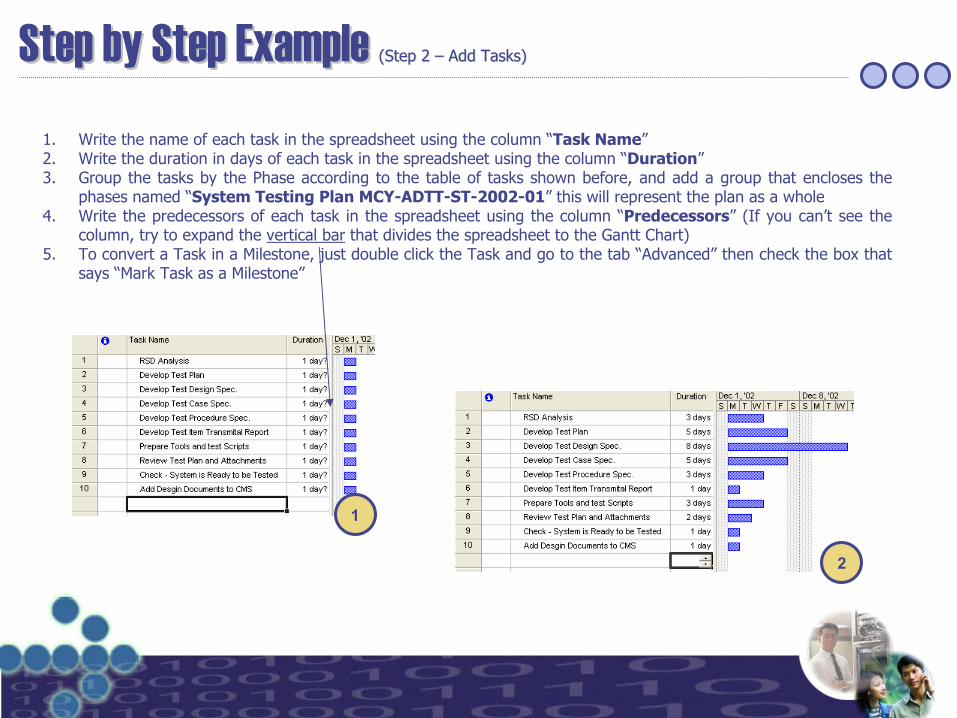
1. Write the name of each task in the spreadsheet using the column “Task Name”2. Write the duration in days of each task in the spreadsheet using the column “Duration”3. Group the tasks by the Phase according to the table of tasks shown before, and add a group that encloses the
phases named “System Testing Plan MCY-ADTT-ST-2002-01” this will represent the plan as a whole4. Write the predecessors of each task in the spreadsheet using the column “Predecessors” (If you can’t see the
column, try to expand the vertical bar that divides the spreadsheet to the Gantt Chart)5. To convert a Task in a Milestone, just double click the Task and go to the tab “Advanced” then check the box that
says “Mark Task as a Milestone”
1
2
Step by Step Example Step by Step Example (Step 2 (Step 2 –– Add Tasks)Add Tasks)
Step by Step Example Step by Step Example (Step 2 (Step 2 –– Add Tasks Continued)Add Tasks Continued)
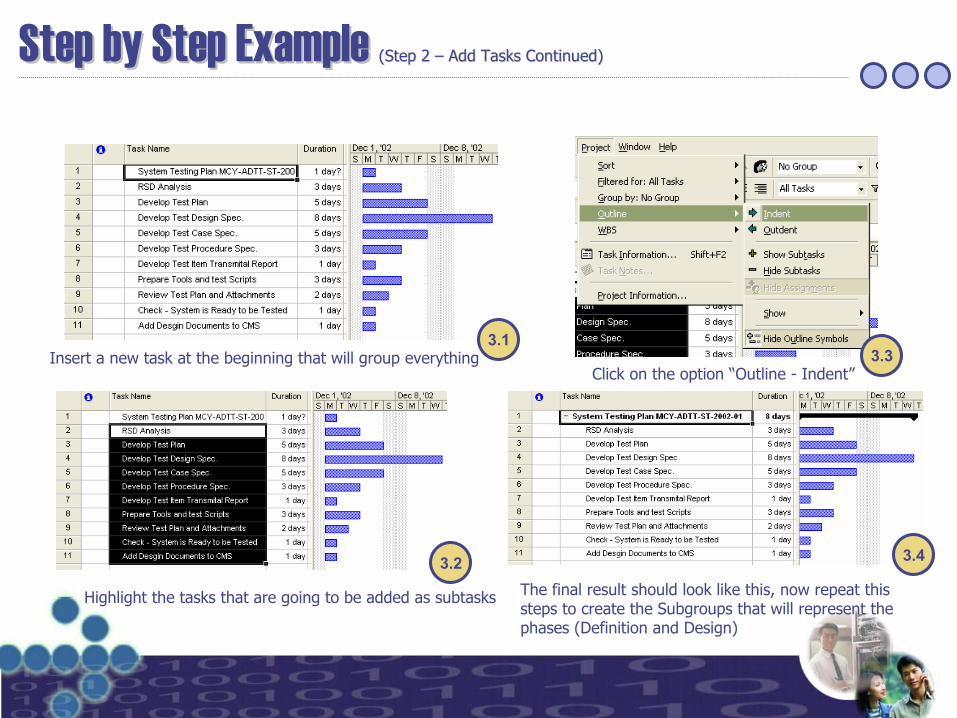
3.1Insert a new task at the beginning that will group everything
3.2
Highlight the tasks that are going to be added as subtasks
3.3Click on the option “Outline - Indent”
3.4
The final result should look like this, now repeat this steps to create the Subgroups that will represent the phases (Definition and Design)
Step by Step Example Step by Step Example (Step 2 (Step 2 –– Add Tasks Continued)Add Tasks Continued)
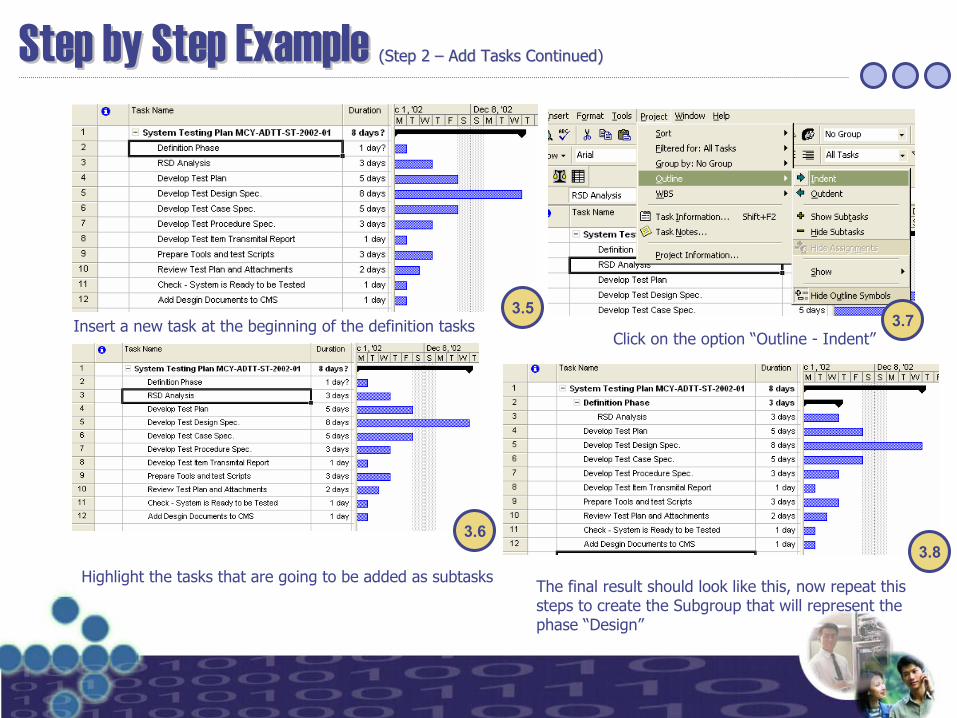
3.5Insert a new task at the beginning of the definition tasks
Highlight the tasks that are going to be added as subtasks
Click on the option “Outline - Indent”
The final result should look like this, now repeat this steps to create the Subgroup that will represent the phase “Design”
3.6
3.7
3.8
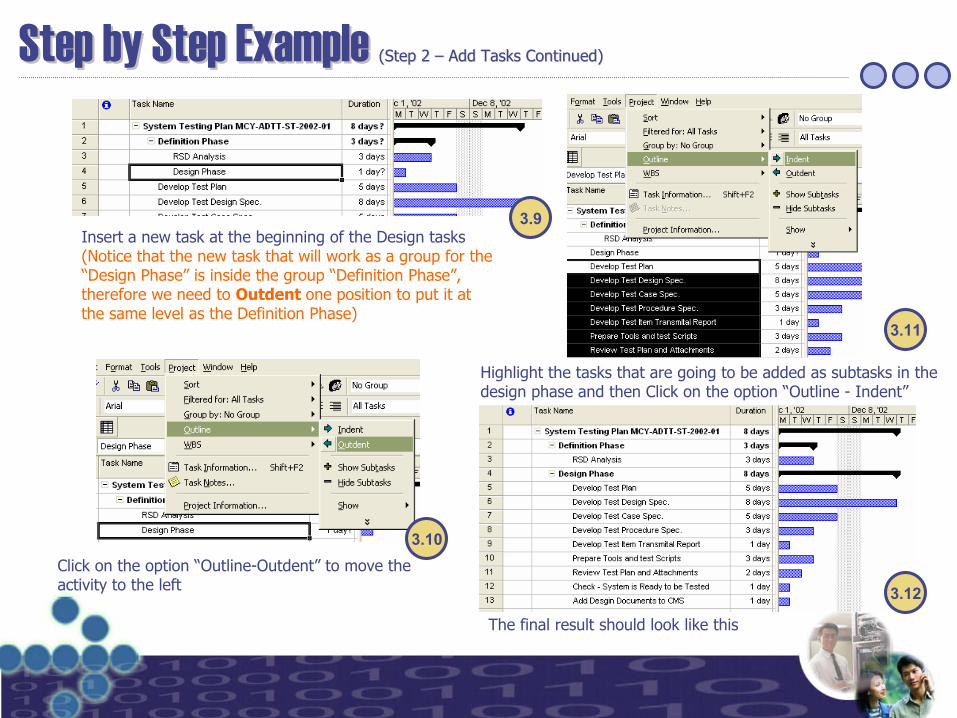
Step by Step Example Step by Step Example (Step 2 (Step 2 –– Add Tasks Continued)Add Tasks Continued)
Click on the option “Outline-Outdent” to move the activity to the left
The final result should look like this
3.11
3.9Insert a new task at the beginning of the Design tasks(Notice that the new task that will work as a group for the “Design Phase” is inside the group “Definition Phase”, therefore we need to Outdent one position to put it at the same level as the Definition Phase)
3.10
Highlight the tasks that are going to be added as subtasks in the design phase and then Click on the option “Outline - Indent”
3.12
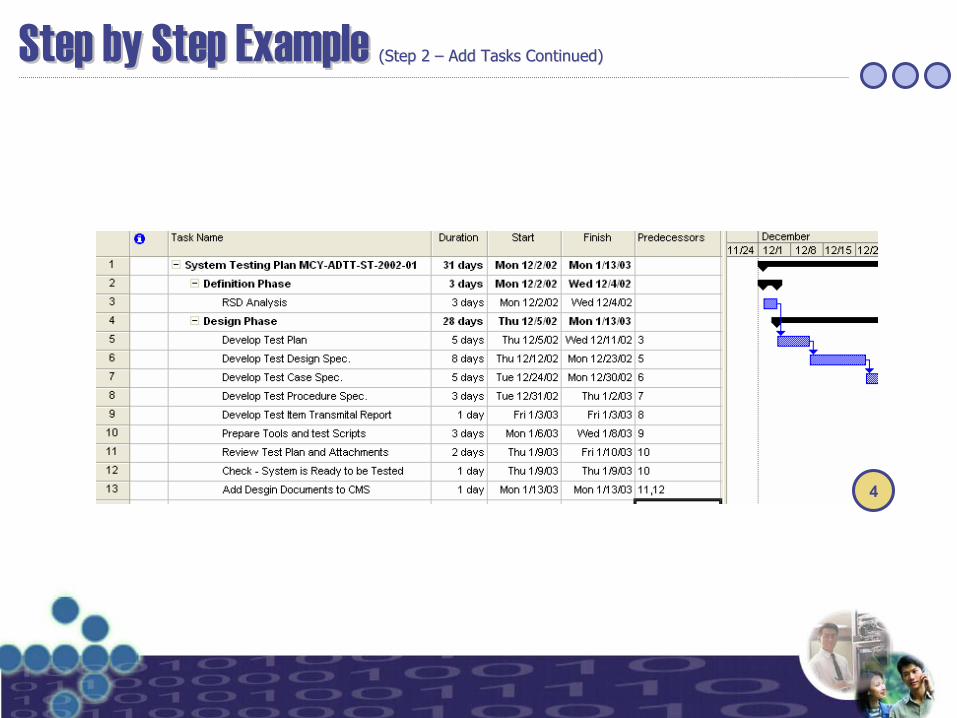
Step by Step Example Step by Step Example (Step 2 (Step 2 –– Add Tasks Continued)Add Tasks Continued)
4
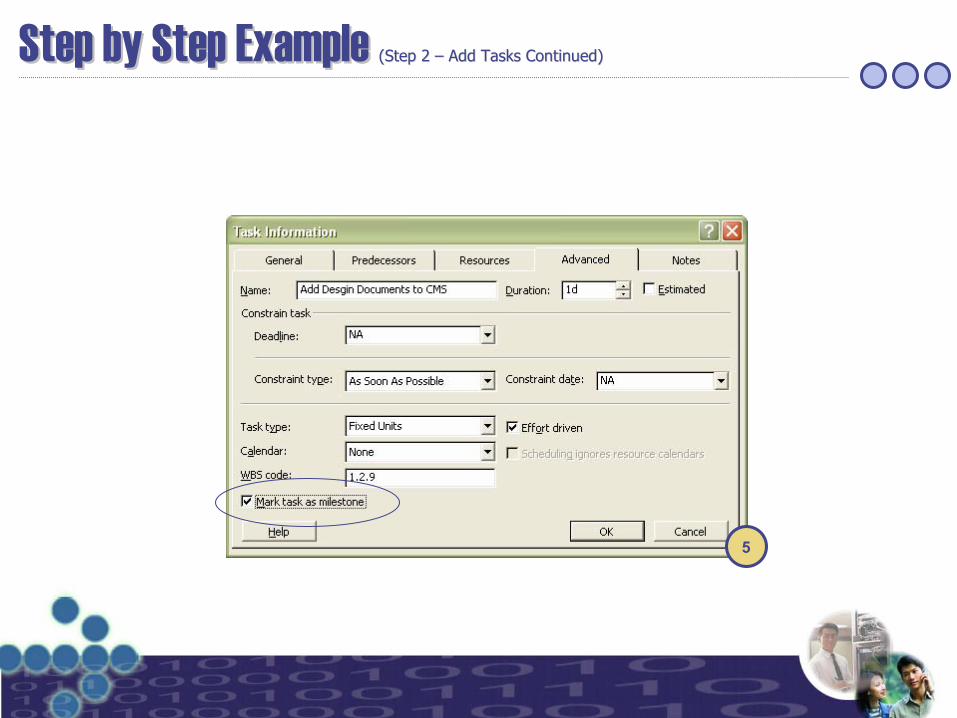
Step by Step Example Step by Step Example (Step 2 (Step 2 –– Add Tasks Continued)Add Tasks Continued)
5
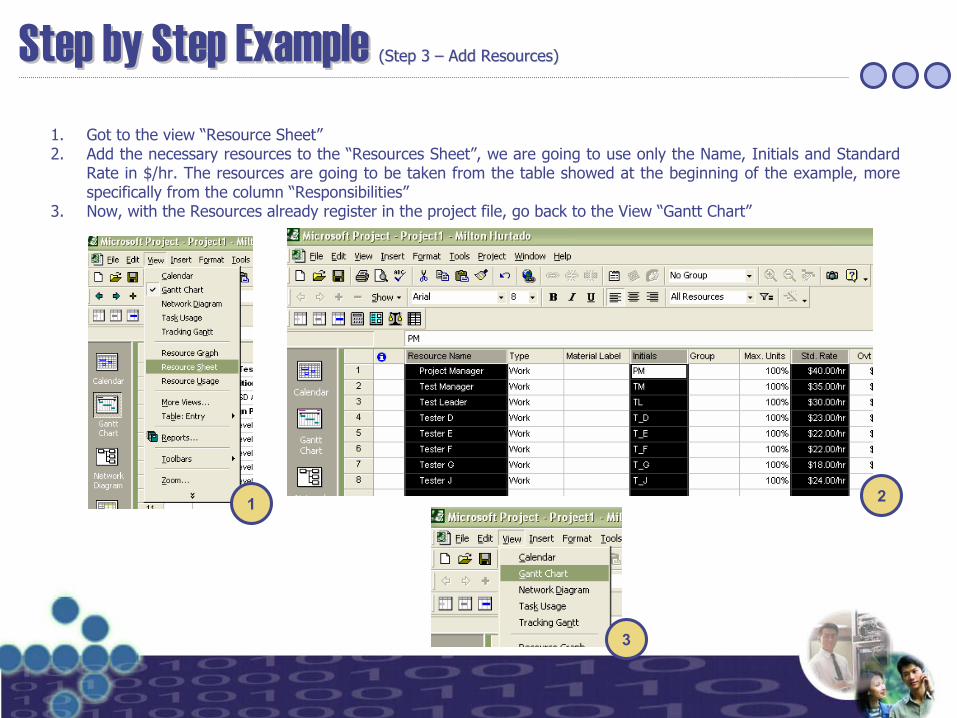
1. Got to the view “Resource Sheet”2. Add the necessary resources to the “Resources Sheet”, we are going to use only the Name, Initials and Standard
Rate in $/hr. The resources are going to be taken from the table showed at the beginning of the example, more specifically from the column “Responsibilities”
3. Now, with the Resources already register in the project file, go back to the View “Gantt Chart”
1 2
3
Step by Step Example Step by Step Example (Step 3 (Step 3 –– Add Resources)Add Resources)
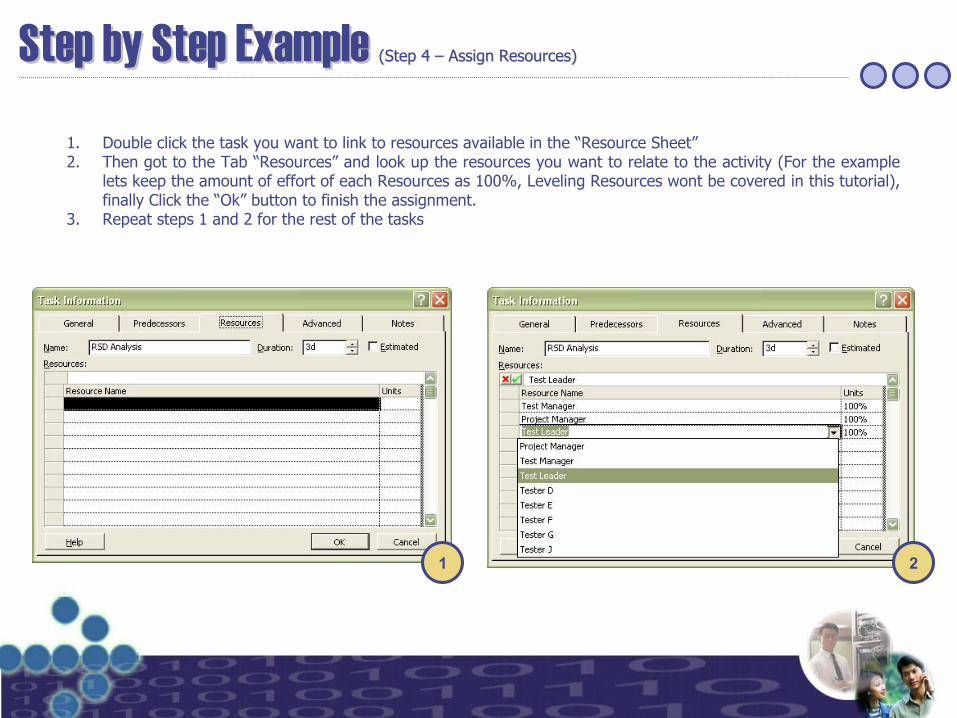
1. Double click the task you want to link to resources available in the “Resource Sheet”2. Then got to the Tab “Resources” and look up the resources you want to relate to the activity (For the example
lets keep the amount of effort of each Resources as 100%, Leveling Resources wont be covered in this tutorial), finally Click the “Ok” button to finish the assignment.
3. Repeat steps 1 and 2 for the rest of the tasks
1 2
Step by Step Example Step by Step Example (Step 4 (Step 4 –– Assign Resources)Assign Resources)
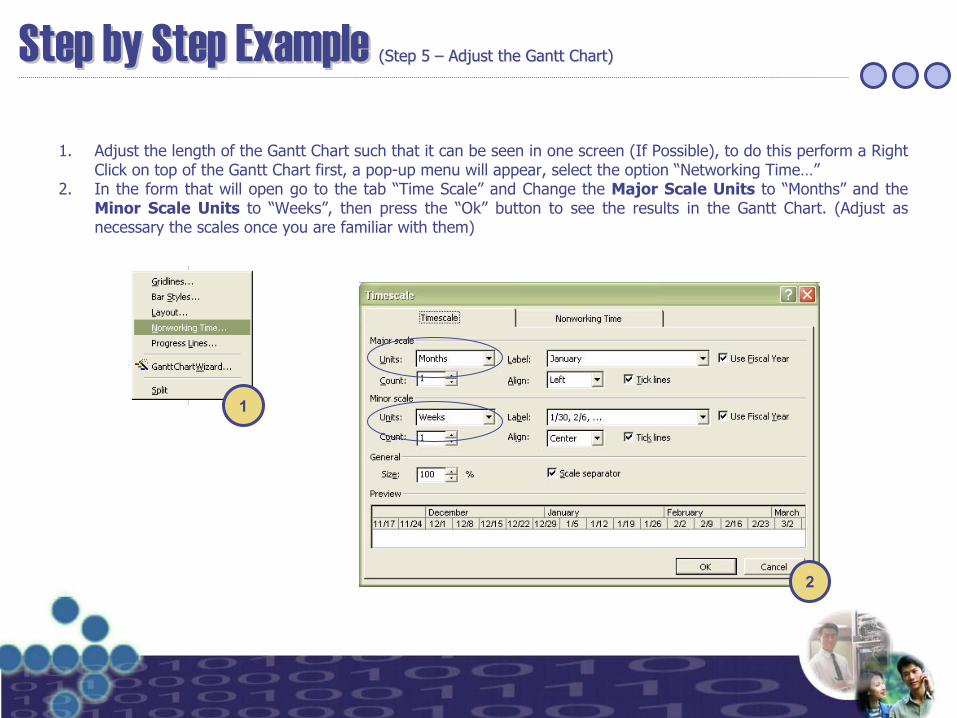
1. Adjust the length of the Gantt Chart such that it can be seen in one screen (If Possible), to do this perform a Right Click on top of the Gantt Chart first, a pop-up menu will appear, select the option “Networking Time…”
2. In the form that will open go to the tab “Time Scale” and Change the Major Scale Units to “Months” and the Minor Scale Units to “Weeks”, then press the “Ok” button to see the results in the Gantt Chart. (Adjust as necessary the scales once you are familiar with them)
1
2
Step by Step Example Step by Step Example (Step 5 (Step 5 –– Adjust the Gantt Chart)Adjust the Gantt Chart)
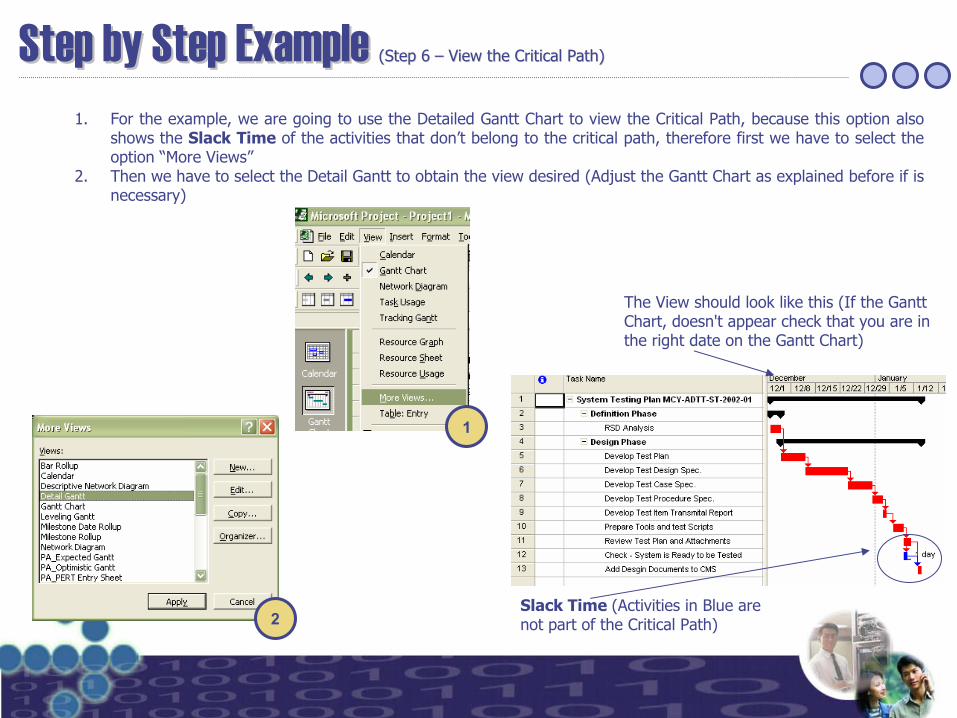
1. For the example, we are going to use the Detailed Gantt Chart to view the Critical Path, because this option also shows the Slack Time of the activities that don’t belong to the critical path, therefore first we have to select the option “More Views”
2. Then we have to select the Detail Gantt to obtain the view desired (Adjust the Gantt Chart as explained before if is necessary)
1
2
The View should look like this (If the Gantt Chart, doesn't appear check that you are in the right date on the Gantt Chart)
Slack Time (Activities in Blue are not part of the Critical Path)
Step by Step Example Step by Step Example (Step 6 (Step 6 –– View the Critical Path)View the Critical Path)
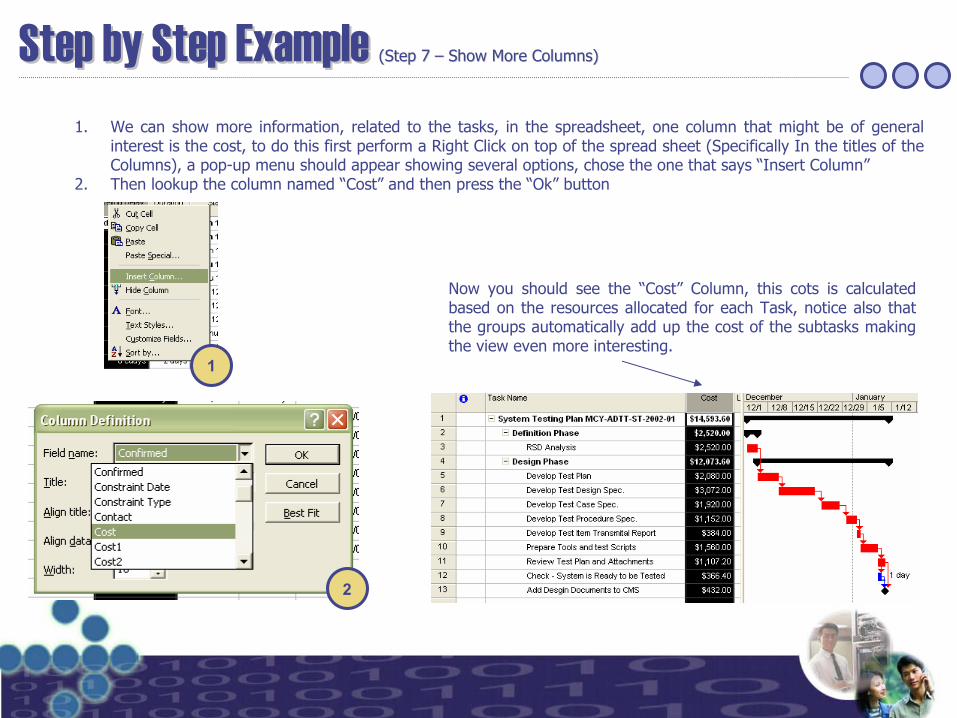
1. We can show more information, related to the tasks, in the spreadsheet, one column that might be of general interest is the cost, to do this first perform a Right Click on top of the spread sheet (Specifically In the titles of the Columns), a pop-up menu should appear showing several options, chose the one that says “Insert Column”
2. Then lookup the column named “Cost” and then press the “Ok” button
1
2
Now you should see the “Cost” Column, this cots is calculated based on the resources allocated for each Task, notice also thatthe groups automatically add up the cost of the subtasks making the view even more interesting.
Step by Step Example Step by Step Example (Step 7 (Step 7 –– Show More Columns)Show More Columns)
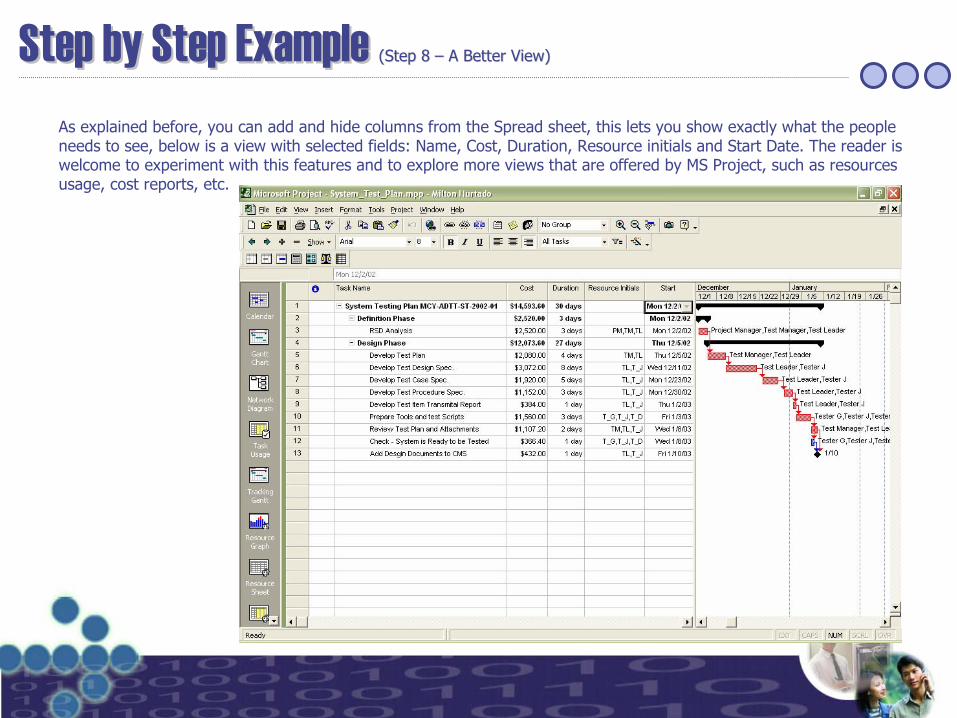
As explained before, you can add and hide columns from the Spread sheet, this lets you show exactly what the people needs to see, below is a view with selected fields: Name, Cost, Duration, Resource initials and Start Date. The reader iswelcome to experiment with this features and to explore more views that are offered by MS Project, such as resourcesusage, cost reports, etc.
Step by Step Example Step by Step Example (Step 8 (Step 8 –– A Better View)A Better View)
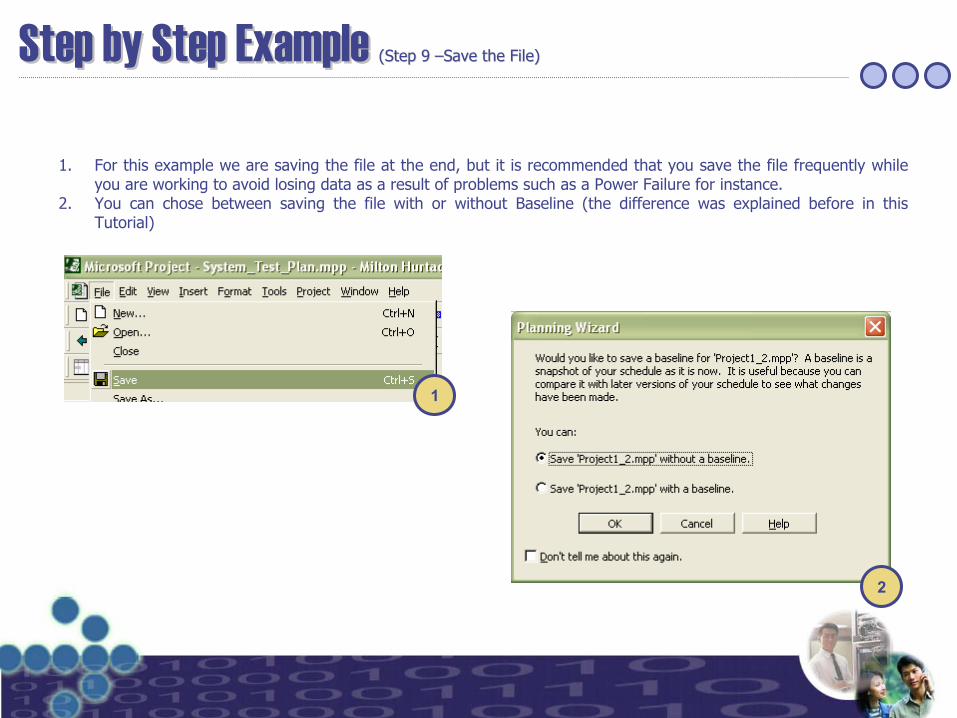
1. For this example we are saving the file at the end, but it is recommended that you save the file frequently while you are working to avoid losing data as a result of problems such as a Power Failure for instance.
2. You can chose between saving the file with or without Baseline (the difference was explained before in this Tutorial)
1
2
Step by Step Example Step by Step Example (Step 9 (Step 9 ––Save the File)Save the File)