teaching control charts for attributes using the mouse factory · teaching control charts for...
TRANSCRIPT
AC 2012-3811: TEACHING CONTROL CHARTS FOR ATTRIBUTES US-ING THE MOUSE FACTORY
Dr. Douglas H. Timmer, University of Texas, Pan American
Douglas Timmer is a professor in manufacturing engineering and the Interim Associate Dean of the Col-lege of Engineering and Computer Science at the University of Texas, Pan American.
Dr. Miguel Gonzalez, University of Texas, Pan American
Miguel A. Gonzalez serves as the Interim Vice Provost for Research and Sponsored Projects at the Uni-versity of Texas, Pan American. He has a significant amount of executive industry experience where heheld managerial and executive positions including President and CEO of a large citrus processor, andthroughout his experience, Gonzalez’ professional and academic activities are focused on an overall mis-sion to provide opportunities for student involvement by developing and maintaining a strong reputationof excellence. In the area of professional achievement, he has been able to obtain over $6 million in fund-ing for his academic activities from various sources including NASA, the National Science Foundation,the Texas Higher Education Coordinating Board’s Advanced Research Program, the U.S. Department ofCommerce, the Texas Manufacturing Assistance Center, and the U.S. Department of Labor. He has beenengaged in the assessment and training of human factors associated with healthcare systems from the timeof his doctoral dissertation. He has developed simulators for labs and healthcare providers together withintegrated Logistics support systems for Advanced Cardiac Life Support. One of his current interests is inthe area of manufacturing systems for rapid product design and development in international production.An extension of this work is the current effort that established the UTPA Rapid Response Manufactur-ing Center in a consortium of academic institutions, economic development corporations, industry, local,state, and federal governments. This initiative is an integral component of the North American AdvancedManufacturing and Research Initiative (NAAMREI). In addition, he has served and continues to serve inleadership positions in technology based economic development in the Rio South Texas region.
Dr. Connie M. Borror, Arizona State University, WestProf. Douglas C. Montgomery, Arizona State University
Douglas C. Montgomery is Regents’ Professor of industrial engineering and statistics and FoundationProfessor of engineering at Arizona State University. His research and teaching interests are in industrialstatistics. Montgomery is a Fellow of the ASA, a Fellow of the ASQ, a Fellow of the RSS, a Fellow ofIIE, a Member of the ISI, and an Academician of the IAQ. He has received several teaching and researchawards, including the Shewhart Medal, the Brumbaugh Award and the Lloyd Nelson Award from theASQ, the George Box medal from ENBIS, the Greenfeld medal from the Royal Statistical Society, andthe Deming Lecture award from the American Statistical Association.
c©American Society for Engineering Education, 2012

Teaching Control Charts for Attributes using the Mouse Factory Abstract The Mouse Factory contains a set of web-based, active learning modules for teaching statistical quality control. This paper will present teaching control charts for attributes using the Mouse Factory. The current pedagogy in today’s classrooms is based upon lectures and homework problems from textbooks. This approach typically focuses on the knowledge and application domains of Bloom’s Taxonomy. The current pedagogy removes students from applying higher order cognitive skills. By using the Mouse Factory, students must select the most appropriate improvement project to undertake, design a sampling plan, implement a control chart and evaluate the effectiveness of the implement control chart. Assessment of student behavior and attitudes will be discussed and evaluated. Introduction The American Society for Engineering Management (ASEM)1 defines engineering management as “the art and science of planning, organizing, allocating resources, and directing and controlling activities which have a technical component.” Quality-related activities are widely accepted as an important field of engineering management and industrial engineering. In today’s global and highly competitive business environment, high quality products and services are a necessity. Quality is one method in which organizations compete2. The Society of Manufacturing Engineers (SME)3,4 has conducted competency surveys and has repeatedly identified quality as an important competency gap. This paper will present a method to address the quality competency gap in the use of control charts for attributes. In particular, control charts for nonconformity data or c charts will be examined. Control charts, in general, are one of the most important tools for quality control and improvement5. Montgomery5 states that control charts have common usage in many industries due to the following reasons: 1) control charts are a proven technique for improving productivity, 2) control charts are effective in defect prevention, 3) control charts prevent unnecessary process adjustments, 4) control charts provide diagnostic information, and 5) control charts provide information about process capability. This research will present a method for teaching engineering students the use of c control charts for nonconformity data. Another important gap is in the pedagogy used to teach quality control and control charts in many engineering curriculums. It is the authors’ experiences that most engineering instruction is still conducted in a lecture format. While lecturing is an excellent method of communicating large amounts of information, students are experiencing passive learning and the amount of learning that occurs is often small6. There are many excellent textbooks, such as Montgomery, that provide explanations and practice problems. However the use of textbook and homework problems stress the categories of knowledge, comprehension and application in Bloom’s Taxonomy7 of cognitive skills. But this mode of instruction is less likely to emphasize the higher-order cognitive skills of analysis, synthesis and evaluation.

This paper will present research on developing and implementing a web-based, active learning module that teaches students the use of control charts for nonconformity data. Learning activities are designed to emphasize higher-order cognitive skills. Results of implementing the learning module in a senior-level Manufacturing Engineering course are presented. Conclusions and future research are presented in the final sections. Mouse Factory The Mouse Factory is a web-based simulation of a manufacturing plant for computer mice. There are two major components to the Mouse Factory. The first major component is a (html) website that contains a complete description of the Mouse Factory. Figure 1 shows the plant layout for the Mouse Factory. The plant layout contains “hot zones” that allow the user to click to view the details of any portion of the Mouse Factory. At the bottom of the plant layout page is a link to the bill of materials. The bill of materials shown in Figure 2 contains a list of all materials required to make a computer mouse and production information. Quality related information is found from the bill of materials by clicking on the critical points hyperlink. Figure 3 displays the critical point information for the mouse cover. The cover contains one inspection point, the post diameter, where a control chart may be applied. In addition to the variables information, attributes data describing possible non-conforming items and non-conformities is also contained in the critical point webpage.
Figure 1. Plant Layout
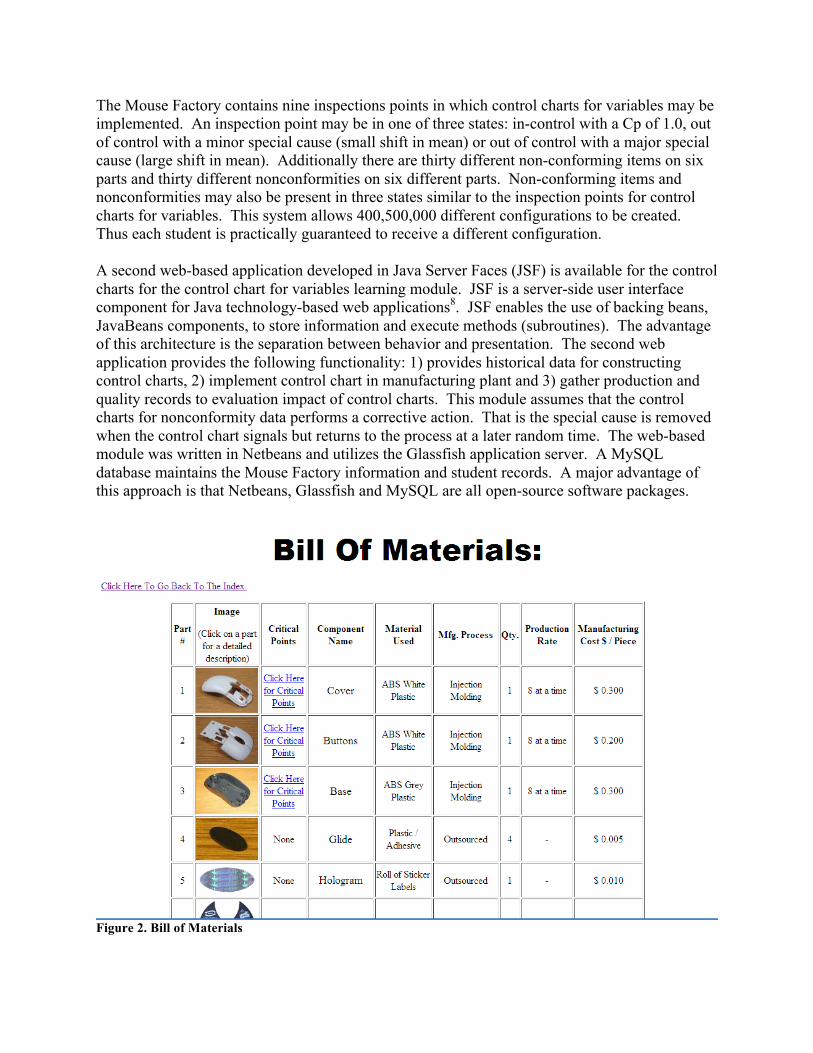
The Mouse Factory contains nine inspections points in which control charts for variables may be implemented. An inspection point may be in one of three states: in-control with a Cp of 1.0, out of control with a minor special cause (small shift in mean) or out of control with a major special cause (large shift in mean). Additionally there are thirty different non-conforming items on six parts and thirty different nonconformities on six different parts. Non-conforming items and nonconformities may also be present in three states similar to the inspection points for control charts for variables. This system allows 400,500,000 different configurations to be created. Thus each student is practically guaranteed to receive a different configuration. A second web-based application developed in Java Server Faces (JSF) is available for the control charts for the control chart for variables learning module. JSF is a server-side user interface component for Java technology-based web applications8. JSF enables the use of backing beans, JavaBeans components, to store information and execute methods (subroutines). The advantage of this architecture is the separation between behavior and presentation. The second web application provides the following functionality: 1) provides historical data for constructing control charts, 2) implement control chart in manufacturing plant and 3) gather production and quality records to evaluation impact of control charts. This module assumes that the control charts for nonconformity data performs a corrective action. That is the special cause is removed when the control chart signals but returns to the process at a later random time. The web-based module was written in Netbeans and utilizes the Glassfish application server. A MySQL database maintains the Mouse Factory information and student records. A major advantage of this approach is that Netbeans, Glassfish and MySQL are all open-source software packages.
Figure 2. Bill of Materials
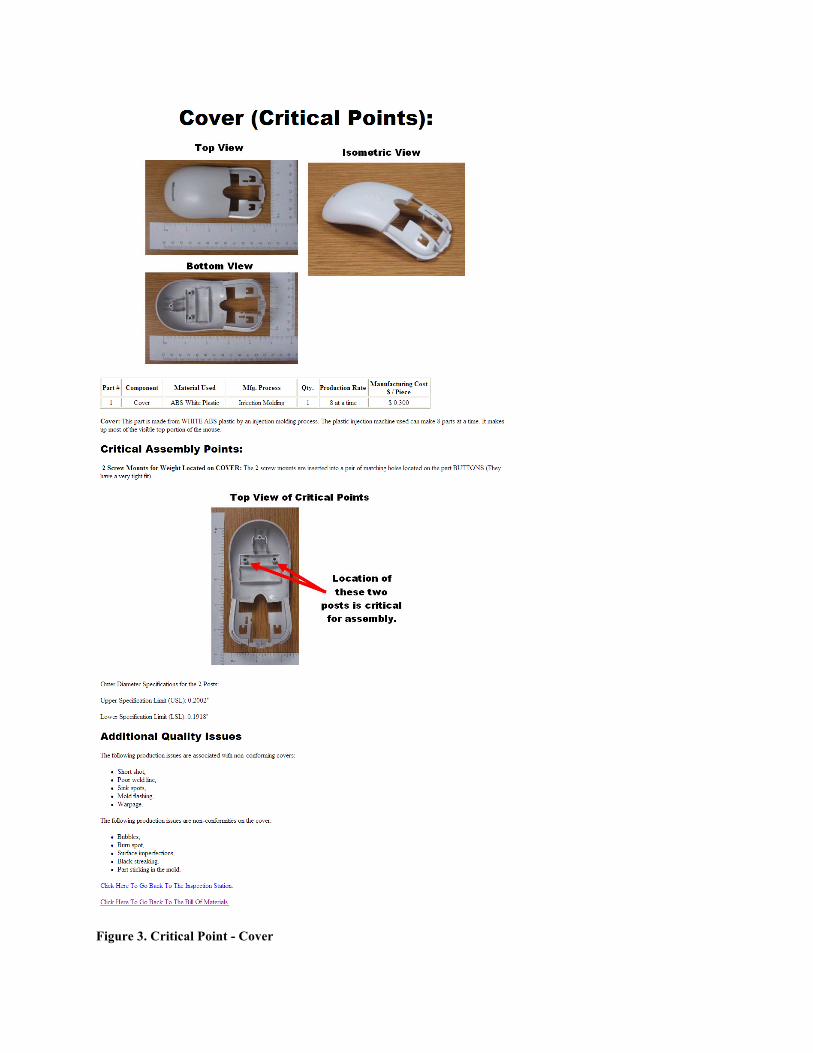
Figure 3. Critical Point - Cover

SPC Lab Four The fourth SPC laboratory allows students to design, implement and evaluate the impact of implementing a c control chart within the Mouse Factory. In the first SPC laboratory, students used common SPC tools such as checksheets and Pareto diagrams to identify the sources of nonconforming data and nonconformities to which a control chart will be applied. The fourth SPC laboratory contains four components: assignment, rubric, Mouse Factory website and Control Chart for Nonconformity Data web-based application. The fourth SPC laboratory contains the following four learning goals:
1. Design a sampling plan for a c control chart, 2. Perform a retrospective analysis for the c control chart, 3. Implement the control chart in the Mouse Factory 4. Evaluate the effect of implementing the control chart for parts with nonconformities upon
the quality of the Mouse Factory. An important consideration in developing the learning goals was a focus on higher-order cognitive skills. Based upon the learning goals, a list of deliverables is provided to the students. Students are required to provide:
A professional, type written report, A detailed discussion of their sampling plan (students may be required to sample every
unit), A set of control limits for use in online monitoring, Implementation of the control chart in online use for x days, A new benchmark of production and quality metrics (total parts, good parts, bad parts and
off-spec parts) from the process with the control chart implemented, A comparison of the plant performance with and without a control chart, A summary statement describing the effect of implementing a c control chart upon the
quality (as measured by the benchmarks) of the Mouse Factory. From the deliverables, a rubric was developed as show in Figure 4. The final component of this laboratory is assessment. Student performance for this laboratory is evaluated using the rubric show in Figure 4. Students were voluntarily asked to complete a demographic sheet and survey after submitting the laboratory assignment. The survey focused on the students perceived understanding of the laboratory learning goals and confidence to implement learning goals in real life.
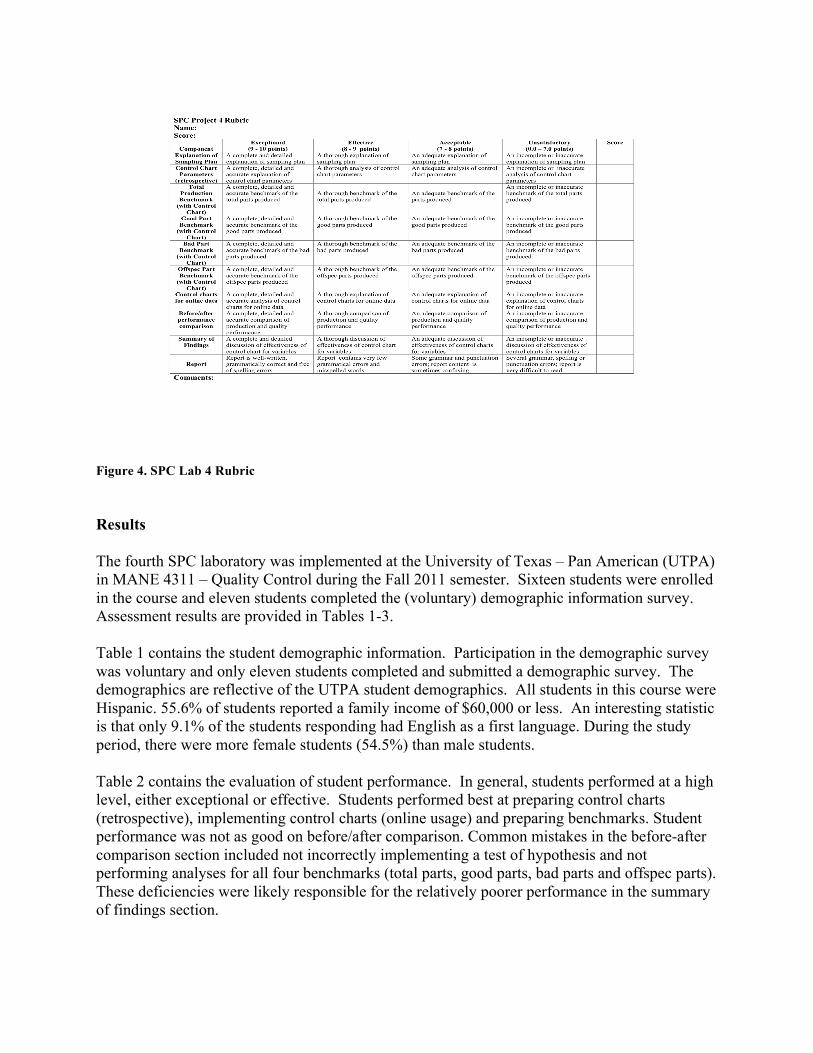
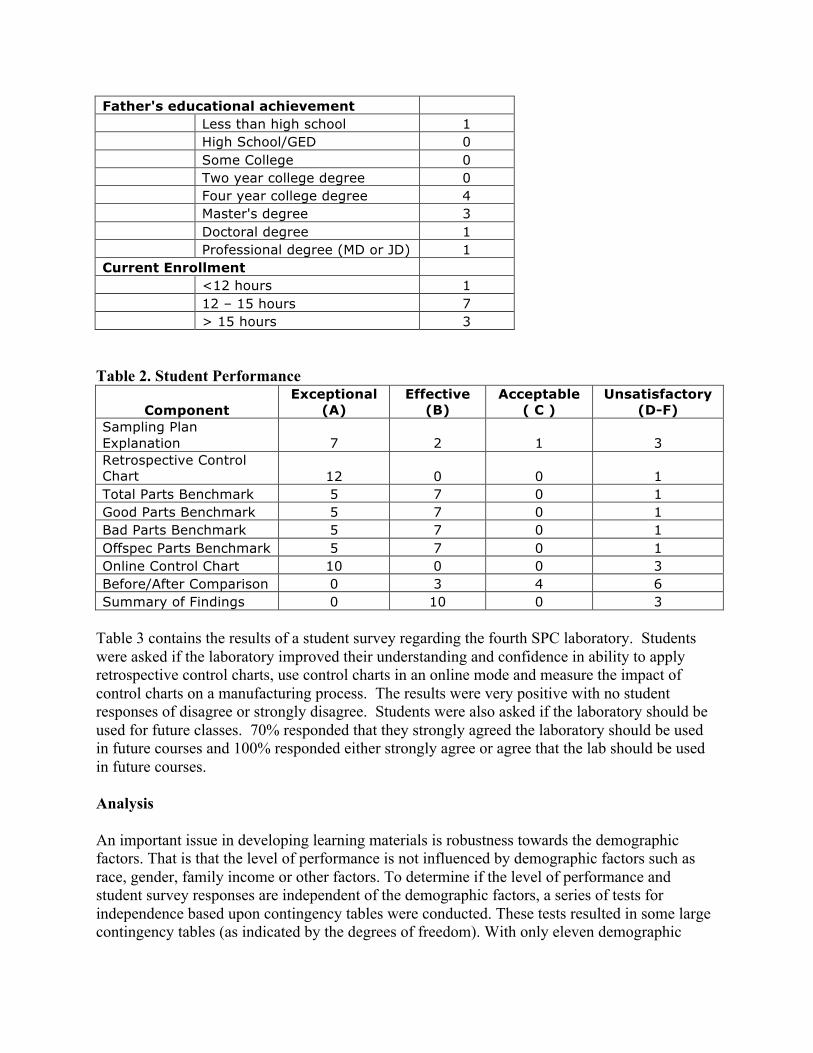
Figure 4. SPC Lab 4 Rubric Results The fourth SPC laboratory was implemented at the University of Texas – Pan American (UTPA) in MANE 4311 – Quality Control during the Fall 2011 semester. Sixteen students were enrolled in the course and eleven students completed the (voluntary) demographic information survey. Assessment results are provided in Tables 1-3. Table 1 contains the student demographic information. Participation in the demographic survey was voluntary and only eleven students completed and submitted a demographic survey. The demographics are reflective of the UTPA student demographics. All students in this course were Hispanic. 55.6% of students reported a family income of $60,000 or less. An interesting statistic is that only 9.1% of the students responding had English as a first language. During the study period, there were more female students (54.5%) than male students. Table 2 contains the evaluation of student performance. In general, students performed at a high level, either exceptional or effective. Students performed best at preparing control charts (retrospective), implementing control charts (online usage) and preparing benchmarks. Student performance was not as good on before/after comparison. Common mistakes in the before-after comparison section included not incorrectly implementing a test of hypothesis and not performing analyses for all four benchmarks (total parts, good parts, bad parts and offspec parts). These deficiencies were likely responsible for the relatively poorer performance in the summary of findings section.
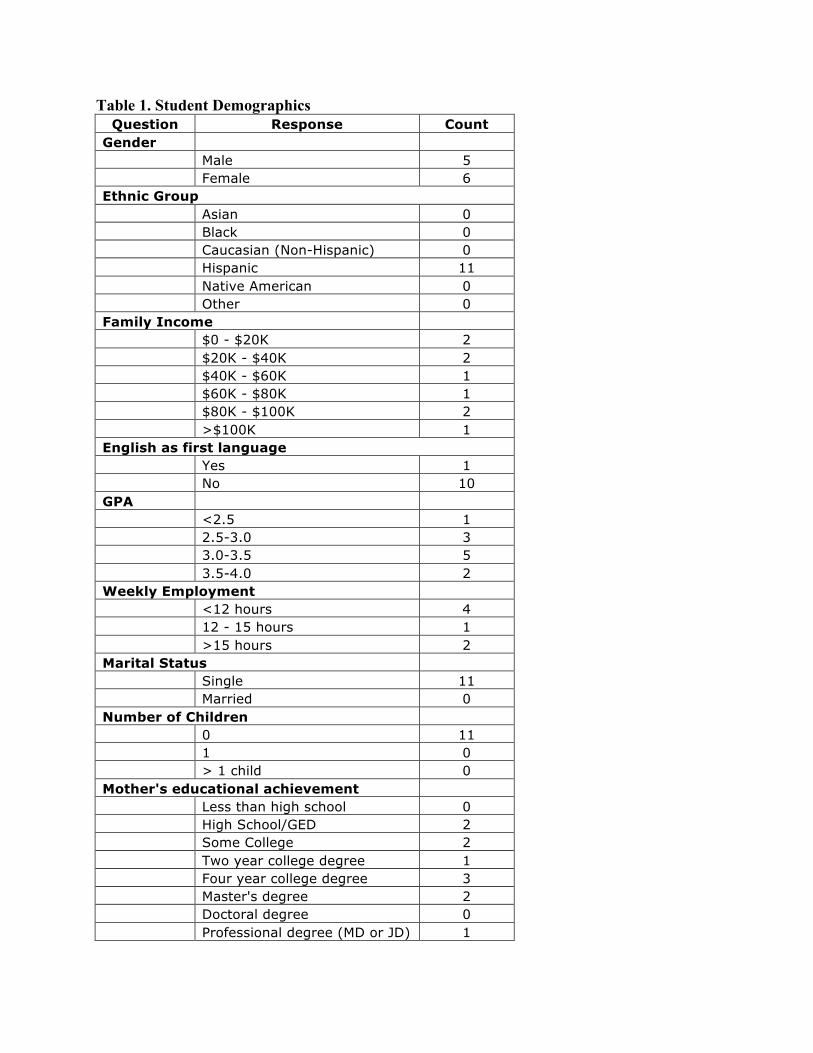
Table 1. Student Demographics Question Response Count
Gender Male 5 Female 6 Ethnic Group Asian 0 Black 0 Caucasian (Non-Hispanic) 0 Hispanic 11 Native American 0 Other 0 Family Income $0 - $20K 2 $20K - $40K 2 $40K - $60K 1 $60K - $80K 1 $80K - $100K 2 >$100K 1 English as first language Yes 1 No 10 GPA <2.5 1 2.5-3.0 3 3.0-3.5 5 3.5-4.0 2 Weekly Employment <12 hours 4 12 - 15 hours 1 >15 hours 2 Marital Status Single 11 Married 0 Number of Children 0 11 1 0 > 1 child 0 Mother's educational achievement Less than high school 0 High School/GED 2 Some College 2 Two year college degree 1 Four year college degree 3 Master's degree 2 Doctoral degree 0 Professional degree (MD or JD) 1
Father's educational achievement Less than high school 1 High School/GED 0 Some College 0 Two year college degree 0 Four year college degree 4 Master's degree 3 Doctoral degree 1 Professional degree (MD or JD) 1 Current Enrollment <12 hours 1 12 – 15 hours 7 > 15 hours 3
Table 2. Student Performance
Component Exceptional
(A) Effective
(B) Acceptable
( C ) Unsatisfactory
(D-F) Sampling Plan Explanation 7 2 1 3 Retrospective Control Chart 12 0 0 1 Total Parts Benchmark 5 7 0 1 Good Parts Benchmark 5 7 0 1 Bad Parts Benchmark 5 7 0 1 Offspec Parts Benchmark 5 7 0 1 Online Control Chart 10 0 0 3 Before/After Comparison 0 3 4 6 Summary of Findings 0 10 0 3
Table 3 contains the results of a student survey regarding the fourth SPC laboratory. Students were asked if the laboratory improved their understanding and confidence in ability to apply retrospective control charts, use control charts in an online mode and measure the impact of control charts on a manufacturing process. The results were very positive with no student responses of disagree or strongly disagree. Students were also asked if the laboratory should be used for future classes. 70% responded that they strongly agreed the laboratory should be used in future courses and 100% responded either strongly agree or agree that the lab should be used in future courses. Analysis An important issue in developing learning materials is robustness towards the demographic factors. That is that the level of performance is not influenced by demographic factors such as race, gender, family income or other factors. To determine if the level of performance and student survey responses are independent of the demographic factors, a series of tests for independence based upon contingency tables were conducted. These tests resulted in some large contingency tables (as indicated by the degrees of freedom). With only eleven demographic
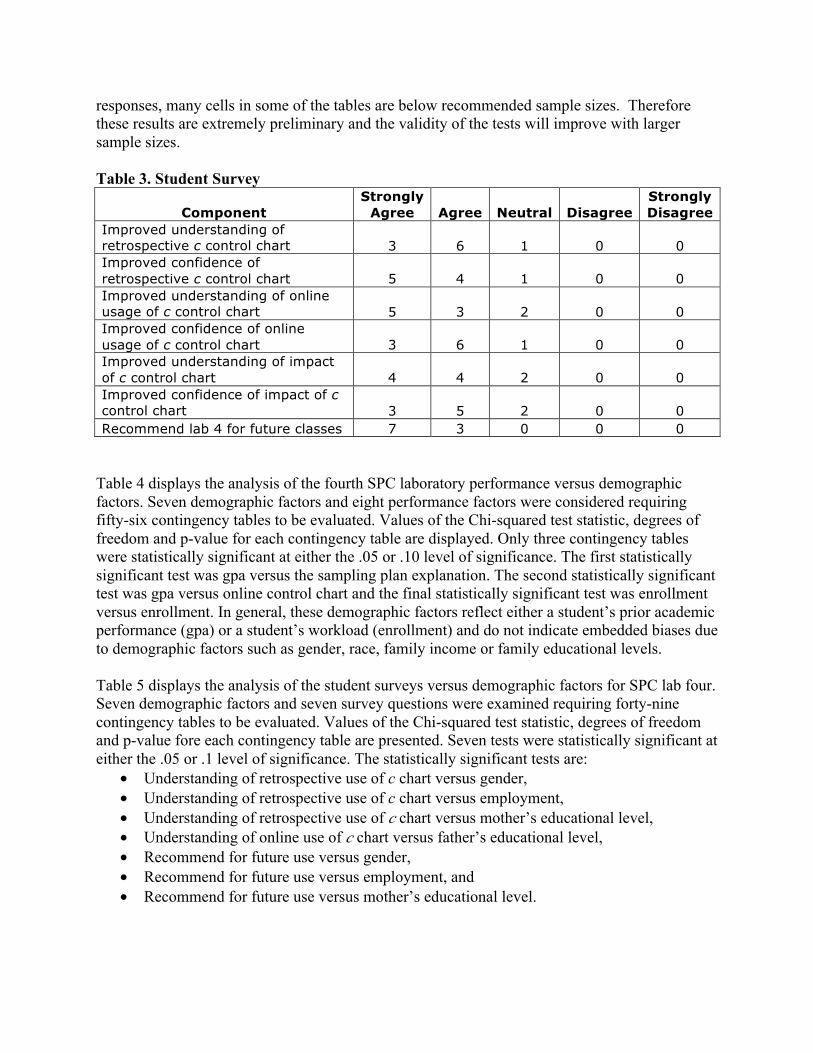
responses, many cells in some of the tables are below recommended sample sizes. Therefore these results are extremely preliminary and the validity of the tests will improve with larger sample sizes. Table 3. Student Survey
Component Strongly
Agree Agree Neutral Disagree Strongly Disagree
Improved understanding of retrospective c control chart 3 6 1 0 0 Improved confidence of retrospective c control chart 5 4 1 0 0 Improved understanding of online usage of c control chart 5 3 2 0 0 Improved confidence of online usage of c control chart 3 6 1 0 0 Improved understanding of impact of c control chart 4 4 2 0 0 Improved confidence of impact of c control chart 3 5 2 0 0 Recommend lab 4 for future classes 7 3 0 0 0
Table 4 displays the analysis of the fourth SPC laboratory performance versus demographic factors. Seven demographic factors and eight performance factors were considered requiring fifty-six contingency tables to be evaluated. Values of the Chi-squared test statistic, degrees of freedom and p-value for each contingency table are displayed. Only three contingency tables were statistically significant at either the .05 or .10 level of significance. The first statistically significant test was gpa versus the sampling plan explanation. The second statistically significant test was gpa versus online control chart and the final statistically significant test was enrollment versus enrollment. In general, these demographic factors reflect either a student’s prior academic performance (gpa) or a student’s workload (enrollment) and do not indicate embedded biases due to demographic factors such as gender, race, family income or family educational levels. Table 5 displays the analysis of the student surveys versus demographic factors for SPC lab four. Seven demographic factors and seven survey questions were examined requiring forty-nine contingency tables to be evaluated. Values of the Chi-squared test statistic, degrees of freedom and p-value fore each contingency table are presented. Seven tests were statistically significant at either the .05 or .1 level of significance. The statistically significant tests are:
Understanding of retrospective use of c chart versus gender, Understanding of retrospective use of c chart versus employment, Understanding of retrospective use of c chart versus mother’s educational level, Understanding of online use of c chart versus father’s educational level, Recommend for future use versus gender, Recommend for future use versus employment, and Recommend for future use versus mother’s educational level.
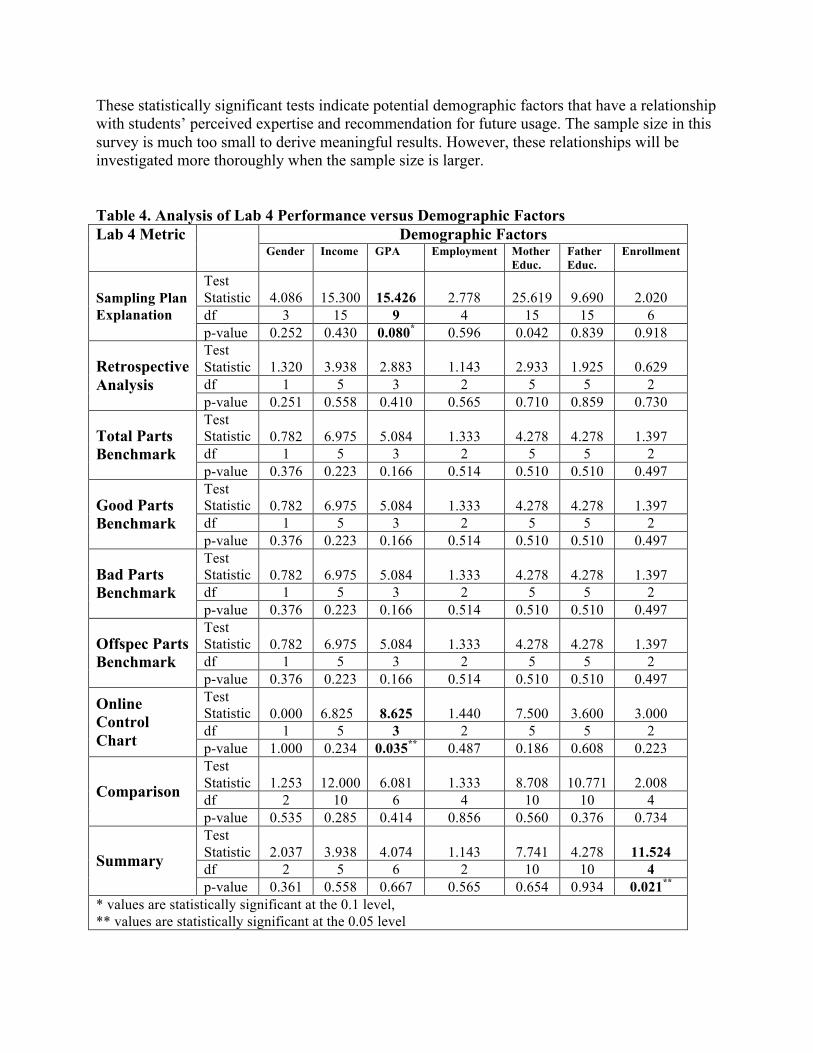
These statistically significant tests indicate potential demographic factors that have a relationship with students’ perceived expertise and recommendation for future usage. The sample size in this survey is much too small to derive meaningful results. However, these relationships will be investigated more thoroughly when the sample size is larger. Table 4. Analysis of Lab 4 Performance versus Demographic Factors
Demographic Factors Lab 4 Metric Gender Income GPA Employment Mother
Educ. Father Educ.
Enrollment
Test Statistic 4.086 15.300 15.426 2.778 25.619 9.690 2.020 df 3 15 9 4 15 15 6
Sampling Plan Explanation
p-value 0.252 0.430 0.080* 0.596 0.042 0.839 0.918 Test Statistic 1.320 3.938 2.883 1.143 2.933 1.925 0.629 df 1 5 3 2 5 5 2
Retrospective Analysis
p-value 0.251 0.558 0.410 0.565 0.710 0.859 0.730 Test Statistic 0.782 6.975 5.084 1.333 4.278 4.278 1.397 df 1 5 3 2 5 5 2
Total Parts Benchmark
p-value 0.376 0.223 0.166 0.514 0.510 0.510 0.497 Test Statistic 0.782 6.975 5.084 1.333 4.278 4.278 1.397 df 1 5 3 2 5 5 2
Good Parts Benchmark
p-value 0.376 0.223 0.166 0.514 0.510 0.510 0.497 Test Statistic 0.782 6.975 5.084 1.333 4.278 4.278 1.397 df 1 5 3 2 5 5 2
Bad Parts Benchmark
p-value 0.376 0.223 0.166 0.514 0.510 0.510 0.497 Test Statistic 0.782 6.975 5.084 1.333 4.278 4.278 1.397 df 1 5 3 2 5 5 2
Offspec Parts Benchmark
p-value 0.376 0.223 0.166 0.514 0.510 0.510 0.497 Test Statistic 0.000 6.825 8.625 1.440 7.500 3.600 3.000 df 1 5 3 2 5 5 2
Online Control Chart p-value 1.000 0.234 0.035** 0.487 0.186 0.608 0.223
Test Statistic 1.253 12.000 6.081 1.333 8.708 10.771 2.008 df 2 10 6 4 10 10 4 Comparison p-value 0.535 0.285 0.414 0.856 0.560 0.376 0.734 Test Statistic 2.037 3.938 4.074 1.143 7.741 4.278 11.524 df 2 5 6 2 10 10 4 Summary p-value 0.361 0.558 0.667 0.565 0.654 0.934 0.021**
* values are statistically significant at the 0.1 level, ** values are statistically significant at the 0.05 level
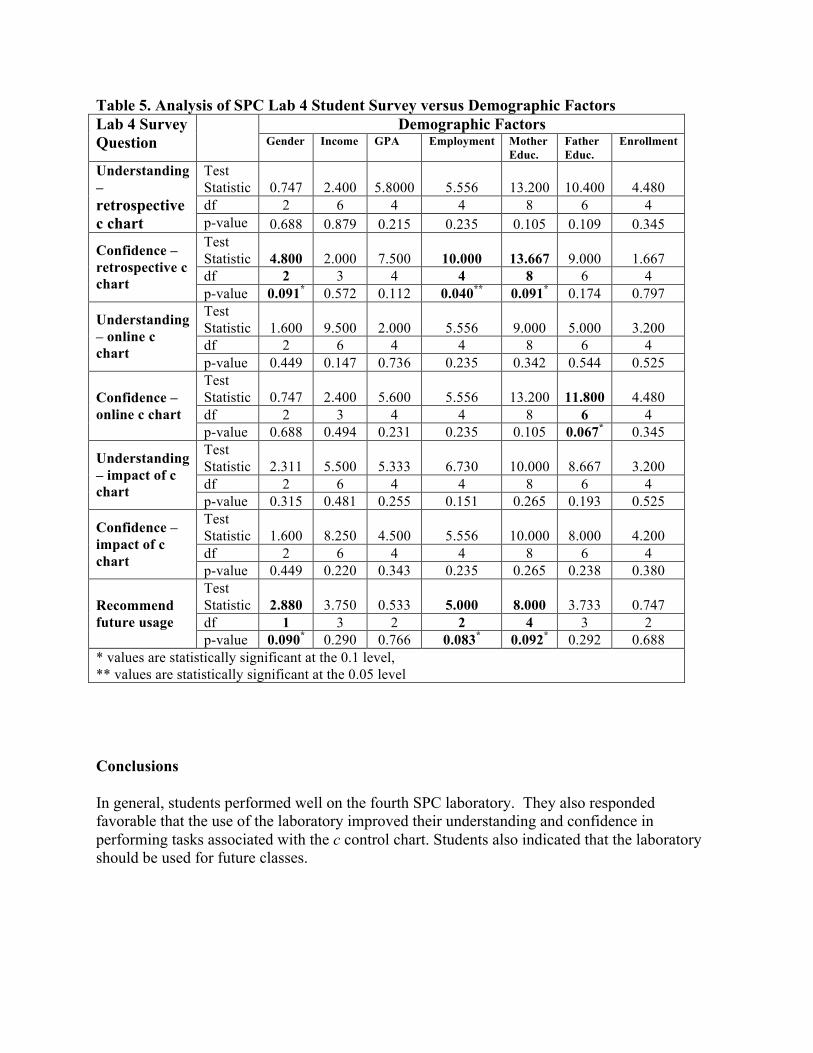
Table 5. Analysis of SPC Lab 4 Student Survey versus Demographic Factors Demographic Factors Lab 4 Survey
Question Gender Income GPA Employment Mother Educ.
Father Educ.
Enrollment
Test Statistic 0.747 2.400 5.8000 5.556 13.200 10.400 4.480 df 2 6 4 4 8 6 4
Understanding – retrospective c chart p-value 0.688 0.879 0.215 0.235 0.105 0.109 0.345
Test Statistic 4.800 2.000 7.500 10.000 13.667 9.000 1.667 df 2 3 4 4 8 6 4
Confidence – retrospective c chart
p-value 0.091* 0.572 0.112 0.040** 0.091* 0.174 0.797 Test Statistic 1.600 9.500 2.000 5.556 9.000 5.000 3.200 df 2 6 4 4 8 6 4
Understanding – online c chart
p-value 0.449 0.147 0.736 0.235 0.342 0.544 0.525 Test Statistic 0.747 2.400 5.600 5.556 13.200 11.800 4.480 df 2 3 4 4 8 6 4
Confidence – online c chart
p-value 0.688 0.494 0.231 0.235 0.105 0.067* 0.345 Test Statistic 2.311 5.500 5.333 6.730 10.000 8.667 3.200 df 2 6 4 4 8 6 4
Understanding – impact of c chart
p-value 0.315 0.481 0.255 0.151 0.265 0.193 0.525 Test Statistic 1.600 8.250 4.500 5.556 10.000 8.000 4.200 df 2 6 4 4 8 6 4
Confidence – impact of c chart p-value 0.449 0.220 0.343 0.235 0.265 0.238 0.380
Test Statistic 2.880 3.750 0.533 5.000 8.000 3.733 0.747 df 1 3 2 2 4 3 2
Recommend future usage
p-value 0.090* 0.290 0.766 0.083* 0.092* 0.292 0.688 * values are statistically significant at the 0.1 level, ** values are statistically significant at the 0.05 level Conclusions In general, students performed well on the fourth SPC laboratory. They also responded favorable that the use of the laboratory improved their understanding and confidence in performing tasks associated with the c control chart. Students also indicated that the laboratory should be used for future classes.
Future Research The most pressing need is to increase the sample size to improve the validity of the contingency tables. Once reasonable sample sizes are collected, the contingency table analysis will be repeated and associations between statistically significant tests for independence between demographic factors and performance levels/survey responses will be investigated in-depth. Readers interested in participating in this research should contact the lead author. Acknowledgements Initial funding for this research was provided by UTPA Center for Information Technology and the National Science Foundation under Grant No. 0341290. This material is based upon work supported by the National Science Foundation under Grant Numbers 0817508 and 0817591. Bibliography 1. Engineering Management (n.d.). Retrieved from http://www.asem.org/about/index.html. 2. Shtub, A., Bard, J, & Globerson, 2. (2005). Project Management: Processes, Methodologies and Economics,
2nd edition, New Jersey: Pearson-Prentice Hall. 3. Mott, R. & Houdeshell, J (1998). Addressing Competency Gaps in Manufacturing Engineering. Technical
Report ER98-326, Society of Manufacturing Engineers. 4. SME Foundation (2002). Competency Gaps and Criteria for 2002. Technical Report, Society for
Manufacturing Engineers. 5. Montgomery (2009). Introduction to Statistical Quality Control, 6th edition. New Jersey: John Wiley & Sons. 6. Bonwell, J. & Eison, J. (1991). Active Learning: Creating Excitement in the Classroom. Technical Report
AHSE-ERIC, Higher Education Report No. 1. 7. Bloom, B., Engelhart, M., Furst, E., Hill, W., & Krathwol, D. (1956). Taxonomy of Educational Objectives:
The Classification of Educational Goals, Handbook 1: Cognitive Domain. New York: David McKay Company, Inc.
8. Java EE 5 Tutorial, Chapter 10 – JavaServer Faces Technology (n.d.). Retrieved from http://java.sun.com/javaee/5/docs/tutorial/doc/bnaph.html.