the intelligent business - dmsg.bcs.org intelligent business •high degree of management...
TRANSCRIPT
The Intelligent Business and Business Intelligence
Dan Burrows
27th June 2012

Agenda
• Myths • The “Intelligent Business” • Recognising the need • Rewards of intelligence • The path to an intelligent outlook

Dispelling the myths
• Business Intelligence isn’t new!
• There is no ‘Business Intelligence System’
• BI isn’t just for manufacturers
• BI doesn’t have to be expensive
• BI doesn’t have to complicated

The Intelligent Business
• High degree of management understanding and control
• Aligned business strategy and systems
• Supporting intelligence with systems

The Intelligence Pyramid

Recognising the Need • A lack of control, demonstrated by
– Delays – Repetition – many versions of the (un)truth – Inaccuracies, inconsistencies,
• Lack of alignment between business strategy and business systems – Undefined requirements – Inertia – Retained knowledge
• Systems built or selected with an intelligent approach
– Documented input and output – Facilitating high-quality data – Highly integrated and flexible

Cyclical Reporting
Start Sun
01/07/12
Finish Tue 11/09/12
02 Jul '12
09 Jul '12
16 Jul '12
23 Jul '12
30 Jul '12
06 Aug '12
13 Aug '12
20 Aug '12
27 Aug '12
03 Sep '12
10 Sep '12
Monthly KPIs Mon 02/07/12 - Tue
10/07/12
Monthly KPIs Wed 01/08/12 - Thu
09/08/12
Monthly KPIs Mon 03/09/12 - Tue
11/09/12
Problem occurs
Sun 01/07/12
Monthly Reporting Cycles
Mon 02/07/12 - Tue 11/09/12
Problem identified
Tue 10/07/12
Resolution put in place
Wed 11/07/12 - Tue 17/07/12
Resolution operational
Wed 18/07/12 - Tue 31/07/12
Effectiveness identified
Fri 10/08/12
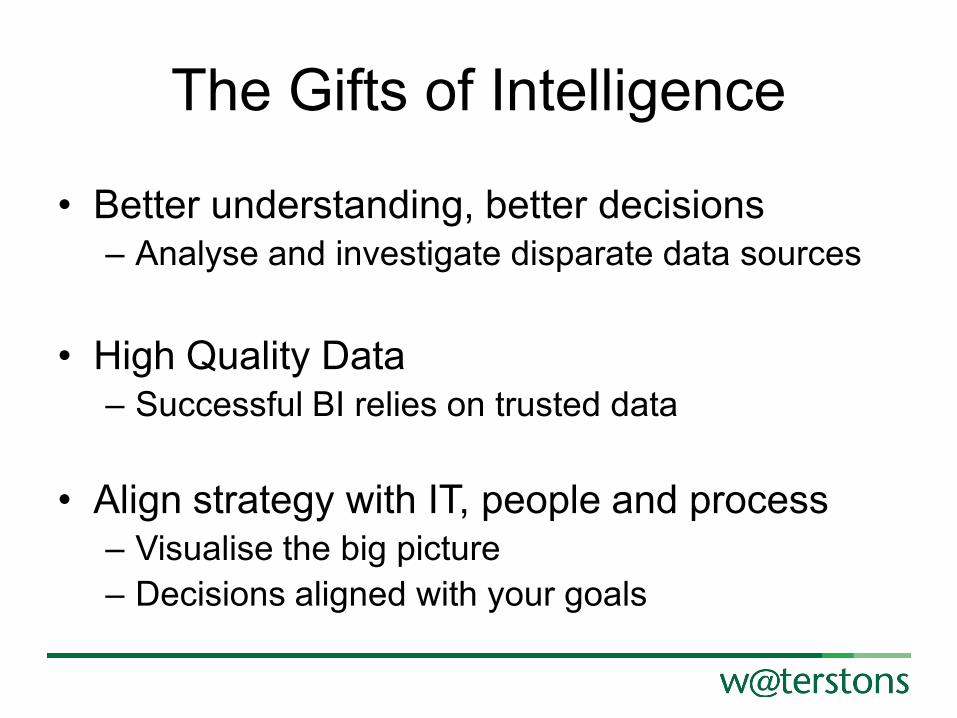
The Gifts of Intelligence
• Better understanding, better decisions – Analyse and investigate disparate data sources
• High Quality Data
– Successful BI relies on trusted data
• Align strategy with IT, people and process – Visualise the big picture – Decisions aligned with your goals
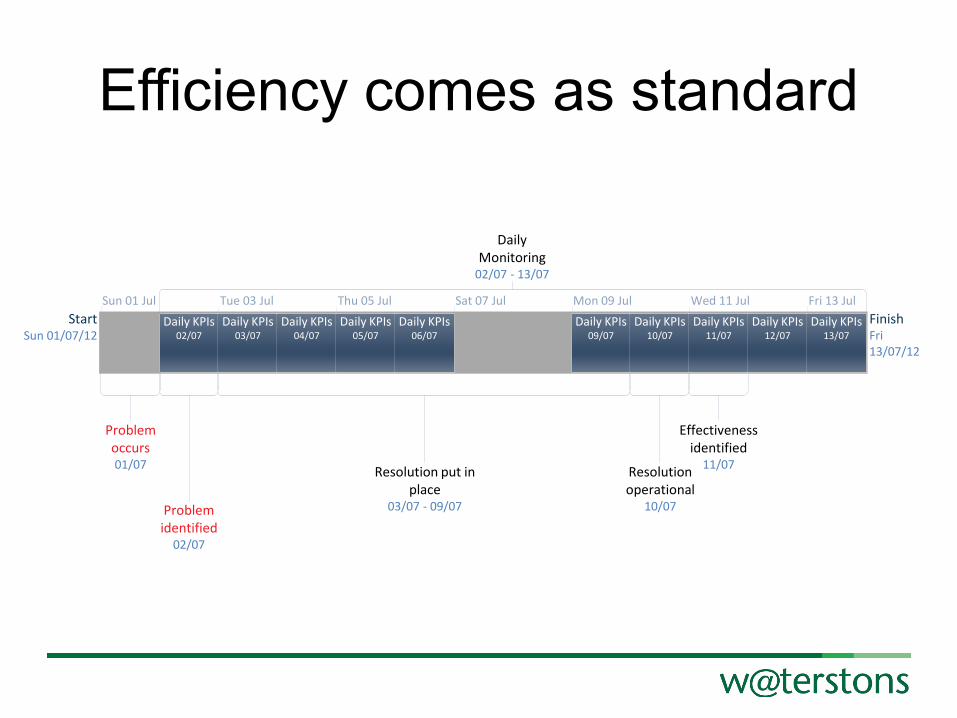
Efficiency comes as standard
Start Sun 01/07/12
Finish Fri 13/07/12
Sun 01 Jul Tue 03 Jul Thu 05 Jul Sat 07 Jul Mon 09 Jul Wed 11 Jul Fri 13 Jul Daily KPIs
02/07 Daily KPIs
03/07 Daily KPIs
04/07 Daily KPIs
05/07 Daily KPIs
06/07 Daily KPIs
09/07 Daily KPIs
10/07 Daily KPIs
11/07 Daily KPIs
12/07 Daily KPIs
13/07
Problem occurs 01/07
Daily Monitoring
02/07 - 13/07
Problem identified
02/07
Resolution put in place
03/07 - 09/07
Resolution operational
10/07
Effectiveness identified
11/07

Comparative Analysis
Start Sun 01/07/12
Finish Tue 11/09/12
02 Jul '12 09 Jul '12 16 Jul '12 23 Jul '12 30 Jul '12 06 Aug '12 13 Aug '12 20 Aug '12 27 Aug '12 03 Sep '12 10 Sep '12
Monthly KPIs Mon 02/07/12 - Tue
10/07/12
Monthly KPIs Wed 01/08/12 - Thu
09/08/12
Monthly KPIs Mon 03/09/12 - Tue
11/09/12
Problem occurs Sun 01/07/12
Problem occurs (Daily Reporting)
Sun 01/07/12
Monthly Reporting Cycles Mon 02/07/12 - Tue
11/09/12
Problem identified Tue 10/07/12
Resolution put in place Wed 11/07/12 - Tue
17/07/12
Effectiveness identified (Daily Reporting)
Wed 11/07/12
Resolution operational Wed 18/07/12 - Tue
31/07/12
Effectiveness identified Fri 10/08/12
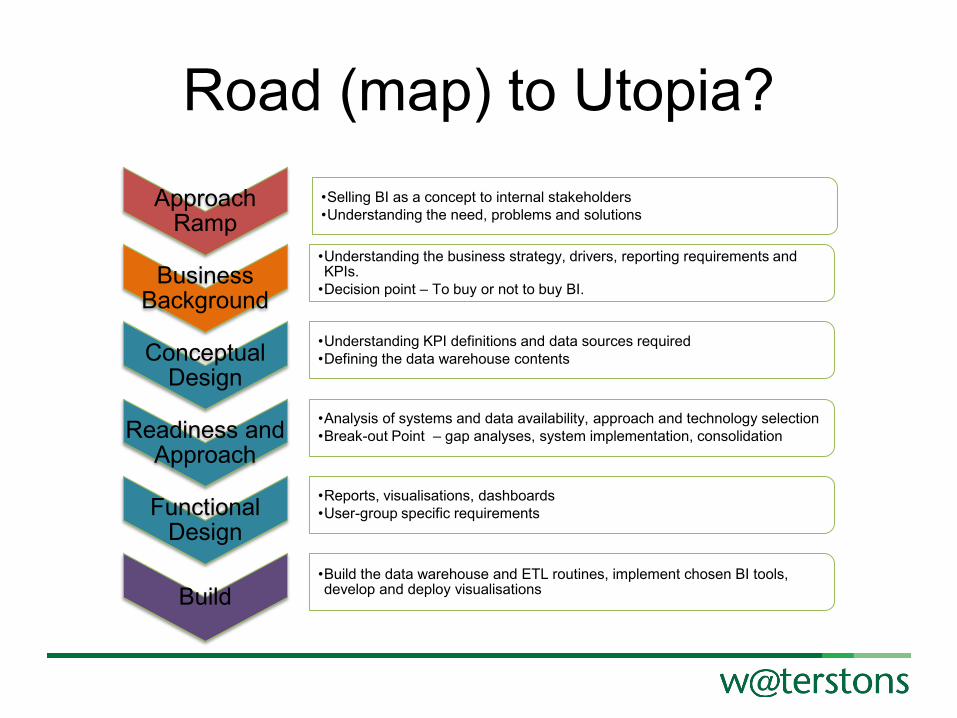
Approach Ramp
•Selling BI as a concept to internal stakeholders •Understanding the need, problems and solutions
Business Background
•Understanding the business strategy, drivers, reporting requirements and KPIs. •Decision point – To buy or not to buy BI.
Conceptual Design
•Understanding KPI definitions and data sources required •Defining the data warehouse contents
Readiness and Approach
•Analysis of systems and data availability, approach and technology selection •Break-out Point – gap analyses, system implementation, consolidation
Functional Design
•Reports, visualisations, dashboards •User-group specific requirements
Build •Build the data warehouse and ETL routines, implement chosen BI tools, develop and deploy visualisations
Road (map) to Utopia?

• Selling BI as a concept to internal stakeholders
• Understanding the need, problems and solutions
Approach Ramp
• Understanding the business strategy, drivers, reporting requirements and KPIs
• Decision point – To buy or not to buy BI
Business Background
Road (map) to Utopia?
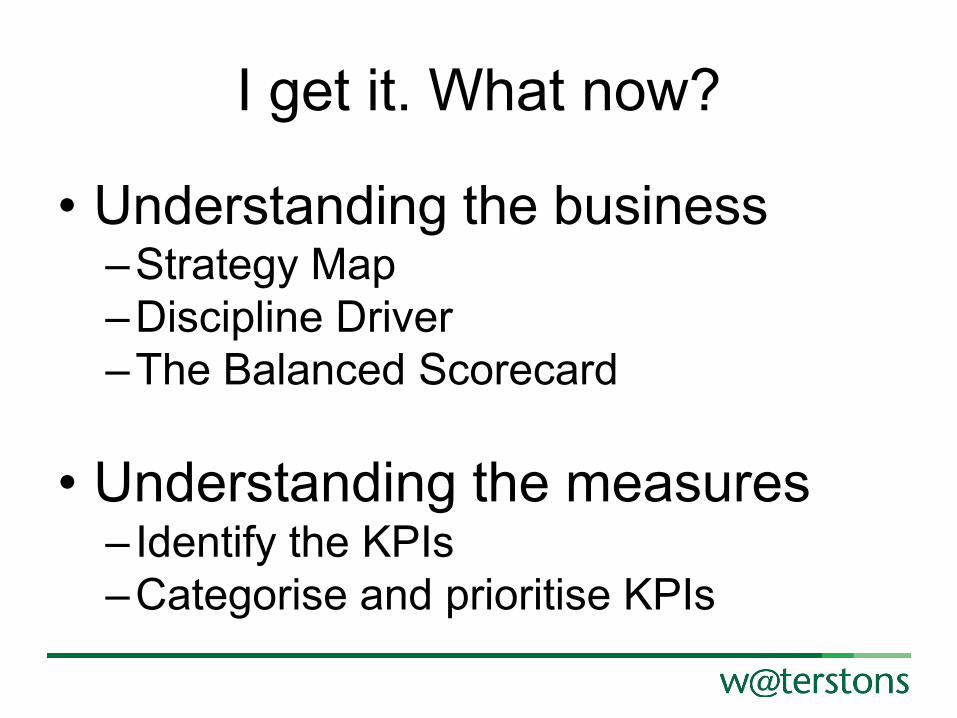
I get it. What now?
• Understanding the business –Strategy Map –Discipline Driver –The Balanced Scorecard
• Understanding the measures
– Identify the KPIs –Categorise and prioritise KPIs
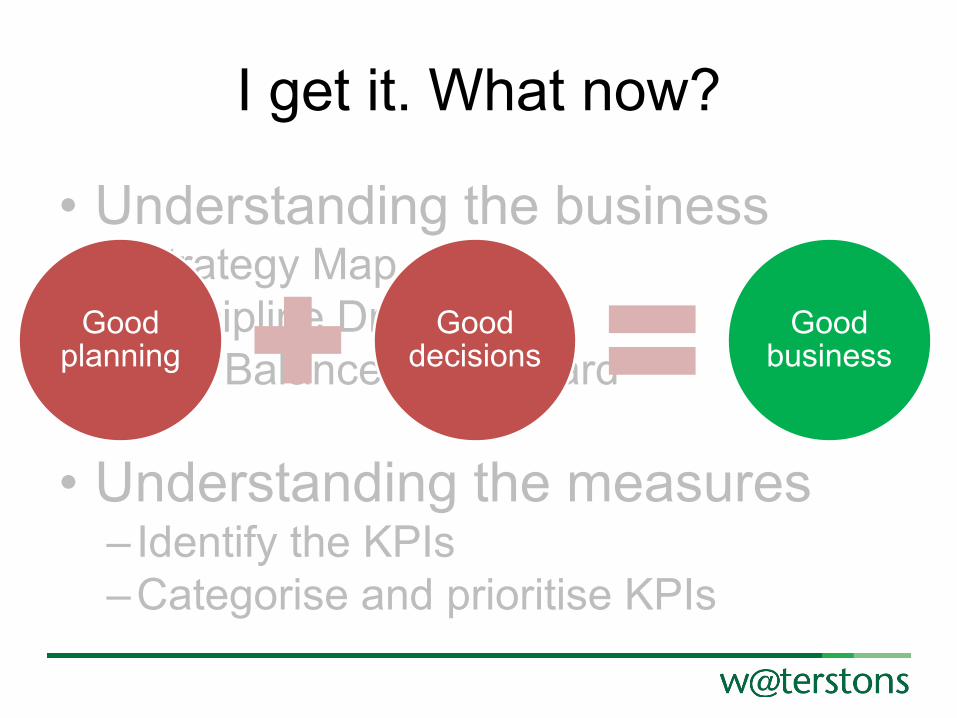
I get it. What now?
• Understanding the business –Strategy Map –Discipline Driver –The Balanced Scorecard
• Understanding the measures
– Identify the KPIs –Categorise and prioritise KPIs
Good planning
Good decisions
Good business

The Honeypot
A Balanced Scorecard drives a business
Planners Make Plans
Managers Manage
Performance
Executives Execute Strategy

Kaplan and Norton Strategy Map and Balanced Score Card


Financial Perspective
Measure Comments
Balance Sheet Value Published in Ratios
EBITDA Easy to calculate
Profit as a % turnover
% Margins by Business Unit Published via MIS
% Revenue growth Published in ratios - Comparison to last year
£ Turnover per head
% Margin per head
£ Constant Overheads Measure against previous year
Debtor Days

Customer Perspective
Measure Comments
Number of active/won customers Drill down to number of new customers & renewable work. Display by turnover buckets & sector & time with Waterstons
Number of customers lost Drill down by sector
Customer retention statistics Drill down by sector
Average Customer Survey score Drill down to different sections: E.g. innovation, responsiveness etc
Number of issues Drill down by division
No of customers contacted each month Drill down by sector
Number of referrals Drill down by sector
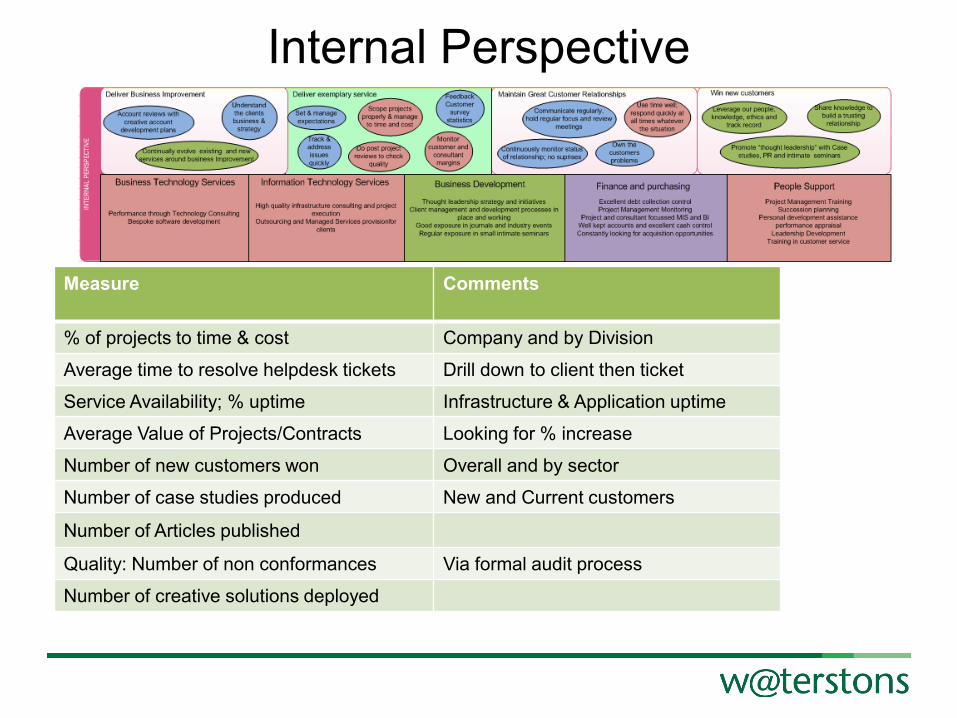
Internal Perspective
Measure Comments
% of projects to time & cost Company and by Division
Average time to resolve helpdesk tickets Drill down to client then ticket
Service Availability; % uptime Infrastructure & Application uptime
Average Value of Projects/Contracts Looking for % increase
Number of new customers won Overall and by sector
Number of case studies produced New and Current customers
Number of Articles published
Quality: Number of non conformances Via formal audit process
Number of creative solutions deployed
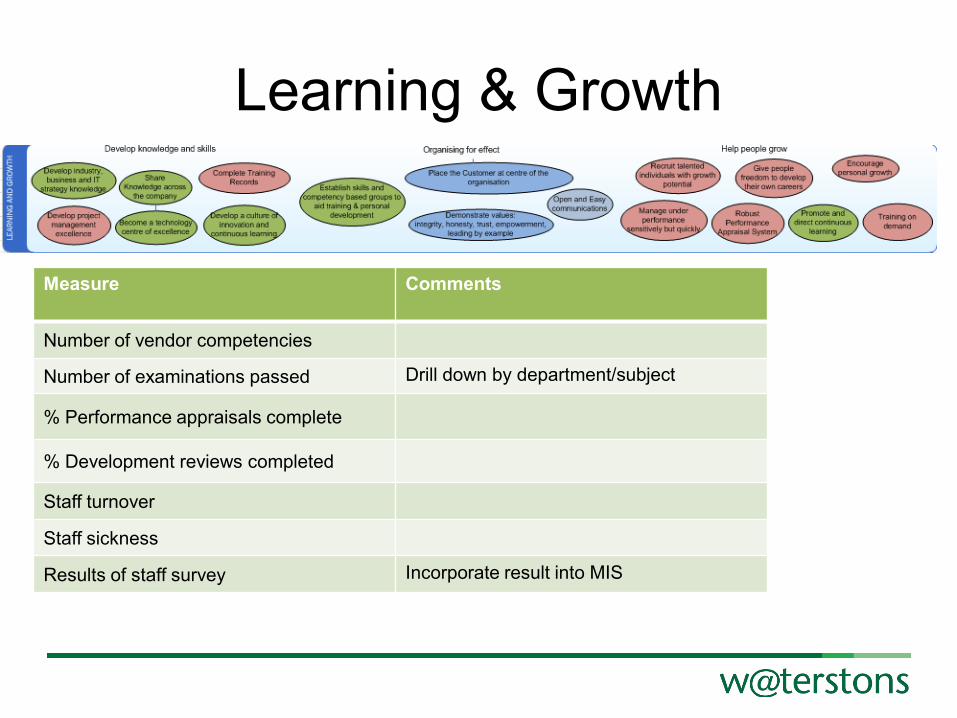
Learning & Growth
Measure Comments
Number of vendor competencies
Number of examinations passed Drill down by department/subject
% Performance appraisals complete
% Development reviews completed
Staff turnover
Staff sickness
Results of staff survey Incorporate result into MIS

BI Approach
BI Approach Strategy
People
Key Performance
Indicators Business Process
Technology
So where does technology fit in?
• At this stage, it doesn’t!
• Understanding your business is never a waste of time
• Good BI doesn’t just happen – There is no ‘one-size’ – Nor is there a ‘typical’ BI solution – It ‘takes as long as it takes’

Come along
Lync: Untangling telephony and unravelling routes
12 noon, Wednesday 18th July, Waterstons’ Euston office
Lync is Microsoft's answer to an enterprise telephony solution
and when coupled with Exchange Unified Messaging provides a highly flexible platform for handling voice communications.
Ben Lee and Nathaniel Hazlett will demonstrate some of the
most common business scenarios and how you can bring a new level of automation and intelligence to handling incoming calls.

Keep in Touch
http://www.linkedin.com/in/danielburrows
http://www.waterstons.com
@WaterstonsLtd